

Abstract
The mechanism of axonal injury in inflammatory brain diseases is still unclear. Increased microglial production of nitric oxide (NO) is a common early sign in neuroinflammatory diseases. We found by fluorescence correlation spectroscopy that synaptophysin tagged with enhanced green fluorescence protein (synaptophysin-EGFP) moves anterogradely in axons of cultured neurons. Activated microglia focally inhibited the axonal movement of synaptophysin-EGFP in a NO synthase-dependent manner. Direct application of a NO donor to neurons resulted in inhibition of axonal transport of synaptophysin-EGFP and synaptotagmin I tagged with EGFP, mediated via phosphorylation of c-jun NH(2)-terminal kinase (JNK). Thus, overt production of reactive NO by activated microglia blocks the axonal transport of synaptic vesicle precursors via phosphorylation of JNK and could cause axonal and synaptic dysfunction.
Keywords: axonal transport, axoplasmic transport, immunity, macrophage, microglia, multiple sclerosis, synaptic
Introduction
Axonal injury and loss of synapses are early signs of various neuroinflammatory diseases. The molecular mechanism of axonal injury in inflammatory brain diseases such as multiple sclerosis is not known. Several studies observed a close association between activated microglial cells and axonal injury in multiple sclerosis (Bitsch et al., 2000; Peterson et al., 2001), microbial infection (Medana et al., 2002), and traumatic brain injury (Gentleman et al., 1993). Microglial cells are highly motile in inflammatory brain diseases. In such diseases they are activated and migrate to sites of neuronal lesions, where they bind and ensheathe naked or demyelinated axons (Peterson et al., 2001). Activated microglia produce substantial amounts of reactive oxygen species such as nitric oxide (NO), primarily to kill invading microorganisms or neoplastically transformed cells. Production and release of NO around axons can promptly and reversibly block axonal electrical conduction (Redford et al., 1997; Smith and Lassmann, 2002). Application of NO donor causes reversible conduction block in both normal and demyelinated axons of the central and peripheral nervous system (Redford et al., 1997). Demyelinated axons were particularly vulnerable to this effect of NO (Redford et al., 1997), indicating that in an inflammatory disease, low NO concentrations would selectively affect the function of demyelinated axons. In neuroinflammatory diseases such as multiple sclerosis, NO has been suggested to be involved in disruption of the blood-brain barrier, oligodendrocyte injury, demyelination, and axonal injury (Smith and Lassmann, 2002).
Detailed histopathological analysis of neuroinflammatory brain diseases revealed that axonal injury appears to be preceded by impairment of the axonal transport system. Particularly, accumulation of β-amyloid precursor protein, a sign of axonal transport impairment, was observed in inflammatory brain diseases, including multiple sclerosis (Ferguson et al., 1997), microbial infections (Medana et al., 2002), and mechanical injury (Gentleman et al., 1993). The particular shape of the axon, with a minimum diameter of ∼0.2 μm and a maximum length up to 1 m, makes the axonal long-distance transport system highly vulnerable to dysfunction and toxic stimuli (Neumann, 2003). Axonal transport is essential to maintain the function, integrity, and viability of neurons (Goldstein, 2003). Large packages have to be transported from the cell body, the site of biosynthesis and preassembly, to their destinations in the axonal terminals and synapses. Synaptic vesicle precursors containing synaptophysin, synaptotagmin I, and vesicle-associated membrane protein 2 (VAMP2) are synthesized and preassembled in the cell body and then transported over long distances to the axonal terminals via kinesin motor proteins (Hirokawa, 1998). Intact fast axonal transport is fundamental for normal function of synapses.
The mechanism by which fast axonal transport is regulated and controlled is essentially unknown. The recent discovery that c-jun NH(2)-terminal kinase (JNK) scaffolding proteins may mediate the association of motor proteins with vesicles suggests that JNK kinase signaling pathways may be intimately linked to the control of kinesin-based movements (Goldstein, 2001, 2003). Particularly, it has been shown in Caenorhabditis elegans that synaptic vesicle precursors are connected to the kinesin motor protein UNC-16, the homolog of kinesin family member 1a (KIF1a), via scaffolding proteins of the c-jun NH(2)-terminal kinase interacting protein-3 (JIP3) family (Byrd et al., 2001). Proteins of the JIP family associate with JNK and JNK kinases, which appear to be responsible for the regulation of vesicle movement (Byrd et al., 2001), suggesting that extracellular signals stimulating the stress-activated protein kinase pathway may modulate axonal movement.
To study whether inflammation impairs axonal transport of synaptic vesicle precursors, we analyzed the movement of synaptophysin and synaptotagmin I tagged with enhanced green fluorescence protein (synaptophysin-EGFP and synaptotagmin-EGFP, respectively) in living cultured hippocampal neurons in response to inflammatory stimuli. We applied fluorescence recovery after photobleaching (FRAP) and single molecule fluorescence correlation spectroscopy (FCS) and found that activated microglia and their inflammatory mediator NO induce breakdown of anterogradely directed axonal synaptic vesicle precursor transport via stimulation of JNK.
Materials and Methods
Hippocampal neuronal cultures. Neuronal cultures were prepared from hippocampi of C57BL/6 mouse embryos (embryonic day 17) as described previously (Neumann et al., 2002). Briefly, hippocampi were isolated, dispersed mechanically, and seeded in biomembrane optical dishes (Helmut Saur, Reutlingen, Germany) or four-well chamber culture dishes (Nunc, Wiesbaden, Germany). The dishes were pretreated with poly-l-ornithine (0.01 mg/ml; Sigma, Deisenhofen, Germany) and laminin (10 μg/ml; Sigma). The cells were cultured in neuronal culture medium (BME; Invitrogen) supplemented with 2% B-27 supplement (Invitrogen), 1% glucose (45% glucose; Sigma), and 1% FCS (PAN Biotech, Aidenbach, Germany). Neurons were cultured for 5-10 d before use in experiments to obtain morphologically mature neurons. Hippocampal neuronal cultures were analyzed by whole-cell patch-clamp electrophysiology. On average, 77% of neurons showed secondary spontaneous irregular firing with evoked EPSPs or EPSCs, 10% showed primary spontaneous regular firing, and 13% were silent during a recording period of 30 sec.
Neurons were treated with a short-term NO donor [diethylamine-NONOate (DEA/NONOate); Alexis Corporation]. To determine a nontoxic concentration of the NO donor, neuronal cultures were treated with distinct concentrations of DEA/NONOate, and neuronal survival was analyzed after 24 hr. Cells were fixed by 4% paraformaldehyde and immunolabeled with specific antibodies directed against β-tubulin III (1:200; Chemicon, Temecula, CA) followed by secondary fluorochrome Cy3-conjugated goat antibody directed against mouse IgG (1:200; Dianova, Hamburg, Germany). The number of cells expressing β-tubulin III was quantified under the immunofluorescence microscope. In all subsequent experiments, neurons were treated with the short-term NO donor DEA/NONOate at a concentration of 300 μm. Endogenous release of NO by neuronal NO synthase (NOS) was below the detection limit (<2.5 μm nitrite) as determined in a supernatant of neuronal cultures by the Griess Reagent System (Promega, Madison, WI). Cells were treated with cGMP (0.2 mm 8-bromo-cGMP; Sigma) or the NO synthase inhibitor aminoguanidine (2 mm; Sigma). Neurons were pretreated for 30-40 min with the JNK inhibitor (100 nm JNK Inhibitor II; Calbiochem, La Jolla, CA).
Transfection of neurons with EGFP, synaptophysin-EGFP, or synaptotagmin-EGFP. Transfection of neurons was performed with a plasmid expressing EGFP alone, synaptophysin (rat synaptophysin p38) tagged with EGFP at the C terminus under control of the human synapsin I promoter as described previously (Iliev et al., 2004), or synaptotagmin I (mouse synaptotagmin I p65) tagged with EGFP at the C terminus under control of the human synapsin I promoter. The plasmid synapsin promoter EGFP [p(synapsin).EGFP] was kindly provided by Dr. S. Kügler (Department of Neurology, University of Göttingen) (Kugler et al., 2003), and cytomegalovirus (CMV) promoter synaptophysin/p38-EGFP [p(CMV). synaptophysin/p38-EGFP] was kindly provided by Dr. C. Dotti and Dr. C. Kaether (European Molecular Biology Laboratory, Heidelberg, Germany) (Kaether et al., 2000). Both genes were subcloned to get the p(synapsin).synaptophysin-EGFP plasmid. In detail, EGFP was removed from the p(synapsin).EGFP plasmid by NotI/NheI restriction digestion. Synaptophysin-EGFP was cut by NotI/NheI restriction digestion and subcloned in the p(synapsin)-vector backbone.
To obtain the synaptotagmin-EGFP plasmid, the mouse synaptotagmin I/p65 DNA (from clone ID:IRAKp961J0753Q2; Deutsches Ressourcenzentrum für Genomforschung, RZPD, Berlin, Germany) was amplified and cloned by Nhe/BamHI restriction digestion into the synapsin I promoter plasmid provided by Dr. S. Kügler (Department of Neurology, University of Göttingen) (Kugler et al., 2003). The subclonings and the correct sequences were verified by direct sequencing (Seqlab, Göttingen, Germany). The plasmids were purified using the EndoFree Maxi Kit (Qiagen, Hilden, Germany). Transfection was performed during seeding of the neuronal cells by the Effectene Transfection kit (Qiagen). In detail, the cells were incubated for 30 min with 0.5 μg of plasmid DNA per 1 × 10⁶ cells, 4 μl of enhancer, 10 μl of Effectene, and 85 μl of buffer. After transfection, cells were washed in PBS and suspended in neuronal culture medium. The average transfection efficiency was ∼0.1-0.5%, and the majority of transfected neurons showed plasmid expression from day 3-5 until day 14.
Immunohistochemistry for tau and VAMP2. Hippocampal neurons transfected with synaptophysin-EGFP or synaptotagmin-EGFP were cultured for 1 week, fixed with 4% paraformaldehyde, permeabilized with 0.1% Triton X-100, and incubated with a mouse monoclonal antibody specific for tau microtubule-associated protein (tau-1, 1:200, clone PC1C6; Chemicon), followed by secondary fluorochrome Cy3-conjugated goat antibody directed against mouse IgG (1:200; Dianova). Alternatively, fixed neurons were labeled with mouse monoclonal antibody specific for synaptobrevin/VAMP2 directly conjugated with Oyster 556 (1:200, IgG1; Synaptic Systems). Optical sections along the z-axis were scanned with a confocal laser-scanning microscope (Leica, Nussloch, Germany) equipped with a 63× oil objective.
Microglial cultures. Microglial cells were prepared from the hippocampal region of postnatal day 5 C57BL/6 mice as described previously (Neumann et al., 1998). Briefly, meninges were removed mechanically, and the cells were cultured in basal medium (BME; Invitrogen), 10% FCS (PAN Biotech), 1% glucose, and 1% l-glutamine for 25-30 d to form a confluent cell monolayer. To collect microglial cells the cultures were shaken on a rotary shaker (220 rpm) for 2 hr. The detached microglial cells were cultured in normal culture dishes for 1 hr, and nonadherent cells were removed. Purity of the isolated microglia was confirmed by flow cytometry analysis, for which cells were incubated for 1 hr on ice with anti-CD11b/CD18 biotinylated antibody (1:100; BD Biosciences, Franklin Lake, NJ) or negative isotype control antibody (PharMingen) and thereafter with streptavidin-FITC (1:100; Dianova). Analysis was done with a FACScalibur flow cytometer (BD Biosciences). Live gating was performed with propidium iodide (Sigma), and the percentage of CD11b/CD18 cells was determined according to the isotype control.
Microglial cells were cytokine stimulated by combined treatment with interferon-γ (recombinant murine IFN-γ, 100 U/ml; HyCult Biotechnology, Amsterdam, The Netherlands) and interleukin-1β (murine IL-1β, 10 ng/ml; Roche Molecular Biochemicals) for 72 hr. Microglial cells were pretreated for 60 min with the NOS inhibitor aminoguanidine (2 mm; Sigma). For coculture experiments, microglial cells were labeled with CellTracker according the manufacturer's instructions [CellTracker orange, 5 (and 6)-(((4-chloromethyl)benzoyl)amino)tetramethyl rhodamine; Molecular Probes, Leiden, The Netherlands] and added in a fixed ratio of 1:2 (microglia/neurons) to the neuronal cultures. Neurons of cocultures were analyzed ∼30 min after addition of microglia.
In vivo imaging and FRAP analysis. FRAP was performed using Leica TCS laser scanning confocal microscopy (Leica) with a 20× objective as described with some modifications (Axelrod et al., 1976). The medium of the neuronal cultures was removed and substituted with image buffer containing (in mm): 142 NaCl, 5.4 KCl, 1.8 CaCl2, 1 NaH2PO4, 25 HEPES, 5 glucose, 0.8 MgSO4 in ddH2O, pH 7.4. The neurons were kept in the image buffer not longer than 60 min. The cell culture dishes were placed on a heated stage in a heated chamber on the confocal microscope (Leica LSC) and kept at 35-37°C during the analysis with the help of a culture-heating system. Bleaching was performed with 100% laser power and zoom area 32× within 20 scanning frames of a 20 × 20 μm area along a synaptophysin-EGFP or EGFP-transduced axon. In all experiments bleaching was >90% assuming a Gaussian distribution of remaining EGFP molecules. One segment of 20 μm in length was bleached approximately in the middle of the axon per transfected neuron. In coculture experiments between microglia and neurons, two segments (one area within a distance of 50 μm to the microglia; one area with a distance >50 μm proximal or distal to the microglia) were bleached sequentially per transfected neuron. For postbleaching in vivo imaging, the laser power was turned to minimum and reduced further to 20% according to the software control panel to avoid photobleaching and phototoxicity. Photobleaching with this reduced laser power was <1%. Samples of the 20 × 20 μm bleached area were imaged every 10-60 sec over 10-15 min after photobleaching. In coculture experiments between microglia and neurons, an area of ∼200 × 200 μm was scanned over time. Collected data were fitted to the following equation: F(t) = span (1 - e-kt) + bottom). The bottom was defined as the intensity of the first image after photobleaching. The span was defined as the difference between the final fluorescence intensity and the bottom. The half-time value t1/2 was calculated accordingly. The t1/2 and k values show the velocity of the movement and are linked by the following equation: t1/2 = ln(2)/k. The final fluorescence intensity F(∞) was less then the prebleaching fluorescence intensity because a proportion of the fluorescence molecules were not mobile. The mobile fraction was defined as the span of the fluorescence recovery after photobleaching. All data were normalized in respect to the intensity of the bottom (value = 0) and the prebleaching intensities (value = 1), resulting in a relative FRAP.
Immunohistochemistry of phosphorylated JNK. Hippocampal neurons cultured for 1 week were fixed with 4% paraformaldehyde, incubated with a mouse monoclonal antibody specific for phosphorylated JNK (2 μg/ml; Santa Cruz Biotechnology, Santa Cruz, CA), followed by secondary fluorochrome Cy3-conjugated goat antibody directed against mouse IgG (2 μg/ml; Dianova). Subsequently, after washing, cells were incubated with an axon-specific mouse monoclonal antibody directed against tau (tau-1, 1:200, PC1C6; Chemicon) and secondary dichlorotriazinyl aminofluorescein-conjugated goat antibody directed against mouse IgG (2 μg/ml; Dianova). Optical sections along the z-axis were scanned with a confocal laser-scanning microscope (Leica) equipped with a 63× oil objective. Baseline labeling was determined with mouse control antibodies and secondary fluorochrome Cy-3-conjugated goat antibodies directed against mouse IgG.
The percentage of axons labeled for phosphorylated JNK was quantified by counting positive axons under the fluorescence microscope. Axons were identified by double-labeling with antibodies directed against tau.
In vivo imaging and FCS analysis. FCS analysis of fluctuating fluorescence signals, emitted by dye molecules passing a tiny detection volume of ∼2 fl, allows the determination of mobility coefficients as well as local concentrations with high spatial resolution. Because of spectral filtering of the signal, scattering and Raman light are suppressed, and a high signal-to-noise ratio is obtained even in cellular systems (Dittrich et al., 2001; Schwille, 2001).
The auto- and cross-correlation measurements were performed with a modified confocal microscopy setup. The blue line (λ = 488 nm) of an Ar-Ion laser (Lasos, Jena, Germany) passed two polarizing beam-splitter cubes to create two parallel but slightly shifted laser beams. For dual-beam fluorescence correlation spectroscopy, the axon of a transfected neuron was placed along two laser spots, whereas for autocorrelation analysis, one laser beam was blocked. For equalizing the intensity of both laser beams, a λ/2 waveplate was inserted in front of the first beam splitter. The beams were reflected by a dichroic mirror (495 dichroic long pass; AHF, Tübingen, Germany) into an inverted microscope (Olympus IX 70; Olympus Optical, Tokyo, Japan) and focused by an objective (Olympus; UPlanApo 60×, numerical aperture 1.2) creating two excitation spots. The emitted fluorescence light was collected by the same objective, passed a bandpass filter to reduce Rayleigh and Raman scattering light (535DF45), and imaged onto the entrance slit of a fiber bundle that consisted of two glass fiber cables with a distance of 200 μm connected to separate detectors (avalanche photodiodes, single-photon counting module CD3017; EG&G, Bad Wildbad, Germany). The objective with 60× magnification in combination with the fiber cables results in a focus distance of 3.3 μm. Data acquisition was performed using the dual cross-correlation mode of the correlator card (ALV, Langen, Germany). Calculations and fitting procedures of the data were performed with Microcal Origin software. Calibration of the optical setup was done with a 10 nm rhodamine green solution. The size of the cylindrical-like detection volumes was determined as 0.8 μm in the transversal direction and 4.0 μm in the axial direction.
The medium of the cells was replaced by the imaging buffer as described for the FRAP analysis. The cells were placed on stage heated to 35-37°C. Low laser power intensity was used to avoid photobleaching, which could be detected by an increase in the offset of the cross-correlation curves. The laser light intensity was typically 1-10 kW/cm2. Measurements showing a significant change in the offset of the cross-correlation curves were regarded as signs of photobleaching and eliminated from the analysis. The measuring times varied between 10 and 300 sec. Because the peak amplitude was approximately proportional to the number of particles detected successively in both spots, only curves with fairly large peak amplitude (> 0.005) were analyzed. Smaller amplitudes are most likely caused by strong background signals, e.g., if the neurons have grown densely, or by incorrect positioning of the axons.
Cross-correlation analysis was performed by subtracting the forward and backward correlation curves [G1,2(τ) and G2,1(τ)]. The “pure” cross-correlation curve was analyzed using the following expression (Eq. 1):
 |
1 |
with τd = diffusion time, τf,cc = flow time, n = number of fluorescent particles detected in both detection channels, R = distance of both focused spots (R = 3.3 μm), ω0 and z0 = radius in transversal and axial direction of the detection volumes, and α = angle between the main flow direction and connecting vector of the light spots; if the axon is properly aligned to both focused spots, α = 0°.
The cross-correlation curve exhibited a maximum for the flow time τf,cc, which corresponds to the time that the fluorescent particles need to travel the distance between the centers of both focused spots. Thus, the flow velocity can be calculated using the following expression (Eq. 2):
 |
2 |
Because the movement of fluorescent particles in the perpendicular (x/y) direction was slow compared with the general movement in the z direction, the diffusion term in Equation 1 was neglected (τd → ∞), and it was assumed that the flow time τf,cc directly matched with the maximum of the correlation curve splitting. Thus, for calculation of the velocity, any kind of diffusion contributing to the movement was neglected.
Statistical analysis. Data of FRAP were analyzed by MatLab/Mathwork software, GraphPad Prism software (GraphPad Software) and Excel Software (Microsoft). Software Origin (Microcal) was used for analysis of autocorrelation and cross-correlation data. Values for each parameter are expressed as mean ± SD. Statistical analysis of FRAP was performed using two-tailed t test between the groups. Statistical analysis of cross-correlation data was performed using the χ2 test/Fisher's exact test between the groups.
Results
Cytokine-stimulated microglia inhibit axonal movement of synaptophysin
Transfected synaptophysin has been shown to be integrated as a membrane molecule in synaptic vesicle precursors of cultured neurons (Kaether et al., 2000). To analyze the axonal transport of synaptophysin, we transfected cultured murine hippocampal neurons with synaptophysin-EGFP under control of the synapsin I promoter. The neurons were used for experiments at days 5-14 in culture, when the synaptophysin-EGFP signal was localized mainly in the axons and few proximal dendrites (Fig. 1a,b). Axonal localization of synaptophysin-EGFP was demonstrated by costaining with antibodies directed against the axonal cytoskeletal protein tau (Fig. 1a). Furthermore, immunohistochemistry with antibodies directed against the synaptic vesicle protein VAMP2 showed direct colocalization of synaptophysin-EGFP and VAMP2 inside the axonal vesicle precursors (Fig. 1b). After three-dimensional reconstruction of confocal optical sections along the z-axis of fixed synaptophysin-EGFP transfected neurons, small vesicle-like structures were detected in axons (see supplemental Fig. 1, available at www.jneurosci.org as supplemental material). Time-lapse confocal laser scanning microscopy of synaptophysin-EGFP in living neurons demonstrated that individual small vesicle-like structures were moving along the axon; however, the movements could not be followed sufficiently over long distances and separated from the immobile synaptophysin-EGFP structures. To measure the axonal motility of synaptophysin-EGFP, we applied the FRAP technique, which is widely used to determine the movement of fluorescent molecules in living cells. First, neurons were transfected with EGFP alone, which has been shown to diffuse freely within the cytoplasm. A 20-μm-long segment of the axon was bleached. Within 1-2 sec the bleached axonal segment was completely refilled by EGFP, confirming rapid and free diffusion of EGFP. Next, neurons were transfected with synaptophysin-EGFP. Fluorescence recovery after photobleaching of the synaptophysin-EGFP signal was relatively slow and lasted >600 sec (Fig. 1c,d). The synaptophysin-EGFP filled up the bleached axon preferentially from the proximal side, indicating that synaptophysin-EGFP was transported mainly anterogradely. The movement of synaptophysin-EGFP is dependent on the mobile fraction of synaptophysin-EGFP and the half-time value t1/2 of the fluorescence recovery curve, which is inversely proportional to the velocity of the synaptophysin-EGFP (Fig. 1d).
Figure 1.
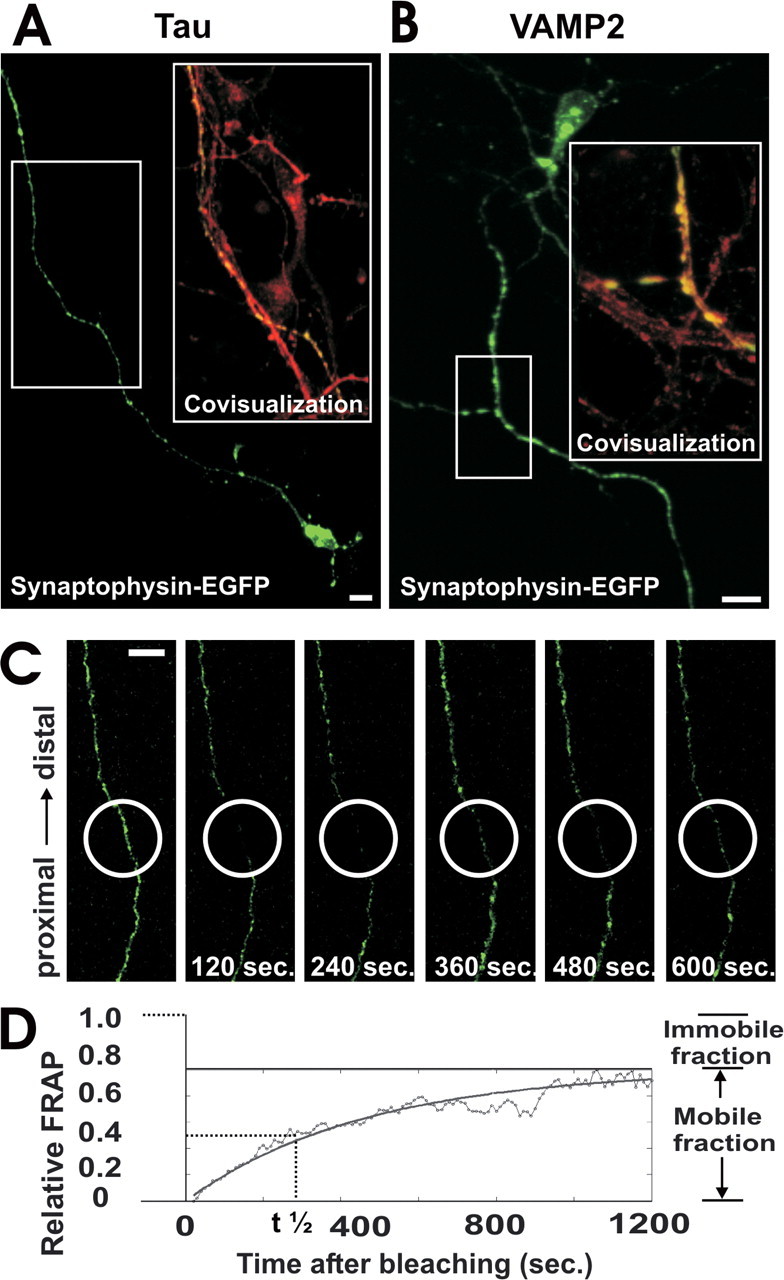
Axonal expression and FRAP analysis of synaptophysin-EGFP. a, Neuron transfected with synaptophysin-EGFP (green) and immunolabeled with antibodies directed against tau (red). Synaptophysin-EGFP is localized in the axon. Area selected for inset as indicated. Scale bar, 10 μm. b, Neuron transfected with synaptophysin-EGFP (green) and immunolabeled with an antibody directed against VAMP2 (red). Colocalization between synaptophysin-EGFP and VAMP2 demonstrates expression of synaptophysin-EGFP in synaptic vesicle precursors. Area selected for inset as indicated. Scale bar, 10 μm. c, FRAP of an axon from a synaptophysin-EGFP-transfected neuron. The bleached area of 20 μm in length (white circle) was scanned by confocal microscopy over time, and fluorescence recovery intensity was determined. Selected images before bleaching and 120, 240, 360, 480, and 600 sec after bleaching are shown. Scale bar, 10 μm. d, Relative FRAP intensity of synaptophysin-EGFP in an axon that was time-lapse scanned over 1200 sec. Individual values of each 10 sec and the curve of the equation are shown.
We asked whether microglial cells stimulated to release inflammatory mediators might affect the axonal transport of synaptophysin. Microglial cells were isolated from mixed glial cultures derived from postnatal mouse brain tissue. Flow cytometry analysis revealed that 96.1% (±7% SD) of isolated cells expressed the microglial marker CD11b/CD18 on the cell surface. Microglial cells were stimulated by combined treatment with the proinflammatory cytokines IFN-γ (100 U/ml) and IL-1β (10 ng/ml) for 72 hr. Treatment of microglial cells with these cytokines induced gene transcription of inducible NOS (see supplementary Fig. 2, available at www.jneurosci.org as supplemental material). Furthermore, NO was released in substantial amounts by microglial cells after 72 hr of cytokine prestimulation (see supplementary Fig. 2, available at www.jneurosci.org as supplemental material). The cytokine-stimulated microglial cells were labeled with a vital red fluorescence dye and added to cultured neurons transfected with synaptopyhsin-EGFP. The microglial cells appeared to bind to axons within a few minutes. Axonal motility of synaptophysin-EGFP was analyzed simultaneously by FRAP in the axons neighboring the microglial cells. Although the fluorescence signal recovered almost completely within 600 sec in normal neurons, no recovery of synaptophysin-EGFP was observed in axons closely associated with a microglial cell (Fig. 2a,b). The transmission light images indicated that the microglial cells did not change the morphology of the axon (Fig. 2b). To quantify the FRAP, the measured fluorescence intensity was normalized in relation to the prebleaching and postbleaching signals. The FRAP measurement did not impair the viability of the axon or neuron as determined by reanalyzing the axons of the same synaptophysin-EGFP-transfected neurons after 24 hr (see supplemental Table 1, available at www.jneurosci.org as supplemental material). Furthermore, intact immunostaining for neurofilament and tau was detected in the bleached area, suggesting that photobleaching of synaptophysin-EGFP does not injure the axonal cytoskeleton (see supplementary Fig. 3, available at www.jneurosci.org as supplemental material); however, prestimulated microglia affected the FRAP signals of neighboring axons. A decrease in the normalized relative FRAP was observed 300 sec after bleaching close to the point of contact of microglia to 0.32 ± 0.041 (mean ± SD), whereas axons in the absence of microglia showed a fluorescence recovery of 0.45 ± 0.068 at 300 sec (Fig. 2c). Furthermore, FRAP >50 μm distant from the microglial contact point was not decreased (0.48 ± 0.034) and was similar to axons in the absence of microglia (Fig. 2c). Because cytokine-stimulated microglia produce and release substantial amounts of NO, which is diffusible and locally affects axons, we blocked inducible NO synthase with 2 mm aminoguanidine. Blockade of NO synthase by pretreatment of microglia with aminoguanidine reversed the inhibitory effect of nearby microglia on axonal motility (Fig. 2d).
Figure 2.
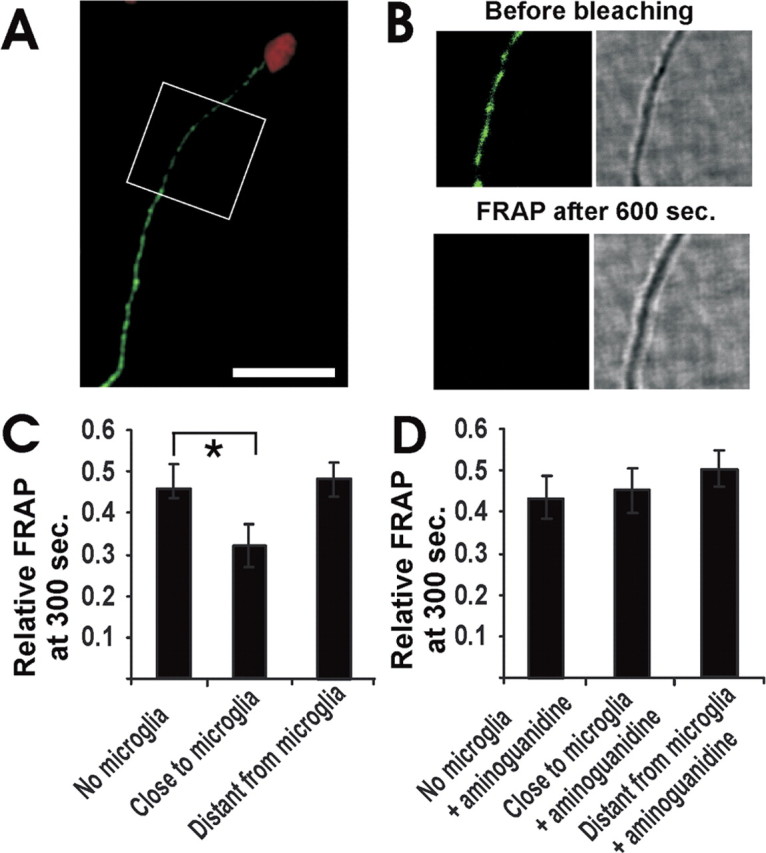
Impaired axonal movement of synaptophysin-EGFP near cytokine-stimulated microglia. a, Cultured hippocampal neurons were transfected with synaptophysin-EGFP. Axon of a neurontransfected with synaptophysin-EGFP (green) and challenged with cytokine-stimulated microglia (red) is shown. Area of FRAP analysis as indicated. Scale bar, 20 μm. b, Fluorescence and transmission images from an axon of a neuron transfected with synaptophysin-EGFP (green) and challenged with a cytokine-stimulated microglia (see area of FRAP analysis in A). Fluorescence and transmission images before bleaching and 600 sec after bleaching are shown. Total size of images: 20 × 20 μm. c, Relative FRAP at 300 sec of axonal segments close to or distant from (>50 μm distance) microglia prestimulated by the cytokines IFN-γ (100 U/ml) and IL-1β (10 ng/ml) for 72 hr. Data are presented as mean ± SD. For each experimental condition, n > 3. *p < 0.01. d, Relative FRAP at 300 sec of axonal segments close to or distant from (>50 μm distance) a cytokine-stimulated microglial cell. The microglia or the neurons were pretreated with the NO synthase inhibitor aminoguanidine (2 mm). Data are presented as mean ± SD. For each experimental condition, n > 3.
Nitric oxide inhibits axonal movement of synaptophysin
To mimic the effect of reactive NO released by microglia, we added a short-term pure NO donor (DEA/NONOate) to the cultured neurons and measured the recovery of the fluorescence signal after photobleaching of synaptophysin-EGFP. DEA/NONOate is known to release reactive NO within a few minutes (half-life of 2.1 min) under the performed analysis conditions (at 35°C in aqueous solution at physiological pH) (Maragos et al., 1991). Because NO can act cytotoxically on neurons at higher concentrations, we first determined a nontoxic concentration of the NO donor. Neuronal cultures were treated with distinct concentrations of DEA/NONOate, and neuronal survival was analyzed after 24 hr (see supplemental Table 2, available at www.jneurosci.org as supplemental material). No toxicity was observed up to concentrations of 500 μm, whereas neuronal survival was slightly impaired at 600 μm and significantly reduced at 1000 μm DEA/NONOate. Therefore, we decided to use 300 μm DEA/NONOate in all subsequent experiments. Treatment of neurons with 300 μm DEA/NONOate for 5-10 min resulted in a significant reduction in axonal transport of synaptophysin-EGFP as determined by FRAP (Fig. 3a). The relative FRAP intensity at 300 sec was significantly reduced from 0.46 ± 0.16 (mean ± SD) to 0.19 ± 0.08 after 5-10 min treatment with 300 μm DEA/NONOate (Fig. 3a). The half-time value t1/2 of the FRAP, which is inversely proportional to the velocity of synaptophysin-EGFP, was unchanged at 5-10 min after NO donor treatment and only slightly increased after 30 min of NO donor treatment (Fig. 3b). After 120 min treatment with 300 μm DEA/NONOate, the value returned back to levels comparable with untreated neurons. Detailed analysis of the FRAP equations demonstrated that there was a significant decrease in the mobile fraction of synaptophysin-EGFP after treatment with NO, indicating that NO reduced the percentage of synaptophysin-EGFP transported along the axon. The mobile fraction of synaptophysin-EGFP decreased from 0.65 ± 0.18 (mean ± SD) to 0.29 ± 0.07 after 5-10 min treatment with 300 μm DEA/NONOate (Fig. 3c).
Figure 3.
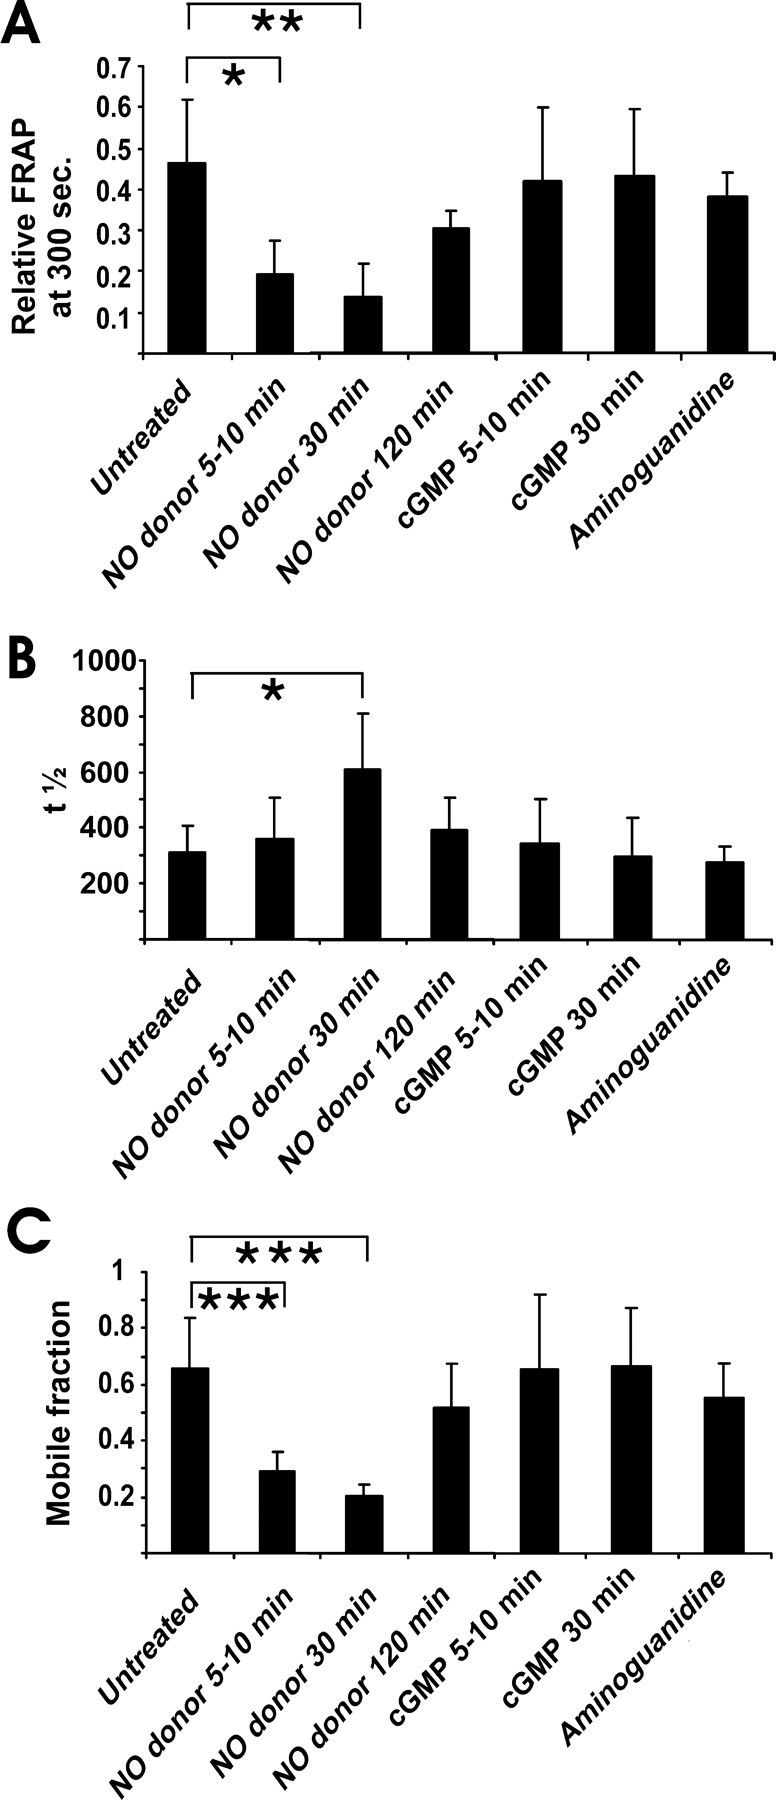
Impaired axonal movement of synaptophysin-EGFP after NO donor application. a, Relative FRAP at 300 sec in axons of neurons transfected with synaptophysin-EGFP and treated with NO donor (300 μm DEA/NONOate). NO donor treatment reduced the axonal transport of synaptophysin-EGFP. Synaptophysin-EGFP transport was not modulated by cGMP (0.2 mm 8-bromo-cGMP) or aminoguanidine (2.5 mm) treatment. Data are presented as mean ± SD. For each experimental condition, n > 5. *p < 0.05; **p < 0.005. b, Half-time value (t1/2) of FRAP in axons of neurons transfected with synaptophysin-EGFP. The increase in t1/2 after 30 min of NO donor treatment indicates a decrease in the velocity of synaptophysin-EGFP movement. Data are presented as mean ± SD. For each experimental condition, n > 5. *p < 0.05. c, Mobile fraction in axons of neurons transfected with synaptophysin-EGFP. NO donor treatment significantly reduced the percentage of synaptophysin-EGFP moving along the axons. Data are presented as mean ± SD. For each experimental condition, n > 5. ***p < 0.001.
Two major routes of NO signaling in neurons are known: the cGMP signaling pathway and S-nitrosylation of proteins (Ahern et al., 2002). To analyze whether stimulation of cGMP might modulate motility of synaptophysin-EGFP, we treated neurons with 8-bromo-cGMP, a membrane-permeant analog of cGMP. Treatment with cGMP (0.2 mm 8-bromo-cGMP) for 5-10 or 30 min did not modulate axonal motility of synaptophysin-EGFP (Fig. 3a). Furthermore, blocking endogenous neuronal NOS with high concentrations of the inhibitor aminoguanidine (2.5 mm) for 6 hr did not affect axonal transport of synaptophysin-EGFP (Fig. 3a).
Inhibition of axonal transport of synaptophysin via JNK
Nitric oxide has been shown to positively stimulate JNK in endothelial cells (Go et al., 1999), cardiomyocytes (Taimor et al., 2001), and neuroblastoma cells (Li et al., 2004). Furthermore, it has been suggested that JNK is a possible modulator of kinesin-mediated axonal transport (Goldstein, 2001, 2003). Phosphorylation of JNK in axons was studied in untreated and NO donor-treated cultures. Immunolabeling of the phosphorylated form of JNK was performed with a specific monoclonal antibody. Although untreated neurons identified by double-labeling with antibodies directed against the axonal protein tau (tau-1) showed no or very low punctate fluorescence signals for phosphorylated JNK (Fig. 4a), neurons treated for 5 min with 300 μm DEA/NONOate showed intense labeling of axons (Fig. 4b). In detail, 92% of axons identified by colabeling of tau demonstrated staining of phosphorylated JNK at 5 min after NO donor treatment, whereas only 13% of axons in untreated cultures showed immunolabeling for phosphorylated JNK (Fig. 4c).
Figure 4.

Immunohistochemistry of phosphorylated JNK in cultured hippocampal neurons. a, Neurons were identified by antibodies directed against the axonal marker protein tau (green). Only rare punctate staining of phosphorylated JNK (red) was detected in untreated neurons. Scale bar, 10 μm. b, Phosphorylated JNK (red) was observed in most tau (green)-positive axons after treatment of the cultures with 300 μm DEA/NONOate for 5 min. Area selected for inset as indicated. Scale bar, 10 μm. c, Percentage of axons identified by immunolabeling with antibodies directed against tau that show double-labeling for phosphorylated JNK. Neurons are either untreated or treated with 300 μm DEA/NONOate for 5, 10, or 15 min. Data are presented as mean ± SEM. **p < 0.005.
Phosphorylation of all three JNK family members (JNK-1, JNK-2, and JNK-3) was blocked with JNK Inhibitor II (100 nm) in neuronal cultures. Interestingly, pretreatment of neurons with the JNK inhibitor neutralized the effect of NO donor on axonal transport of synaptophysin-EGFP. Although the relative FRAP at 300 sec was reduced from 0.46 ± 0.16 (mean ± SD) to 0.19 ± 0.08 after 5-10 min treatment with 300 μm DEA/NONOate, it reverted to normal levels (0.35 ± 0.07) after additional blocking of JNK (Fig. 5a). Treatment with the JNK inhibitor also prevented the effect on axonal transport at 30 min after NO donor treatment (Fig. 5a). Treatment with the JNK inhibitor alone did not significantly modulate the motility of synaptophysin-EGFP (Fig. 5).
Figure 5.

Impaired axonal movement of synaptophysin-EGFP after NO donor application depends on JNK phosphorylation. a, Relative FRAP at 300 sec in axons of neurons transfected with synaptophysin-EGFP and treated with NO donor (300 μm DEA/NONOate). NO donor treatment reduced the axonal transport of synaptophysin-EGFP. Additional pretreatment with the JNK inhibitor (100 nm JNK inhibitor II) reverted the inhibitory effect of the NO donor on axonal motility. Data are presented as mean ± SD. For each experimental condition, n > 5. *p < 0.05; **p < 0.005. b, Half-time value (t1/2) of FRAP in axons of neurons transfected with synaptophysin-EGFP. The increase in t1/2 after 30 min of NO donor treatment indicates a decrease in the velocity of synaptophysin-EGFP movement. Data are presented as mean ± SD. For each experimental condition, n > 5. *p < 0.01. c, Mobile fraction of FRAP in axons of neurons transfected with synaptophysin-EGFP. NO donor treatment significantly reduced the percentage of synaptophysin-EGFP moving along the axons. Additional pretreatment with the JNK inhibitor (100 nm JNK inhibitor II) reverted the inhibitory effect of the NO donor on the mobile fraction. Data are presented as mean ± SD. For each experimental condition, n > 5. *p < 0.01; **p < 0.005.
Nitric oxide inhibits axonal movement of synaptotagmin I via JNK
If NO inhibits axonal transport of synaptic vesicle precursors, it should inhibit axonal transport of other synaptic proteins such as synaptotagmin I in a similar manner. Again, the synapsin I promoter was used to express synaptotagmin-EGFP in primary neurons. Hippocampal neurons transfected with synaptotagmin-EGFP were cultured for 5-14 d. First, localization of synaptotagmin-EGFP in neurons was studied by immunohistochemistry. Synaptotagmin-EGFP was localized predominantly in axons and detected in vesicular structures double-labeled with antibodies directed against VAMP2 (Fig. 6a). Next, time lapse imaging of living and transfected neurons was performed. Recovery of the fluorescence signal after photobleaching by FRAP analysis demonstrated that synaptotagmin moved mainly anterogradely. Application of 300 μm DEA/NONOate for 5-10 min resulted in a significant reduction in axonal motility of synaptotagmin-EGFP as determined by the relative FRAP (Fig. 6b). The pretreatment of neurons with the JNK inhibitor completely neutralized the inhibitory effect of the NO donor on axonal motility of synaptotagmin-EGFP. The half-time value t1/2 of the FRAP analysis, which is inversely proportional to the velocity of synaptotagmin-EGFP, was unchanged at 5-10 min after NO donor treatment or JNK inhibitor application (Fig. 6c). Analysis of the FRAP equations showed that NO strongly affected the mobile fraction. Treatment with the NO donor (300 μm DEA/NONOate for 5-10 min) significantly reduced the mobile fraction, which was neutralized by additional application of the JNK inhibitor (Fig. 6d). Treatment with the JNK inhibitor alone did not affect the mobile fraction of synaptotagmin-EGFP (Fig. 6d).
Figure 6.

Impaired axonal movement of synaptotagmin-EGFP after NO donor application. a, Neuron transfected with synaptotagmin-EGFP (green) and immunolabeled with antibodies directed against VAMP2 (red). Colocalization between synaptotagmin-EGFP and VAMP2 indicates expression of synaptotagmin-EGFP in synaptic vesicle precursors. Area selected for inset as indicated. Scale bar, 10 μm. b, Relative FRAP at 300 sec in axons of neurons transfected with synaptotagmin-EGFP and treated with NO donor (300 μm DEA/NONOate). NO donor treatment reduced the axonal transport of synaptotagmin-EGFP. Additional pretreatment with the JNK inhibitor (100 nm JNK inhibitor II) reverted the inhibitory effect of the NO donor on axonal transport. Data are presented as mean ± SD. For each experimental condition, n > 4. *p < 0.05; **p < 0.005. c, Half-time value (t1/2) of FRAP in axons of neurons transfected with synaptotagmin-EGFP. Data are presented as mean ± SD. For each experimental condition, n > 4. d, Mobile fraction of FRAP in axons of neurons transfected with synaptotagmin-EGFP. NO donor treatment significantly reduced the percentage of synaptotagmin-EGFP moving along the axons. Additional pretreatment with the JNK inhibitor (100 nm JNK inhibitor II) reverted the inhibitory effect of the NO donor on the mobile fraction. Data are presented as mean ± SD. For each experimental condition, n > 4. *p < 0.05; **p < 0.005.
The FRAP analysis demonstrated that the axonal transport of synaptotagmin-EGFP was inhibited by NO donor application dependent on JNK phosphorylation in a manner similar to synaptophysin-EGFP.
Breakdown of anterograde synaptophysin transport by nitric oxide
To directly visualize synaptophysin-EGFP moving along the axons and determine the effect of NO on axonal transport of synaptophysin-EGFP, dual-beam cross-correlation analysis was applied to the transfected neurons, which allowed determination of the velocity as well as the direction of the movement. (Fig. 7a). First, cross-correlation curves of EGFP in axons of transfected neurons were analyzed. The diffusion of EGFP in the axon showed no preferential direction as indicated by matching forward (G1,2) and backward (G2,1) cross-correlation curves (Fig. 7b). Cross-correlation curves in neurons transfected with synaptophysin-EGFP were then analyzed. A movement of synaptophysin-EGFP in one direction was observed in axons. In these measurements, the forward (G1,2) and backward (G2,1) cross-correlation curves (Fig. 7c) are different. After subtraction of G1,2 from G2,1, the resulting pure cross-correlation curve exhibits a maximum that corresponds to the transport time of the synaptophysin-EGFP between both laser spots. Unidirectional anterograde movement of synaptophysin-EGFP was observed in 71.75% ± 10.72% (mean ± SD) of analyzed axons. Directed backward retrograde movement was observed only in a minority of measurements, as indicated by the exchange of (G1,2) and (G2,1) cross-correlation curves.
Figure 7.

Loss of anterograde axonal transport of synaptophysin-EGFP after NO donor application. a, Schematic drawing of cross-correlation spectroscopy measurements. Two laser beams are placed over the axon and allow detection of single fluorescence molecules moving through both laser spots. b, Cross-correlation measurement in the axon of a neuron transfected with EGFP alone. The diffusion of EGFP inside the axons results in nearly corresponding forward (G1,2) and backward (G2,1) cross-correlation curves. c, Forward (G1,2) and backward (G2,1) cross-correlation measurement in an axon of a neuron transfected with synaptophysin-EGFP. The directed movement of synaptophysin-EGFP results in two distinct cross-correlation curves. The direction and velocity of the movement can be determined from the peak maximum for the flow time (0.79 μm/sec). d, Distribution of the velocity of synaptophysin-EGFP inside the axons. The velocity of the synaptophysin-EGFP is nonuniform and varies over a range from 0.25 to 4 μm/sec, with a main occurrence of 0.7 μm/sec. In total, 179 independent measurements were performed. e, Loss of directed anterograde axonal transport after NO donor (300 μm DEA/NONOate) treatment. In this axon a loss of directed transport of synaptophysin-EGFP was observed after 9 min of NO donor application as indicated in the nearly corresponding forward (G1,2) and backward (G2,1) cross-correlation curves. f, Distribution of the time intervals, at which a loss of directed axonal movement of synaptophysin-EGFP was observed after NO donor (300 μm DEA/NONOate) application. The breakdown of directed axonal movement by NO donor was prevented in most axons by pretreatment of the neurons with the JNK inhibitor (100 nm JNK inhibitor II). p < 0.005; χ2 test/Fisher's exact test.
The transport velocity of synaptophysin-EGFP was determined from the cross-correlation measurements performed over time periods between 10 and 300 sec and calculated from the time τ, where the pure cross-correlation curve exhibited its maximum. The velocity of synaptophysin-EGFP was not uniform over time and in distinct axons. The averaged flow velocity of synaptophysin-EGFP varied from 0.25 to 4 μm/sec, with a main occurrence of 0.7 μm/sec (Fig. 7d).
Next, the NO donor (DEA/NONOate, 300 μm) was added to neurons transfected with synaptophysin-EGFP. The motility of synaptophysin-EGFP was measured before and after NO donor application at a constant position in the axon. Measurements of the cross-correlations showed that the directed anterograde movement of synaptophysin-EGFP was still intact in all analyzed neurons until 5 min after NO donor application; however, the directed axonal movement of synaptophysin-EGFP was lost after 5-15 min of NO donor application (Fig. 7e). In detail, 10 of 12 analyzed neurons (83%) having intact anterograde axonal movement of synaptophysin-EGFP before and shortly after NO donor application showed a complete breakdown of the directed movement after 11 min ± 4 min (mean ± SD) (Fig. 7f).
Finally, we studied the effect of a JNK inhibitor on the directed movement of synaptophysin-EGFP. The neurons were preincubated for at least 30 min with 100 nm JNK Inhibitor II. The inhibitor per se did not influence the transport of synaptophysin-EGFP as determined by the cross-correlation analysis. The NO donor was then added to neurons pretreated with the JNK inhibitor, and cross-correlation data were recorded at the same position in the axon. The JNK inhibitor prevented the effect of NO on axonal motility of synaptophysin-EGFP. In detail, only 2 of 10 analyzed neurons treated with JNK inhibitor showed breakdown of directed axonal movement despite NO donor application (Fig. 7f). This demonstrated that JNK blockage significantly (p < 0.005; χ2 test/Fisher's exact test) prevented the inhibitory effect of NO on axonal transport of synaptophysin-EGFP.
Discussion
In this study, the movement of synaptophysin-EGFP and synaptotagmin-EGFP in axons of transfected neurons was analyzed. Transfection of primary neurons with synaptophysin-EGFP has been used successfully in several studies to analyze synaptic vesicle precursors in axons (Kaether et al., 2000; Pennuto et al., 2003). To achieve more physiological expression levels of the transfected synaptophysin-EGFP and synaptotagmin-EGFP, we replaced the CMV promoter by the synapsin I promoter. Thus, synatophysin-EGFP and synaptotagmin-EGFP were localized in axons and colocalized with VAMP2, demonstrating that both proteins integrated into the synaptic vesicle precursor membrane. No diffusion of synaptophysin-EGFP and synaptotagmin-EGFP was observed, because recovery of the fluorescence signal after bleaching was several magnitudes slower (∼600 sec) compared with freely diffusing EGFP (∼2 sec).
Advanced biophysical techniques were applied to analyze the transport of synaptic vesicle precursors in axons. First, the FRAP method was performed based on measurement of the net increase in fluorescence signal of a bleached area. Detailed analysis of FRAP in axons of normal neurons showed that ∼30-50% of the synaptophysin-EGFP and synaptotagmin-EGFP was immobile, possibly because of transient stops; however, we cannot exclude the possibility that the observed persistent minor immobile fraction is a consequence of the nonregulated expression by the transfected construct. Nitric oxide had a major effect on the immobile fraction, which increased up to 80% of the total signal within 5-10 min after NO donor application. In contrast, no effect of the NO donor on t1/2 was observed after 5-10 min, and only minor changes in t1/2 were detected after 30 min of NO donor treatment, indicating a minor effect of NO on the velocity of the movement. Thus, NO inhibited the net transport of synaptophysin-EGFP and synaptotagmin-EGFP preferentially by increasing the immobile fraction. Second, the dual-beam cross-correlation, a novel modified form of FCS, was applied, during which two detection volumes are created with a defined distance (Dittrich and Schwille, 2002). When a dye molecule successively passes both detection volumes, two signals shifted in time can be recorded. The direction of the movements of fluorescent molecules can be tracked, and flow velocity can be determined. Furthermore, cross-correlation spectroscopy is ideally suited for scattered tissue because uncorrelated signals are detected in both spots and excluded from the analysis. Indeed, cross-correlation analysis was more precise in elucidating the effect of NO on the axonal movement of synaptophysin-EGFP. The cross-correlation method enabled the measurement of the velocity of the movement in axons of normal neurons, which ranged between 0.25 and 4 μm/sec. The most frequently observed net velocity of synaptophysin-EGFP was 0.7 μm/sec. Because the velocity was determined from 10-300 sec measurement intervals, it might be that the net velocity is composed of fast movements with 4 μm/sec and short stops or minor backward-directed movements. The FCS and FRAP data support the same phenomenon. After NO treatment, the majority of vesicles ceased directed anterograde movement. Because FCS data measured velocities more precisely for a smaller subset of vesicles than the FRAP technique, with FCS we expect to see directed ongoing movement in an axonal segment until most of the vesicles cease kinesin-based movement and start to diffuse slowly. Consequently, the onset times of the NO effect vary more strongly in the FCS than FRAP data. Interestingly, retrograde movements of synaptophysin-EGFP as indicated by reversed forward and backward cross-correlation curves were occasionally observed by scanning a series of short single measurement intervals over 10 sec only (our unpublished observation).
Cross-correlation analysis demonstrated that NO induced a breakdown of directed axonal transport of synaptophysin-EGFP. No reduction in the velocity of synaptophysin-EGFP was observed by FCSa before the breakdown of directed axonal transport. In the FRAP analysis, NO significantly increased the mobile fraction of synaptophysin-EGFP and synaptotagmin-EGFP. Thus, both FRAP and fluorescence cross-correlation analyses suggest that the NO-mediated disturbance of axonal synaptophysin-EGFP transport is caused by detachment of the vesicles or the motor protein complex from the tubulin track. The effect of NO on axonal transport of synaptophysin-EGFP appeared to be reversible. At 120 min after application of a short-term NO donor (with a half-life of 2.1 min) acting as a single pulse of NO, the movement of synaptophysin-EGFP reverted to almost normal levels.
Very little is known about the regulation of synaptic vesicle movements in the axonal microtubule-based transport system. Fast anterograde axonal transport is driven by the kinesin super-family motor proteins that bind vesicular and organellar cargoes and move them from the cell bodies to synaptic endings (Guzik and Goldstein, 2004). Synaptic vesicle precursors are often connected to the kinesin superfamily motors via scaffolding proteins. Recently, JIPs have been suggested as scaffolding proteins mediating the axonal transport and binding of kinesins to vesicles. In C. elegans, unc-16 encoding a homolog of mouse JIP3 physically interacts with JNK and JNK kinases, and loss-of-function mutations of unc-16 resulted in mislocalization of synaptic vesicles very similar to unc-104/KIF1a kinesin mutants (Byrd et al., 2001). In a genetic screen in Drosophila, the scaffolding protein JIP3/syd was identified as a binding partner of kinesin light chain, and it was proposed that JIP3/syd mediates kinesin-dependent axonal transport of vesicles (Bowman et al., 2000). Furthermore, it was shown that kinesin light chain interacts with JIP1, JIP2, and JIP3 and that localization of JIPs in nerve terminals required kinesin (Verhey et al., 2001). In another study, it was demonstrated that the stress kinase MLK2 (mixed lineage kinase 2) colocalized with JNK and the kinesin superfamily motor KIF3 (Nagata et al., 1998). Because JIP family members are also scaffolding proteins for JNK and JNK kinases and both are associated with kinesins, it was speculated that stress signaling via JNK may be involved in the regulation of kinesin-dependent vesicle movement. Now, in our study we provide direct evidence that stress signaling via JNK regulates axonal movement of synaptic vesicle precursors containing synaptophysin and synaptotagmin. Nitric oxide induced phosphorylation of JNK in axons and inhibited the axonal movement of synaptophysin and synaptotagmin via JNK signaling. In principal, NO could act directly via S-nitrosylation on the JNK or JNK kinases or indirectly via upstream JNK signaling molecules. Advanced proteomic tools might help to find the proteins modulated by NO in axonal transport dysfunction.
Cytokine-stimulated microglia inhibited axonal movement of synaptophysin-EGFP dependent on their NO synthase. Microglial cells are activated and highly motile in inflammatory brain diseases. In pathological situations they interact directly with neurons and could ensheathe axons (Peterson et al., 2001). Activated microglial cells produce substantial amounts of reactive oxygen species including NO, which is required primarily to kill invaded microorganisms or neoplastically transformed cells. Recently, it was observed that NO at levels produced by inflammatory cells induces conduction block preferentially of demyelinated axons (Redford et al., 1997; Smith and Lassmann, 2002). Furthermore, NO has been implicated in the normal physiological function of synapses (Holscher, 1997), but the NO concentrations of activated microglia would swamp and disturb the delicately balanced normal synaptic role of NO. We now observed that NO of activated microglia rapidly inhibits axonal transport of synaptic vesicle precursors at concentrations much lower than that required to kill neurons. In our study, microglial cells treated with the cytokines IL-1β and IFN-γ released substantial amounts of NO (equaling ∼40 μm nitrite) into the medium, which would predict much higher local concentrations near the microglia. Increased amounts of NO are produced by inducible NO synthase of activated microglia or macrophages in neuroinflammatory conditions such as multiple sclerosis, stroke, brain injury, and microbial brain infections (Nguyen et al., 2002). Particularly, given that NO is a diffusible gas produced by activated microglia, it may locally block axonal transport of demyelinated axons near activated microglia, but it is questionable whether NO released by microglia will reach myelinated axons in reasonable concentrations without inducing myelin damage (Smith and Lassmann, 2002). Because the axonal transport system is essential for keeping the integrity and viability of the axons and synapses, activated microglia permanently producing NO might induce long-lasting inhibition of axonal transport and may have important consequences on the function and survival of the neuronal structures (Guzik and Goldstein, 2004).
In conclusion, our data demonstrate that NO released from activated microglia inhibits directed axonal movement of synaptic vesicle precursors containing synaptophysin and synaptotagmin. Disturbance of axonal transport by microglial NO thus may be responsible for axonal injury and synaptic dysfunction in inflammatory brain diseases.
Footnotes
This work was supported by the University Göttingen (Neuroimmunology Group), the Max-Planck Institute of Biophysical Chemistry (Experimental Biophysics Group), the Hertie-Foundation (M.S., H.N.), the Deutsche Forschungsgemeinschaft (H.N.), and the German Ministry of Education and Research (Biofuture grant) (P.S., P.S.D.). We are grateful to Dr. C. Kaether and Prof. C. Dotti for the synaptophysin plasmid and Dr. S. Kügler and Prof. Bähr for synapsin I promoter plasmid. We thank Alexandra Bohl and Heiko Röhse for technical assistance and are grateful to Christian Rochford and Laura Swan for helpful comments. We thank Tiziana M. Rozzo and Dr. Marjan Rupnik for help in three-dimensional reconstruction by Imaris software. We thank Shi-Bing Yang and Dr. Marjan Rupnik for support in electrophysiological characterization of cultured neurons.
Correspondence should be addressed to Harald Neumann, Neuroimmunology Group, European Neuroscience Institute Göttingen, Waldweg 33, 37073 Göttingen, Germany. E-mail: hneuman1@gwdg.de.
Copyright © 2005 Society for Neuroscience 0270-6474/05/250352-11$15.00/0
References
- Ahern GP, Klyachko VA, Jackson MB (2002) cGMP and S-nitrosylation: two routes for modulation of neuronal excitability by NO. Trends Neurosci 25: 510-517. [DOI] [PubMed] [Google Scholar]
- Axelrod D, Koppel DE, Schlessinger J, Elson E, Webb WW (1976) Mobility measurement by analysis of fluorescence photobleaching recovery kinetics. Biophys J 16: 1055-1069. [DOI] [PMC free article] [PubMed] [Google Scholar]
- Bitsch A, Schuchardt J, Bunkowski S, Kuhlmann T, Bruck W (2000) Acute axonal injury in multiple sclerosis. Correlation with demyelination and inflammation. Brain 123: 1174-1183. [DOI] [PubMed] [Google Scholar]
- Bowman AB, Kamal A, Ritchings BW, Philp AV, McGrail M, Gindhart JG, Goldstein LS (2000) Kinesin-dependent axonal transport is mediated by the Sunday driver (SYD) protein. Cell 103: 583-594. [DOI] [PubMed] [Google Scholar]
- Byrd DT, Kawasaki M, Walcoff M, Hisamoto N, Matsumoto K, Jin Y (2001) UNC-16, a JNK-signaling scaffold protein, regulates vesicle transport in C. elegans Neuron 32: 787-800. [DOI] [PubMed] [Google Scholar]
- Dittrich P, Malvezzi-Campeggi F, Jahnz M, Schwille P (2001) Accessing molecular dynamics in cells by fluorescence correlation spectroscopy. Biol Chem 382: 491-494. [DOI] [PubMed] [Google Scholar]
- Dittrich PS, Schwille P (2002) Spatial two-photon fluorescence cross-correlation spectroscopy for controlling molecular transport in microfluidic structures. Anal Chem 74: 4472-4479. [DOI] [PubMed] [Google Scholar]
- Ferguson B, Matyszak MK, Esiri MM, Perry VH (1997) Axonal damage in acute multiple sclerosis lesions. Brain 120: 393-399. [DOI] [PubMed] [Google Scholar]
- Gentleman SM, Graham DI, Roberts GW (1993) Molecular pathology of head trauma: altered beta APP metabolism and the aetiology of Alzheimer's disease. Prog Brain Res 96: 237-246. [DOI] [PubMed] [Google Scholar]
- Go YM, Patel RP, Maland MC, Park H, Beckman JS, Darley-Usmar VM, Jo H (1999) Evidence for peroxynitrite as a signaling molecule in flow-dependent activation of c-Jun NH(2)-terminal kinase. Am J Physiol 277: H1647-H1653. [DOI] [PubMed] [Google Scholar]
- Goldstein LS (2001) Transduction. When worlds collide—trafficking in JNK. Science 291: 2102-2103. [DOI] [PubMed] [Google Scholar]
- Goldstein LS (2003) Do disorders of movement cause movement disorders and dementia? Neuron 40: 415-425. [DOI] [PubMed] [Google Scholar]
- Guzik BW, Goldstein LS (2004) Microtubule-dependent transport in neurons: steps towards an understanding of regulation, function and dysfunction. Curr Opin Cell Biol 16: 443-450. [DOI] [PubMed] [Google Scholar]
- Hirokawa N (1998) Kinesin and dynein superfamily proteins and the mechanism of organelle transport. Science 279: 519-526. [DOI] [PubMed] [Google Scholar]
- Holscher C (1997) Nitric oxide, the enigmatic neuronal messenger: its role in synaptic plasticity. Trends Neurosci 20: 298-303. [DOI] [PubMed] [Google Scholar]
- Iliev AI, Stringaris AK, Nau R, Neumann H (2004) Neuronal injury mediated via stimulation of microglial toll-like receptor-9 (TLR9). FASEB J 18: 412-414. [DOI] [PubMed] [Google Scholar]
- Kaether C, Skehel P, Dotti CG (2000) Axonal membrane proteins are transported in distinct carriers: a two-color video microscopy study in cultured hippocampal neurons. Mol Biol Cell 11: 1213-1224. [DOI] [PMC free article] [PubMed] [Google Scholar]
- Kugler S, Kilic E, Bahr M (2003) Human synapsin 1 gene promoter confers highly neuron-specific long-term transgene expression from an adenoviral vector in the adult rat brain depending on the transduced area. Gene Ther 10: 337-347. [DOI] [PubMed] [Google Scholar]
- Li L, Feng Z, Porter AG (2004) JNK-dependent phosphorylation of c-Jun on serine 63 mediates nitric oxide-induced apoptosis of neuroblastoma cells. J Biol Chem 279: 4058-4065. [DOI] [PubMed] [Google Scholar]
- Maragos CM, Morley D, Wink DA, Dunams TM, Saavedra JE, Hoffman A, Bove AA, Isaac L, Hrabie JA, Keefer LK (1991) Complexes of NO with nucleophiles as agents for the controlled biological release of nitric oxide. Vasorelaxant effects. J Med Chem 34: 3242-3247. [DOI] [PubMed] [Google Scholar]
- Medana IM, Day NP, Hien TT, Mai NT, Bethell D, Phu NH, Farrar J, Esiri MM, White NJ, Turner GD (2002) Axonal injury in cerebral malaria. Am J Pathol 160: 655-666. [DOI] [PMC free article] [PubMed] [Google Scholar]
- Nagata K, Puls A, Futter C, Aspenstrom P, Schaefer E, Nakata T, Hirokawa N, Hall A (1998) The MAP kinase kinase MLK2 co-localizes with activated JNK along microtubules and associates with kinesin superfamily motor KIF3. EMBO J 17: 149-158. [DOI] [PMC free article] [PubMed] [Google Scholar]
- Neumann H (2003) Molecular mechanisms of axonal damage in inflammatory central nervous system diseases. Curr Opin Neurol 16: 267-273. [DOI] [PubMed] [Google Scholar]
- Neumann H, Misgeld T, Matsumuro K, Wekerle H (1998) Neurotrophins inhibit major histocompatibility class II inducibility of microglia: involvement of the p75 neurotrophin receptor. Proc Natl Acad Sci USA 95: 5779-5784. [DOI] [PMC free article] [PubMed] [Google Scholar]
- Neumann H, Schweigreiter R, Yamashita T, Rosenkranz K, Wekerle H, Barde YA (2002) Tumor necrosis factor inhibits neurite outgrowth and branching of hippocampal neurons by a rho-dependent mechanism. J Neurosci 22: 854-862. [DOI] [PMC free article] [PubMed] [Google Scholar]
- Nguyen MD, Julien JP, Rivest S (2002) Innate immunity: the missing link in neuroprotection and neurodegeneration? Nat Rev Neurosci 3: 216-227. [DOI] [PubMed] [Google Scholar]
- Pennuto M, Bonanomi D, Benfenati F, Valtorta F (2003) Synaptophysin I controls the targeting of VAMP2/synaptobrevin II to synaptic vesicles. Mol Biol Cell 14: 4909-4919. [DOI] [PMC free article] [PubMed] [Google Scholar]
- Peterson JW, Bo L, Mork S, Chang A, Trapp BD (2001) Transected neurites, apoptotic neurons, and reduced inflammation in cortical multiple sclerosis lesions. Ann Neurol 50: 389-400. [DOI] [PubMed] [Google Scholar]
- Redford EJ, Kapoor R, Smith KJ (1997) Nitric oxide donors reversibly block axonal conduction: demyelinated axons are especially susceptible. Brain 120: 2149-2157. [DOI] [PubMed] [Google Scholar]
- Schwille P (2001) Fluorescence correlation spectroscopy and its potential for intracellular applications. Cell Biochem Biophys 34: 383-408. [DOI] [PubMed] [Google Scholar]
- Smith KJ, Lassmann H (2002) The role of nitric oxide in multiple sclerosis. Lancet Neurol 1: 232-241. [DOI] [PubMed] [Google Scholar]
- Taimor G, Rakow A, Piper HM (2001) Transcription activator protein 1 (AP-1) mediates NO-induced apoptosis of adult cardiomyocytes. FASEB J 15: 2518-2520. [DOI] [PubMed] [Google Scholar]
- Verhey KJ, Meyer D, Deehan R, Blenis J, Schnapp BJ, Rapoport TA, Margolis B (2001) Cargo of kinesin identified as JIP scaffolding proteins and associated signaling molecules. J Cell Biol 152: 959-970. [DOI] [PMC free article] [PubMed] [Google Scholar]