

Abstract
Electrical coupling among GABAergic interneurons is believed to play an essential role in shaping synchronized brain network activity related to cognition and behavior. We have studied the rules governing the electrical coupling between hippocampal interneurons located in stratum lacunosum-moleculare of the CA1 hippocampus. The most frequently recorded interneuron subtype had short multipolar dendrites and a dense local axonal arborization, typical of neurogliaform cells. Electrical excitability in this class of interneurons was heterogeneous. Although injection of small current steps evoked late spiking, larger steps triggered different types of firing patterns. Trains of action potentials ranged from clearly adapting to highly irregular, with clustered or mostly regular spikes. Electrotonic and action potentials could be propagated to the coupled cells; the coupling coefficient for electrotonic signals was 0.035, which compared with 0.005 for action potentials. Electrical coupling was reversibly blocked by application of carbenoxolone. Multiple simultaneous recordings indicated that interneurons with similar and different firing patterns were electrically coupled. This visual impression was quantitatively confirmed by principal component analysis applied to variables related to membrane excitability. In fact, the probability of finding electrically coupled neurons in our sample was not dependent on the excitable properties of the cells tested and was ∼0.34. The presence of diffuse electrical coupling among hippocampal interneurons of stratum lacunosum-moleculare with different excitability is a novel finding with important implications. For example, the promiscuity of electrical connections may endow inhibitory networks with a large degree of flexibility and regulate the computational power of the hippocampus during different synchronized states.
Keywords: interneuron, GABA, gap junction, connexin, pannexin, hippocampus
Introduction
In the mammalian brain, neuronal communication via chemical synapses and electrical coupling (Galarreta and Hestrin, 2001; Connors and Long, 2004) is at the base of the coordinated activity of circuits (Whittington and Traub, 2003; Bennett and Zukin, 2004; Hormuzdi et al., 2004) believed to underlie higher cognitive functions. In particular, networks of GABAergic inhibitory interneurons (Freund and Buzsaki, 1996) are thought to play an essential role for the selection and synchronization of principal cell neuronal assemblies. Work in the neocortex and in the dentate gyrus (Galarreta and Hestrin, 1999, 2002; Gibson et al., 1999; Beierlein et al., 2000; Venance et al., 2000; Bartos et al., 2001; Szabadics et al., 2001; Meyer et al., 2002; Blatow et al., 2003; Chu et al., 2003; Galarreta et al., 2004) has supported the idea that these inhibitory networks are, in part, the result of electrical coupling between similar types of local-circuit interneurons via gap junctions. Thus, according to this view, interneurons of the same anatomical class and with similar intrinsic excitability may act as a functional syncytium resulting in efficient spatiotemporal coordination of GABA release at specific postsynaptic domains. The selective activation and/or interplay of different inhibitory networks may be the key to explain principal cell synchronization at different frequencies.
Neocortical interneurons identified by their firing pattern as fast spiking (Galarreta and Hestrin, 1999, 2002; Gibson et al., 1999), low-threshold spiking (Beierlein et al., 2000), late spiking (Chu et al., 2003), (multipolar) bursting (Blatow et al., 2003), regular spiking (Szabadics et al., 2001), and irregular spiking (Galarreta et al., 2004) have been shown to be electrically connected to similar cells. These electrical connections have been shown to be essential for the shaping of specific types of oscillatory rhythms (Deans et al., 2001; Hormuzdi et al., 2001; Szabadics et al., 2001; Maier et al., 2002; Buhl et al., 2003; Pais et al., 2003). Similarly, in the dentate gyrus, electrical connections between parvalbuminimmunopositive fast-spiking basket cells (Venance et al., 2000; Bartos et al., 2001; Meyer et al., 2002) play a role in high-frequency population activity (Bartos et al., 2002). However, exceptions to this “similar-to-similar” coupling rule also exist. For example, coupling between fast-spiking and low-threshold-spiking neurons (Gibson et al., 1999), between layer IV fusiform interneurons and spiny stellate cells (Venance et al., 2000), between fast-spiking cells and pyramidal neurons (Meyer et al., 2002), and between layer I late-spiking and non-late-spiking cells (Chu et al., 2003) may occur, albeit much less frequently. Recent work by Simon et al. (2005) in the neocortex has suggested that the electrical coupling of neurogliaform interneurons is very promiscuous and may act as a bridge between different types of interneurons. However, in the hippocampus, no promiscuous electrical coupling of neurogliaform interneurons was reported by Price et al. (2005), despite the clear observation of promiscuous chemical connectivity.
Here, we have addressed this issue by studying the electrical coupling of hippocampal interneurons defined by their firing pattern properties. Our results indicate that both electrically homogenous and heterogeneous interneurons of stratum lacunosum-moleculare can form gap-junction-mediated networks.
Materials and Methods
Slice preparation. The procedure used to obtain slices is similar to the one described by Aradi and Maccaferri (2004). Briefly, 12- to 21-d-old Sprague Dawley rats were deeply anesthetized with isoflurane and decapitated in accordance with National Institutes of Health and institutional protocols. The brain was removed quickly, and slices of 300–400 μm thickness were cut using a vibrating microtome (Leica, Nussloch, Germany) and placed into ice-cold oxygenated solution, which contained the following (in mm): 2.5 KCl, 1.25 NaH2PO4, 28 NaHCO3, 0.5 CaCl2, 7 MgSO4, 7 glucose, 234 sucrose, 1 ascorbic acid, and 3 pyruvic acid. Slices were then incubated in oxygenated artificial CSF (ACSF) in a holding chamber at a temperature of 32–34°C for 30 min and then stored at room temperature until recording. The recording temperature was 32–34°C. The ACSF contained 130 mm NaCl, 3.5 mm KCl, 1.25 mm NaH2PO4, 1 mm MgSO4, 1.5 mm CaCl2, 24 mm NaHCO3, and 10 mm glucose and was saturated with a mixture of 95% O2 and 5% CO2 at pH 7.4. Interneurons were identified visually using an upright microscope (Olympus Optical, Tokyo, Japan) equipped with a 40× differential interference contrast (DIC) objective coupled to an infrared (IR) video camera system (Dage-MTI, Michigan City, IN). Neurons were selected in stratum lacunosum-moleculare, preferably close to the hippocampal fissure.
Electrophysiological recordings. Simultaneous double or triple recordings were performed in current-clamp mode, using two identical Multiclamp 700A amplifiers and the pClamp9 program package (Axon Instruments, Union City, CA). Patch electrodes were filled with an internal solution containing 125 mm K-methylsulfate, 4 mm NaCl, 4 mm MgATP, 0.3 mm NaGTP, 16 mm KHCO3, and 0.5% biocytin, saturated with 95% O2 and 5% CO2 toapHof 7.3 and 285–295 mOsm. The junction potential associated with this solution was experimentally estimated (Neher, 1992) to be ∼8.5 mV and was not corrected. When filled with this solution, the resistance of the electrode was ∼5 MΩ. To reduce electrode capacitance, the tip of the pipettes was coated with beeswax (Fisher Scientific, Pittsburgh, PA). In addition, electrode capacitance was compensated through the amplifier. Membrane resting potential was estimated from voltage-clamp recordings immediately after breakthrough. Following Ohm's law V = IR, the holding current recorded at –60 mV was used to calculate the resting potentials of the cells. Input resistance was estimated by a 10 mV (250 ms duration) negative voltage step. The advantage of this method is that it allowed the determination of a “resting potential” also from cells that were spontaneously active in current-clamp configuration. The average resting membrane potential was –65.8 ± 1.2 mV (mean ± SE), and the input resistance was 445 ± 49 MΩ (n = 45). Positive or negative current injection was used to keep neurons at approximately –67 mV during the recording, and bridge balance was adjusted through the amplifier, as needed.
Current–voltage curves were collected in current clamp by applying 10–20 pA current steps. We tested for the presence of gap junction between cell pairs by repetitively applying a 645 ms current step of –100 pA (≥30 sweeps). After averaging, the coupling coefficient for current injection [direct current (DC) coupling] was calculated as the ratio of voltage deflection in the noninjected cell to the voltage deflection in the injected cell measured at the end of the stimulus. Cells were considered coupled if they had a DC coupling value higher than 0.001 and the shape of the electrotonic response was recognizable in the recording from the noninjected cell. To facilitate the recognition of such shape in cells with weaker coupling, a step of at least +100 pA was used. Spike coupling coefficients were calculated similarly.
Chemicals. 3β-Hydroxy-11-oxoolean-12-en-30-oic acid 3-hemisuccinate (carbenoxolone) was obtained from Sigma (St. Louis, MO) as a disodium salt and was dissolved directly into the ACSF to a final concentration of 100 μm. Occasionally, brief sonication (1–2 min) was used to facilitate the solution of the drug.
Data analysis. Data were filtered at 3 kHz and digitized at 20 kHz using a Digidata 1322A analog-to-digital board. Analysis was performed using pClamp (Axon Instruments), Origin (Microcal, Northampton, MA), Excel (Microsoft, Seattle, WA), Whole-Cell Program (courtesy of Dr. J. Dempster, University of Strathclyde, Glasgow, UK), MVSP (Kovach Computing Services, Pentraeth, Isle of Anglesey, UK), and Prism software (GraphPad, San Diego, CA) packages.
Principal component analysis. We applied principal component analysis (PCA) (Joliffe, 1986) to five variables related to membrane excitability measured from the firing patterns of individual neurons. The five variables selected were the most obviously related to the firing pattern, which is determined by the shape and the temporal occurrence of action potentials in a train. The mean interspike interval (ISI) is related to the firing frequency, the coefficient of variation of the ISIs (CV ISI) to the regularity of the spike train, the ratio of the first over the last ISI (ratio ISI) to spike frequency adaptation, the ratio of the amplitude of the smallest spike over the largest (ratio AP) to the modulation of spike amplitudes, and the latency between the action potential and afterhyperpolarization peaks (AHP timing) to the shape of the AHP. The first four variables were measured during firing evoked by a 80 pA suprathreshold, 645-ms-long current step. AHP timing was measured at threshold current levels. The different variables were transformed in Z-scores to account for the different units of measurement. As a result of PCA, we were able to plot individual cases in the three-dimensional space. The MVSP software (Kovach Computing Services) scaled the component loadings to unity so that the sum squares of an eigenvector equaled 1, and the component scores were scaled so that the sum of squares equaled the eigen value. Euclidean distances between pairs of points (Ed) were calculated using an extension of the Pythagoras theorem following the formula Ed =√ [(Δx)2 + (Δy)2 + (Δz)2], where x, y, and z are the three principal components.
Data are expressed as mean ± SEM. Parametric and nonparametric tests were used, as detailed in the text, as required.
Visualization of recorded cells and reconstruction. Methods were similar to the ones described by Maccaferri and Dingledine (2002). Briefly, slices were fixed for 1–10 d in a 4% paraformaldehyde PBS solution at 4°C. Endogenous peroxidase activity was removed by incubating the slices in 10% methanol/1% H2O2 PBS solution. Biocytin staining was processed using an avidin-HRP reaction (Vectastain ABC Elite kit; Vector Laboratories, Burlingame, CA), and axon visualization was improved using a PBS solution containing NiNH4SO4 (1%) and CoCl2 (1%). Slices were not resectioned but directly mounted on the slide using an aqueous mounting medium (Vectashield; Vector Laboratories). Alternatively, they were first dehydrated and then mounted on the slide using a toluene solution (Permount; Fisher Scientific, Fair Lawn, NJ). Slices were observed at 40× magnification and photographed using the AxioVision software package (Zeiss, Oberkochen, Germany).
Results
Heterogeneity of intrinsic excitability of CA1 stratum lacunosum-moleculare interneurons
Forty-five individual single-cell recordings from interneurons located in stratum lacunosum-moleculare of the CA1 hippocampus were used to study their anatomical heterogeneity and intrinsic excitability (Fig. 1). The most common cell type encountered (n = 11) had short multipolar dendrites, mostly restricted to stratum lacunosum-moleculare, and was approximately centered on a dense local axonal arborization (Fig. 1A–D). Thirteen additional interneurons with a similar dendritic structure were recovered, but the axon could not be visualized. In 12 more cases, interneurons with long dendrites spanning through stratum lacunosum-moleculare, stratum radiatum, and occasionally reaching stratum pyramidale were recovered (Fig. 1E,F). However, their dendritic structure was quite variable and much less stereotyped than the previous cell group. The axon was either not visible or was cut at the surface of the slice before it could branch profusely. Therefore, a precise identification of these cells was not possible. It is very likely that many interneuron subtypes were variably represented in this cell group. Indeed, the dendrites of five cells were not obviously organized along a preferential axis, whereas in five cells, the predominant axis along which the dendrites was oriented was approximately parallel to stratum pyramidale; in the remaining two cases, it was perpendicular to it. The typical axonal branching mostly restricted to stratum radiatum allowed the identification of an additional cell as a Schafferassociated interneuron (Vida et al., 1998; Cope et al., 2002). In four more cases, the axon was the structure more clearly recovered and was located mostly within stratum lacunosum-moleculare. Last, in four neurons, not enough structures were recovered for any type of meaningful description.
Figure 1.

Heterogeneity of intrinsic excitability in CA1 stratum lacunosum-moleculare interneurons. Interneurons with short dendrites and local axonal arborization (A–D) can display different types of firing patterns. The traces shown at the side of the images of the cells are the responses to 645 ms current injections at threshold levels (1) and 80 pA above threshold intensity (2). Notice the adapting firing pattern of the interneuron shown in A, the more “clustered” firing in B, and the more regular firing of C and D, albeit at different frequencies. Dashed lines indicate the border between stratum lacunosum-moleculare (L-M) and the dentate gyrus (DG). E, F, Electrical excitability of large interneurons with extensive dendritic branching throughout hippocampal layers. Notice the large and slow afterhyperpolarization at the end of the spike when evoked at threshold levels (1) and the irregular firing pattern at higher intensities [80 pA above threshold (2)]. The axonis indicated by the arrows and is cut at the surface of the slice after leaving the cell body and generating only a few branches. Stratum lacunosum-moleculare (L-M), stratum radiatum (R), and stratum pyramidale (P) are indicated at the side of the micrographs. Scale bar in A applies to all panels.
Given that different cells types are present in stratum lacunosum-moleculare (Williams et al., 1994; Vida et al., 1998), it was not surprising that a large variety of firing patterns could be observed in response to suprathreshold depolarizing current injections via the recording pipette. Cells were held at approximately –67 mV, close to their average resting potentials (see Materials and Methods). However, heterogeneity of the firing patterns was not only observed across interneurons with different anatomical properties but also within interneurons with similar dendritic and axonal distributions. For example, four interneurons with a similar morphology, but different firing patterns, are shown in Figure 1A–D. Trains of action potentials could range from clearly adapting to highly irregular with clustered or mostly regular spikes. The amplitude of the spike could remain mostly constant or be subjected to strong modulation during the train (Fig. 1, compare A, B). These cells were typically recovered close to the border with the dentate gyrus. The short multipolar dendritic architecture and dense local axon distribution is very similar to the previously described neurogliaform interneurons in the hippocampus and neocortex (Kawaguchi, 1995; Hestrin and Armstrong, 1996; Vida et al., 1998; Tamas et al., 2003). Two examples of the firing patterns of cells with longer dendrites are shown in Figure 1, E and F. In these cases, the axon reached a considerable distance before branching into collaterals and being cut off at the surface of the slice, preventing a proper classification. In conclusion, different firing patterns can be recorded in stratum lacunosum-moleculare interneurons. Also, similar excitable properties are not necessarily associated with a specific cell type defined by its axonal and dendritic morphology.
Next, we tried to solidify these initial observations into a quantitative result by measuring parameters that are related to firing patterns such as (1) mean ISI, (2) CV ISI, (3) ratio ISI, (4) ratio AP, and (5) last, AHP timing. We took advantage of PCA to compress the variability of these parameters into three new axes. The three factors accounted for 80.2% of the total variance (eigen values: factor 1, 1.840; factor 2, 1.180; factor 3, 0.992; and cumulative percentage: factor 1, 36.8%; factor 2, 60.4%; factor 3, 80.2%). Thus, we built a three-dimensional scatter plot, in which every point is related to the excitable properties and firing pattern of an individual neuron (Fig. 2A). The three factors were correlated to the five original variables according to different degrees, as shown in Figure 2B. As expected, points located in close proximity within the three-dimensional plot were related to neurons with firing patterns more similar than neurons represented by distant points (Fig. 2C). Furthermore, it was easy to see that cells belonging to the same class did not necessarily display a similar firing pattern.
Figure 2.

Principal component analysis of intrinsic excitability in anatomically distinct interneurons. A, Three-dimensional plot showing the factor scores for the individual cases, divided in three main groups according to their anatomy. The black symbols indicate neurons with short multipolar dendrites and local axon as in Figure 1 A–D. Gray symbols indicate cells with similar multipolar appearance in which the axon could not be recovered. All of the remaining neurons are represented by the white symbols. Notice the large spread in the plot of anatomically similar neurons. B, Factor loadings (correlations) for each variable are shown in histogram form (white, factor 1; gray, factor 2; and black, factor 3). C, Responses of different neurons to a 645 ms, 80 pA suprathreshold stimulus. Notice that neurons defined by points closer in space have a more similar firing pattern when compared with points separated by larger distances.
Our results indicate that interneurons of stratum lacunosum-moleculare are electrically heterogeneous, which may reflect the specific expression of different voltage-dependent channels, the differential location/density of the same channels, and/or the different geometry of the interneurons themselves (Mainen and Sejnowski, 1996).
Electrical coupling between interneurons and propagation of electrotonic responses and action potentials
Next, we tested for the presence of electrotonic coupling in pairs and triplets of simultaneously recorded cells (Fig. 3). We quantified the strength of electrotonic coupling by injecting a –100 pA current pulse in one cell of the pair (or triplet), as shown in Figure 3A, and by calculating the ratio of the voltage response recorded in the other neuron(s), which was not subjected to any pulse injection (the distribution of the DC coupling obtained from averaged sweeps is shown in Fig. 3B). The average DC coupling calculated from 146 connections was 0.035 ± 0.002. In all cases, coupling was found to be bidirectional, and the distribution of the ratio of the DC coupling in the two opposite directions was centered on 1. The mean ratio was 1.2 ± 0.1 (n = 73).
Figure 3.

Propagation of DC signals via electrical coupling. A, Left, DIC-IR image of two interneurons. Right, Simultaneous double current-clamp recording proving an electrical connection. V1 and V2 mark the voltage traces recorded from the two different neurons, and I1 and I2 show the timing of injection of –100 pA current steps in the two different cells, respectively. The insets show the voltage responses at a magnified scale. B, Left, Distribution plot of the DC coupling coefficients for 73 pairs of cells tested bidirectionally. Right, Summary graph of the ratio of the DC coupling measured bidirectionally in the same pairs. Notice the symmetrical distribution centered on 1.
Application of the gap-junction uncoupler carbenoxolone at 100 μm (Fig. 4) reduced the DC coupling to 3.1 ± 1.5% (p < 0.05, paired t test) of control in 13 connections tested in separate paired recordings. In eight of such cases, after the DC coupling coefficient decreased to 1.5 ± 2.5% of control in the presence of carbenoxolone, it was possible to partially wash out the effect of the drug and restore the DC coupling coefficient to 36.4 ± 8.2% of control (p < 0.05, repeated-measures ANOVA with Bonferroni's post hoc test). Thus, our results indicate that electrotonic coupling is mediated by gap junctions.
Figure 4.

Electrical coupling is eliminated by carbenoxolone (100 μm). A, The voltage response to the injection of a –100 pA current step was monitored in the presynaptic (V1) and postsynaptic (V2) cell in control conditions (1) and during the application (2) and washout (3) of the drug. Traces are the averages of 50 sweeps; recordings from the presynaptic and postsynaptic neuron are marked as V1 and V2, respectively. The time course of the voltage response from the presynaptic (V1) and postsynaptic (V2) neurons are shown in the top and bottom scatter plots, respectively. The black bar indicates drug application. B, Summary plot of the effect of carbenoxolone on the normalized DC coupling coefficient (DC coupling) in n = 8 experiments. Notice that the effect was partially reversible.
The propagation of electrical signals via gap junctions depends on the frequency components of the presynaptic electrical waveform (Galarreta and Hestrin, 1999). Therefore, we also measured the postsynaptic response to presynaptic spikes (Fig. 5). The spike-coupling coefficient was defined as the ratio of the amplitude of the averaged postsynaptic spikelet to the averaged presynaptic spike. From a total of 111 electrical connections, the calculated spike coupling coefficient was 0.005 ± 0.001. As shown by the cumulative distributions superimposed in Figure 5B, DC signals propagate with a much higher efficiency when compared with action potentials. However, despite the reduced efficiency, spike coupling calculated from averaged sweeps in individual pairs of neurons was significantly correlated to the level of DC coupling, as shown in Figure 5C (r2 = 0.17; p < 0.05). The average ratio of the spike coupling over the DC coupling coefficient in our sample is shown by the slope of the regression line (0.078). The low r2 coefficient and the scatter of the data are probably the results of spike amplitude modulation during trains of action potentials in particular sets of interneurons. As shown in the example of Figure 5D, although the amplitude and duration of the action potential waveforms could greatly vary during the response to a current step injection, the spikelet amplitudes observed on the postsynaptic cell varied much less. Indeed, the spike-coupling coefficient was modulated along different action potentials in the train, probably reflecting the different frequency components of the presynaptic signals. Another possibility that may explain the low r2 coefficient is that different type of interneurons may express specific dendritic voltage-dependent conductances, which may differentially affect action potential propagation to the gap-junction site(s). In conclusion, these results indicate that interneurons in stratum lacunosum-moleculare are electrically coupled via gap junctions and that various electrical waveforms can be propagated across the connected neurons.
Figure 5.

Action potentials and electrical coupling. A, Left, Fifty action potentials collected during firing pattern evaluation and aligned on their rising phase (top). Notice that the spikes in the presynaptic cell (pre) evoke postsynaptic responses that are difficult to detect in the postsynaptic neuron (post) in single sweeps (middle). However, the average from 315 traces (average) clearly shows the presence of a spikelet in the postsynaptic neuron. Notice the slower kinetics of the spikelet compared with the presynaptic spike waveforms. Right, Distribution of the spike coupling coefficients calculated as the ratio of the amplitude of the averaged postsynaptic spikelet to the averaged presynaptic spike. B, Comparison of the cumulative distributions of DC versus spike-coupling (indicated as DC and s, respectively). Notice the much larger efficiency in the propagation of DC signals compared with spikes. C, Although DC coupling is consistently much larger than electrical spike transmission, the two variables are significantly correlated (p < 0.05). The regression and identity lines are shown for comparison (dotted lines). D, Dynamic modulation of spike coupling during an action potential train. Left, Notice that the train of spikes produced by a current step (645 ms duration, 80 pA above threshold amplitude level) results in strong modulation of the action potential waveform in the presynaptic neuron (pre), with much weaker impact on the amplitude of the spikelets in the postsynaptic cell (post). Middle, Presynaptic action potentials and postsynaptic spikelets aligned and superimposed. Right, Scatter plot showing the increasing spike-coupling coefficient during the action potential train.
Given the heterogeneity of electrical excitability in stratum lacunosum-moleculare interneurons, we next analyzed the firing pattern of coupled cells to test the hypothesis that interneurons with different intrinsic excitability could be electrically coupled.
Electrical coupling between interneurons with similar and different intrinsic excitability
When we compared the firing pattern of electrically coupled neurons, we found evidence for coupling between interneurons with similar and different firing patterns. Figure 6 shows two examples of electrical connectivity in the case of interneurons displaying mostly regular or highly irregular and “stuttering” firing patterns. The examples selected had a strong DC coefficient coupling, and spikelets were clearly visible in single sweeps. Although these recordings provide direct evidence that electrically similar interneurons of hippocampal CA1 stratum lacunosum-moleculare are coupled, we also found evidence for coupling between neurons with different excitable properties. Figure 7 shows an example of a simultaneous recording between two morphologically similar interneurons with different firing patterns. This connection was also strong, and spikelets could be clearly observed in single sweeps. Additional experiments taking advantage of simultaneous recordings from three neurons allowed us to test electrical couplings in multiple combinations. Figure 8 shows two examples in which interneurons with different firing patterns were variably interconnected.
Figure 6.

Electrical coupling between stratum lacunosum-moleculare interneurons with similar firing patterns. A, Characterization of the intrinsic excitability of two electrically coupled interneurons with steps of –100 pA, threshold amplitude, and 30 and 80 pA above threshold amplitude. V1 indicates the voltage responses of the first cell and V2 the voltage responses of the second cell. Notice the striking similarity of the firing pattern in the two neurons. B, Evidence for electrical coupling: a 100 pA hyperpolarizing current step in one cell evokes a hyperpolarizing response in the other. Left, Current injection in cell 1; right, current injection in cell 2. Traces are averages of 46 and 48 sweeps, respectively. DC coupling was 0.124 in the 1 → 2 direction (left) and 0.107 in the 2 → 1 direction. C, Propagation of spikes and afterhyperpolarizations. Left, Spike propagation in the 1 → 2 direction after a 220 pA current pulse was injected in cell 1. Right, Spike propagation in the 2 → 1 direction after a current pulse injection in cell 2 of 190 pA. Notice the presence of spikelets and afterhyperpolarizations visible in single sweeps. The insets compare the different kinetics of the action potential in the presynaptic cell with the spikelet recorded in the postsynaptic neuron (arrow). The averages of several traces were scaled to the same amplitude and superimposed. D, Characterization of the firing pattern in another pair of neurons with similar excitability (steps of –100 pA, threshold amplitude, and 50 and 100 pA above threshold amplitude). Notice that the firing patterns are very different from the one recorded in the pair shown in A. E, Electrical coupling test in the 1 → 2 (left; DC coupling, 0.076) and 2 → 1 (right; DC coupling, 0.063) direction with a 100 pA negative current test pulse. Traces are averages of 60 sweeps in both cases. F, Spikelets are visible in single sweeps after action potential production in the presynaptic cell. The insets show the different kinetics of the action potential in the presynaptic cell with the spikelet recorded in the postsynaptic neuron (arrow). The averages of several traces were scaled to the same amplitude and superimposed.
Figure 7.
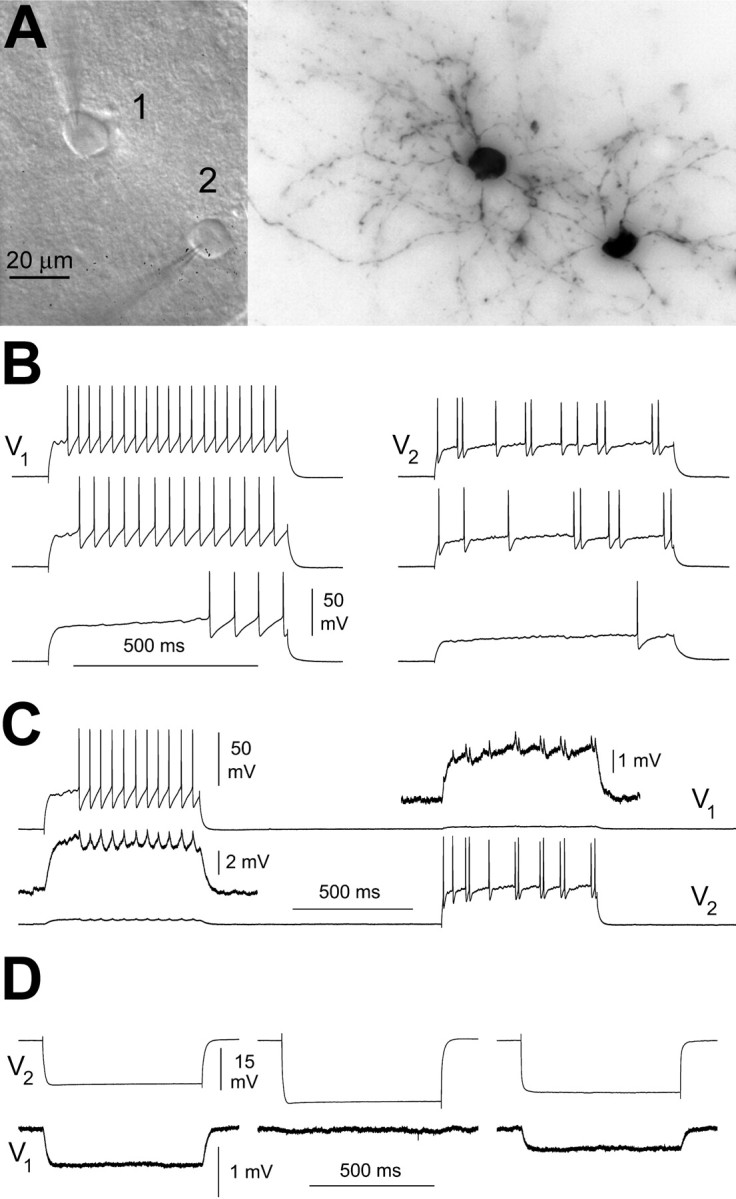
Coupling between two interneurons with different electric excitability. A, IR-DIC appearance of the recorded cells in the living slice (left) and light microscopy image after histological processing for biocytin (right). B, Firing pattern in response to current steps of various amplitude [645 ms duration, 140 pA above threshold (top traces), 80 pA above threshold (middle traces), and threshold level (bottom traces)]. V1 and V2 indicate the voltage of cell 1 and 2, respectively. Notice the clearly different firing pattern of the two cells. C, Current pulses (645 ms duration, 280 pA amplitude) injected at different times in the two cells resulted in spikelets in the noninjected neuron. D, Electrical coupling was blocked in a partially reversible manner by carbenoxolone (100 μm). The traces show the voltage responses of both cells to a –100 pA current step injected to cell 1 in control ACSF (left), in the presence of carbenoxolone (middle), and during washout of the drug (right).
Figure 8.

Heterologous electrical coupling between stratum lacunosum-moleculare interneurons. A, Characterization of the intrinsic excitability of three interneurons (records from the 3 cells are marked V1, V2, and V3, respectively) with current steps of –100 pA, threshold (left), and 80 pA above threshold (right). Notice the different firing pattern of the three cells. B, Electrical coupling in response to steps of ±100 pA reveals the pattern of connectivity among the three tested neurons. Traces are averages of 50 sweeps. Note that cell 1 is connected to both cells 2 and 3, whereas cells 2 and 3 are not reciprocally coupled. Insets show the voltage responses from coupled cells at a magnified scale after baseline alignment. C, D, Another example from a similar triple recording with interneurons showing different firing patterns and reciprocal connectivity. Connectivity was tested with pulses of –100 pA in the negative directions; traces are averages of 66 sweeps. A set of 30 suprathreshold steps was used in the positive direction (average amplitude, 155 pA). Note that cell 1 is connected to both cells 2 and 3, whereas cells 2 and 3 are not reciprocally coupled.
Although visual inspection of the firing pattern of connected cells clearly indicated that electrically different interneurons were often coupled, we reasoned that it was crucial to objectively quantify this degree of connectivity as a function of the relative diversity of the excitable properties of the coupled neurons.
To address this point, we performed PCA on the five variables (mean ISI, CV ISI, ratio ISI, ratio AP, and AHP timing) measured from the firing pattern responses of 323 neurons that had been tested for electrical coupling in double or triple recordings (Fig. 9A,B; factor loadings are shown in C). The first three factors accounted for 74.7% of the total variance (eigen values: factor 1, 1.640; factor 2, 1.137; factor 3, 0.959; and cumulative percentage: factor 1, 32.8%; factor 2, 55.5%; factor 3, 74.7%). We decided to examine the degree of dissimilarity between the electrical properties of the neurons of the database as Euclidean distances and to relate the measured distances to the presence or absence of electrical coupling. The average Euclidean distance between cells that were not electrically coupled was 0.103 ± 0.014 (n = 137 connection tested), which compared with a mean value of 0.100 ± 0.006 (n = 71; p > 0.05, Mann–Whitney test) in neurons with verified electrical connections. However, the mean value of the Euclidean distance does not give information about how this measurement was distributed. We considered the possibility that, despite the similar mean value, a difference in the shape of the distribution of the Euclidean distances could affect the probability of finding connections because of the different occurrence of specific a range of values in the two datasets. However, when we compared the two cumulative distributions, they were not statistically different (Kolmogorov Smirnoff test, p > 0.05) (Fig. 9D).
Figure 9.

PCA analysis of excitability in electrically coupled versus uncoupled stratum lacunosum-moleculare interneurons. A, B, Three-dimensional summary plot showing the position along the three principal components of all interneurons tested for electrical connectivity (black symbols). The connections tested are represented by the lines between the symbols. To facilitate the visibility of most points, the scale excludes the two furthest points of the dataset (see lines exiting the borders of the plots). Combinations that were found electrically uncoupled are shown by the lines in A, whereas electrophysiologically verified combinations of coupled cells are represented by the lines in B. C, Factor loadings (correlations) for each variable are shown in histogram form (white, factor 1; gray, factor 2; and black, factor 3). D, The cumulative distributions of the Euclidean distances in the cases of unconnected (u) and connected (c) neurons are superimposed. Notice the similarity between the two curves.
In conclusion, the results of this analysis indicate that electrical coupling in our sample did not depend on the relative similarity of the excitable properties of the pair tested. We further quantified the probability of finding a connection as a function of the Euclidean distance of the tested pairs. The probability was calculated for Euclidean distances binned as shown in Figure 10. As expected, no correlation was found (F test, p > 0.05).
Figure 10.

The probability of finding a connected pair of neurons in our sample does not depend on the Euclidean distances measured from the plots shown in Figure 9. A, Examples of firing pattern sweeps (80 pA above threshold level current pulse) from pairs of neurons with different Euclidean distances. Notice the increasing diversity with the larger Euclidean distance. B, Top, Histogram distribution of the number of overall pairs of neurons tested for electrical coupling. Bottom, Lack of correlation between Euclidean distance of the tested pair and probability of finding electrical coupling. The probability of finding a connection was calculated for every bin and plotted against the Euclidean distance in the center of the bin. Linear regression (dotted line) was weighted according to the number of pairs tested for every bin.
In conclusion, the probability of finding an electrically coupled pair between two stratum lacunosum-moleculare interneurons in our sample, independently of their firing pattern, was relatively high, resulting in a value of 0.34.
Discussion
The main finding of this work is that hippocampal interneurons with different intrinsic excitability are electrically coupled. Our conclusion is based on electrophysiological and pharmacological evidence acquired from single and multiple recordings. Overall, our results indicate that the organizing principles based on the similar-to-similar coupling rule described in many inhibitory networks are not followed by every class of interneuron in the hippocampus.
Interneurons and stratum lacunosum-moleculare network
In the CA1 subfield of the hippocampus, stratum lacunosum-moleculare receives excitatory input from several extra hippocampal regions, including the nucleus reiuniens of the thalamus (Wouterlood et al., 1990), the inferotemporal cortex (Yukie and Iwai, 1988), and the direct input originating from layer III of the entorhinal cortex [temporoammonic (TA) pathway] (Steward and Scoville, 1976). Of these three sources of information, the TA projection is thought to be critical for the bidirectional modulation of the Schaffer collateral input leading to spiking activity and synaptic plasticity (Remondes and Schuman, 2002) in CA1 pyramidal cells, which are the output neurons of the hippocampus. These cellular and network basic mechanisms are likely to be involved in the consolidation of spatial long-term memory, which is impaired after lesion of the TA pathway (Remondes and Schuman, 2004).
Several studies have also shown that inhibitory interneurons in stratum lacunosum-moleculare are synaptically activated in a feedforward manner by the TA input or the Schaffer collateral (Kunkel et al., 1988; Lacaille and Schwartzkroin, 1988; Khazipov et al., 1995; Morin et al., 1996) and release GABA on postsynaptic pyramidal cells, thus generating IPSPs (Lacaille and Schwartzkroin, 1988; Empson and Heinemann, 1995; Vida et al., 1998; Bertrand and Lacaille, 2001). Different types of stratum lacunosum-moleculare interneurons have been shown to target specific postsynaptic domains, which are associated with specific layers receiving excitatory input from different sources (Vida et al., 1998). Nevertheless, despite the potential importance of stratum lacunosum-moleculare interneurons for the regulation of a circuit involved in higher cognitive functions, some essential data on their network organization are still missing. In particular, little is known, at present, about their electrical coupling.
Electrical heterogeneity of stratum lacunosum-moleculare interneurons
When we examined the anatomy of the recorded interneurons, we realized that the firing pattern was different not only across different anatomical types but also within a group of small multipolar interneurons displaying a stereotyped morphology. In particular, the morphological appearance of these latter interneurons was consistent with the previously reported description of neurogliaform cells. The firing pattern of the “late-spiking” neurogliaform cells of neocortical layer II/III reported by Kawaguchi (1995) and Tamas et al. (2003) were very similar to our recordings illustrated in Figures 6A and 7B (left panel). On the contrary, the occasional stuttering firing pattern observed by Hestrin and Armstrong (1996) and by Chu et al. (2003) in some neocortical layer I interneurons resembles our recordings of Figures 1B and 7B (right panel). Last, the adapting train of action potentials shown in Figure 1A is reminiscent of the spike trains recorded in hippocampal stratum lacunosum-moleculare neurogliaform cells by Khazipov et al. (1995) and Vida et al. (1998). Our results are also consistent with recent work in the primate layer II/III prefrontal cortex showing distinct firing patterns in anatomically identified neurogliaform interneurons (Krimer et al., 2005).
In conclusion, although some classes of interneurons are known to be associated with a stereotypical firing pattern (Maccaferri and Lacaille, 2003), this may not be a universal case, as reported previously by others (Mott et al., 1997; Parra et al., 1998; Gupta et al., 2000).
Coupling between electrically heterogeneous interneurons
In the hippocampus, immunocytochemical and ultrastructural studies have long suggested the existence of gap junctions between basket cells and interneurons with horizontal dendrites in stratum oriens/alveus (Kosaka and Hama, 1985; Yamamoto et al., 1989; Fukuda and Kosaka, 2000). Recent electrophysiological work has directly demonstrated electrotonic coupling among the broad class of horizontal stratum oriens interneurons (Zhang et al., 2004). However, many different cell types with a variety of physiological properties are included under this denomination (Maccaferri et al., 2000; Maccaferri, 2005), and the relationship between cellular excitability and connectivity was not explored in that study. Thus, the question whether only interneurons with similar excitable membranes can be coupled was left unresolved. A recent report by Price et al. (2005) has provided evidence for homologous electric coupling between anatomically identified neurogliaform cells in the CA1 stratum lacunosum-moleculare. However, the degree of similarity of the firing pattern of the connected neurons was not studied in detail.
This work is the first demonstration of an electrically coupled network in the hippocampus that is also formed by elements with different excitability. Electrical coupling between cells with similar intrinsic excitability has been clearly shown to facilitate the synchronization of inhibitory networks (Galarreta and Hestrin, 1999; Gibson et al., 1999; Beierlein et al., 2000; Bartos et al., 2002). On the contrary, the consequences of gap-junction-mediated coupling between neurons with different intrinsic excitability are complex to predict and may yield different results depending on the strength of the connection (Perez-Velazquez et al., 2001). Theoretical studies have proposed that electric coupling between neurons with different intrinsic properties can lead to antiphasic or asynchronous firing (Sherman and Rinzel, 1992; Chow and Kopell, 2000; Lewis and Rinzel, 2003; Pfeuty et al., 2003).
When the anatomy of the recorded cells was examined in relation to their firing pattern in individual recordings, neurogliaform-like interneurons were the largest proportion of the cells recovered that could be identified as a consistent anatomical group. Therefore, it is likely that this cell type was also widely represented in multiple recordings from coupled cells that were not anatomically recovered. This observation suggests that neurogliaform cells with different excitable properties form a complex inhibitory network in the hippocampus. If the electrical coupling of neurogliaform cells with different excitable properties led to antiphase or asynchronous firing during oscillatory activity, then it could play an important role in ensuring tonic rather than phasic GABAergic release. Furthermore, modulation of the junctional conductance between different neurogliaform cell types could provide a large degree of flexibility in the regulation of GABAergic input during oscillations. Last, the possibility that neurogliaform interneurons are also coupled with different anatomical types should not be excluded. In fact, although neurogliaform interneurons were the most represented cell type recognized in our single recordings, a significant fraction of the recovered neurons had a dendritic structure clearly different from neurogliaform cells, and similar proportions of cell types are likely to have occurred during our multiple recordings. This possibility would be entirely consistent with the recent study of Simon et al. (2005) in the neocortex. Highly promiscuous electrical connectivity would have the potential to create a network of neurons exquisitely sensitive to the general level of activity in inhibitory networks. For example, direct regulation of blood vessels by neurogliaform neurons expressing neuronal nitric oxide synthase (NOS) and neuropeptide Y (NPY) has been reported in neocortical circuits (Cauli et al., 2004). Intriguingly, very recent work by Price et al. (2005) has confirmed that a high percentage of neurogliaform cells in the hippocampal stratum lacunosum-moleculare express the mRNA for both NOS and NPY. Therefore, diffuse electrical coupling might be an essential feature to sense the general level of activity in neuronal networks and translate it into a signal that can be used for the fine regulation of blood flow.
Chemical versus electrical coupling of stratum lacunosum-moleculare interneurons
Work by several groups has shown that electrical coupling in interneurons is often associated with chemical synaptic coupling (Galarreta and Hestrin, 1999; Gibson et al., 1999; Bartos et al., 2001; Blatow et al., 2003; Simon et al., 2005). We did not specifically test for this possibility. Our recording conditions were not optimized to detect GABAergic unitary IPSPs because we recorded cells at membrane potentials associated with a small driving force for GABA receptor-mediated events. Another potential explanation is that we did not test connections at very low frequency, which has been reported to be an essential experimental condition to trigger a postsynaptic response originating from neurogliaform interneurons (Tamas et al., 2003). In addition, in several of the recorded cells the axon appeared to be cut at the surface of the slice before it could generate a significant arborization. If this occurred to similar degrees during single and double recordings, then our results would be consistent with a dendritic location of the gap-junction-mediated connection. A final possibility could be the tonic suppression of GABA release by a presynaptic modulator. For example, work by Losonczy et al. (2003, 2004) has clearly shown that tonic activation of presynaptic receptors can strongly reduce release from GABAergic and glutamatergic terminals in hippocampal slices. Price et al. (2005) have indeed shown recently that tonic GABAB receptor activity modulates GABAergic release from neurogliaform cells. Therefore, our lack of evidence for chemical connections remains inconclusive.
In summary, our results highlight a novel pattern of organization for electrically coupled networks in the hippocampus, which suggests that inhibitory circuits may be more complex than previously thought. This pattern of organization may provide an additional point of regulation for learning and memory.
Footnotes
This work was supported by National Institute of Mental Health Grant 5R01MH067561 (G.M.). We thank Drs. I. Aradi, S. DeVries, M. Martina, I. Mintz, and J. Surmeier for constructive criticism on a previous version of this manuscript. We also thank Dr. M. Bevan for technical advice and help with the anatomical recovery of the recorded cells. We thank Dr. J. Dempster (University of Strathclyde, Glasgow, UK) for providing us with the Whole Cell Program analysis package.
Correspondence should be addressed to Gianmaria Maccaferri, Department of Physiology, Institute for Neuroscience, Northwestern University, Feinberg Medical School, 303 East Chicago Avenue, Tarry Building, Room 5-707 M211, Chicago, IL 60611. E-mail: g-maccaferri@northwestern.edu.
DOI:10.1523/JNEUROSCI.2810-05.2005
Copyright © 2005 Society for Neuroscience 0270-6474/05/258686-10$15.00/0
References
- Aradi I, Maccaferri G (2004) Cell type-specific synaptic dynamics of synchronized bursting in the juvenile CA3 rat hippocampus. J Neurosci 24: 9681–9692. [DOI] [PMC free article] [PubMed] [Google Scholar]
- Bartos M, Vida I, Frotscher M, Geiger JR, Jonas P (2001) Rapid signaling at inhibitory synapses in a dentate gyrus interneuron network. J Neurosci 21: 2687–2698. [DOI] [PMC free article] [PubMed] [Google Scholar]
- Bartos M, Vida I, Frotscher M, Meyer A, Monyer H, Geiger JR, Jonas P (2002) Fast synaptic inhibition promotes synchronized gamma oscillations in hippocampal interneuron networks. Proc Natl Acad Sci USA 99: 13222–13227. [DOI] [PMC free article] [PubMed] [Google Scholar]
- Beierlein M, Gibson JR, Connors BW (2000) A network of electrically coupled interneurons drives synchronized inhibition in neocortex. Nat Neurosci 3: 904–910. [DOI] [PubMed] [Google Scholar]
- Bennett VL, Zukin SR (2004) Electrical coupling and neuronal synchronization in the mammalian brain. Neuron 41: 495–511. [DOI] [PubMed] [Google Scholar]
- Bertrand S, Lacaille JC (2001) Unitary synaptic currents between lacunosum-moleculare interneurones and pyramidal cells in rat hippocampus. J Physiol (Lond) 532: 369–384. [DOI] [PMC free article] [PubMed] [Google Scholar]
- Blatow M, Rozov A, Katona I, Hormuzdi SG, Meyer AH, Whittington MA, Caputi A, Monyer H (2003) A novel network of multipolar bursting interneurons generates theta frequency oscillations in neocortex. Neuron 38: 805–817. [DOI] [PubMed] [Google Scholar]
- Buhl DL, Harris KD, Hormuzdi SG, Monyer H, Buzsaki G (2003) Selective impairment of hippocampal gamma oscillations in connexin-36 knock-out mouse in vivo J Neurosci 23: 1013–1018. [DOI] [PMC free article] [PubMed] [Google Scholar]
- Cauli B, Tong XK, Rancillac A, Serluca N, Lambolez B, Rossier J, Hamel E (2004) Cortical GABA interneurons in neurovascular coupling: relays for subcortical vasoactive pathways. J Neurosci 24: 8940–8949. [DOI] [PMC free article] [PubMed] [Google Scholar]
- Chow CC, Kopell N (2000) Dynamics of spiking neurons with electrical coupling. Neural Comput 12: 1643–1678. [DOI] [PubMed] [Google Scholar]
- Chu Z, Galarreta M, Hestrin S (2003) Synaptic interactions of late-spiking neocortical neurons in layer 1. J Neurosci 23: 96–102. [DOI] [PMC free article] [PubMed] [Google Scholar]
- Connors BW, Long MA (2004) Electrical synapses in the mammalian brain. Annu Rev Neurosci 27: 393–418. [DOI] [PubMed] [Google Scholar]
- Cope DW, Maccaferri G, Marton LF, Roberts JD, Cobden PM, Somogyi P (2002) Cholecystokinin-immunopositive basket and Schaffer collateral-associated interneurons target different domains of pyramidal cells in the CA1 area of the rat hippocampus. Neuroscience 109: 63–80. [DOI] [PubMed] [Google Scholar]
- Deans MR, Gibson JR, Sellitto C, Connors BW, Paul DL (2001) Synchronous activity of inhibitory networks in neocortex requires electrical synapses containing connexin 36. Neuron 31: 477–485. [DOI] [PubMed] [Google Scholar]
- Empson RM, Heinemann U (1995) The perforant path projection to hippocampal area CA1 in the rat hippocampal-entorhinal cortex combined slice. J Physiol (Lond) 484: 707–720. [DOI] [PMC free article] [PubMed] [Google Scholar]
- Freund TF, Buzsaki G (1996) Interneurons of the hippocampus. Hippocampus 6: 347–470. [DOI] [PubMed] [Google Scholar]
- Fukuda T, Kosaka T (2000) Gap Junctions linking the dendritic network of GABAergic interneurons in the hippocampus. J Neurosci 20: 1519–1528. [DOI] [PMC free article] [PubMed] [Google Scholar]
- Galarreta M, Hestrin S (1999) A network of fast-spiking cells in the neocortex connected by electrical synapses. Nature 402: 72–75. [DOI] [PubMed] [Google Scholar]
- Galarreta M, Hestrin S (2001) Electrical synapses between GABA-releasing interneurons. Nat Rev Neurosci 2: 425–433. [DOI] [PubMed] [Google Scholar]
- Galarreta M, Hestrin S (2002) Electrical and chemical synapses among parvalbumin fast-spiking GABAergic interneurons in adult mouse neocortex. Proc Natl Acad Sci USA 99: 12438–12443. [DOI] [PMC free article] [PubMed] [Google Scholar]
- Galarreta M, Erdelyi F, Szabo G, Hestrin S (2004) Electrical coupling among irregular-spiking GABAergic interneuron expressing cannabinoid receptors. J Neurosci 24: 9770–9778. [DOI] [PMC free article] [PubMed] [Google Scholar]
- Gibson JR, Beierlein M, Connors BW (1999) Two networks of electrically coupled inhibitory neurons in neocortex. Nature 402: 75–79. [DOI] [PubMed] [Google Scholar]
- Gupta A, Wang Y, Markram H (2000) Organizing principles for a diversity of GABAergic interneruons and synapses in the neocortex. Science 287: 273–278. [DOI] [PubMed] [Google Scholar]
- Hestrin S, Armstrong WE (1996) Morphology and physiology of cortical neurons in layer I. J Neurosci 16: 5290–5300. [DOI] [PMC free article] [PubMed] [Google Scholar]
- Hormuzdi SG, Pais I, LeBeau F, Towers SK, Rozov A, Buhl EH, Whittington MA, Monyer H (2001) Impaired electrical signaling disrupts frequency oscillations in connexin 36-deficient mice. Neuron 31: 487–495. [DOI] [PubMed] [Google Scholar]
- Hormuzdi SG, Filippov MA, Mitropoulou G, Monyer H, Bruzzone R (2004) Electrical synapses: a dynamic signaling system that shapes the activity of neuronal networks. Biochim Biophys Acta 1662: 113–137. [DOI] [PubMed] [Google Scholar]
- Joliffe IT (1986) Principal component analysis. New York: Springer.
- Kawaguchi Y (1995) Physiological subgroups of nonpyramidal cells with specific morphological charachteristics in layer II/III of rat frontal cortex. J Neurosci 15: 2638–2655. [DOI] [PMC free article] [PubMed] [Google Scholar]
- Khazipov R, Congar P, Ben-Ari Y (1995) Hippocampal CA1 lacunosum-moleculare interneurons: comparison of effects of anoxia on excitatory and inhibitory postsynaptic currents. J Neurophysiol 74: 2138–2149. [DOI] [PubMed] [Google Scholar]
- Kosaka T, Hama K (1985) Gap junctions between non-pyramidal cell dendrites in rat hippocampus (CA1 and CA3 regions): a combined Golgielectron microscope study. J Comp Neurol 231: 150–161. [DOI] [PubMed] [Google Scholar]
- Krimer LS, Zaitsev AV, Czanner G, Kroner S, Gonzales-Burgos G, Povysheva NV, Iyengar S, Barrionuevo G, Lewis DA (2005) Cluster analysis-based physiological classification and morphological properties of inhibitory neurons in layers 2–3 of monkey dorsolateral prefrontal cortex. J Neurophysiol, in press. [DOI] [PubMed]
- Kunkel DD, Lacaille JC, Schwartzkroin PA (1988) Ultrastructure of stratum lacunosum-moleculare interneurons of hippocampal CA1 region. Synapse 2: 382–394. [DOI] [PubMed] [Google Scholar]
- Lacaille JC, Schwartzkroin PA (1988) Stratum lacunosum-moleculare interneurons of hippocampal CA1 region. II. Intrasomatic and intradendritic recordings of local circuit synaptic interactions. J Neurosci 8: 1411–1424. [DOI] [PMC free article] [PubMed] [Google Scholar]
- Lewis TJ, Rinzel J (2003) Dynamics of spiking neurons connected by both inhibitory and electrical coupling. J Comput Neurosci 14: 283–309. [DOI] [PubMed] [Google Scholar]
- Losonczy A, Somogyi P, Nusser Z (2003) Reduction of excitatory postsynaptic responses by persistently active metabotropic glutamate receptors in the hippocampus. J Neurophysiol 89: 1910–1919. [DOI] [PubMed] [Google Scholar]
- Losonczy A, Biro AA, Nusser Z (2004) Persistently active cannabinoid receptors mute a subpopulation of hippocampal interneurons. Proc Natl Acad Sci USA 101: 1362–1367. [DOI] [PMC free article] [PubMed] [Google Scholar]
- Maccaferri G (2005) Stratum oriens horizontal interneurone diversity and hippocampal network dynamics. J Physiol (Lond) 562: 73–80. [DOI] [PMC free article] [PubMed] [Google Scholar]
- Maccaferri G, Dingledine R (2002) Control of feedforward dendritic inhibition by NMDA recptor-dependent spike timing in hippocampal interneurons. J Neurosci 22: 5462–5472. [DOI] [PMC free article] [PubMed] [Google Scholar]
- Maccaferri G, Lacaille JC (2003) Interneuron diversity series: hippocampal classifications—making things as simple as possible, not simpler. Trends Neurosci 26: 564–571. [DOI] [PubMed] [Google Scholar]
- Maccaferri G, Roberts JDB, Szucs P, Cottingham C, Somogyi P (2000) Cell surface domain specific postsynaptic currents evoked by identified GABAergic neurones in rat hippocampus in vitro. J Physiol (Lond) 524: 91–116. [DOI] [PMC free article] [PubMed] [Google Scholar]
- Maier N, Guldenagel M, Sohl G, Siegmund H, Willecke K, Draguhn A (2002) Reduction of high-frequency network oscillations (ripples) and pathological network discharges in hippocampal slices from connexin 36-deficient mice. J Physiol (Lond) 541: 521–528. [DOI] [PMC free article] [PubMed] [Google Scholar]
- Mainen ZF, Sejnowski TJ (1996) Influence of dendritic structure on firing pattern in model neocortical neurons. Nature 382: 363–366. [DOI] [PubMed] [Google Scholar]
- Meyer AH, Katona I, Blatow M, Rozov A, Monyer H (2002) In vivo labeling of parvalbumin-positive interneurons and analysis of electrical coupling in identified neurons. J Neurosci 22: 7055–7064. [DOI] [PMC free article] [PubMed] [Google Scholar]
- Morin F, Beaulieu C, Lacaille JC (1996) Membrane properties and synaptic currents evoked in CA1 interneuron subtypes in rat hippocampal slices. J Neurophysiol 76: 1–16. [DOI] [PubMed] [Google Scholar]
- Mott DD, Turner DA, Okazaki MM, Lewis DV (1997) Interneurons of the dentate-hilus border of the rat dentate gyrus: morphological and electrophysiological heterogeneity. J Neurosci 17: 3990–4005. [DOI] [PMC free article] [PubMed] [Google Scholar]
- Neher E (1992) Correction for liquid junction potentials in patch clamp experiments. Methods Enzymol 207: 123–131. [DOI] [PubMed] [Google Scholar]
- Pais I, Hormuzdi SG, Monyer H, Traub RD, Wood IC, Buhl EH, Whittington MA, LeBeau FE (2003) Sharp wave-like activity in the hippocampus in vitro in mice lacking the gap junction protein connexin 36. J Neurophysiol 89: 2046–2054. [DOI] [PubMed] [Google Scholar]
- Parra P, Gulyas AI, Miles R (1998) How many subtypes of inhibitory cells in the hippocampus? Neuron 20: 983–993. [DOI] [PubMed] [Google Scholar]
- Perez-Velazquez JL, Carlen PL, Skinner FK (2001) Artificial electrotonic coupling affects neuronal firing patterns depending upon cellular characteristics. Neuroscience 103: 841–849. [DOI] [PubMed] [Google Scholar]
- Pfeuty B, Mato G, Golomb D, Hansel D (2003) Electrical synapses and synchrony: the role of intrinsic currents. J Neurosci 23: 6280–6294. [DOI] [PMC free article] [PubMed] [Google Scholar]
- Price CJ, Cauli B, Kovacs ER, Kulik A, Lambolez B, Shigemoto R, Capogna M (2005) Neurogliaform neurons form a novel inhibitory network in the hippocampal CA1 area. J Neurosci 25: 6775–6786. [DOI] [PMC free article] [PubMed] [Google Scholar]
- Remondes M, Schuman EM (2002) Direct cortical input modulates plasticity and spiking in CA1 pyramidal neurons. Nature 416: 736–740. [DOI] [PubMed] [Google Scholar]
- Remondes M, Schuman EM (2004) Role for a cortical input to the hippocampal area CA1 in the consolidation of a long-term memory. Nature 431: 699–703. [DOI] [PubMed] [Google Scholar]
- Sherman A, Rinzel J (1992) Rhythmogenic effects of weak electrotonic coupling in neuronal models. Proc Natl Acad Sci USA 89: 2471–2474. [DOI] [PMC free article] [PubMed] [Google Scholar]
- Simon A, Szabolcs O, Molnar G, Szabadics J, Tamas G (2005) Gap-junctional coupling between neurogliaform cells and various interneuron types in the neocortex. J Neurosci 25: 6278–6285. [DOI] [PMC free article] [PubMed] [Google Scholar]
- Steward O, Scoville SA (1976) Cells of origin of entorhinal cortical afferents to the hippocampus and fascia dentata of the rat. J Comp Neurol 169: 347–370. [DOI] [PubMed] [Google Scholar]
- Szabadics J, Lorincz A, Tamas G (2001) β and γ frequency synchronization by dendritic GABAergic synapses and gap junctions in a network of cortical interneurons. J Neurosci 21: 5824–5831. [DOI] [PMC free article] [PubMed] [Google Scholar]
- Tamas G, Lorincz A, Simon A, Szabadics J (2003) Identified sources and targets of slow inhibition in the neocortex. Science 299: 1902–1905. [DOI] [PubMed] [Google Scholar]
- Venance L, Rozov A, Blatow M, Burnashev N, Feldmayer D, Monyer H (2000) Connexin expression in electrically coupled postnatal rat brain neurons. Proc Natl Acad Sci USA 97: 10260–10265. [DOI] [PMC free article] [PubMed] [Google Scholar]
- Vida I, Halasy K, Szinyei C, Somogyi P, Buhl EH (1998) Unitary IPSPs evoked by interneurons at stratum radiatum-stratum lacunosum-moleculare border in the CA1 area of the rat hippocampus in vitro. J Physiol (Lond) 506: 755–773. [DOI] [PMC free article] [PubMed] [Google Scholar]
- Whittington MA, Traub RD (2003) Interneuron diversity series: inhibitory interneurons and network oscillations in vitro. Trends Neurosci 26: 676–682. [DOI] [PubMed] [Google Scholar]
- Williams S, Samulack DD, Beaulieu C, Lacaille JC (1994) Membrane properties and synaptic responses of interneurons located near the stratum lacunosum-moleculare/radiatum border of area CA1 in whole-cell recordings from rat hippocampal slices. J Neurophys 71: 2217–2235. [DOI] [PubMed] [Google Scholar]
- Wouterlood FG, Saldana E, Witter MP (1990) Projections from the nucleus reunions thalami to the hippocampal region: light and electron microscopic tracing study in the rat with the anterograde tracer Phaeolus vulgaris-leucoagglutinin. J Comp Neurol 296: 179–203. [DOI] [PubMed] [Google Scholar]
- Yamamoto T, Shiosaka S, Whittaker ME, Hertzberg EL, Nagy JI (1989) Gap junction protein in rat hippocampus: light microscope immunohistochemical localization. J Comp Neurol 281: 282–297. [DOI] [PubMed] [Google Scholar]
- Yukie M, Iwai E (1988) Direct projections from the ventral TE area of the inferotemporal cortex to the hippocampal field CA1 in the monkey. Neurosci Lett 88: 6–10. [DOI] [PubMed] [Google Scholar]
- Zhang XL, Zhang L, Carlen PL (2004) Electrotonic coupling between stratum oriens interneurones in the intact in vitro mouse juvenile hippocampus. J Physiol (Lond) 558: 825–839. [DOI] [PMC free article] [PubMed] [Google Scholar]