

Abstract
Oligodendrocyte maturation has been defined based on expression of developmentally regulated antigens. However, transitions at early stages of the lineage have not been functionally characterized fully in situ. Combining 2′,3′-cyclic nucleotide 3′-phosphodiesterase (CNP)-promoter driven enhanced green fluorescent protein expression and whole-cell capacitance measurements permitted a reliable distinction between subcortical white matter NG2+ oligodendrocyte progenitors (OPs) and O4+ preoligodendrocytes (pre-OLs) in situ. We focused on K+ channels because their expression has been associated previously with the proliferation and differentiation potential of OPs. Using whole-cell patch clamp, we observed a downregulation of the delayed outward-rectifying current (IKDR) between the NG2+ and O4+ stages but no significant changes in transient K+-channel current (IKA) amplitude. Tyrosine kinase inhibition in NG2+ cells reduced IKDR amplitude with no effect on IKA, which mimicked the endogenous changes observed between OPs and pre-OLs. Tyrosine kinase inhibition also reduced the proliferative capacity of NG2+ OPs in slice cultures. Conversely, acute platelet-derived growth factor receptor-α (PDGFR-α) activation caused an increase of IKDR in NG2+ but not in O4+ cells. Consistent with this finding, PDGFR-α immunoreactivity was confined to NG2+ cells with undetectable levels in O4+ cells, suggesting that PDGFR-α signaling is absent in pre-OLs in situ. Importantly, the PDGF-induced increase of IKDR in NG2+ cells was prevented by tyrosine kinase inhibition. Together, these data indicate that PDGFR-α and tyrosine kinase activity act via a common pathway that influences functional expression of K+ channels and proliferative capacity of OPs in situ.
Keywords: oligodendrocyte progenitor, whole-cell patch clamp, white matter, CNP-EGFP mouse, cell proliferation, maturation
Introduction
Oligodendrocyte development involves a sequence of cellular transitions from the proliferative oligodendrocyte progenitor cells (OPs) to mature oligodendrocytes. Distinct phases of oligodendrocyte maturation can be identified by expression of stage-specific antigens. In the white matter, chondroitin sulfate proteoglycan NG2, O4 antigen, and cyclic nucleotide phosphodiesterase (CNP) protein are indicative of OPs, pre-oligodendrocytes (pre-OLs), and mature oligodendrocytes, respectively (Rogister et al., 1999; Baumann and Pham-Dinh, 2001).
Oligodendrocyte lineage cells display functional ion channels, and much of our knowledge about their expression and regulation has come from OP culture paradigms (Sontheimer et al., 1989; Attali et al., 1997; Knutson et al., 1997; Peretz et al., 1999; Schmidt et al., 1999; Chittajallu et al., 2002). The expression of the delayed outward-rectifying K+-channel (KDR) is linked to cell cycle regulation and hence proliferative capacity because of the following: (1) a downregulation of KDR occurs as oligodendrocyte lineage cells mature (Sontheimer et al., 1989; Barres et al., 1990); (2) proliferative OPs express larger KDR currents (IKDR) and higher levels of Kv1 subunit expression than cell cycle-arrested OPs (Knutson et al., 1997; Chittajallu et al., 2002); (3) pharmacological block of IKDR is sufficient to cause cell cycle arrest (Gallo et al., 1996; Knutson et al., 1997; Ghiani et al., 1999; Schmidt et al., 1999; Chittajallu et al., 2002); and (4) overexpression of specific Kv1 subunits can induce OP proliferation in the absence of mitogens (Vautier et al., 2004). Although the molecular identity of the KDR channel subunits linked to the proliferative capacity of OPs in vitro has been investigated (Attali et al., 1997; Schmidt et al., 1999; Chittajallu et al., 2002; Soliven et al., 2003; Vautier et al., 2004), the actual cellular mechanisms underlying IKDR regulation in an environment closer to the in vivo scenario remain unexplored.
Previous functional studies performed in situ have only examined K+-channel expression at the two extremes of oligodendrocyte development, i.e., OPs and/or differentiated oligodendrocytes, or have not accurately identified the lineage stage of the recorded cells (Berger et al., 1991; Chittajallu et al., 2002; Gipson and Bordey, 2002; Nashmi et al., 2002; Yuan et al., 2002). Therefore, relatively little is known about the time course of ion channel regulation with regard to intermediate lineage stages, such as those characterized by O4 expression. Acquisition of O4 by white matter OPs represents the point of commitment to the oligodendrocyte lineage, and hence examining any functional differences between NG2- and O4-expressing cells is of primary importance in understanding the physiological mechanisms underlying oligodendrogliogenesis.
A major hurdle in performing functional studies in situ is the visualization of oligodendrocyte lineage cells. Even more technically challenging is the reliable identification of their exact developmental stage. Here, we use the CNP-enhanced green fluorescent protein (EGFP) transgenic mouse (Belachew et al., 2001; Yuan et al., 2002) to target oligodendrocyte lineage cells in acutely isolated slices. We develop a strategy to distinguish between NG2+/O4– and NG2–/O4+ cells in the subcortical white matter, thus permitting whole-cell patch-clamp recordings to measure K+-channel expression at these two distinct lineage stages. We demonstrate that pharmacological block of platelet-derived growth factor (PDGF) receptor expression and tyrosine kinase activity leads to a downregulation of KDR channels and reduction in proliferation during early oligodendrocyte lineage transition.
Materials and Methods
Materials. The generation of the CNP-EGFP mouse used throughout this study has been described previously (Yuan et al., 2002), and animal procedures complied with the National Institutes of Health and Children's Research Institute guidelines. In the present study, two separate CNP-EGFP transgenic lines were used (C1 and D1), and the data were pooled because no differences were noted between the two. All reagents were from Sigma (St. Louis, MO), unless otherwise stated. PDGF-AB was from Upstate Biotechnology (Waltham, MA). Genistein and daidzein (4′,7-dihydroxyisoflavone) were from EMD Biosciences (La Jolla, CA). Antibodies used in the study and working dilutions are as follows: rabbit polyclonal anti-NG2 (1:500), anti-Ki67 (1:500), and anti-cleaved caspase-3 (1:500) were from Chemicon (Temecula, CA), Nova Castra (Newcastle-Upon-Tyne, UK), and Cell Signaling Technology (Beverly, MA). Rabbit polyclonal anti-PDGF receptor-α (PDGFR-α) (1:200) used in immunostaining of fixed brain sections was from Santa Cruz Biotechnology (Santa Cruz, CA) (C-20). Neutralizing anti-PDGFR-α (5 μg/ml; catalog #AF-307-NA) used in the electrophysiological experiments to functionally antagonize the PDGFR-α wasfromR&D Systems (Minneapolis, MN). This antibody was raised in goat with Sf 21 cell-derived rhPDGFR-α extracellular domain as the immunogen. Mouse O4 hybridoma supernatant (1:20) was from American Type Culture Collection (Manassas, VA). Monoclonal anti-CNP (1:500) was from Sternberger Monoclonals (Lutherville, MD). Normal/preimmune control rabbit IgG was from Alpha Diagnostic International (San Antonio, TX). Cyanine 5-, rhodamine-, and Texas Red-conjugated secondary antibodies were from Jackson ImmunoResearch (West Grove, PA) and were all used at a dilution of 1:200.
Electrophysiology. Postnatal day 4 (P4) to P7 CNP-EGFP mice were anesthetized with isoflurane and decapitated, and brains were removed. Acutely isolated coronal slices (300 μm) were prepared as described previously (Chittajallu et al., 2004). After a 1 h recovery period, slices were transferred to a recording chamber and perfused with extracellular solution of the following composition: 124 mm NaCl, 3 mm KCl, 2.5 mm CaCl2, 1.3 mm MgSO4, 26 mm NaHCO3, 1.25 mm NaHPO4, 15 mm glucose, and 1 μm tetrodotoxin, saturated with 95% O2/5% CO2 at room temperature. For assessment of drug application on K+-channel expression, we adopted a preincubation protocol to avoid possible washout of intracellular mediators of any drug effects that could arise after whole-cell access. Therefore, in experiments in which drug application was required, slices were transferred to a second holding chamber containing 30 μm genistein, 30 μm daidzein, 10 μm lavendustin A, 20 ng/ml PDGF, 5 μg/ml anti-PDGFR-α, or 5 μg/ml normal/preimmune control rabbit IgG (or a combination of two drugs) for incubation times indicated in the figure legends. After the preincubation, slices were placed in the recording chamber and whole-cell recording was performed. Note that the perfusion solution also contained the same concentration of the drug(s) in which the slices were preincubated. Furthermore, in all cases, control slices preincubated in drug-free extracellular solution for the same incubation period were recorded from in an interleaved manner. EGFP+ cells were identified as described previously (Chittajallu et al., 2004). In the current study, EGFP+ cells in the subcortical white matter were targeted. Patch electrodes had resistances between 4 and 8 MΩ when filled with intracellular solution of the following composition: 130 mm K-gluconate, 10 mm NaCl, 2 mm Mg-ATP, 0.3 mm Na-GTP, 10 mm HEPES, 0.6 mm EGTA, and 0.3% biocytin, adjusted to pH 7.2, 275 mOsm. The cells were voltage clamped at –60 mV. Before whole-cell recording, whole-cell capacitances and series resistances (to at least 85%) were compensated, and the corresponding values were read directly from the amplifier. Uncompensated series resistance values ranged from 6 to 19 MΩ, and average series resistances were not significantly different between comparison cell groups (p > 0.05, Mann–Whitney U test). Depolarizing voltage-step protocols to isolate IKDR and A-type transient K+-channel currents (IKA) and activation profile analysis with Boltzmann curve fitting were as described previously (Knutson et al., 1997; Chittajallu et al., 2002). In all of the experiments, an Axopatch 200B amplifier was used for voltage clamp (Molecular Devices, Union City, CA). Data were filtered at 10 and 5 kHz during capacitance compensation and subsequent data recording, respectively. In all cases, the traces were digitized at 10 kHz. All voltage measurements and steps were corrected for a junction potential offset. Off-line analysis was performed using Clampfit (Molecular Devices).
Immunocytochemistry. Visualization of single biocytin-filled, recorded EGFP+ cells and subsequent immunocytochemical characterization with anti-NG2, anti-O4, or anti-CNP was performed as described previously (Chittajallu et al., 2004). For immunocytochemistry in tissue sections, P4–P7 CNP-EGFP mice were anesthetized with isofluorane and intracardially perfused with fixative (4% paraformaldehyde), and the brain was removed. Frozen coronal tissue sections (30–40 μm) were prepared and immunostained as described previously (Belachew et al., 2003). Images were acquired using either a Bio-Rad (Hercules, CA) MRC-1024 confocal laser scanning microscope as previously described (Aguirre et al., 2004) or a Zeiss (Oberkochen, Germany) LSM 510. For all images, z sections and z steps ranged between 18–28 and 2–3 μm, respectively. Images were subsequently processed using Confocal Assistant (Todd Clark Brelje, University of Minnesota, Minneapolis, MN), LSM Image Examiner (Zeiss), or Adobe Photoshop/Illustrator (Adobe Systems, San Jose, CA). Cell counting was performed in the subcortical white matter from two to four 50 μm sections (see Fig. 1 A) from at least three separate P4–P7 CNP-EGFP mice. Only cells that coexpressed EGFP and the antigenic marker(s) in question were included in the counts.
Figure 1.

Correlation of EGFP+ whole-cell capacitance with NG2, O4, and CNP immunoreactivity in developing white matter. A, Coronal section of a single brain hemisphere from a P7 CNP-EGFP mouse illustrating the area (see dotted area) in which all EGFP+ cells were targeted for whole-cell voltage-clamp recordings and also for immunocytochemical cell counting. lv, Lateral ventricle; wm, white matter. B, After measurement of whole-cell capacitance of white matter EGFP+ cells, post hoc immunostaining for NG2, O4, or CNP-protein was performed. The graph illustrates the distribution of EGFP+ cells that were found to be positive or negative for these proteins as a function of whole-cell capacitance. C, Single example of a 17 pF white matter EGFP+ cell that was NG2+. Scale bar, 20 μm. D, Single example of a 55 pF white matter EGFP+ cell that was O4+. Scale bar, 20 μm. Note the larger cell body and complex arborization compared with the NG2+ progenitor. E, Single example of a 124 pF white matter EGFP+ cell that was CNP protein+. Note the presence of parallel fibers indicative of axonal myelination. Scale bar, 50 μm. F, Capacitive transients of the NG2+ (green), O4+ (blue), and CNP-protein+ (red) cells shown in C–E before compensation (in response toa5mV depolarizing step from a holding potential of –60 mV). The actual whole-cell capacitance values were directly read from the amplifier after cancellation of the transients as described in Materials and Methods. G, Bar graph depicting the percentage of NG2+, O4+, and CNP-protein+ cells that possessed whole-cell capacitance values of either 10–30 or 60–90 pF. All cells were recorded from coronal slices of P4–P7 CNP-EGFP mice.
CNP-EGFP organotypic slice cultures. The following methodology is based on that described previously (Yuan et al., 1998). Coronal sections (150–200 μm) from P5–P7 CNP-EGFP mice were obtained using a Leica (Nussloch, Germany) VT-1000S vibratome in dissection media of the following composition: 0.3% glucose, 0.75% sucrose, 100 U/ml penicillin, and 100 μg/ml streptomycin in HBSS. Sections were placed on Transwell collagen-coated polytetrafluoroethylene membranes (24 mm diameter, 3 μm pore size; Corning, Corning, NY) and cultured in DMEM/F-12 medium (Invitrogen, Carlsbad, CA) containing the following: 100 U/ml penicillin (Biosource, Rockville, MD), 100 μg/ml streptomycin (Biosource), 0.05 mg/ml human apotransferrin, 10 ng/ml biotin, 25 nm Na-selenite, 2.5 μg/ml insulin, 100 μm putrescine, 20 nm progesterone, and 5% FBS (HyClone, Logan, UT). Groups of two to three slices were placed on each membrane and maintained in culture for a total of 30–32 h. After 5–7 h in culture, genistein (30 μm), daidzein (30 μm), tetraethylammonium (TEA) (1 mm), staurosporine (10 μm), or appropriate vehicles for controls were added to the incubation medium. Drug treatments lasted for 24 h, after which the slices were fixed with 4% paraformaldehyde overnight at 4°C. The slices were then immunostained with anti-Ki67 or anti-cleaved caspase-3. Each experiment used coronal sections from two CNP-EGFP mice, and each experimental condition consisted of two to three slices. After confocal imaging (two to four microscopic fields per slice, 368 μm2), the numbers of white matter Ki67+/EGFP+ or cleaved caspase-3+/EGFP+ cells were calculated as a percentage of total white matter EGFP+ cells (total number of cells counted, 63–109 per microscopic field).
Proliferation assays of cultured oligodendrocyte progenitors. Primary OP cultures were prepared as described previously (Chew et al., 2005). OPs were plated at a density of 3 × 10⁴ cells/cm2 on poly-d-ornithine-coated 24 mm glass coverslips and cultured in DMEM–N1 biotin-containing media for 2–4 h. OPs were either not treated (i.e., N1) or treated with 10 ng/ml PDGF. In certain cultures, 5 μg/ml anti-PDGFR-α was added to the media 1 h before the addition of PDGF. OPs were incubated for an additional 24–30 h, fixed with 4% paraformaldehyde, and processed for 4′,6′-diamidino-2-phenylindole (DAPI) and Ki67 staining as described previously (Chew et al., 2005). Cell proliferation was assessed by quantifying the number of Ki67+ cells as a percentage of DAPI-positive cells
Statistical analysis. All statistical analysis comparing appropriate control versus drug-treated conditions were performed with the Mann–Whitney U test, and results were deemed significantly different if p < 0.05: *p < 0.05, **p < 0.01; ns indicates not significant (i.e., p > 0.05).
Results
Prediction of NG2 and O4 expression in white matter EGFP+ cells by use of whole-cell capacitance measurements
All electrophysiological recordings were performed in subcortical white matter EGFP+ cells of P4–P7 CNP-EGFP mice (Fig. 1A). Using a combined electrophysiological and post hoc immunocytochemical approach, we initially characterized the EGFP+ cells in this brain region with respect to their developmental stage within the oligodendrocyte lineage. We hypothesized that, as cells progressed along the lineage to maturity, the overall complexity of the cell and hence surface area of the cellular membrane would increase. A similar approach using fractal analysis of cell morphology has been used to successfully distinguish between oligodendrocyte lineage stages in vitro (Bernard et al., 2001). In the current study, we used whole-cell capacitance values as a direct measure of membrane surface area and hence cell size and complexity. We correlated these values with specific stages of oligodendrocyte development by post hoc immunocytochemistry and determined the expression of NG2 (OP), O4 (pre-OL/immature oligodendrocyte), and CNP-protein (mature oligodendrocyte) to define the distinct stages of oligodendrocyte development.
Our data show that 95% (19 of 20 EGFP+ cells tested) with whole-cell capacitance values ranging between 10 and 30 pF expressed NG2 (Fig, 1B,C,G). Furthermore, only 11% (1 of 9 cells tested) and 0% (0 of 5 cells tested) of cells within this range of capacitances were immunopositive for O4 and CNP protein, respectively (Fig. 1B,G). In contrast, ∼92% (11 of 12 EGFP+ cells tested) that had whole-cell capacitances between 60 and 90 pF were found to be O4+ (Fig. 1B,D,G), with only 0% (0 of 13 cells tested) and 9% (1 of 11 cells tested) of cells with this higher range of capacitances expressing NG2 and CNP-protein, respectively (Fig. 1B,G). These data illustrate that a high percentage of white matter EGFP+ cells with capacitances between 10 and 30 pF are NG2+/O4–/CNP-protein–, and, similarly, a high percentage of EGFP+ cells with capacitances ranging from 60 to 90 pF are NG2–/O4+/CNP-protein– (Fig. 1B,G). Therefore, only analyzing data from cells within these two groups of whole-cell capacitance values greatly minimizes inclusion of data from NG2+/O4+ transition cells. For the remainder of the manuscript, the 10–30 and 60–90 pF white matter EGFP+ cells will be referred to as NG2+ and O4+ cells, respectively. Thus, for the majority of the following results presented, EGFP+ cells were classified as NG2+ or O4+ solely based on the cell capacitance criterion, without further post hoc immunocytochemical identification.
The single-cell post hoc immunocytochemical and whole-cell capacitance data (Fig. 1B) suggest that lineage overlap between NG2+ and O4+ cells is not very prevalent in the mouse at the ages studied (P4–P7) (Fig. 1B). NG2+ and O4+ cells range between ∼10 and 100 pF, but only cells with capacitances between 30 and 50 pF are likely to represent a transition stage (Fig. 1B). This finding is in contrast to previous immunocytochemical data suggesting that the vast majority of NG2+ cells also display O4 immunoreactivity in the rat developing white matter at similar ages that were used in the present study (Reynolds and Hardy, 1997). Therefore, we wanted to directly investigate the extent of NG2 and O4 overlap in white matter EGFP+ cells in our transgenic mouse strain. Immunocytochemical analyses on populations of white matter EGFP+ cells showed a relatively small 10–20% coexpression of NG2+ and O4+ at the ages at which the functional analyses was performed (Fig. 2). Our data are internally consistent, and the reason for the discrepancy with previous findings could be attributable to species differences, as suggested previously (Fanarraga et al., 1995). Note that, at the developmental stages studied, we observed that ∼18% of white matter EGFP+ cells were NG2–/O4– and likely represent more mature oligodendrocyte lineage cells.
Figure 2.
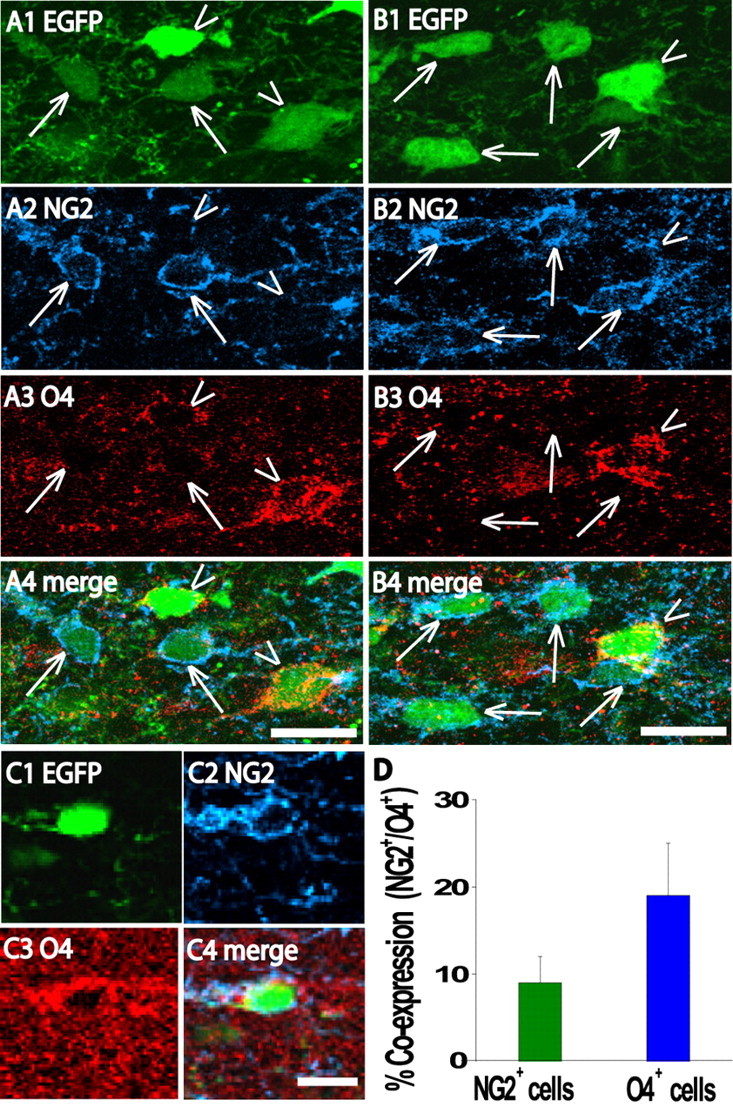
Extent of colocalization of NG2 and O4 immunoreactivity in white matter EGFP+ cells. A, B, Confocal images (z section, 8 μm; z step, 1 μm) of subcortical white matter from a coronal slice of a P7 CNP-EGFP mouse. These images illustrate the presence of NG2+/O4– (see arrows) and NG2–/O4+ (see arrowheads) white matter EGFP+ cells. C, Single example of a white matter EGFP+ cell that was found to be NG2+/O4+. D, Quantification of NG2 and O4 colocalization in white matter EGFP+ cells as a percentage of total NG2+ cells (green bar) or as a percentage of total O4+ cells (blue bar). A total of 215 and 114 NG2+ and O4+ cells were counted from three different brains from animals aged P5–P7, respectively. Scale bars, 20μm.
Differential regulation of macroscopic IKDR and IKA amplitudes in NG2+ and O4+ cells
Both NG2+ and O4+ cells of the white matter express functional KDR and transient K+ channels (KA). However, the extent of the macroscopic IKDR amplitude (measured as the steady-state amplitude at 200 ms after onset of voltage step) was much higher at a range of test voltage steps in NG2+ cells than in the more mature O4+ cells (average IKDR amplitude at a test pulse of +50 mV was 870 ± 60 vs 430 ± 41 pA for NG2+ and O4+ cells, respectively; p < 0.01; n = 12) (Fig. 3A,E,F). In contrast, no significant differences were noted in the amplitudes of the macroscopic IKA (measured as peak amplitude after onset of voltage step) between NG2+ and O4+ cells at a range of test voltage steps (average peak IKA amplitude at a test pulse of +50 mV was 1115 ± 104 vs 1031 ± 91 pA for NG2+ and O4+ cells, respectively; p > 0.05; n = 12) (Fig. 3B,E,F).
Figure 3.

Differential regulation of IKDR and IKA during NG2 to O4 cell lineage progression in developing white matter. A, Current–voltage relationship of IKDR in NG2+ (n = 12) and O4+ white matter EGFP+ cells (n = 12). B, Current–voltage relationship of IKA in NG2+ (n = 9) and O4+ white matter EGFP+ cells (n = 9). C, D, Activation conductance profiles of IKDR and IKA fitted with single Boltzmann curves for NG2+(n=12)and O4+(n=9)cells.V1/2 and k values were not found to be significantly different (p > 0.05, Mann–Whitney U test) between the cell groups. E, IKDR and IKA amplitude in NG2+ (n = 17–21) and O4+ (n = 15–19) cells in response to a single test pulse to +50 mV. Circles without SEM represent current amplitude from each individual cell recorded, whereas circles with SEM represent the pooled data mean value. F, Single examples illustrating representative raw traces of voltage–current profiles of IKDR and IKA from an NG2+ and O4+cell, respectively. All cells were recorded from coronal slices of P4–P7 CNP-EGFP mice. Open circles, NG2+ cell data; filled circles, O4+ cell data. **p < 0.01, Mann–Whitney U test; ns, not significant (i.e., p > 0.05).
The relative decrease noted in I amplitude between NG2+KDR and O4+ cells was not attributable to a change in the voltage dependence of activation (Fig. 3C), because single Boltzmann fitting of normalized conductance–voltage data resulted in similar V1/2 (–8.5 ± 0.67 vs –9.8 ± 0.8 mV for NG2+ and O4+ cells, respectively; p > 0.05; n = 9) and k slope factor values (9.3 ± 0.32 vs 8.6 ± 0.32 for NG2+ and O4+ cells, respectively; p > 0.05; n = 9).
Tyrosine kinase inhibition in NG2+ cells mimics the K+-channel phenotype observed in O4+ cells
Preincubation of slices with the broad-spectrum tyrosine kinase inhibitor genistein (30 μm) caused a significant decrease of the IKDR in white matter NG2+ cells compared with NG2+ cells from control slices (817 ± 87 vs 510 ± 49 pA in control NG2+ cells and genistein-treated NG2+ cells, respectively; p < 0.01; n = 12–13) (Fig. 4A). Together, these data suggest the presence of a constitutive activation of tyrosine kinase activity in NG2+ cells that serves to maintain KDR function. In contrast, the same concentration of genistein had no significant effect on IKA in NG2+ cells (n = 12–13) (Fig. 4A). The inactive analog of genistein, daidzein (30 μm), did not significantly affect IKDR or IKA (n = 8) (Fig. 4B). In addition, the selective inhibition of IKDR in NG2+ cells by genistein was reproduced by another broad-spectrum tyrosine kinase inhibitor, lavendustin A (10 μm; p < 0.01; n = 5) (Fig. 4C).
Figure 4.

Tyrosine kinase inhibition in NG2+ cells results in an IKDR and IKA phenotype reminiscent of O4+cells. IKDR and IKA amplitudes were determined at a test pulse of+ 50 mV as described in Materials and Methods. A, Individual and pooled IKDR and IKA amplitudes from white matter NG2+ cells in control slices (open circles; n = 13) versus slices that had been incubated with 30 μm genistein (gen) for 60–90 min (filled circles; n = 12). B, Individual and pooledIKDR and IKA amplitudes from white matter NG2+ cells in control slices (open circles; n = 8) versus slices that had been incubated with 30 μm daidzein (dai; the inactive analog of genistein) for 60–90 min (filled circles; n = 8). C, Individual and pooled IKDR and IKA amplitudes from white matter NG2+ cells in control slices (open circles; n = 5) versus slices that had been incubated with 10 μm lavendustin A (LavA) for 60–90 min (filled circles; n = 5). D, Lack of correlation (linear regression fit of data; dotted line) between the residual IKDR amplitude after tyrosine kinase inhibition (with either 30μm genistein or 10μm lavendustin; 60–90 min; n = 17) and whole-cell capacitance values in NG2+ cells. E, Individual and pooled IKDR and IKA amplitudes from white matter O4+ cells in control slices (open circles; n = 8) versus slices that had been incubated with 30 μm genistein (gen) for 60–90 min (filled circles; n = 8). Circles without SEM represent current amplitude from each individual cell recorded, whereas circles with SEM represent the pooled data mean value. All cells were recorded from coronal slices of P4–P7 CNP-EGFP mice. Note that recordings from control and drug-treated slices were performed in an interleaved manner. **p < 0.01, Mann–Whitney U test; ns, not significant (i.e., p > 0.05).
To determine whether tyrosine kinase inhibition decreases IKDR in NG2+ cells to the same extent regardless of developmental stage, we replotted the data in Figure 4, A and C, to investigate the relationship between IKDR amplitude after genistein treatment and cell capacitance. Within the NG2+ cell population, cells with higher capacitance values likely correspond to more mature developmental stages that immediately precede expression of the O4 antigen. Our data demonstrate that the absolute extent of IKDR amplitude inhibition, and hence the amplitude of the residual IKDR after tyrosine kinase inhibition, did not change throughout the whole-cell capacitance range examined, i.e., at various stages of NG2+ cell maturation (Fig. 4D).
Finally, the same concentration of genistein that inhibited IKDR in NG2+ cells (Fig. 4A,C) did not significantly alter IKDR or IKA in O4+ cells (n = 8; p > 0.05) (Fig. 4E).
White matter O4+ cells are postmitotic
We next compared the proliferative capacity of NG2+ and O4+ cells by examining the expression of the cell cycle-related nuclear antigen Ki67 (Scholzen and Gerdes, 2000) using immunocytochemical analysis (Fig. 5A–E). Ki67 immunoreactivity yields a more accurate estimate of the growth fraction of a given population of cells because this protein is expressed in all phases of the cell cycle (Scholzen and Gerdes, 2000). This is in contrast to the other widely used markers of proliferation, bromodeoxyuridine and proliferating cell nuclear antigen, which label cells only in S-phase of the cell cycle (Bacchi and Gown, 1993). We have previously used Ki67 expression to estimate NG2+ cell proliferation in the postnatal and adult subventricular zone (Aguirre et al., 2004), but, to our knowledge, this is the first description of the assessment of white matter NG2+ and O4+ cell proliferation using this marker. Our present data demonstrate that 43 ± 9% (total cells counted, 257) and 2 ± 1% (total cells counted, 105) of total NG2+ and O4+ cells, respectively, expressed Ki67 and hence were proliferative (Fig. 5F).
Figure 5.

Proliferative fraction of white matter NG2+ and O4+ cells as assessed by Ki67 immunoreactivity. A1–A4, Confocal images (z section, 24μm; z step, 2μm) of white matter from a coronal slice of a P7 CNP-EGFP mouse illustrating colocalization of NG2 and Ki67 immunoreactivity in EGFP+ cells. The image illustrates that some NG2+ cells express Ki67 (see arrows), whereas others do not (see arrowheads). B1–B4, High magnification of box B depicted in A1–A4 illustrating an NG2+ cell that is immunopositive for Ki67 (see arrow). C1–C4, High magnification of box C depicted in A1–A4 illustrating an NG2+ cell that does not express Ki67 (see arrowhead). D1–D4, Confocal images (z section, 20μm; z stack, 2μm) of white matter from a coronal slice of a P7 CNP-EGFP mouse illustrating that O4+ cells do not express Ki67 (see arrows). E1–E4, High magnification of the box E depicted in D1–D4 illustrating an O4+ cell that does not express Ki67 (see arrow). F, Quantification of coexpression of Ki67 in either NG2+ (green bar) and O4+ cells (blue bar). A total of 257 and 105 NG2+ and O4+ cells were counted from two to three different animals of ages P5–P7. Scale bars: A, D,60 μm; B, C, E,10 μm.
Together, these data clearly demonstrate that a reduction in IKDR observed as NG2+ cells differentiate to O4+ cells is accompanied by a loss of proliferative capacity.
Tyrosine kinase inhibition decreases the proliferative fraction of white matter EGFP+ cells
We then investigated whether tyrosine kinase inhibition could decrease the proliferation of white matter OPs. Because (1) EGFP+ cells in the white matter belong to the oligodendrocyte lineage (Yuan et al., 2002), (2) O4+ cells are essentially postmitotic (Fig. 5), and (3) it is unlikely that oligodendrocytes more mature than O4+ cells are proliferative, we proposed that all of the Ki67+/EGFP+ cells must be NG2+ OPs. We therefore quantified the extent of Ki67 immunoreactivity in white matter EGFP+ cells as a percentage of total white matter EGFP+ cells in organotypic slice cultures. We treated the slices with genistein to assess whether the reduction in IKDR amplitude noted previously was accompanied by a decrease in proliferation of OPs. In control slices, 20 ± 3% (n = 4; total cells counted, 656) of white matter EGFP+ cells were proliferative, as indicated by Ki67 expression (Fig. 6A,B,D). Proliferation was significantly decreased after inhibition of tyrosine kinase by genistein (30 μm)to6 ± 2% (n = 3; p < 0.01; total cells counted, 431) (Fig. 6C,D). In contrast, the inactive analog daidzein did not significantly alter the proliferative fraction of white matter EGFP+ cells when compared with control (14 ± 8%; n = 4; total cells counted, 553) (Fig. 6D). As expected from previous studies (Yuan et al., 1998; Ghiani et al., 1999), direct block of K+ channel by 1 mm TEA significantly decreased proliferation in white matter EGFP+ cells to 2 ± 1% (n = 3; p < 0.01; total cells counted, 389) (Fig. 6D). Finally, in drug-treated slices, cell viability was not significantly different from that seen in control slices, as assessed by cleaved caspase-3 expression (n = 2–4; percentage of cleaved caspase-3+/EGFP+ cells were 3.3 ± 1.2, 4.5 ± 2.8, 5.5 ± 3.1, 6.3 ± 2.7, and 37.3 ± 9.9% under control, genistein-, daidzein-, TEA-, and staurosporine-treated conditions, respectively; total cells counted, 189–412) (supplemental Fig. 1, available at www.jneurosci.org as supplemental material). These data clearly indicate that, under our experimental conditions, inhibition of tyrosine kinase is sufficient to decrease the proliferation of white matter OPs via a mechanism that is not associated with apoptosis.
Figure 6.

Tyrosine kinase inhibition decreases the proliferative fraction of white matter EGFP+ cells. A1–A3, Confocal images (z section, 18 μm; z step, 3 μm) of subcortical white matter from an organotypic slice culture (see Materials and Methods) of a P6 CNP-EGFP mouse illustrating colocalization of EGFP+ cells and Ki67 immunoreactivity under control conditions. B1–B3, High magnification of box B depicted in A1–A3 illustrating EGFP+/Ki67+ cells. C1–C3, Confocal images (z section, 18μm; z step, 3μm) of white matter from an organotypic slice culture that had been treated with 30μm genistein (gen; see Materials and Methods) illustrating a lower amount of Ki67 immunoreactivity in the EGFP+ population. D, Quantification of Ki67 expression in EGFP+ cells as a percentage of total number of EGFP+ cells under control, genistein-treated (gen; 30 μm), daidzein-treated (dai; 30 μm), and TEA-treated (1 mm) conditions. Scale bars: A, C,50μm; B,10μm. **p < 0.01, Mann–Whitney U test; ns, not significant (i.e., p > 0.05).
Acute PDGF receptor activation selectively increases IKDR in NG2+ cells via a tyrosine kinase pathway
Incubation of the slices with PDGF (20 ng/ml) caused a marked increase of the IKDR amplitude in NG2+ cells (925 ± 74 vs 1496 ± 120 pA in control NG2+ cells and PDGF-treated NG2+ cells, respectively; p < 0.01; n = 9–10) (Fig. 7A). Although a small increase in the mean IKA amplitude was also noted in NG2+ cells treated with PDGF, this was not statistically significant (1103 ± 129 vs 1353 ± 181 pA in control NG2+ cells and PDGF-treated NG2+ cells, respectively; p > 0.05; n = 9–10) (Fig. 7A). Unlike NG2+ cells, IKDR amplitude was not significantly altered in O4+ cells treated with PDGF (480 ± 65 vs 581 ± 64 pA in control O4+ cells and PDGF-treated O4+ cells, respectively; p > 0.05; n = 10) (Fig. 7B). Similarly, PDGF treatment did not result in a significant change in IKA in O4+ cells (1045 ± 86 vs 1153 ± 175 pA in control O4+ cells and PDGF-treated O4+ cells, respectively; p > 0.05; n = 10) (Fig. 7B).
Figure 7.

PDGF receptor activation selectively increases IKDR in NG2+ cells via a tyrosine kinase-dependent pathway. IKDR and IKA amplitudes were determined at a test pulse of +50 mV as described in Materials and Methods. A, Individual and pooled IKDR and IKA amplitudes from white matter NG2+ cells in control slices (open circles; n = 10) versus slices that had been incubated with 20 ng/ml PDGF for 60–90 min (filled circles; n = 9). B, Individual and pooled IKDR and IKA amplitudes from white matter O4+ cells in control slices (open circles; n = 10) versus slices that had been incubated with 20 ng/ml PDGF for 60–90 min (filled circles; n = 9). C, Individual and pooled IKDR amplitudes from white matter NG2+ cells in control slices (open circles; n = 10) versus slices that had been incubated with 5 μg/ml anti-PDGF for 60–90 min (filled circles; n = 10). D, Individual and pooled IKDR amplitudes from white matter NG2+ cells in slices that had been incubated with 20 ng/ml PDGF for 60–90 min (open circles; n = 11) versus slices that had been incubated with 20 ng/ml PDGF for 60–90 min in the presence of 0.5 μg/ml anti-PDGF (filled circles; n = 10). E, Individual and pooled IKDR amplitudes from white matter NG2+ cells in slices that had been incubated with 30 μm genistein for 60–90 min (open circles; n = 7) versus slices that had been incubated with 30 μm genistein in the presence of 20 ng/ml PDGF for 60–90 min (filled circles; n = 7). All cells were recorded from coronal slices of P4–P7 CNP-EGFP mice. Note that recordings from control and drug-treated slices were performed in an interleaved manner. *p < 0.05, **p < 0.01, Mann–Whitney U test; ns, not significant (i.e., p > 0.05).
We then directly compared IKDR amplitude in NG2+ cells from control slices and NG2+ cells in slices that had been preincubated with the PDGFR-α antibody. Pooled data demonstrated that this had a small but significant decrease in IKDR (982 ± 86 vs 761 ± 57 pA in control NG2+ cells vs PDGFR-α treated NG2+ cells, respectively; 0.01 < p < 0.05; n = 10) (Fig. 7C). Preincubation of slices with 5 μg/ml normal/preimmune control rabbit IgG did not significantly alter IKDR in NG2+ cells (902 ± 26 vs 861 ± 40 pA in control NG2+ cells vs control rabbit IgG-treated NG2+ cells, respectively; p > 0.05; n = 5; data not shown). These data suggest the presence of a small but measurable tonic activation of PDGFR-α under the conditions of our experiments and that block of this tonic activation can in fact cause a similar modulation of IKDR as tyrosine kinase inhibition.
To determine that the PDGF-mediated increase of IKDR amplitude in NG2+ cells occurred via the activation of PDGFR-α, we tested whether this effect was still apparent after treatment of the slices with PDGFR-α antibody (R & D Systems). We confirmed that this antibody prevented the well known mitogenic effect (as assessed by Ki67 immunoreactivity) of PDGF on primary OP cultures (supplemental Fig. 2, available at www.jneurosci.org as supplemental material) and hence is a functional antagonist of PDGFR-α. In slices, the PDGF-mediated increase of IKDR amplitude in NG2+ cells was prevented by preincubation with this antibody (777 ± 97 vs 854 ± 58 pA in PDGFR-α antibody-treated NG2+ cells vs PDGFR-α antibody plus PDGF-treated NG2+ cells, respectively; p > 0.05; n = 10–11) (Fig. 7D), illustrating that the positive modulation of IKDR by PDGF indeed occurs via activation of the PDGFR-α. Note that, in these experiments, NG2+ cells treated with anti-PDGFR-α alone were used as a control.
Finally, preincubation of NG2+ cells with the tyrosine kinase inhibitor genistein prevented any subsequent PDGF-mediated increase in IKDR amplitude (454 ± 64 vs 432 ± 73 pA in genisteintreated NG2+ cells vs genistein plus PDGF-treated NG2+ cells, respectively; p > 0.05; n = 7) (Fig. 7E). The occlusion of the PDGF-induced increase of IKDR in NG2+ cells by genistein strongly suggests that the effects of PDGF receptor activation on the function of this channel are mediated via a tyrosine kinase pathway.
Because PDGF only modified I amplitude in NG2+KDR but not in O4+ cells, we examined, using protein immunocytochemistry, whether O4+ cells expressed PDGFR-α. Our data clearly show the presence of numerous white matter EGFP+ cells that displayed a membrane distribution of PDGFR-α protein immunoreactivity (Fig. 8, arrowheads). Furthermore, in general, these cells were smaller in size and/or expressed lower intensities of EGFP fluorescence. From previous analyses, it can be concluded that these cells represent white matter NG2+ progenitors (Chittajallu et al., 2004; this study). In contrast, only in extremely rare cases was detectable PDGFR-α protein noted on O4+ cells in the developing white matter (3 ± 1% of O4+ cells displayed PDGFR-α immunoreactivity; total cells counted, 146) (Fig. 8).
Figure 8.

O4+ cells in the developing white matter do not display PDGFR-α immunoreactivity. A1–A4, Confocal image (z section, 28μm; z stack, 2μm) of white matter from a coronal slice of a P6 CNP-EGFP mouse. O4 immunoreactivity is apparent in a proportion of white matter EGFP+ cells (see arrows). PDGFR-α-positive white matter EGFP+ cells are not O4+ (arrows vs arrowheads). B1–B4, High magnification of box B depicted in A1–A4 illustrating an O4–/ PDGFR+ (arrowhead) and an O4+/PDGFR-α– (arrow) white matter EGFP+ cell. Note the relative smaller size and lower EGFP+ intensity of the O4–/PDGFR+ that is indicative of an NG2+ cell. Scale bars: A,50 μm; B,40 μm.
Discussion
Our current data illustrate that successful targeting of NG2+/O4– or NG2–/O4+ cells can be achieved by using CNP-promoter-driven EGFP fluorescence and whole-cell capacitance measurements. This is the first description of an experimental paradigm that greatly aids physiological characterization of specific developmental stages of oligodendrocyte cells in acutely isolated slices.
Using this approach, we investigated the functional expression of IKDR in white matter NG2+ and O4+ cells in situ. Our data demonstrate a downregulation in IKDR as NG2+ cells progress to an O4+ phenotype. A proportion of white matter NG2+ cells in situ were proliferative, whereas virtually all O4+ cells were postmitotic. These data agree with previous in vitro studies demonstrating a correlation between expression of this channel and proliferative capacity (Gallo et al., 1996; Knutson et al., 1997; Chittajallu et al., 2002; Soliven et al., 2003). However, the fact that white matter O4+ cells identified in this study are nonproliferative but display a significant and measurable IKDR raises an important issue. This data suggests that complete inhibition of IKDR is not a prerequisite for cell cycle exit and therefore not all KDR channels are linked to cell cycle regulation. OPs express a variety of Kv1 subunit transcripts and proteins (Attali et al., 1997; Schmidt et al., 1999; Chittajallu et al., 2002). We have shown previously that (1) Kv1.3 and Kv1.5 but not Kv1.4 or Kv1.6 subunit proteins are upregulated by PDGF in OPs in vitro, and (2) selective pharmacological inhibition of Kv1.3 alone elicits cell cycle arrest in proliferating OPs in vitro (Chittajallu et al., 2002). It has also been demonstrated that levels of Kv1.5 mRNA are upregulated in cultured OPs after PDGF treatment (Soliven et al., 2003). It is therefore possible that only certain Kv1 subunits (e.g., Kv1.3 and/or Kv1.5) are downregulated during NG2+ to O4+ cell lineage progression, which would explain the redundancy of certain KDR channels with respect to cell proliferation.
In this study, we demonstrate that both white matter NG2+ and O4+ cells express IKA. However, there is no evidence for whether KA plays a role in OP proliferation. In contrast to IKDR, IKA amplitude does not significantly change during NG2 to O4 lineage progression. Although we cannot rule out possible changes in gating or kinetic properties of KA channels (Peretz et al., 1999) in OPs and pre-OLs, these data suggest that regulation of IKA amplitude plays a minor role, if any, in cell cycle regulation and early lineage progression. Interestingly, Kv1.4 homomeric and heteromeric (with other Kv subunits) channels display rapidly inactivating kinetics reminiscent of KA channels (Dolly and Parcej, 1996; Kondoh et al., 1997), and expression of Kv1.4 mRNA and protein has been demonstrated in OPs (Attali et al., 1997; Schmidt et al., 1999; Chittajallu et al., 2002). Therefore, Kv1.4 is a candidate subunit underlying IKA in these cells. Kv1.4 protein levels are not altered between quiescent and proliferating cultured OPs (Chittajallu et al., 2002). Thus, our present in situ data strengthen the hypothesis that modulation of KA channels is not involved in the loss of proliferation during OP to pre-OL lineage progression.
Tyrosine kinase-mediated effects on K+-channels are a cellular mechanism that regulates their function. However, the majority of studies in the CNS have mainly focused on neuronal populations because of the role these channels play in action potential kinetics and firing patterns (Jonas and Kaczmarek, 1996). More recently, it has been shown that IKDR in Schwann cells (Sobko et al., 1998; Peretz et al., 1999), astrocytes (MacFarlane and Sontheimer, 2000), microglia (Cayabyab et al., 2000), and oligodendrocyte progenitors (Soliven et al., 2003) in vitro can be modulated by tyrosine kinase activity, suggesting that similar mechanisms also exist in glial cells. However, it is unknown how this relates to lineage progression of white matter oligodendrocytes. In the current study, tyrosine kinase inhibition in white matter NG2+ cells in situ downregulates IKDR amplitude. This demonstrates the presence of a constitutive tyrosine kinase activity that maintains high IKDR expression. Furthermore, the extent of IKDR inhibition after tyrosine kinase inhibition is similar regardless of the relative maturity of NG2+ cells, as assessed by cell capacitance measurement, with a residual IKDR amplitude (∼500 pA) closely matching that observed in O4+ cells. In contrast, IKA in NG2+ cells is not affected by tyrosine kinase inhibition under the same experimental conditions that decrease IKDR. Therefore, block of tyrosine kinase activity in NG2+ cells results in a functional K+-channel phenotype that is reminiscent of O4+ cells and hence mimics the endogenous regulation of K+ channels.
Together, these data indicate that tyrosine kinase inhibition is a plausible mechanism that underlies the appropriate K+-channel regulation as OPs develop into pre-OLs. Although pharmacological block of tyrosine kinase activity modulates KDR function, our data do not directly evaluate whether this effect is mediated via changes in phosphorylation state of tyrosine residues within these channel subunit proteins. It is clear that phosphorylation/dephosphorylation of tyrosine residues can significantly influence K+-channel activity in a variety of cell types (Breitwieser, 1996; Jonas and Kaczmarek, 1996; Davis et al., 2001). In fact, tyrosine kinase inhibition significantly decreases phosphorylation of Kv1.5 subunit in cultured astrocytes (MacFarlane and Sontheimer, 2000) and Kv1.5/Kv2.1 subunits in Schwann cells in vitro (Sobko et al., 1998). This dephosphorylation is accompanied by a reduction in IKDR amplitude (Sobko et al., 1998; MacFarlane and Sontheimer, 2000). Thus, it is possible that the effects of tyrosine kinase inhibition on IKDR amplitude in white matter OPs are also mediated by dephosphorylation. However, we cannot rule out the possibility that tyrosine kinase inhibition alters OP KDR function via changes in phosphorylation state of intermediate modulatory proteins.
PDGF is a well known mitogen for oligodendrocyte progenitors (Calver et al., 1998; Fruttiger et al., 1999; McKinnon et al., 2005), and activation of PDGF receptors is linked to an increase in tyrosine kinase activity within the cell (Dolly and Parcej, 1996; DeMali et al., 1999; Tallquist and Kazlauskas, 2004). Interestingly, PDGF treatment caused an increase of IKDR expression in cultured OPs (Chittajallu et al., 2002; Soliven et al., 2003), which occurs in part via tyrosine kinase activation (Soliven et al., 2003). Our present data are in agreement with this latter study and demonstrate that PDGFR-α activation causes, on average, an increase in IKDR amplitude in white matter NG2+ cells that can be occluded by previous tyrosine kinase inhibition, indicative of a common cellular pathway. However, this PDGFR-α-mediated effect is no longer observable at the O4+ stage, although these cells express IKDR, and this is attributed to a lack of detectable PDGFR-α protein expression as OPs become pre-OLs. The absence of PDGFR-α on the majority of O4+ cells is in agreement with a previous study (Nishiyama et al., 1996), and the present functional data demonstrating the inability of PDGFR-α activation to modulate KDR channels in O4+ in situ are in favor of this class of cells being unresponsive to PDGF (Fok-Seang and Miller, 1994; Mason and Goldman, 2002). Because, PDGFR-α and tyrosine kinase activity work together to maintain IKDR, we suggest that a decrease of PDGFR-α signaling, such as that which occurs because of PDGFR-α downregulation between the NG2 and O4 lineage stages, would lead to an attenuation of IKDR amplitude.
The fact that (1) only a very small fraction of O4+ cells express detectable PDGFR-α, (2) virtually all O4+ cells are postmitotic, and (3) 20% of white matter O4+ cells express NG2 allow us to draw some conclusions concerning the transitional NG2+/O4+ cells. Together, our immunocytochemical analysis suggests that the majority of NG2+/O4+ cells are also postmitotic and do not express PDGFR-α receptor protein. The latter is in agreement with previous studies demonstrating a loss of colocalization of NG2 and PDGFR-α as white matter development proceeds and the presence of OPs in vitro that possess NG2 immunoreactivity after the loss of detectable PDGFR-α protein (Nishiyama et al., 1996a,b). Thus, inhibition of tyrosine kinase activity mediated by PDGFR-α activation is already apparent in the transitional NG2+/O4+ cells. Interestingly, we do note a percentage of NG2+ cells that do not express Ki67 and display IKDR amplitudes that are in a similar range to those seen in postmitotic O4+ cells. Furthermore, tyrosine kinase inhibition can induce a reduction in NG2+ cell proliferation. We therefore propose that reduction in PDGFR-α-mediated tyrosine kinase activity is initiated during the late OP stage and is complete by the time cells reach NG2–/O4+ stage, because PDGFR-α activation and tyrosine kinase inhibition no longer modulates the residual KDR channels present at this developmental stage.
To summarize, we propose that downregulation of PDGFR-α receptor expression that occurs as NG2+ cells attain O4 immunoreactivity results in a subsequent inhibition of tyrosine kinase activity that is normally constitutively maintained by activation of these receptors. This, in turn, inhibits IKDR function, which ultimately leads to a reduction and cessation of proliferative capacity during NG2+ to O4+ cell lineage progression. Future studies involving genetic manipulation resulting in gain or loss of function would serve to strengthen the hypothesis that a cellular pathway linking PDGR-α expression, tyrosine kinase activity, and K+-channel function constitutes an important mechanism involved in oligodendrocyte development in situ.
Footnotes
This work was supported by National Institutes of Health (NIH) Grant R01NS045702 (V.G.), the Wadsworth Foundation, and NIH Mental Retardation and Developmental Disabilities Research Center Grant P30HD40677. We thank Dr. T. Haydar for assistance and training in the use of the Zeiss LSM-510 confocal microscope. We thank Dr. L. J. Chew for critical comments on this manuscript and assistance with primary OP cultures. We also thank Drs. C. J. McBain and S. Belachew for valuable discussion.
Correspondence should be addressed to Ramesh Chittajallu, Center for Neuroscience Research, Children's Research Institute, Children's National Medical Center, Washington, DC 20010. E-mail: rchittajallu@cnmcresearch.org.
DOI:10.1523/JNEUROSCI.2122-05.2005
Copyright © 2005 Society for Neuroscience 0270-6474/05/258601-10$15.00/0
References
- Aguirre AA, Chittajallu R, Belachew S, Gallo V (2004) NG2-expressing cells in the subventricular zone are type C-like cells and contribute to interneuron generation in the postnatal hippocampus. J Cell Biol 165: 575–589. [DOI] [PMC free article] [PubMed] [Google Scholar]
- Attali B, Wang N, Kolot A, Sobko A, Cherepanov V, Soliven B (1997) Characterization of delayed rectifier Kv channels in oligodendrocytes and progenitor cells. J Neurosci 17: 8234–8245. [DOI] [PMC free article] [PubMed] [Google Scholar]
- Bacchi CE, Gown AM (1993) Detection of cell proliferation in tissue sections. Braz J Med Biol Res 26: 677–687. [PubMed] [Google Scholar]
- Barres BA, Koroshetz WJ, Swartz KJ, Chun LL, Corey DP (1990) Ion channel expression by white matter glia: the O-2A glial progenitor cell. Neuron 4: 507–524. [DOI] [PubMed] [Google Scholar]
- Baumann N, Pham-Dinh D (2001) Biology of oligodendrocyte and myelin in the mammalian central nervous system. Physiol Rev 81: 871–927. [DOI] [PubMed] [Google Scholar]
- Belachew S, Yuan X, Gallo V (2001) Unraveling oligodendrocyte origin and function by cell-specific transgenesis. Dev Neurosci 23: 287–298. [DOI] [PubMed] [Google Scholar]
- Belachew S, Chittajallu R, Aguirre AA, Yuan X, Kirby M, Anderson S, Gallo V (2003) Postnatal NG2 proteoglycan-expressing progenitor cells are intrinsically multipotent and generate functional neurons. J Cell Biol 161: 169–186. [DOI] [PMC free article] [PubMed] [Google Scholar]
- Berger T, Schnitzer J, Kettenmann H (1991) Developmental changes in the membrane current pattern, K+ buffer capacity, and morphology of glial cells in the corpus callosum slice. J Neurosci 11: 3008–3024. [DOI] [PMC free article] [PubMed] [Google Scholar]
- Bernard F, Bossu JL, Gaillard S (2001) Identification of living oligodendrocyte developmental stages by fractal analysis of cell morphology. J Neurosci Res 65: 439–445. [DOI] [PubMed] [Google Scholar]
- Breitwieser GE (1996) Mechanisms of K+ channel regulation. J Memb Biol 152: 1–11. [DOI] [PubMed] [Google Scholar]
- Calver AR, Hall AC, Yu WP, Walsh FS, Heath JK, Betsholtz C, Richardson WD (1998) Oligodendrocyte population dynamics and the role of PDGF in vivo. Neuron 20: 869–882. [DOI] [PubMed] [Google Scholar]
- Cayabyab FS, Khanna R, Jones OT, Schlichter LC (2000) Suppression of the rat microglia Kv1.3 current by src-family tyrosine kinases and oxygen/glucose deprivation. Eur J Neurosci 12: 1949–1960. [DOI] [PubMed] [Google Scholar]
- Chew LJ, King WC, Kennedy A, Gallo V (2005) Interferon-gamma inhibits cell cycle exit in differentiating oligodendrocyte progenitor cells. Glia, in press. [DOI] [PubMed]
- Chittajallu R, Chen Y, Wang H, Yuan X, Ghiani CA, Heckman T, McBain CJ, Gallo V (2002) Regulation of Kv1 subunit expression in oligodendrocyte progenitor cells and their role in G1/S phase progression of the cell cycle. Proc Natl Acad Sci USA 99: 2350–2355. [DOI] [PMC free article] [PubMed] [Google Scholar]
- Chittajallu R, Aguirre A, Gallo V (2004) NG2-positive cells in the mouse white and grey matter display distinct physiological properties. J Physiol (Lond) 561: 109–122. [DOI] [PMC free article] [PubMed] [Google Scholar]
- Davis MJ, Wu X, Nurkiewicz TR, Kawasaki J, Gui P, Hill MA, Wilson E (2001) Regulation of ion channels by protein tyrosine phosphorylation. Am J Physiol Heart Circ Physiol 281: H1835–H1862. [DOI] [PubMed] [Google Scholar]
- DeMali KA, Godwin SL, Soltoff SP, Kazlauskas A (1999) Multiple roles for Src in a PDGF-stimulated cell. Exp Cell Res 253: 271–279. [DOI] [PubMed] [Google Scholar]
- Dolly JO, Parcej DN (1996) Molecular properties of voltage-gated K+ channels. J Bioenerg Biomembr 28: 231–253. [DOI] [PubMed] [Google Scholar]
- Fanarraga ML, Sommer I, Griffiths IR (1995) O-2A progenitors of the mouse optic nerve exhibit a developmental pattern of antigen expression different from the rat. Glia 15: 95–104. [DOI] [PubMed] [Google Scholar]
- Fok-Seang J, Miller RH (1994) Distribution and differentiation of A2B5+ glial precursors in the developing rat spinal cord. J Neurosci Res 37: 219–235. [DOI] [PubMed] [Google Scholar]
- Fruttiger M, Karlsson L, Hall AC, Abramsson A, Calver AR, Bostrom H, Willetts K, Bertold CH, Heath JK, Betsholtz C, Richardson WD (1999) Defective oligodendrocyte development and severe hypomyelination in PDGF-A knockout mice. Development 126: 457–467. [DOI] [PubMed] [Google Scholar]
- Gallo V, Zhou JM, McBain CJ, Wright P, Knutson PL, Armstrong RC (1996) Oligodendrocyte progenitor cell proliferation and lineage progression are regulated by glutamate receptor-mediated K+ channel block. J Neurosci 16: 2659–2670. [DOI] [PMC free article] [PubMed] [Google Scholar]
- Ghiani CA, Yuan X, Eisen AM, Knutson PL, DePinho RA, McBain CJ, Gallo V (1999) Voltage-activated K+ channels and membrane depolarization regulate accumulation of the cyclin-dependent kinase inhibitors p27(Kip1) and p21(CIP1) in glial progenitor cells. J Neurosci 19: 5380–5392. [DOI] [PMC free article] [PubMed] [Google Scholar]
- Gipson K, Bordey A (2002) Analysis of the K+ current profile of mature rat oligodendrocytes in situ. J Membr Biol 189: 201–212. [DOI] [PubMed] [Google Scholar]
- Jonas EA, Kaczmarek LK (1996) Regulation of potassium channels by protein kinases. Curr Opin Neurobiol 6: 318–323. [DOI] [PubMed] [Google Scholar]
- Knutson P, Ghiani CA, Zhou JM, Gallo V, McBain CJ (1997) K+ channel expression and cell proliferation are regulated by intracellular sodium and membrane depolarization in oligodendrocyte progenitor cells. J Neurosci 17: 2669–2682. [DOI] [PMC free article] [PubMed] [Google Scholar]
- Kondoh S, Ishii K, Nakamura Y, Taira N (1997) A mammalian transient type K+ channel, rat Kv1.4, has two potential domains that could produce rapid inactivation. J Biol Chem 272: 19333–19338. [DOI] [PubMed] [Google Scholar]
- MacFarlane SN, Sontheimer H (2000) Modulation of Kv1.5 currents by Src tyrosine phosphorylation: potential role in the differentiation of astrocytes. J Neurosci 20: 5245–5253. [DOI] [PMC free article] [PubMed] [Google Scholar]
- Mason JL, Goldman JE (2002) A2B5+ and O4+ Cycling progenitors in the adult forebrain white matter respond differentially to PDGF-AA, FGF-2, and IGF-1. Mol Cell Neurosci 20: 30–42. [DOI] [PubMed] [Google Scholar]
- McKinnon RD, Waldron S, Keil ME (2005) PDGFα-receptor signal strength controls an RTK rheostat that integrates phosphoinositol 3′-kinase and phospholipase Cγ pathways during oligodendrocyte maturation. J Neurosci 25: 3499–3508. [DOI] [PMC free article] [PubMed] [Google Scholar]
- Nashmi R, Velumian AA, Chung I, Zhang L, Agrawal SK, Fehlings MG (2002) Patch-clamp recordings from white matter glia in thin longitudinal slices of adult rat spinal cord. J Neurosci Methods 117: 159–166. [DOI] [PubMed] [Google Scholar]
- Nishiyama A, Lin XH, Giese N, Heldin CH, Stallcup WB (1996a) Colocalization of NG2 proteoglycan and PDGF α-receptor on O2A progenitor cells in the developing rat brain. J Neurosci Res 43: 299–314. [DOI] [PubMed] [Google Scholar]
- Nishiyama A, Lin XH, Giese N, Heldin CH, Stallcup WB (1996b) Interaction between NG2 proteoglycan and PDGF alpha-receptor on O2A progenitor cells is required for optimal response to PDGF. J Neurosci Res 43: 315–330. [DOI] [PubMed] [Google Scholar]
- Peretz A, Sobko A, Attali B (1999) Tyrosine kinases modulate K+ channel gating in mouse Schwann cells. J Physiol (Lond) 519: 373–384. [DOI] [PMC free article] [PubMed] [Google Scholar]
- Reynolds R, Hardy R (1997) Oligodendroglial progenitors labeled with the O4 antibody persist in the adult rat cerebral cortex in vivo. J Neurosci Res 47: 455–470. [DOI] [PubMed] [Google Scholar]
- Rogister B, Ben Hur T, Dubois-Dalcq M (1999) From neural stem cells to myelinating oligodendrocytes. Mol Cell Neurosci 14: 287–300. [DOI] [PubMed] [Google Scholar]
- Schmidt K, Eulitz D, Veh RW, Kettenmann H, Kirchhoff F (1999) Heterogeneous expression of voltage-gated potassium channels of the shaker family (Kv1) in oligodendrocyte progenitors. Brain Res 843: 145–160. [DOI] [PubMed] [Google Scholar]
- Scholzen T, Gerdes J (2000) The Ki-67 protein: from the known and the unknown. J Cell Physiol 182: 311–322. [DOI] [PubMed] [Google Scholar]
- Sobko A, Peretz A, Attali B (1998) Constitutive activation of delayed-rectifier potassium channels by a src family tyrosine kinase in Schwann cells. EMBO J 17: 4723–4734. [DOI] [PMC free article] [PubMed] [Google Scholar]
- Soliven B, Ma L, Bae H, Attali B, Sobko A, Iwase T (2003) PDGF upregulates delayed rectifier via Src family kinases and sphingosine kinase in oligodendroglial progenitors. Am J Physiol Cell Physiol 284: C85–C93. [DOI] [PubMed] [Google Scholar]
- Sontheimer H, Trotter J, Schachner M, Kettenmann H (1989) Channel expression correlates with differentiation stage during the development of oligodendrocytes from their precursor cells in culture. Neuron 2: 1135–1145. [DOI] [PubMed] [Google Scholar]
- Tallquist M, Kazlauskas A (2004) PDGF signaling in cells and mice. Cytokine Growth Factor Rev 15: 205–213. [DOI] [PubMed] [Google Scholar]
- Vautier F, Belachew S, Chittajallu R, Gallo V (2004) Shaker-type potassium channel subunits differentially control oligodendrocyte progenitor proliferation. Glia 48: 337–345. [DOI] [PubMed] [Google Scholar]
- Yuan X, Eisen AM, McBain CJ, Gallo V (1998) A role for glutamate and its receptors in the regulation of oligodendrocyte development in cerebellar tissue slices. Development 125: 2901–2913. [DOI] [PubMed] [Google Scholar]
- Yuan X, Chittajallu R, Belachew S, Anderson S, McBain CJ, Gallo V (2002) Expression of the green fluorescent protein in the oligodendrocyte lineage: a transgenic mouse for developmental and physiological studies. J Neurosci Res 70: 529–545. [DOI] [PubMed] [Google Scholar]