

Abstract
P-type (CaV2.1) Ca2+ channels are a central conduit of neuronal Ca2+ entry, so their Ca2+ feedback regulation promises widespread neurobiological impact. Heterologous expression of recombinant CaV2.1 channels demonstrates that the Ca2+ sensor calmodulin can trigger Ca2+-dependent facilitation (CDF) of channel opening. This facilitation occurs when local Ca2+ influx through individual channels selectively activates the C-terminal lobe of calmodulin. In neurons, however, such calmodulin-mediated processes have yet to be detected, and CDF of native P-type current has thus far appeared different, arguably triggered by other Ca2+ sensing molecules. Here, in cerebellar Purkinje somata abundant with prototypic P-type channels, we find that the C-terminal lobe of calmodulin does produce CDF, and such facilitation augments Ca2+ entry during stimulation by repetitive action-potential and complex-spike waveforms. Beyond recapitulating key features of recombinant channels, these neurons exhibit an additional modulatory dimension: developmental upregulation of CDF during postnatal week 2. This phenomenon reflects increasing somatic expression of CaV2.1 splice variants that manifest CDF and progressive dendritic targeting of variants lacking CDF. Calmodulin-triggered facilitation is thus fundamental to native CaV2.1 and rapidly enhanced during early development.
Keywords: P/Q-type channel, α1A, alternative splicing, EF hand, cerebellar Purkinje neuron, short-term synaptic plasticity
Introduction
CaV2.1 Ca2+ channels (P-type) trigger neurotransmitter release (Dunlap et al., 1995), support neuroarchitectural development (Miyazaki et al., 2004), and impact molecular expression profiles optimizing presynaptic function (Piedras-Renteria et al., 2004). Aberrant function of these channels also mediate diseases ranging from Lambert-Eaton syndrome (Flink and Atchison, 2003) to heritable ataxia, epilepsy, and migraine (Ophoff et al., 1996; Zhuchenko et al., 1997). This paper concerns a potentially rich complement to these roles: CaV2.1 regulation by the Ca2+ sensor calmodulin (CaM) (Lee et al., 1999, 2000; DeMaria et al., 2001). Central to such regulation is the constitutive association of CaM with these channels (DeMaria et al., 2001; Erickson et al., 2001), rendering CaM a resident Ca2+ sensor. CaM induces two opposing effects, initially causing Ca2+-dependent facilitation (CDF) of opening (τ ∼10 ms) and then imparting Ca2+-dependent inactivation (CDI) (τ ∼100–500 ms). Remarkably, Ca2+ binding to the C-terminal lobe of CaM selectively triggers CDF, whereas binding to the N-terminal lobe induces CDI (DeMaria et al., 2001) (but see Lee et al., 2003). Additionally, the C-lobe of CaM responds preferentially to local Ca2+ influx through individual channels, whereas the N-lobe detects aggregate Ca2+ activity summed over multiple Ca2+ sources (DeMaria et al., 2001; Soong et al., 2002; Chaudhuri et al., 2004). Because these discriminating Ca2+ decoding processes alter recombinant currents during repetitive physiological stimuli (DeMaria et al., 2001), CDF/CDI may support short-term synaptic plasticity and neurocomputation (Tsodyks and Markram, 1997).
A critical uncertainty is that the underlying rationale derives from heterologous expression of recombinant CaV2.1, and lobe-specific CaM regulation of P-type currents has not been detected in any neuron. Furthermore, for P-type currents at the calyx of Held (Borst and Sakmann, 1998; Cuttle et al., 1998; Forsythe et al., 1998; Borst and Sakmann, 1999), CDF presents differently, being attenuated by the rapid Ca2+ chelator BAPTA (Borst and Sakmann, 1998; Cuttle et al., 1998). In contrast, for recombinant channels, CDF persists with BAPTA (DeMaria et al., 2001; Soong et al., 2002; Chaudhuri et al., 2004), reflecting selectivity of CDF for local Ca2+ influx (DeMaria et al., 2001). More challenging, perfusion of neuronal calcium sensor-1 (NCS-1) eliminates CDF of calyceal currents (Tsujimoto et al., 2002), whereas CaM inhibitory peptide is without effect (Sakaba and Neher, 2001). Thus, NCS-1, and not CaM, appears to trigger CDF in native currents (Tsujimoto et al., 2002). The same calyceal currents may exhibit CaM-mediated CDI (Xu and Wu, 2005), although it can be challenging to distinguish inactivation from Ca2+ depletion in the synaptic cleft (Borst and Sakmann, 1999). To what extent, then, does lobe-specific CaM regulation of CaV2.1 pertain to the neuronal context?
Here we examined dissociated cerebellar Purkinje neurons for CaM-dependent regulation of their Ca2+ currents. These neurons abound in classic P-type currents (Mintz et al., 1992; McDonough et al., 1997) and can be dissociated for postnatal day 12 (P12) to P13, permitting exploration of developmental questions. We corroborate principal features for CaM regulation of native P-type currents and also encounter neuron-specific dimensions for developmental control of such channel regulation.
Materials and Methods
Materials. All reagents were from Sigma (St. Louis, MO) unless otherwise noted.
Expression of CaV2.1 in HEK293 cells. Methods were adapted from previous studies (DeMaria et al., 2001). We used a calcium phosphate method to cotransfect plasmids encoding the following: the human (DeMaria et al., 2001) or rat (Bourinet et al., 1999) α12.1 pore-forming subunit; β2a and α2δ accessory subunits (DeMaria et al., 2001); and simian virus 40 T antigen to boost expression. β2a minimizes voltage inactivation, simplifying examination of Ca2+-dependent regulation. Human α12.1 was a gift from Dr. Terry Snutch (University of British Columbia, Vancouver, British Columbia, Canada) (Sutton et al., 1999), and its splice variant content has been engineered to the following (Soong et al., 2002): Δ10A (+G); 16+/17+; 17 (–VEA), –31*(–NP); 37a (EFa) or 37b (EFb); 43+/44–; Δ47.
Acute dissociation of Purkinje neurons. We adapted published protocols for isolating rat cerebellar Purkinje neurons (Mintz et al., 1992; McDonough et al., 1997), with valuable suggestions from Dr. Stefan McDonough (Marine Biological Laboratories, Woods Hole, MA). Cerebella from Sprague Dawley rats (5–12 d postnatal) were rapidly removed after decapitation and placed in ice-cold solution containing the following: 82 mm Na2SO4, 30 mm K2SO4, 10 mm HEPES, 10 mm glucose, 5 mm MgCl2, and 0.001% phenol red, pH 7.4, 305–310 mOsm. Meninges were removed, tissue was cut into 6–15 pieces per cerebellum, and the resulting pieces were digested with 3 mg/ml Protease XXIII for 6–8 min at 37°C. Pieces were washed one to two times in Tyrode's solution, supplemented with 1 mg/ml each of bovine serum albumin and trypsin inhibitor. Tyrode's solution contained the following (in mm): 150 NaCl, 4 KCl, 2 CaCl2, 2 MgCl2, 10 glucose, and 10 HEPES, pH 7.4, 305–310 mOsm. After washes, pieces were triturated with a glass pipette, and neurons were incubated in Tyrode's solution at room temperature on coverslips until experimentation. Dissociated Purkinje cells (see Fig. 1 A) from rats ≥5 d old are easily identified by (1) larger size, (2) commonly present large primary dendrite, and (3) large Ca2+ currents with nimodipine and TTX in the bath.
Figure 1.

CDF and CDI in P-type Ca2+ currents of cerebellar Purkinje neurons. A, Left, Bright-field image of freshly dissociated cerebellar Purkinje neuron from 10-d-old rat (large central cell). Surrounding the central cell are much smaller cerebellar granule cells. Right, Exemplar Ca2+ currents demonstrating pharmacological isolation of P-type current. Tail currents clipped to frame for clarity, here and throughout. B, Prototypic CDF of CaV2.1 heterologously expressed in HEK293 cells. Left, Top traces shows prepulse voltage protocol [holding potential (HP) of –90 mV], and bottom two sets of traces show resulting Ca2+ (middle) and Ba2+ (bottom) currents. In the absence of a prepulse (gray traces), Ca2+ but not Ba2+ currents show a slow phase of activation (arrow) from normal (dotted line) to facilitated modes. After receiving a prepulse (black traces), Ca2+ currents show activation directly into the facilitated mode. Ba2+ currents show rapid activation into the normal mode regardless of the presence of a prepulse (bottom). Quantification of the charge difference between normalized test pulses (ΔQ) allows calculation of RF by a prepulse to a particular voltage (DeMaria et al., 2001; Chaudhuri et al., 2004). Right, RF plotted against prepulse voltage, for the exemplar cell at left. To index pure CDF, we calculate the difference in RF values between Ca2+ and Ba2+ after a 20 mV prepulse (g), the value of which is displayed below traces for each exemplar cell (left, bottom). C, CDF in P-type currents of Purkinje neurons isolated from 10-d-old rats. Format as in B, except holding potential was –60 mV. Right, Averaged facilitation data from n = 8 neurons. Plots and numeric values display average ± SEM, here and henceforth. D, A plot of CDF strength g against peak current density J, which reflects the magnitude of global Ca2+ influx, reveals no relationship (r = ∼0.3) for 14 Purkinje neurons that showed CDF. This suggests that CDF is driven by local Ca2+ influx. E, Unchanged CDF during intracellular Ca2+ buffering with a high concentration (10 mm) of the rapid Ca2+ chelator BAPTA compared with that observed with a low concentration (0.5 mm) of the slow Ca2+ chelator EGTA used in other experiments (see C). Format as in C. F, Variable CDI in cerebellar Purkinje neurons. During long (1 s) depolarizations, Ca2+ current (gray) inactivates more rapidly than Ba2+ current (black) in some neurons (left) but not others (right). Ba2+ traces scaled down ∼1.6 times for normalization. A–F, Dashed lines represent zero values here and throughout, unless otherwise indicated. When Ba2+ and Ca2+ traces are superposed, calibration for current amplitude pertains to Ca2+ traces, here and throughout. Aga, Agatoxin IVA; Nimo, nimodipine; TTX, tetrodotoxin.
Electrophysiology. For HEK293 cells, whole-cell currents were recorded 2–4 d after transfection. For Purkinje neurons, recordings started 1 h after dissociation. For HEK293 cells, the bath solution contained the following (in mm): 140 tetraethylammonium-MeSO3, 10 HEPES, and 5 CaCl2 or BaCl2, pH 7.4 (300–310 mOsm). For Purkinje neurons, the bath solution was supplemented with 3 μm nimodipine and 0.6 μm TTX to block inward L-type current and outward Cs+ current through Na+ channels (McDonough et al., 1997), and the concentration of CaCl2 or BaCl2 was increased to 10 mm (except as noted). For both cell types, the internal pipette solution contained the following (in mm): 135 CsMeSO3, 5 CsCl2, 0.5 EGTA, 1 MgCl2, 4 MgATP, and 10 HEPES, pH 7.4 (290–300 mOsm). For certain experiments, ∼300 μm recombinant CaM (rCaM) protein (see Figs. 2, 3) or 2 mm GDPβS (a nonhydrolyzable GDP analog) were added to the internal solution. Holding potentials were generally –60 mV for neurons and –90 mV for HEK293 cells. Depolarizing protocols were delivered each 30 s. Additional details appear in the supplemental data (section 2, available at www.jneurosci.org as supplemental material). All patch seals were formed in the Ba2+ external solution, yielding an ∼10 mV liquid junction potential produced by zeroing pipette current in the bath. For square-pulse voltage protocols, no junction-potential correction was made, so “true” voltages can be obtained by subtracting ∼10 mV from displayed values. For action-potential (see Fig. 6 A–C) and complex-spike waveforms (see Fig. 6 D, E), junction potentials were corrected (e.g., the –70 mV holding potential for Ba2+ traces in Fig. 6 D is junction-potential adjusted). To account for a ∼10 mV surface-charge shift between Ca2+ and Ba2+ bath solutions, we offset these waveforms by ∼10 mV when evoking Ca2+ currents (e.g., the holding potential for Ca2+ currents was –60 mV after junction-potential correction in Fig. 6 D). The Purkinje-cell action-potential and complex-spike waveforms are modified from those kindly provided by Dr. Indira Raman (Northwestern University, Evanston, IL) and Dr. Christian Hansel (Erasmus University, Rotterdam, The Netherlands), respectively. Currents were recorded at room temperature with an Axo-patch 200A amplifier (Axon Instruments, Foster City, CA), filtered at 2 kHz, and digitally acquired and stimulated with custom-written data acquisition programs. Signals were analyzed with programs scripted in Matlab (MathWorks, Natick, MA) and Excel (Microsoft, Seattle, WA), including those for quantification of relative facilitation index (RF) (Chaudhuri et al., 2004). For single comparisons (see Figs. 4, 6), we used the t test for statistical analysis. For comparisons across multiple conditions (see Figs. 2, 3), we performed an ANOVA using the Fischer's protected least significant difference test (Ott, 1993).
Figure 2.

Intracellular perfusion of recombinant CaM protein into HEK293 cells expressing CaV2.1 channels. A–E, Ca2+ currents elicited in the absence (gray) or presence (black) of a prepulse, at ∼5 min (left) or ∼25 min (right) after establishment of whole-cell dialysis. Records within each panel from same cell. Patch pipette loaded with internal solution alone (A) or supplemented with ∼300 μm recombinant purified CaM listed at the left (B–E). A, Baseline decrease in CDF with internal solution alone, as monitored by a change in the RF. B, C, Significant decrease in CDF with rCaM1234 or rCaM34, compared with control (A). D, E, Baseline decrease in CDF with rCaMWT or rCaM12, indistinguishable from control (A). F, Averaged data showing changes in RF, normalized to their initial values, over the course of recording. Initial RF values not significantly different across conditions, averaging to RF = 0.34 ± 0.01 for n = 28 cells. Data averaged into 5 min bins. No difference among no rCaM, rCaM12, and rCaMWT after 25 min recording (p ≫ 0.05; n = 6 cells for no rCaM; n = 8 for rCaMWT; n = 5 for rCaM12). Asterisk indicates significantly lower values for rCaM34 and rCaM1234 (p < 0.05; n = 6 cells rCaM1234; n = 9 for rCaM34) compared with rCaMWT after 25 min recording. Statistical tests here and in Figure 3F account for multiple comparisons (see Materials and Methods), and their outcomes were similar whether performed on raw RF or normalized RF(t)/RFo data. Fits drawn by eye. Dashed lines represent unity (top) or the residual level of prepulse facilitation seen in Ba2+ (bottom).
Figure 3.
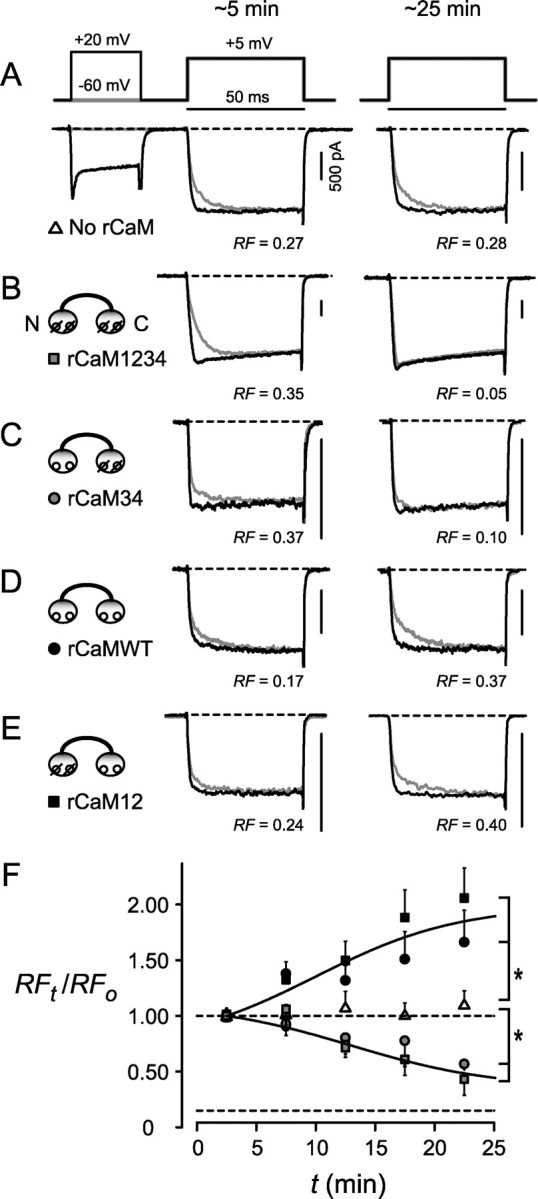
CaM-mediated CDF of native P-type Ca2+ currents, revealed by intracellular perfusion of recombinant CaM protein into Purkinje neurons, mostly derived from P10–P12 rats. A–F, Format as in Figure 2. In A–E, records within each panel are from the same neuron. A, Essentially unchanged CDF over ∼30 min recording with internal solution alone. B, C, Significant decreases in CDF with rCaM1234 or rCaM34 compared with control (A). D, E, Significant increases in CDF with rCaMWT or rCaM12 compared with control (A). F, Averaged RF time course during perfusion, normalized to initial values within individual neurons. Compared with the control condition (No rCaM), rCaM12 and rCaMWT both had significantly higher RF values (p < 0.05; n = 6 neurons for no rCaM; n = 5 for both rCaMWT and rCaM12), whereas rCaM1234 and rCaM34 had significantly lower values (p < 0.05; n = 5 neurons for both rCaM1234 and rCaM34).
Figure 6.

Activity-dependent enhancement of neuronal P-type Ca2+ current during action-potential trains and complex spike waveforms. A, No enhancement of Ca2+ currents during 100 Hz stimulation in neurons lacking CDF (as determined from prepulse protocols; g = 0.05 ± 0.03 for n = 3 neurons). Top trace, Train of action-potential waveforms delivered to neurons in voltage-clamp mode. Middle, Exemplar Ca2+ current from P6 neuron showing no enhancement during train. Bottom, Averages ± SEM of peak current amplitudes on consecutive spikes. Peak current amplitudes on consecutive spikes are normalized to the size of the first spike. Data with Ca2+ and Ba2+ as charge carrier are displayed as labeled. B, No enhancement of Ca2+ currents during 40 Hz stimulation in neurons possessing CDF (as seen with prepulse protocols; g = 0.20 ± 0.01 for n = 5 neurons). Format analogous to that in A. Exemplar traces from P10 neuron. C, Significant enhancement in Ca2+ current during 100 Hz stimulation in neurons possessing CDF. Exemplar trace from same cell as in B. Bottom, Enhancement of current amplitude (115 ± 2% of initial value) compared with Ba2+ current amplitude (105 ± 2% of initial value). Averages from same n = 5 neurons as in B. D, No enhancement of Ca2+ currents generated by complex spikes in neurons lacking CDF. Top, Complex-spike voltage waveform. Middle, Exemplar Ba2+ and Ca2+ currents, taken from same exemplar neuron as in A, superimposed when normalized to the size of the first peak. Ba2+ trace scaled downward ∼1.9 times. Bottom, Average difference trace between normalized waveforms (Inorm,Ca2+ – Inorm,Ba2+) is no different from zero. Averaged from same n = 3 neurons as in A. Error bar shows largest SEM for this difference plot. Integrals of difference traces, proportional to excess charge entry per complex spike, were not different from zero (p ≫ 0.05). E, Significant enhancement of Ca2+ current generated by complex spikes in neurons possessing CDF (g = 0.20 ± 0.01 for n = 7 neurons, including all pf those in B, C), with format as in D. Middle, Exemplar traces from same neuron as in B and C. Bottom, Average of difference traces. Integrals of difference traces significantly positive (p < 0.05).
Figure 4.

Developmental upregulation of CDF during early postnatal period. A, Absence of CDF in Purkinje neurons from 6-d-old rats. Format as in Figure 1C; only Ca2+ current exemplar traces are shown. B, Strong CDF in neurons from 11-d-old rats. Format as in A. C, Graded increase in neuronal CDF between postnatal days 7 and 11, shown by average CDF strength (average g± SEM) plotted against neonatal age. Parentheses enclose number of neurons contributing to each time point average. Fit by eye. D, Protocol for determining the distribution of EF-hand splice variation in CaV2.1 transcripts from single Purkinje neurons. Top, RT-PCR schematic. Gray and black rectangles represent alternatively spliced segments of the CaV2.1 transcript that, respectively, encompass EFa and EFb coding regions. White rectangles signify flanking segments of the CaV2.1 mRNA transcript invariant to alternative splicing. RT product of single neurons was subject to nested PCR using two sets of flanking primers: forward primer I/reverse primer I and then forward primer II/reverse primer I. EFa-specific transcripts were detected by PCR using forward primer II/reverse primer II.EFa. EFb-specific transcripts were detected by PCR using forward primer II/reverse primer II.EFb. Bottom left, Nested PCR products. When applied to RT product of a single Purkinje neuron (Purkinje), nested PCR produces the anticipated 324 bp band representing the amplicon pool of all EF-hand splice variants from that neuron. Unused primer band also present below. Ladder, Extreme left lane. Negative controls, Nested PCR after mock RT procedures, performed without a Purkinje neuron (No cell) or without reverse transcriptase (No RT). These show only a band of unused primers. Positive controls, RT-PCR performed on EFa- or EFb-containing rat CaV2.1 cDNA plasmids (Bourinet et al., 1999) also show the anticipated 324 bp band. Bottom right, EFa/b-specific PCR performed on five individual bacterial clones derived from nested PCR amplicon of a single neuron. Top gel, EFa-specific PCR, demonstrating that three of five clones correspond to EFa variant, as evidenced by anticipated 220 bp band. Bottom gel, EFb-specific PCR, demonstrating that one of five clones corresponds to EFb variant, as shown by presence of expected 220 bp band. Because top and bottom gels had identical lane assignments for clones, it could be deduced that one of five clones showed no amplification product with either EFa- or EFb-specific primers; this clone was deemed “indeterminate” and discarded from calculations of the percentage of EFa clones from a single neuron. E, Average ± SEM percentage of clones possessing the EFa splice variant in Purkinje neurons isolated from 5- versus 12-d-old rats, indicating age-dependent enhancement in the EFa/EFb transcript ratio (p < 0.05). Averages accumulated from six neurons for each age, and 20–30 determinate clones amassed for each neuron to calculate percentage of EFa transcript in a neuron.
Purification of recombinant CaMs. cDNAs encoding various CaM molecules were subcloned in pET24b(+) (Novagen, Madison, WI), a bacterial expression plasmid. Five hundred milliliter cultures of BL21(DE3) bacterial cells (Stratagene, La Jolla, CA), transformed with CaM plasmid, were grown at 37°C to OD600 0.6 and induced with 1 mm isopropyl-β-d-thiogalactopyranoside for 3 h. Cells were pelleted and lysed in 50 mm Tris-Cl, pH 7.5, 1 mm EDTA, and 0.1 μg/ml lysozyme. The cellular suspension was clarified by centrifugation (15,000 × g for 20 min at 4°C). The supernatant was brought to 60% saturation with ammonium sulfate, and contaminant proteins were pelleted by centrifugation (10,000 × g for 20 min at 4°C). To precipitate CaM protein, the supernatant was adjusted to 20 mm glycine at pH 4.1 with 25% sulfuric acid and stirred on ice for 15 min. CaM protein was collected by centrifugation (10,000 × g for 10 min at 4°C), resuspended in 10 ml of 50 mm HEPES, pH 7.5, and passed over a 10 ml column of DEAE resin, equilibrated with 10 mm HEPES, pH 7.5. The resin was washed extensively with equilibration buffer, and the protein content of eluate was monitored at OD269. The resin was further washed with the same buffer containing 0.2 m NaCl followed by 0.3 m NaCl until the OD269 approached background levels. Bound CaM protein was eluted with buffer containing 0.5 m NaCl and subsequently precipitated by the ammonium sulfate and acidification procedure described above. The CaM pellet was resuspended in 50 mm HEPES, pH 7.5, and dialyzed extensively against 20 mm HEPES, pH 7.2. Protein concentration was determined by a BCA assay (Pierce, Rockford, IL) and adjusted to 300–400 μm with 20 mm HEPES, pH 7.2. SDS-PAGE revealed a single band at ∼18 kDa (Erickson et al., 2001).
Single-cell reverse transcriptase-PCR. To quantify EF-hand splice distributions in single Purkinje neurons, we modified published methods (Soong et al., 2002; Chaudhuri et al., 2004) (see Fig. 4 D). After dissociation, a single visually identified Purkinje neuron (see Fig. 1 A) was aspirated into a micropipette, which had a tip size approximately two times the neuron diameter and which contained ∼5 μl of internal solution. As a control, one sample contained only bath solution (see Fig. 4 D, No cell). After aspiration, the micropipette tip was broken off and expulsed, along with the micropipette contents, into thin-walled PCR tubes. The tubes contained 4 μl of a reverse-transcriptase (RT) solution composed of 1 μl of 5× first strand buffer, 0.5 μl of 0.1 m DTT, 0.25 μl of 10 mm deoxyNTPs, 0.5 μl of either 10 μm reverse primer I or 100 μm random hexamers (all obtained from Invitrogen, Carlsbad, CA), 0.25 μl of RNasin RNase inhibitor (Promega, Madison, WI), 0.25 μl of DEPC-treated water (Quality Biological, Gaithersburg, MD), and 1.25 μl of 1% IGE-PAL nonionic detergent. Tubes, each containing a single Purkinje neuron or control bath solution, were kept on ice while gathering more neurons. After collection of 20–30 neurons, the tubes were heated to 70°C for 3 min, cooled to 4°C, and then spun briefly to collect contents. We then added 0.5 μl of Superscript reverse transcriptase II (Invitrogen) and incubated the tubes at 45°C for 1 h, 70°C for 15 min, and 95°C for 30 s. As control, we omitted reverse transcriptase from one tube containing a Purkinje neuron (see Fig. 4 D, No RT). Next, we added 0.4 μl of RNase H (Invitrogen) to each tube and incubated at 37°C for 30 min before proceeding to PCR steps. To avoid contamination, both the RT reaction (above) and the inner/outer PCRs (below) were performed in a separate laboratory where no previous work with CaV2.1 had been performed. For colony PCRs described below, all solutions were prepared under a hood.
We performed hemi-nested PCR (see Fig. 4 D, top). Primers recognized sequences common to both EF-hand splice variants of rat CaV2.1 (GenBank accession numbers M64373 for EFa complete cDNA and AF051526 for EFb partial cDNA) and were located on splice-invariant exonic regions flanking exon 37. This procedure allowed us to amplify a pool of cDNA clones representing the cellular distribution of EFa and EFb variants in a relatively unbiased manner. Forward primer I (5′-TCCAAAAACCAGAGTGTG-3′) corresponds to positions 5183–5200 of the GenBank accession number M64373 sequence. Reverse primer I (5′-TTGAAGTGAACGGTGTTG-3′) is complementary to this sequence at positions 5517–5534. The nested forward primer II (5′-CGCCTATTTTTACTTTGTC-3′) corresponds to positions 5211–5229. The reaction mix for the initial outer PCR consisted of the whole volume of the RT reaction, to which was added 2.5 μl of 10 μm forward primer I, 2.5 μl of 10 μm reverse primer I, 5 μl of 10× PCR buffer, 1 μl of 10 mm deoxyNTPs, 3 μl of 50 mm MgCl2, 2.5 μl of dimethylsulfoxide (DMSO), 1Uof Taq polymerase, and sufficient water to produce a final volume to 50 μl. All primer and reagents were obtained from Invitrogen, except for the DMSO (Sigma). All PCR mixes were overlaid with mineral oil. For the cycling profile, we denatured at 94°C for 3 min and then performed 20 PCR cycles consisting of denaturation at 94°C for 45 s, annealing at 48°C for 1 min, and extension at 72°C for 45 s. The final extension was at 72°C for 10 min. For the subsequent inner PCR, we added 10 μl of the outer PCR product to a reaction mix consisting of 2 μl of 10 μm forward primer II, 2 μl of 10 μm reverse primer I, 4 μl of 10× PCR buffer, 0.8 μl of 10 mm deoxyNTPs, 2.4 μl of 50 mm MgCl2, 2 μl of DMSO, 1 U of Taq polymerase, and sufficient water to produce a final volume of 40 μl. The cycling profile for the inner PCR was identical to that for the outer PCR, except that the annealing temperature was raised to 52°C. As positive control, we performed both reactions on EFa- and EFb-containing rat (Bourinet et al., 1999) CaV2.1 plasmid cDNA (see Fig. 4 D, EFa,EFb). The expected size of the nested PCR product was 324 bp (see Fig. 4 D, Purkinje). A 5–10 μl aliquot from the second PCR was subject to electrophoresis on a 1% agarose gel to identify tubes with successful reactions and to check control reactions (see Fig. 4 D, No cell, No RT). A 4 μl aliquot from each successful outer PCR reaction was inserted into the TOPO-TA pCR2.1 vector (Invitrogen) and transformed into TOP10 bacterial cells. After overnight culture, we identified bacterial colonies bearing PCR inserts via blue–white selection and subjected these to both EFa- and EFb-specific colony PCRs (see Fig. 4 D, bottom right, II.EFa, II.EFb). We used forward primer II and either reverse primer II.EFa (5′-TATTACTCGCAATAAACTG-3′, positions 5412–5430) or reverse primer II.EFb (5′-CATGTGTCTCAGCATCTGA-3′, positions 717–735 for GenBank accession number AF051526). The reaction mix for these PCRs consisted of 0.2 μl of a single overnight bacterial culture, 1 μl of 10 μm forward primer II, 1 μl of 10 μm reverse primer II.EFa or II.EFb, 2 μl of 10× PCR buffer, 0.4 μl of 10 mm deoxyNTPs, 1.2 μl of 50 mm MgCl2, 1 μl of DMSO, 1 U of Taq polymerase, and sufficient water to produce a final volume of 20 μl. The cycling profile was set to an initial denaturation of 95°C for 3 min, followed by 10 touchdown cycles consisting of denaturation at 95°C for 45 s, annealing at 60°C for 45 s, and extension at 72°C for 15 s. Next, we performed 25 cycles of PCR consisting of denaturation at 95°C for 45 s, annealing at 52°C (for reverse primer II.EFa) or 55°C (for reverse primer II.EFb) for 1 min, and extension at 72°C for 45 s. The final extension step was at 72°C for 10 min. Products from corresponding EFa- and EFb-specific PCR reactions were subject to electrophoresis on a 1.5% agarose gel (see Fig. 4 D, 220 bp). To tabulate the percentage of EFa transcripts, we tallied only those colonies that were positive for the EFa reaction but negative for the EFb or vice versa. Ambiguous results were discarded. For each cell, we counted 20–30 positive clones per cell. Accuracy of the exon-specific PCRs was confirmed by directly sequencing several clones. Tabulation of the number of positives for each splice-specific PCR allowed quantification of the EFa/EFb transcript distribution in each cell. Forward primer I and all reverse primers were identical to primers I–IV by Vigues et al. (2002).
EFa/EFb-specific antibodies. To generate antibodies, we used an EFa-specific peptide DMYSLLRVISPPC (italicized amino acids 1802–1813; Entrez protein NP_037050) or an EFb-specific peptide RGRMPYPDMYQMLRHC (italicized amino acids 231–243; Entrez protein AAC24516, flanking R/C residues added for ease of antibody generation). A C-terminal cysteine was included in both peptides to enable disulfide coupling. The peptides were made by Mimotopes (Clayton, Victoria, Australia). Antibodies were raised from rabbit at the Institute of Medical and Veterinary Science (Adelaide, Australia) and affinity-purified by Mimotopes.
Immunocytochemistry. Reagents and expertise were generously provided by the laboratories of Dr. David Linden and Dr. David Ginty. Five-day-old, 12-d-old, and adult rats were decapitated, and their brains were removed, quick frozen, and sectioned into 8 or 20 μm slices. Slices were fixed in 4% paraformaldehyde for 20 min at 4°C. All incubations were performed at room temperature, unless otherwise noted. For diaminobenzidine (DAB)-stained sections, slices were washed twice in PBS, after which endogenous peroxidase activity was quenched by incubating in methanol with 0.03% H2O2 for 15 min. After two more PBS washes, slices were blocked in PBS containing 3% bovine serum albumin, 0.3% Triton X-100, and 1% normal goat serum (NGS) (Vector Laboratories, Burlingame, CA) for 1.5 h. Slices were then incubated in the primary antibody diluted in the blocking solution (1:40 anti-CaV2.1, 1:20 anti-EFa, and 1:40 anti-EFb) overnight at 4°C. Slices were then washed six times in PBS before incubation for 1 h in secondary antibody (biotinylated goat anti-rabbit; Vector Laboratories) diluted at 1:250 in 3% BSA, 0.1% Triton X-100, and 1% NGS in PBS. After four more PBS washes, slices were incubated in the ABC solution (Vector Laboratories) for 30 min and reacted with DAB for ∼20 min. For immunofluorescence, slices were washed three times in PBS containing 0.5% Triton X-100. Slices were then blocked in 0.5% Triton X-100, 10% NGS in PBS for 1 h, followed by overnight incubation in primary antibody diluted in 0.2% Triton X-100 and 5% NGS. Besides the primary antibodies listed above, slices for immunofluorescence were also incubated with a 1:1000 dilution of mouse anti-calbindin monoclonal antibody. After three more 0.2% Triton X-100 in PBS washes, slices were incubated overnight in the secondary antibodies diluted at 1:1000 in 0.2% Triton X-100 and 5% NGS in PBS. The secondary antibodies were a goat anti-rabbit IgG conjugated with Alexa 488 (green images) and a goat anti-mouse IgG conjugated with Alexa 546 (red images) (Molecular Probes, Eugene, OR). Finally, slices were washed three times in PBS. DAB images were photographed by a color CCD camera. Immunofluorescence imaging was performed by confocal microscopy, and displayed images are merged z stacks. For all P5 and P12 slices (see Fig. 5 A, B), immunostaining was processed in an identical and parallel manner, as was image capture at a given magnification. For adult slices (see Fig. 5C,D), immunostaining and image capture were performed in an analogous parallel manner for EFa and EFb antibodies.
Figure 5.
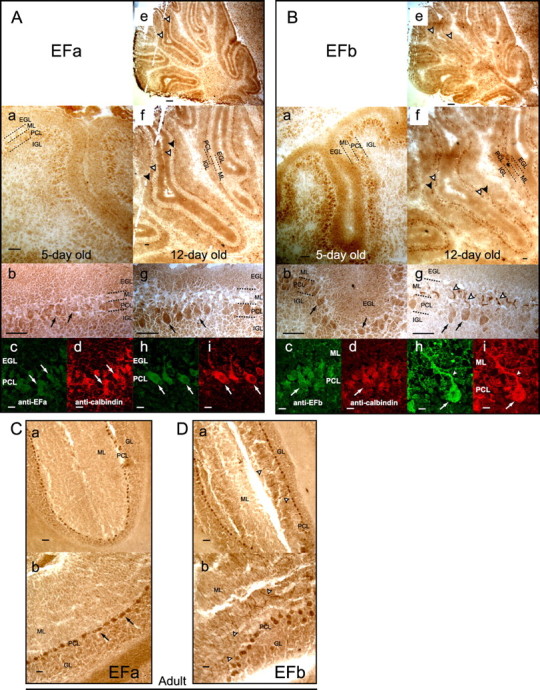
Developmental changes in the expression of EFa and EFb channels. A, Cerebellar slices stained for EFa channels. Left column, Five-day-old rats; right column, 12-d-old rats. Cerebellar layers at these stages, from pial surface inward, are the external granular layer (EGL), ML, PCL, and internal granular layer (IGL). a, b, e, f, g, Slices stained with DAB. c, d, h, i, Paired high-power immunofluorescence images colocalizing channel-specific signal (green) with calbindin signal (red). At day 5, EFa staining is fairly homogenous throughout the cerebellum (a, b). At day 12, there is strong EFa staining in Purkinje cells, visible at high power within individual cells (g, arrows) and at low power as a thin dark line lining the cerebellar (Figure legend continues.)(Figure legend continued.) folia (f, black arrowheads). Within Purkinje cells, EFa channels are restricted to cell bodies, because there is minimal staining within the molecular layer (which contains Purkinje cell dendrites), seen as a thick pale stripe lining the cerebellar folia at low power (f, white arrowheads) or even when viewing the slice as a whole (e, white arrowheads). Scale bars: a, b, f, g, 50 μm; c, d, h, i, 10 μm; e, 200 μm. B, Redistribution of EFb channel splice variant into soma and dendrites during early development. Format as in A. C, Purkinje somata are the dominant locus of EFa expression in adult slices. DAB staining. Scale bars, 50 μm. D, Purkinje somata and dendrites are preferred loci of EFb expression in adult slices. Format as in C.
Results
Native P-type currents exhibit Ca2+-dependent facilitation
To test for Ca2+ regulation of native P-type Ca2+ current, we first recorded from cerebellar Purkinje neurons (Fig. 1A, left) dissociated from 10-d-old rats. To isolate P-type currents (Fig. 1A, right), bath solutions contained 2–3 μm nimodipine and 0.6 μm tetrodotoxin to ensure respective suppression of currents through L-type Ca2+ and Na+ channels (McDonough et al., 1997). Subsequent addition of a specific blocker of CaV2.1 (200 nm agatoxin IVA) all but eliminated currents (Mintz et al., 1992) (Fig. 1A, right) (84 ± 3% blockade; n = 4), confirming effective current isolation (supplemental data, sections 1, 2, available at www.jneurosci.org as supplemental material).
Before considering the possible Ca2+ regulation of these native P-type currents, we display the prototypic appearance of Ca2+/CaM regulation of recombinant CaV2.1 Ca2+ channels (DeMaria et al., 2001; Chaudhuri et al., 2004) expressed in HEK293 cells (Fig. 1B). These profiles provide an essential reference for subsequent comparison with native currents. The rapid CaM regulatory process, CDF, produces an enhancement of current as channels switch from a normal mode of gating to a facilitated one with higher open probability (Lee et al., 2000; DeMaria et al., 2001). CDF was thus resolved experimentally with Ca2+ as charge carrier, as follows. During an isolated test pulse, the Ca2+ current initially activated rapidly into a normal gating mode that would support a level of current approximated by the dotted line in Figure 1B (middle left, gray trace). The transition of channels from normal to facilitated modes then manifested as a slow phase of additional Ca2+ current increase (Fig. 1B, middle left, arrow, gray trace). However, when accompanied by a voltage prepulse, during which Ca2+ entry already leads channels into the facilitated mode, the ensuing test pulse current lacked the slow activation component and instead opened directly to the facilitated level (Fig. 1B, top black trace). The fraction of channels facilitated by the prepulse was quantified by RF, derived from the integrated difference between test pulse traces obtained ± prepulse (Chaudhuri et al., 2004) (Fig. 1B, ΔQ). The resulting RF relation was bell shaped, fitting with a genuine Ca2+-dependent process (Peterson et al., 1999) (Fig. 1B, right, filled circles).
Additional baseline perspective on the CDF process comes from substituting Ba2+ for Ca2+ as charge carrier. In this configuration, channels should not facilitate, because Ba2+ binds very weakly to CaM (Chao et al., 1984). Accordingly, Ba2+ currents evoked by isolated test pulses showed only the rapid activation into the normal mode (Fig. 1B, bottom left, dotted line), and prepulse depolarization produced only minimal enhancement of the test pulse Ba2+ current. It is worth clarifying that these Ba2+ currents lacked a slow facilitating component, not because they were already facilitated but because they reflected channels trapped in the normal mode of gating (single-channel data; D. Chaudhuri and D. T. Yue, unpublished observation). This residual rise of the Ba2+ RF relationship with prepulse voltage (Fig. 1B, right, open circles) may reflect modest background G-protein modulation (DeMaria et al., 2001), and the limited elevation of Ba2+ RF values was little affected by varying the test potential voltage (data not shown). Thus, the difference between Ca2+ and Ba2+ RF relationships (g = 0.32) furnished an index of pure CDF. The second and slower CaM modulatory process, CDI, produced faster decaying Ca2+ versus Ba2+ currents during long conventional depolarizations (1 s; data not shown) (DeMaria et al., 2001; Chaudhuri et al., 2004).
Given this framework, we could immediately identify a related form of CDF in native P-type currents of cerebellar Purkinje neurons (Fig. 1C). The magnitude of CDF for an exemplar neuron (left) was similar to that for recombinant currents in Figure 1B, and population averages (right) demonstrated RF profiles comparable with those in heterologous studies (in HEK293 cells, average g =∼0.21–0.27) (DeMaria et al., 2001; Soong et al., 2002; Chaudhuri et al., 2004). This neuronal CDF was consistently resolved and could be readily observed over a wide range of holding potentials and prepulse protocol waveforms (supplemental data, section 2, available at www.jneurosci.org as supplemental material). A second point of similarity was the selectivity of neuronal CDF for local Ca2+ influx (Soong et al., 2002; Chaudhuri et al., 2004). In particular, a plot of CDF strength (g) against peak current density revealed no interdependence (Fig. 1D) (r2 = 0.3; n = 14), suggesting that enhanced global Ca2+ elevation (approximately proportional to current density) contributes little to CDF (Soong et al., 2002). The large value of the extrapolated zero-current intercept, predictive of the CDF produced by an individual channel (Soong et al., 2002), also favors the adequacy of local Ca2+ influx to drive this regulatory process. Moreover, neuronal CDF was unchanged (Fig. 1E) when substituting 10 mm BAPTA for the 0.5 mm EGTA usually used in the intracellular solution. Because this BAPTA would restrict Ca2+ elevations to nanodomains around individual channels (Augustine et al., 2003), the strong persistence of CDF argues that its activation depends little on global Ca2+ inflow. Finally, to exclude explicitly an appreciable component of G-protein-mediated facilitation, we verified that 25 min internal perfusion of 2 mm GDPβS entirely spared the observed neuronal CDF (g = 0.22 ± 0.03; n = 5) (Ikeda, 1992; Mintz and Bean, 1993; Kanemasa et al., 1995). In summary, the profile of CDF in neuronal P-type currents was quite similar to that of their well characterized recombinant analogs.
In contrast, CDI of P-type currents in Purkinje neurons was highly variable. In some neurons, currents decayed sharply faster with Ca2+ versus Ba2+ (Fig. 1F, left), indicating strong CDI matching that of recombinant channels (DeMaria et al., 2001; Soong et al., 2002; Chaudhuri et al., 2004). In other cells, however, there was little CDI (Fig. 1F, right). Such contrasts might have been anticipated on two grounds. First, given the sensitivity of recombinant CaV2.1 CDI to Ca2+ buffering (Soong et al., 2002; Liang et al., 2003), along with potential variability in the strong intrinsic buffering of these neurons (Fierro and Llano, 1996), one could have predicted such variability in CDI. Second, the prevalence of both β2 and β4 auxiliary subunits in cerebellar Purkinje somata (Ludwig et al., 1997) might also have produced inconstant CDI; as such, inactivation appears weaker in recombinant Ca2+ channels incorporating β4 versus β2 subunits (DeMaria et al., 2001; Stotz et al., 2004). Variable cell-to-cell enhancement of β4 versus β2 subunits could thus induce dispersion of CDI strength. Importantly, however, the strong CDF we observed (Fig. 1C) would be unperturbed by intrinsic Ca2+ buffering, because CDF was unaffected even by 10 mm BAPTA (Fig. 1E). Additionally, recombinant P-type channels incorporating β4 subunits still manifest strong CDF (data not shown). Consequently, our subsequent experiments focused on the CDF process, whose expression was understandably consistent in the Purkinje neuron context.
Calmodulin triggers neuronal Ca2+-dependent facilitation
Despite close similarities in the electrophysiological profile of CDF in Purkinje neurons and heterologous systems, there remained fundamental uncertainties about the underlying Ca2+ sensor, because multiple molecules have been proposed for this role (Lee et al., 2000, 2002; DeMaria et al., 2001; Tsujimoto et al., 2002). Here, we tested whether CaM acts as a resident Ca2+ sensor to produce CDF in Purkinje neurons.
In heterologous expression experiments, CaM interacts constitutively with recombinant channels (Erickson et al., 2001), so that an excess of Ca2+-insensitive mutant CaM usurps channel interaction sites to eliminate CDF in a dominant-negative manner (DeMaria et al., 2001). As well, consistent with preferential triggering by the C-terminal lobe of CaM, CDF is eliminated by mutant CaM molecules lacking Ca2+ binding in their C-lobe but spared by mutant molecules with corresponding N-lobe mutations (DeMaria et al., 2001). This pattern could provide a distinctive signature for an analogous involvement of CaM in native P-type currents. However, the challenge of culturing postnatal Purkinje neurons made it difficult to deliver mutant CaM molecules by plasmid transfection or viral transduction (DeMaria et al., 2001; Alseikhan et al., 2002; Lee et al., 2003), so we acutely introduced recombinant CaM proteins via patch pipette. If exchange of recombinant CaMs were sufficiently rapid (minutes), then the telltale pattern of CaM lobe-specific elimination of CDF should develop during individual recordings. We first performed proof-of-principle experiments on recombinant CaV2.1 expressed in HEK293 cells (Fig. 2). For reference, we monitored the time course of CDF when no recombinant CaM was included in the pipette (Fig. 2A). Test voltage pulses (5 mV) were delivered at 30 s intervals, and alternate test pulses were accompanied by a 20 mV prepulse. This stimulus pattern permitted calculation of facilitation (RF) at 1 min intervals, and such measurements were averaged into 5 min bins (Fig. 2F, open triangle). In the absence of exogenous CaM, RF exhibited some baseline decline over 30 min (Fig. 2A,F). In contrast, during loading mutant CaM with all four Ca2+-binding sites abolished (rCaM1234), RF declined by >50% of its initial value (p < 0.05 compared with no rCaM) (Fig. 2B,F). For reference, the dashed line indicates the level of facilitation seen with Ba2+ (Fig. 2F). Reassuringly, a mutant CaM with Ca2+-binding mutations restricted to its C-lobe (rCaM34) produced an identical decline in RF (p < 0.05) (Fig. 2C,F). Finally, both wild-type CaM (rCaMWT) and the N-lobe CaM mutant (rCaM12) produced only baseline decline (Fig. 2D,F). These results showed that pipette perfusion of rCaMs essentially reproduced previously observed effects using cDNA expression of CaMs (DeMaria et al., 2001).
With this approach in hand, we tested for the role of CaM in neuronal P-type currents (Fig. 3). Absent CaM in the pipette, neuronal CDF maintained a constant baseline (Fig. 3A,F). Inclusion of rCaM1234 or rCaM34 produced a markedly different profile, in which RF was on average halved over the same period (p < 0.05) (Fig. 3F). Additionally, even in cells in which the initial CDF was large compared with the mean (Fig. 3B,C), RF was nonetheless strongly suppressed by these CaM molecules. Finally, the effects of rCaM1234 and rCaM34 were especially notable, because a variety of manipulations detailed previously (e.g., GDPβS or BAPTA) had no discernible effect on CDF. All of these results argued that Ca2+ binding to the C-lobe of CaM is indeed necessary for neuronal CDF. Another class of effects was produced by rCaMWT and rCaM12, both of which markedly enhanced CDF (p < 0.05) (Fig. 3F), even in cells in which the initial CDF was moderate (Fig. 3D,E). These effects not only suggest that Ca2+ binding to the C-lobe of CaM is sufficient for neuronal CDF but raise the possibility that neurons maintain a modulated “set point” for the strength of CDF, as determined by the interaction between CaM and a CDF inhibitory molecule (see Discussion). On average, the initial RF values were not significantly different across all conditions, averaging to 0.22 ± 0.01 over 31 neurons.
Developmental onset of neuronal Ca2+-dependent facilitation
Given the characteristic CDF of the Purkinje neurons studied thus far (from 10-d-old rats), we were initially surprised that CDF was nearly absent in neurons from younger 6-d-old rats (Fig. 4A). On additional investigation, it became apparent that there was an unmistakable activation of CDF over the course of early development (Fig. 4A–C). In particular, the large majority of 10–12 d neurons exhibited robust CDF (Figs. 1C, 4B), whereas most 5–6 d neurons showed little CDF (Fig. 4A). Between these extremes was a graded increase in CDF (Fig. 4C).
An attractive hypothesis for the developmental switching of CDF derives from the recent finding that alternative splicing of the main α12.1 pore-forming subunit of CaV2.1 can act as a molecular on/off switch for CaM-mediated CDF. In particular, mutually exclusive splicing produces two versions of a C-tail segment resembling an EF hand (Soong et al., 2002; Chaudhuri et al., 2004), for which heterologous expression studies demonstrate that the EFa variant permits CDF, whereas the EFb variant switches “off” CDF (Chaudhuri et al., 2004). Furthermore, studies at the transcript level hint at strong spatial and developmental regulation across the brain (Vigues et al., 2002; Chaudhuri et al., 2004). Finally, EFa transcripts may also be upregulated postnatally in the cerebellum (Vigues et al., 2002).
To directly gauge the prevalence of EFa and EFb transcripts in the relevant locus, we performed RT-PCR on individual cerebellar Purkinje neurons (Fig. 1A). The reverse transcriptase product from individual neurons was PCR amplified with nested primers flanking the entire EF-hand region (Fig. 4D, top), and the product (bottom left, 324 bp) was cloned in bacteria. Twenty to 30 bacterial colonies (derived from a single neuron) were then PCR amplified with splice-specific primers (bottom right, 220 bp), enabling determination of the ratio of EFa to EFb transcripts in individual neurons (Fig. 4E) (Welling et al., 1997; Regan et al., 2000; Splawski et al., 2004; Fan et al., 2005). Whereas EFa and EFb were equivalent at 5 d, EFa predominated by 12 d. Although the relative increase of EFa transcript was less pronounced than the age-dependent elevation of CDF (Fig. 4C), the observed change in EFa/EFb transcriptional profile was nonetheless consistent with the developmental enhancement of CDF (Fig. 4C), especially considering precedents for some dissonance between bulk transcript and protein expression levels (Gebauer and Hentze, 2004). A substantial increase in the ratio of EFa/EFb transcripts was also suggested by previous in situ hybridization detection of mRNA, performed on cerebellar slices (Vigues et al., 2002).
More informative was assessment of EFa and EFb channel protein levels. We labeled cerebellar slices with antibodies specific for EFa or EFb variants of CaV2.1 (Fig. 5) (supplemental data, section 3, available at www.jneurosci.org as supplemental material), because isolating and immunoblotting small samples of Purkinje neurons was beyond the sensitivity threshold of our antibodies. Staining with EFa antibody corroborated a developmental increase of EFa channels within Purkinje neuron bodies (Fig. 5A). At day 5 (left column), EFa staining showed a modest and essentially even distribution throughout all layers, with unexceptional expression in Purkinje somata (Fig. 5Ab, arrows). Of note, no dendritic staining of Purkinje cells is expected because neurons at this age lack dendrites and feature only an apical swelling (Altman and Bayer, 1997). Also important was that localization of EFa staining to Purkinje somata was confirmed by overlapping immunofluorescence from EFa channels (green) and calbindin (red), a Purkinje-cell marker (Fig. 5Ac,Ad, arrows). In contrast, at day 12 (Fig. 5A, right column), EFa channels in Purkinje cell bodies represented a dominant locus of this variant throughout the cerebellum. This expression profile was already apparent in lower-power views, in which the Purkinje cell layer (PCL) featured a string of darkly stained bodies (Fig. 5Af, black arrowheads), whereas there was minimal signal in the molecular layer (ML) containing the primary dendrites of Purkinje neurons (Fig. 5Ae,Af, white arrowheads). Higher-power views at day 12 confirmed the overall restriction of strong EFa staining to Purkinje somata (Fig. 5Ag,Ah,Ai, arrows), and this trend was further established by the selective profile of EFa staining in adult slices (Fig. 5C).
Experiments with the EFb antibody (Fig. 5B) revealed a different pattern of developmental regulation. In contrast to EFa, the pattern of EFb staining already showed enrichment in Purkinje somata at day 5 (left column). Lower-power views exhibited dark punctate staining within the PCL (Fig. 5Ba), and higher-power views confirmed that such staining was localized to Purkinje somata (Fig. 5Bb,Bc,Bd, arrows). At day 12 (right column), EFb staining appeared essentially unchanged in Purkinje cell bodies, because lower-power views confirmed maintenance of a track of dark bodies in the PCL (Fig. 5Bf, black arrowhead) and higher-power images identified these bodies as Purkinje somata (Fig. 5Bb,Bc,Bd, arrows). Adult slices corroborated the continued enrichment of EFb signal in Purkinje somata (Fig. 5D, PCL). These results (Fig. 5B,D), coupled with the growing expression of EFa in the same locus (Figs. 5A,C), are consistent with the developmental activation of CDF in Purkinje neuron bodies (Fig. 4C).
Beyond the shift in somatic EFa/EFb prevalence, EFb staining at day 12 revealed another notable feature: strong EFb intensification in the ML, readily appreciated in lower-power images as a string of punctate signals in this layer (Fig. 5Be,Bf, white arrowheads). Along with the signals of Purkinje bodies, the ML intensifications gave rise to a railroad-track-like pattern in lower-power images (Fig. 5Bf, white and black arrowheads). Higher-power views established that the intense, molecular layer signals likely arise from a dominance of EFb channels in Purkinje dendrites, because the signal-enhanced structures, in multiple instances, could be traced back to Purkinje bodies (Fig. 5Bg,Bh,Bi, white arrowhead) and colocalized with calbindin as well (Fig. 5Bh,Bi). By adulthood, the enhancement of EFb staining in Purkinje neuron dendritic structures was yet further established (Fig. 5D, white arrowheads). In keeping with a predominance of EFb channels within these dendritic structures, it is interesting that postsynaptic P-type currents in the brainstem reportedly lack CDF (Inchauspe et al., 2004).
Physiological impact of Ca2+-dependent facilitation
This developmental perspective underscored a key remaining question: whether the presence of CDF would detectably alter Ca2+ entry during physiological stimuli. Thus far, we had only used rectangular depolarizations for characterization of CDF, so as to optimize its biophysical resolution. We therefore gauged the impact of CDF during characteristic physiological stimulus patterns: trains of simple action potentials typical during parallel fiber input, and complex spikes generated by the extensive climbing-fiber synapse (Bell and Grimm, 1969). Simple and complex-spike waveforms were modified from those provided by Dr. Indira Raman and Dr. Christian Hansel, respectively.
In fact, voltage-clamped action-potential trains unmasked a frequency-dependent enhancement of Ca2+ currents observed when CDF was present. In neurons with weak CDF (g < 0.15) (see Fig. 7D), stimulation at either a basal frequency (Bell and Grimm, 1969) of 40 Hz (data not shown) or at a burst frequency (Bell and Grimm, 1969) of 100 Hz (Fig. 6A) produced no enhancement of P-type current. Similarly, in neurons displaying obvious CDF (g > 0.15), 40 Hz stimulation also produced no increase of Ca2+ or Ba2+ responses (Fig. 6B). However, 100 Hz stimulation of these same neurons produced clear facilitation of Ca2+ over Ba2+ currents (Fig. 6C), and such facilitation could contribute to short-term synaptic potentiation between Purkinje and deep cerebellar neurons (Tsodyks and Markram, 1997; Pedroarena and Schwarz, 2003).
Figure 7.
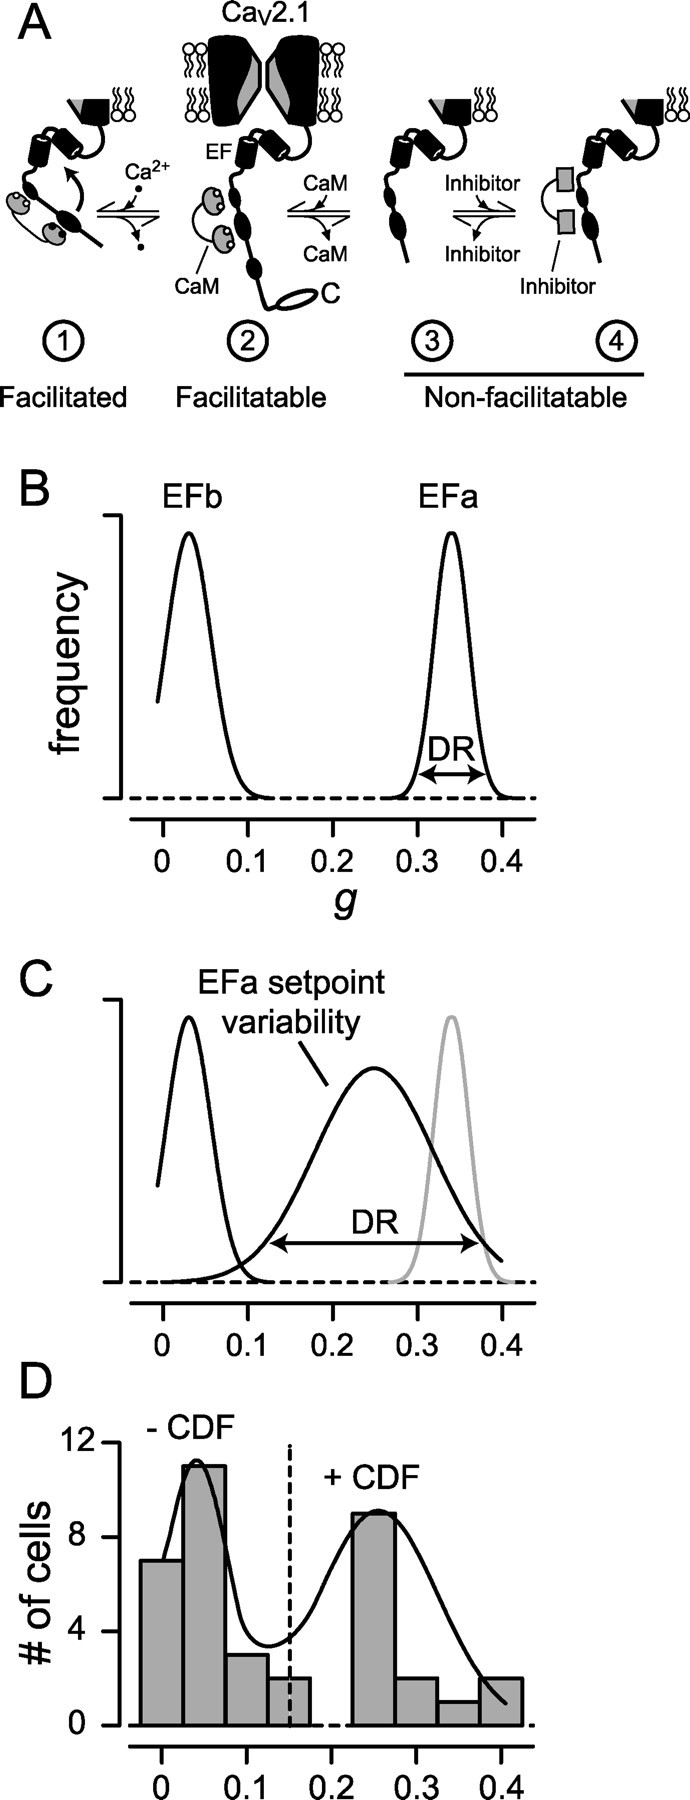
Higher-order neuronal regulation of CDF. A, State diagram depicting hypothetical interaction scheme for set point control of neuronal CDF. Diagrams are C-terminal regions of CaV2.1 important for CaM-mediated CDF, including EF-hand segment (Chaudhuri et al., 2004) as labeled. Only channels associated with resident CaM (state 2) can facilitate by Ca2+/CaM-driven transition into the facilitated conformation (state 1). If channels lack a resident CaM (state 3) or are associated with a CaM-like inhibitory molecule (state 4), they cannot facilitate (reach state 1). The intermediate set point level of CDF normally encountered in pristine neurons reflects partitioning of channels among facilitatable (state 2) and nonfacilitatable conformations (states 3 and/or 4). Perfusion of rCaM34 or rCaM1234 drives channels into nonfacilitatable state 4, in which these recombinant CaMs serve as inhibitory molecules. In contrast, perfusion of rCaMWT or rCaM12 drives channels into state 2, thereby boosting CDF. B, Alternative splicing of the EF-hand locus creates facilitating (EFa) and nonfacilitating (EFb) pools of channels, producing the two-peaked distribution of CDF strengths. In isolation, the dynamic range (DR) of CDF strength for each variant is expected to be narrow (Chaudhuri et al., 2004). C, A set point mechanism, perhaps involving an inhibitory molecule (see A), extends the modulation produced in B. The set point process would widen the dynamic range of CDF when present. This mechanism should then leave the EFb distribution unchanged but broaden and shift leftward the initial EFa peak in A. Thus, CDF of EFa channels is modulated downward to a set point level. D, Experimental distributions formed by pooling CDF values from neurons of all ages (Fig. 4C) actually comprise two clear peaks (bars), as predicted by the sum (solid curve) of distributions in B. A cutoff g value of 0.15 (vertical dashed line) discriminated well between these two presumed populations.
Stronger effects of CDF were observed when stimulating with complex-spike waveforms (Fig. 6D, top). For neurons with weak CDF (g < 0.15), normalized Ca2+ and Ba2+ currents were essentially identical (Fig. 6D, middle). The lack of difference between these traces (Fig. 6D, bottom) explicitly documented the absence of CDF effects in population data. In contrast, for neurons possessing strong CDF (g > 0.15), Ca2+ currents were clearly augmented after the initial peak (Fig. 6E, middle) compared with corresponding Ba2+ currents. The difference trace (Fig. 6E, bottom) shows that CDF produced several-fold enhancement of Ca2+ influx in the latter phase of the complex waveform and an overall ∼20% excess in Ca2+ charge entry. This enhanced influx reflects the ongoing effects of channel facilitation after the first spike of Ca2+ current. Given the supralinear relationship between free intracellular Ca2+ concentration and Ca2+ current in these neurons (Maeda et al., 1999), the enduring enhancement of Ca2+ influx by CDF (Fig. 6E) seems poised to amplify responses requiring global and/or prolonged Ca2+ elevations.
Discussion
P-type Ca2+ currents of cerebellar Purkinje neurons exhibit Ca2+-dependent facilitation, recapitulating discriminating mechanisms previously resolved only in heterologous systems. CaV2.1 seems constitutively associated with CaM; the CaM C-lobe selectively triggers CDF, responding to local Ca2+ influx, and CaV2.1 EFa/EFb splice variation acts as a molecular switch for CDF. Our experiments also reveal new aspects of regulation in the neuronal setting: a potential set point control of CDF and spatio-developmental activation by adjusting levels of EFa/EFb channels. Finally, CDF appears to augment Ca2+ entry during physiological stimuli in Purkinje neurons. We explore the implications of these findings in the subsequent sections.
Basic mechanisms of CDF
The mechanisms underlying CaV2.1 CDF have appeared complex, partly because of contrasting results between recombinant channels (DeMaria et al., 2001; Soong et al., 2002; Chaudhuri et al., 2004) and native currents at the calyx of Held (Borst and Sakmann, 1998; Cuttle et al., 1998). Despite the kinetic similarity of CDF observed in all systems to date, the effects of intracellular Ca2+ buffering have diverged. Unlike the elimination of calyceal
CDF with elevated buffering (Borst and Sakmann, 1998; Cuttle et al., 1998), the CDF of recombinant CaV2.1 channels remain unchanged even with 10 mm BAPTA, indicating preferential activation by local Ca2+ (Soong et al., 2002; Chaudhuri et al., 2004). Moreover, the identity of the Ca2+ sensor for CDF has defied simple unification. NCS-1 has been proposed as Ca2+ sensor for calyceal CDF (Sakaba and Neher, 2001; Tsujimoto et al., 2002), whereas CaM is likely to be the sensor for CDF of recombinant CaV2.1 channels (Lee et al., 1999, 2003; DeMaria et al., 2001). These incongruencies may reflect distinct CDF mechanisms, because even NCS-1 effects appear variable in different neuronal types (Weiss and Burgoyne, 2001; Sippy et al., 2003). Given this diversity of CDF, the agreement of Purkinje neuron CDF with that of recombinant CaV2.1 channels provides important evidence that the CaM-based regulatory mechanisms described for heterologous studies will pertain to certain neuronal contexts.
Higher-order regulation of CDF in neurons
Beyond basic mechanism, the existence of higher-order regulation of neuronal CDF raises new and intriguing possibilities. A first extra dimension of regulation concerns the result that CDF manifests at a submaximal level, which can be enhanced by perfusion of excess rCaMWT (Fig. 3F). This incomplete penetrance can be explained by a hypothetical scheme (Fig. 7A) based on competition among wild-type and mutant CaM molecules in recombinant channels (DeMaria et al., 2001; Lee et al., 2003; Chaudhuri et al., 2004). In this view, channels adorned by a resident CaM (or rCaM12) (state 2) are capable of facilitation during Ca2+ binding to the C-terminal lobe of CaM (state 1). In contrast, those lacking an onboard CaM (state 3), or populated with an “inhibitory CaM” that mimics the action of rCaM34 or rCaM1234 (state 4), are considered nonfacilitatable (Liang et al., 2003) (states 3 and 4). Thus, if endogenous CaM were in short supply (thereby enriching state 3) or if there were a natural inhibitory CaM analog in neurons (populating state 4), perfusion of rCaMWT (or rCaM12) would increase the prevalence of facilitatable channels (state 2), thereby adjusting upwards the extent of CDF. Given that local endogenous CaM concentration near Ca2+ channels is probably enriched (Mori et al., 2004), CaM competition with a natural inhibitor seems the more likely scenario. Adjusting the ratio between levels of endogenous CaM and the naturally occurring inhibitor would thus permit a mechanism of set point control of CDF.
Two CaM-like proteins, Ca2+-binding protein-1 (CaBP1) and NCS-1, are prevalent in cerebellar Purkinje cells (Lee et al., 2002; Jinno et al., 2003) and could represent such inhibitors. In heterologous experiments, CaBP1 reportedly inhibits CDF of CaV2.1 channels (Lee et al., 2002). However, CaBP1 was also found to accelerate voltage-dependent inactivation of channels, a feature not apparent in neurons (Fig. 1D). It is also relevant that NCS-1 lacks Ca2+ binding at one of its EF hands in the N-lobe but possesses high-affinity interaction at its other three sites, sufficient to allow appreciable Ca2+ binding under basal conditions (Hilfiker, 2003). Therefore, it is conceivable that NCS-1 is an analog of rCaM12 to which Ca2+ is already bound at baseline. In the system in Figure 7A, such molecules would trap channels in the facilitated state (state 1), resulting in a tonic enhancement of current with elimination of activity-dependent CDF, just as observed with NCS-1 perfusion in the calyx of Held (Tsujimoto et al., 2002). In this context, however, adding recombinant CaMs should decrease overall current amplitudes, an effect not observed in Purkinje neurons (data not shown). In all, we favor the possibility that yet another CaM-like inhibitory molecule maintains a set point for CDF in Purkinje cells, especially because coexpression of either CaBP1 or NCS-1 with recombinant CaV2.1 channels in HEK293 cells did not detectably alter facilitation (supplemental data, section 4, available at www.jneurosci.org as supplemental material).
A second higher-order dimension is the developmental activation of CDF by an increase in EFa versus EFb channel splice variants in Purkinje neurons. Previous studies have hinted at an age-related change in corresponding mRNA transcripts (Vigues et al., 2002), although the functional consequences remained unclear. Here, we detect a developmental increase in EFa/EFb transcripts at the level of isolated Purkinje neurons (Fig. 4D,E). Additionally, we use EFa/EFb-specific antibodies (Fig. 5) to resolve an increase of EFa channel proteins in Purkinje somata (Fig. 5), consistent with the functional switching of CDF (Fig. 4A–C). In addition, the age-regulated distribution of EFa/EFb splice variants between somatic and dendritic structures (Fig. 5) raises the possibility of subcellular gradients of CDF and motivates a search for the mechanisms underlying precision targeting of splice variants (Maximov et al., 1999; Zamponi, 2003; Hu et al., 2005).
The interplay of set point control and EFa/EFb splice variation produces the actual profile of CDF observed in neurons. Absent set point control (Fig. 7B), a histogram of CDF strengths (g) accumulated over many cells would form two narrow peaks whose amplitudes correspond to EFa and EFb channel levels (Fig. 7B), much as observed during expression of recombinant CaV2.1 channels in HEK293 cells. Adding set point modulation would spare the EFb peak but broaden the dynamic range of the EFa component (Fig. 7C) because of variable CDF penetrance of EFa channels. The sum of the two resultant elements then represents the overall distribution of CDF strengths determined experimentally (Fig. 7D).
Potential neurobiological consequences of CDF
The higher-order regulation of neuronal CDF suggests that this Ca2+ feedback modulation may be critical to neuronal circuits, like those in cerebellar microcomplexes (Ito, 2002). Although the impact of CDF on neurobiology remains to be established, it is worth elaborating the possibilities as a framework for future work. First, during a complex spike produced by climbing-fiber input, CDF of somatic EFa channels could amplify and prolong Ca2+ entry (Fig. 6E), thereby enhancing the pause in activity produced by KCa channels after a complex spike (Schmolesky et al., 2002). This would accentuate an immediate drop in Purkinje neuron inhibitory output, believed important for rapid adjustments of cerebellar feedback (Robinson, 1976). Second, over a longer timescale, the CDF-mediated boost and prolongation of Ca2+ influx during complex spikes could intensify parallel-fiber long-term depression (LTD). In particular, somatic CDF would heighten Ca2+ activation of nuclear transcription factors (Ahn et al., 1999) and support supralinear elevation of dendritic [Ca2+] resulting from coincident local dendritic Ca2+ release (Maeda et al., 1999). Of related importance, the subcellular targeting of nonfacilitating EFb channels to dendrites (Fig. 5D) may limit elevation of dendritic [Ca2+] during parallel-fiber activation that lacks coincident climbing-fiber input, thus restricting inappropriate induction of LTD (Coesmans et al., 2004). It is interesting that the developmental activation of CDF (Fig. 4C) occurs near the onset of cerebellar-dependent associative conditioning (Freeman and Nicholson, 2004). Third, over an even longer timescale, CDF induced over multiple stimuli could activate gene transcription and remodeling (Bradley and Finkbeiner, 2002; Kirov et al., 2004; Konur and Ghosh, 2005), perhaps contributing to pruning of multiple climbing-fiber innervations on single Purkinje neurons (Miyazaki et al., 2004). Similarly, in the brain as a whole, the 2–3 week postnatal period features the onset of obvious pathology in α12.1 knock-out mice (Jun et al., 1999; Fletcher et al., 2001; Urbano et al., 2003; Miyazaki et al., 2004; Piedras-Renteria et al., 2004), contemporaneous with overall upregulation of EFa channels (Vigues et al., 2002; Chaudhuri et al., 2004). These considerations, with our experiments linking neuronal CDF and EFa channels, suggest that CaM-mediated facilitation may be central to the neurobiological function of CaV2.1.
Footnotes
This work was supported by a National Institutes of Health Medical Scientist Training Program award (D.C.), National Medical Research Council and Biomedical Research Council, Singapore (T.W.S.), and grants from the National Institutes of Health (D.T.Y.). We thank Melissa Regan for advice on single-cell RT-PCR, Chris Deppman and Hiroshi Nishiyama for input on immunostaining of cerebellar slices, and Philemon Yang for technical assistance with neuronal isolations.
Correspondence should be addressed to David T. Yue, The Johns Hopkins University School of Medicine, Calcium Signals Laboratory, Ross 713, 720 Rutland Avenue, Baltimore, MD 21205. E-mail: dyue@bme.jhu.edu.
DOI:10.1523/JNEUROSCI.2253-05.2005
Copyright © 2005 Society for Neuroscience 0270-6474/05/258282-13$15.00/0
References
- Ahn S, Ginty DD, Linden DJ (1999) A late phase of cerebellar long-term depression requires activation of CaMKIV and CREB. Neuron 23: 559–568. [DOI] [PubMed] [Google Scholar]
- Alseikhan BA, DeMaria CD, Colecraft HM, Yue DT (2002) Engineered calmodulins reveal the unexpected eminence of Ca2+ channel inactivation in controlling heart excitation. Proc Natl Acad Sci USA 99: 17185–17190. [DOI] [PMC free article] [PubMed] [Google Scholar]
- Altman J, Bayer SA (1997) Development of the cerebellar system: in relation to its evolution, structure, and functions. Boca Raton, FL: CRC.
- Augustine GJ, Santamaria F, Tanaka K (2003) Local calcium signaling in neurons. Neuron 40: 331–346. [DOI] [PubMed] [Google Scholar]
- Bell CC, Grimm RJ (1969) Discharge properties of Purkinje cells recorded on single and double microelectrodes. J Neurophysiol 32: 1044–1055. [DOI] [PubMed] [Google Scholar]
- Borst JG, Sakmann B (1998) Facilitation of presynaptic calcium currents in the rat brainstem. J Physiol (Lond) 513: 149–155. [DOI] [PMC free article] [PubMed] [Google Scholar]
- Borst JG, Sakmann B (1999) Depletion of calcium in the synaptic cleft of a calyx-type synapse in the rat brainstem. J Physiol (Lond) 521: 123–133. [DOI] [PMC free article] [PubMed] [Google Scholar]
- Bourinet E, Soong TW, Sutton K, Slaymaker S, Mathews E, Monteil A, Zamponi GW, Nargeot J, Snutch TP (1999) Splicing of α1A subunit gene generates phenotypic variants of P- and Q-type calcium channels. Nat Neurosci 2: 407–415. [DOI] [PubMed] [Google Scholar]
- Bradley J, Finkbeiner S (2002) An evaluation of specificity in activity-dependent gene expression in neurons. Prog Neurobiol 67: 469–477. [DOI] [PubMed] [Google Scholar]
- Chao SH, Suzuki Y, Zysk JR, Cheung WY (1984) Activation of calmodulin by various metal cations as a function of ionic radius. Mol Pharmacol 26: 75–82. [PubMed] [Google Scholar]
- Chaudhuri D, Chang SY, DeMaria CD, Alvania RS, Soong TW, Yue DT (2004) Alternative splicing as a molecular switch for Ca2+/calmodulin-dependent facilitation of P/Q-type Ca2+ channels. J Neurosci 24: 6334–6342. [DOI] [PMC free article] [PubMed] [Google Scholar]
- Coesmans M, Weber JT, De Zeeuw CI, Hansel C (2004) Bidirectional parallel fiber plasticity in the cerebellum under climbing fiber control. Neuron 44: 691–700. [DOI] [PubMed] [Google Scholar]
- Cuttle MF, Tsujimoto T, Forsythe ID, Takahashi T (1998) Facilitation of the presynaptic calcium current at an auditory synapse in rat brainstem. J Physiol (Lond) 512: 723–729. [DOI] [PMC free article] [PubMed] [Google Scholar]
- DeMaria CD, Soong TW, Alseikhan BA, Alvania RS, Yue DT (2001) Calmodulin bifurcates the local Ca2+ signal that modulates P/Q-type Ca2+ channels. Nature 411: 484–489. [DOI] [PubMed] [Google Scholar]
- Dunlap K, Luebke JI, Turner TJ (1995) Exocytotic Ca2+ channels in mammalian central neurons. Trends Neurosci 18: 89–98. [PubMed] [Google Scholar]
- Erickson MG, Alseikhan BA, Peterson BZ, Yue DT (2001) Preassociation of calmodulin with voltage-gated Ca2+ channels revealed by FRET in single living cells. Neuron 31: 973–985. [DOI] [PubMed] [Google Scholar]
- Fan QI, Vanderpool KM, Chung HS, Marsh JD (2005) The L-type calcium channel alpha 1C subunit gene undergoes extensive, uncoordinated alternative splicing. Mol Cell Biochem 269: 153–163. [DOI] [PubMed] [Google Scholar]
- Fierro L, Llano I (1996) High endogenous calcium buffering in Purkinje cells from rat cerebellar slices. J Physiol (Lond) 496: 617–625. [DOI] [PMC free article] [PubMed] [Google Scholar]
- Fletcher CF, Tottene A, Lennon VA, Wilson SM, Dubel SJ, Paylor R, Hosford DA, Tessarollo L, McEnery MW, Pietrobon D, Copeland NG, Jenkins NA (2001) Dystonia and cerebellar atrophy in Cacna1a null mice lacking P/Q calcium channel activity. FASEB J 15: 1288–1290. [DOI] [PubMed] [Google Scholar]
- Flink MT, Atchison WD (2003) Ca2+ channels as targets of neurological disease: Lambert-Eaton Syndrome and other Ca2+ channelopathies. J Bioenerg Biomembr 35: 697–718. [DOI] [PubMed] [Google Scholar]
- Forsythe ID, Tsujimoto T, Barnes-Davies M, Cuttle MF, Takahashi T (1998) Inactivation of presynaptic calcium current contributes to synaptic depression at a fast central synapse. Neuron 20: 797–807. [DOI] [PubMed] [Google Scholar]
- Freeman Jr JH, Nicholson DA (2004) Developmental changes in the neural mechanisms of eyeblink conditioning. Behav Cogn Neurosci Rev 3: 3–13. [DOI] [PMC free article] [PubMed] [Google Scholar]
- Gebauer F, Hentze MW (2004) Molecular mechanisms of translational control. Nat Rev Mol Cell Biol 5: 827–835. [DOI] [PMC free article] [PubMed] [Google Scholar]
- Hilfiker S (2003) Neuronal calcium sensor-1: a multifunctional regulator of secretion. Biochem Soc Trans 31: 828–832. [DOI] [PubMed] [Google Scholar]
- Hu Q, Saegusa H, Hayashi Y, Tanabe T (2005) The carboxy-terminal tail region of human Cav2.1 (P/Q-type) channel is not an essential determinant for its subcellular localization in cultured neurones. Genes Cells 10: 87–96. [DOI] [PubMed] [Google Scholar]
- Ikeda SR (1992) Prostaglandin modulation of Ca2+ channels in rat sympathetic neurones is mediated by guanine nucleotide binding proteins. J Physiol (Lond) 458: 339–359. [DOI] [PMC free article] [PubMed] [Google Scholar]
- Inchauspe CG, Martini FJ, Forsythe ID, Uchitel OD (2004) Functional compensation of P/Q by N-type channels blocks short-term plasticity at the calyx of held presynaptic terminal. J Neurosci 24: 10379–10383. [DOI] [PMC free article] [PubMed] [Google Scholar]
- Ito M (2002) Historical review of the significance of the cerebellum and the role of Purkinje cells in motor learning. Ann NY Acad Sci 978: 273–288. [DOI] [PubMed] [Google Scholar]
- Jinno S, Jeromin A, Roder J, Kosaka T (2003) Compartmentation of the mouse cerebellar cortex by neuronal calcium sensor-1. J Comp Neurol 458: 412–424. [DOI] [PubMed] [Google Scholar]
- Jun K, Piedras-Renteria ES, Smith SM, Wheeler DB, Lee SB, Lee TG, Chin H, Adams ME, Scheller RH, Tsien RW, Shin HS (1999) Ablation of P/Q-type Ca2+ channel currents, altered synaptic transmission, and progressive ataxia in mice lacking the α1A-subunit. Proc Natl Acad Sci USA 96: 15245–15250. [DOI] [PMC free article] [PubMed] [Google Scholar]
- Kanemasa T, Asakura K, Ninomiya M (1995) kappa-opioid agonist U50488 inhibits P-type Ca2+ channels by two mechanisms. Brain Res 702: 207–212. [DOI] [PubMed] [Google Scholar]
- Kirov SA, Goddard CA, Harris KM (2004) Age-dependence in the homeostatic upregulation of hippocampal dendritic spine number during blocked synaptic transmission. Neuropharmacology 47: 640–648. [DOI] [PubMed] [Google Scholar]
- Konur S, Ghosh A (2005) Calcium signaling and the control of dendritic development. Neuron 46: 401–405. [DOI] [PubMed] [Google Scholar]
- Lee A, Wong ST, Gallagher D, Li B, Storm DR, Scheuer T, Catterall WA (1999) Ca2+/calmodulin binds to and modulates P/Q-type calcium channels. Nature 399: 155–159. [DOI] [PubMed] [Google Scholar]
- Lee A, Scheuer T, Catterall WA (2000) Ca2+/calmodulin-dependent facilitation and inactivation of P/Q-type Ca2+ channels. J Neurosci 20: 6830–6838. [DOI] [PMC free article] [PubMed] [Google Scholar]
- Lee A, Westenbroek RE, Haeseleer F, Palczewski K, Scheuer T, Catterall WA (2002) Differential modulation of CaV2.1 channels by calmodulin and Ca2+-binding protein 1. Nat Neurosci 5: 210–217. [DOI] [PMC free article] [PubMed] [Google Scholar]
- Lee A, Zhou H, Scheuer T, Catterall WA (2003) Molecular determinants of Ca2+/calmodulin-dependent regulation of CaV2.1 channels. Proc Natl Acad Sci USA 100: 16059–16064. [DOI] [PMC free article] [PubMed] [Google Scholar]
- Liang H, DeMaria CD, Erickson MG, Mori MX, Alseikhan BA, Yue DT (2003) Unified mechanisms of Ca2+ regulation across the Ca2+ channel family. Neuron 39: 951–960. [DOI] [PubMed] [Google Scholar]
- Ludwig A, Flockerzi V, Hofmann F (1997) Regional expression and cellular localization of the α1 and β subunit of high voltage-activated calcium channels in rat brain. J Neurosci 17: 1339–1349. [DOI] [PMC free article] [PubMed] [Google Scholar]
- Maeda H, Ellis-Davies GC, Ito K, Miyashita Y, Kasai H (1999) Supralinear Ca2+ signaling by cooperative and mobile Ca2+ buffering in Purkinje neurons. Neuron 24: 989–1002. [DOI] [PubMed] [Google Scholar]
- Maximov A, Sudhof TC, Bezprozvanny I (1999) Association of neuronal calcium channels with modular adaptor proteins. J Biol Chem 274: 24453–24456. [DOI] [PubMed] [Google Scholar]
- McDonough SI, Mintz IM, Bean BP (1997) Alteration of P-type calcium channel gating by the spider toxin omega-Aga-IVA. Biophys J 72: 2117–2128. [DOI] [PMC free article] [PubMed] [Google Scholar]
- Mintz IM, Bean BP (1993) GABAB receptor inhibition of P-type Ca2+ channels in central neurons. Neuron 10: 889–898. [DOI] [PubMed] [Google Scholar]
- Mintz IM, Venema VJ, Swiderek KM, Lee TD, Bean BP, Adams ME (1992) P-type calcium channels blocked by the spider toxin omega-Aga-IVA. Nature 355: 827–829. [DOI] [PubMed] [Google Scholar]
- Miyazaki T, Hashimoto K, Shin HS, Kano M, Watanabe M (2004) P/Q-type Ca2+ channel α1A regulates synaptic competition on developing cerebellar Purkinje cells. J Neurosci 24: 1734–1743. [DOI] [PMC free article] [PubMed] [Google Scholar]
- Mori MX, Erickson MG, Yue DT (2004) Functional stoichiometry and local enrichment of calmodulin interacting with Ca2+ channels. Science 304: 432–435. [DOI] [PubMed] [Google Scholar]
- Ophoff RA, Terwindt GM, Vergouwe MN, Van Eijk R, Oefner PJ, Hoffman SMG, Lamerdin JE, Mohrenweiser HW, Bulman DE, Ferrari M, Han J, Lindhout D, Van Ommen GJB, Hofker MH, Ferrari MD, Frants RR (1996) Familial hemiplegic migraine and episodic ataxia type-2 are caused by mutations in the Ca2+ channel gene CACNL1A4. Cell 87: 543–552. [DOI] [PubMed] [Google Scholar]
- Ott RL (1993) An introduction to statistical methods and data analysis, Ed 4 Belmont, CA: Duxbury.
- Pedroarena CM, Schwarz C (2003) Efficacy and short-term plasticity at GABAergic synapses between Purkinje and cerebellar nuclei neurons. J Neurophysiol 89: 704–715. [DOI] [PubMed] [Google Scholar]
- Peterson BZ, DeMaria CD, Adelman JP, Yue DT (1999) Calmodulin is the Ca2+ sensor for Ca2+ -dependent inactivation of L-type calcium channels. Neuron 22: 549–558. [DOI] [PubMed] [Google Scholar]
- Piedras-Renteria ES, Pyle JL, Diehn M, Glickfeld LL, Harata NC, Cao Y, Kavalali ET, Brown PO, Tsien RW (2004) Presynaptic homeostasis at CNS nerve terminals compensates for lack of a key Ca2+ entry pathway. Proc Natl Acad Sci USA 101: 3609–3614. [DOI] [PMC free article] [PubMed] [Google Scholar]
- Regan MR, Emerick MC, Agnew WS (2000) Full-length single-gene cDNA libraries: applications in splice variant analysis. Anal Biochem 286: 265–276. [DOI] [PubMed] [Google Scholar]
- Robinson DA (1976) Adaptive gain control of vestibuloocular reflex by the cerebellum. J Neurophysiol 39: 954–969. [DOI] [PubMed] [Google Scholar]
- Sakaba T, Neher E (2001) Calmodulin mediates rapid recruitment of fast-releasing synaptic vesicles at a calyx-type synapse. Neuron 32: 1119–1131. [DOI] [PubMed] [Google Scholar]
- Schmolesky MT, Weber JT, De Zeeuw CI, Hansel C (2002) The making of a complex spike: ionic composition and plasticity. Ann NY Acad Sci 978: 359–390. [DOI] [PubMed] [Google Scholar]
- Sippy T, Cruz-Martin A, Jeromin A, Schweizer FE (2003) Acute changes in short-term plasticity at synapses with elevated levels of neuronal calcium sensor-1. Nat Neurosci 6: 1031–1038. [DOI] [PMC free article] [PubMed] [Google Scholar]
- Soong TW, DeMaria CD, Alvania RS, Zweifel LS, Liang MC, Mittman S, Agnew WS, Yue DT (2002) Systematic identification of splice variants in human P/Q-type channel α12.1 subunits: implications for current density and Ca2+-dependent inactivation. J Neurosci 22: 10142–10152. [DOI] [PMC free article] [PubMed] [Google Scholar]
- Splawski I, Timothy KW, Sharpe LM, Decher N, Kumar P, Bloise R, Napolitano C, Schwartz PJ, Joseph RM, Condouris K, Tager-Flusberg H, Priori SG, Sanguinetti MC, Keating MT (2004) Ca(V)1.2 calcium channel dysfunction causes a multisystem disorder including arrhythmia and autism. Cell 119: 19–31. [DOI] [PubMed] [Google Scholar]
- Stotz SC, Barr W, McRory JE, Chen L, Jarvis SE, Zamponi GW (2004) Several structural domains contribute to the regulation of N-type calcium channel inactivation by the beta 3 subunit. J Biol Chem 279: 3793–3800. [DOI] [PubMed] [Google Scholar]
- Sutton KG, McRory JE, Guthrie H, Murphy TH, Snutch TP (1999) P/Q-type calcium channels mediate the activity-dependent feedback of syntaxin-1A. Nature 401: 800–804. [DOI] [PubMed] [Google Scholar]
- Tsodyks MV, Markram H (1997) The neural code between neocortical pyramidal neurons depends on neurotransmitter release probability. Proc Natl Acad Sci USA 94: 719–723. [DOI] [PMC free article] [PubMed] [Google Scholar]
- Tsujimoto T, Jeromin A, Saitoh N, Roder JC, Takahashi T (2002) Neuronal calcium sensor 1 and activity-dependent facilitation of P/Q-type calcium currents at presynaptic nerve terminals. Science 295: 2276–2279. [DOI] [PubMed] [Google Scholar]
- Urbano FJ, Piedras-Renteria ES, Jun K, Shin HS, Uchitel OD, Tsien RW (2003) Altered properties of quantal neurotransmitter release at end-plates of mice lacking P/Q-type Ca2+ channels. Proc Natl Acad Sci USA 100: 3491–3496. [DOI] [PMC free article] [PubMed] [Google Scholar]
- Vigues S, Gastaldi M, Massacrier A, Cau P, Valmier J (2002) The α1A subunits of rat brain calcium channels are developmentally regulated by alternative RNA splicing. Neuroscience 113: 509–517. [DOI] [PubMed] [Google Scholar]
- Weiss JL, Burgoyne RD (2001) Voltage-independent inhibition of P/Q-type Ca2+ channels in adrenal chromaffin cells via a neuronal Ca2+ sensor-1-dependent pathway involves Src family tyrosine kinase. J Biol Chem 276: 44804–44811. [DOI] [PubMed] [Google Scholar]
- Welling A, Ludwig A, Zimmer S, Klugbauer N, Flockerzi V, Hofmann F (1997) Alternatively spliced IS6 segments of the alpha 1C gene determine the tissue-specific dihydropyridine sensitivity of cardiac and vascular smooth muscle L-type Ca2+ channels. Circ Res 81: 526–532. [DOI] [PubMed] [Google Scholar]
- Xu J, Wu LG (2005) The decrease in the presynaptic calcium current is a major cause of short-term depression at a calyx-type synapse. Neuron 46: 633–645. [DOI] [PubMed] [Google Scholar]
- Zamponi GW (2003) Regulation of presynaptic calcium channels by synaptic proteins. J Pharmacol Sci 92: 79–83. [DOI] [PubMed] [Google Scholar]
- Zhuchenko O, Bailey J, Bonnen P, Ashizawa T, Stockton DW, Amos C, Dobyns WB, Subramony SH, Zoghbi HY, Lee CC (1997) Autosomal dominant cerebellar ataxia (SCA6) associated with small polyglutamine expansions in the alpha 1A-voltage-dependent calcium channel. Nat Genet 15: 62–69. [DOI] [PubMed] [Google Scholar]