

Abstract
Waves of epileptiform activity in neocortex have three phenomenological stages: initiation, propagation, and termination. We use a well studied model of epileptiform activity in vitro to investigate directly the hypothesis that each stage is governed by an independent mechanism within the underlying cortical circuit. Using the partially disinhibited neocortical slice preparation, activity is induced and modulated using neurotransmitter receptor antagonists and is measured using both intracellular recordings and a linear array of extracellular electrodes. We find that initiation depends on both synaptic excitation and inhibition and entails a slow process of recruitment at discrete spatial locations within cortical layer 5 but not layer 2/3. Propagation depends on synaptic excitation but not inhibition and is a fast process that involves neurons across the spatial extent of the slice and in all cortical layers. Termination is modulated by synaptic excitation and inhibition. In space, termination occurs reliably at discrete locations. In time, termination is characterized by a strong depolarizing shift (block) and recovery of neurons in all cortical layers. These results suggest that the phenomenological stages of epileptiform events correspond to distinct mechanistic stages.
Keywords: electrical stimulation, epileptiform, picrotoxin, slice, somatosensory cortex, synaptic transmission, activity waves
Introduction
Epileptiform activity in the disinhibited neocortical slice can be divided into at least three phenomenological stages. Initiation is characterized by the transition from neuronal activity that is sparse, asynchronous, and local, to activity that is dense, synchronous, and outwardly spreading (Traub and Wong, 1982, 1983a). Propagation can be described roughly as a pulse of synchronous activity transmitted from one neuronal population to the next (Chervin et al., 1988; Chagnac-Amitai and Connors, 1989a; Golomb and Amitai, 1997). Termination can be understood, in space, in terms of propagation failure (Bressloff, 2001) and, in time, in terms of secondary activity patterns following in the wake of an initial wave front and ultimately a return to rest (Miles et al., 1984; Traub et al., 1993). A similar progression is observed in activity waves recorded in vivo [e.g., interictal to ictal transitions (Le Van Quyen et al., 2003)] and in vitro using other experimental models (Traub et al., 1993; Gulyas-Kovacs et al., 2002; Dzhala and Staley, 2003).
In a recent theoretical study, Pinto and Ermentrout (2001) applied singular perturbation analysis to investigate a set of equations that describe waves of epileptiform activity in spatially extended synaptic circuits. Inherent to the theoretical method is an implicit assumption that the mechanisms governing each stage of a wave are independent from each of the others so that, at least to a first approximation, they can be analyzed separately (Tyson and Keener, 1988; Jones, 1994; Kevorkian and Cole, 1996). In the laboratory, this assumption leads to a novel perspective for understanding epileptiform activity. Specifically, the phenomena of initiation, propagation, and termination of epileptiform activity involve distinct and independent mechanisms within the underlying cortical circuit.
Motivated by the theoretical strategy, we examined directly the initiation, propagation, and termination of epileptiform activity evoked in disinhibited neocortical slices. Using a linear array of extracellular electrodes, we investigated the transitions from wave initiation, to wave propagation, to wave termination. In addition, we examined the role of excitation and inhibition on the three stages using neurotransmitter receptor antagonists. Finally, we examined the responses of individual neurons during each stage of the wave using intracellular recordings. Our goals were to test the hypothesis that independent processes within the cortical circuit govern each stage and to further elucidate some of the mechanisms underlying each process individually.
Materials and Methods
Cortical slices 400 μm thick were taken from Sprague Dawley rats [postnatal day 25 (P25) to P35] using a mechanical vibratome (World Precision Instruments, Sarasota, FL). Both thalamocortical (TC) (Agmon and Connors, 1991) and across barrel row (BA) (Finnerty et al., 1999) slice angles were used; results from the two slice angles were similar and so the data were combined. Similar to standard coronal slices, both TC and BA slice angles transect all layers of rodent somatosensory cortex but are approximately perpendicular to each other in the tangential plane. Figure 1a shows a schematic of the TC slice. In TC slices, severing the thalamic afferent pathway had no observable effect on activity propagation (data not shown) and so the slice was left intact during subsequent experiments. Slices were maintained in a liquid-gas interface chamber at room temperature for 1 h and then transferred to an interface recording chamber. In both chambers, slices were bathed in artificial CSF (ACSF) containing the following (in mm): 124 NaCl, 3.5 KCl, 1 Na2PO4, 26 NaHCO3, 10 dextrose, 2 CaCl2, and 2 MgSO4 (saturated with 95% O2/5% CO2). All recordings were obtained at 34°C. The ACSF flow rate in the recording chamber was 1 ml/min.
Figure 1.

Recording method and example wave. a presents a schematic of a thalamocortical slice and the positioning of the linear recording array along cortical layer 2/3. The box outlines a region corresponding to somatosensory cortex. The small red dot indicates the relative position of the initiating stimulus. b and c present an example of field potential data in raw form (b) and in pseudocolor (c), respectively, obtained from a slice bathed in 10 μm picrotoxin. The small red arrow on the vertical axes in c indicates that the initiating stimulus was applied beyond the range of the recording electrode in the specified direction (see a).
Before data collection, slice viability was tested by recording field potential responses in cortical layer 2/3 in the region of somatosensory cortex with glass micropipettes (0.5–1.0 MΩ) filled with ACSF. Responses were evoked using a bipolar stimulating electrode (Frederick Haer Company, Bowdoinham, ME) positioned in layer 4 vertical to the recording site. Slices were retained for data collection if a square pulse stimulus of 30 μA lasting 200 μs evoked responses of at least 0.8 mV in TC slices or 0.5 mV in BA slices.
The micropipette was then replaced by a linear extracellular recording array constructed specifically for these experiments. The array consisted of 16 Formvar-coated stainless steel microwires (25 μm diameter, <5 MΩ; California Fine Wire, Grover Beach, CA) embedded in an epoxy holding base and spaced 100 μm apart, for a total recording distance of 1.5 mm along cortical layer 2/3; no attempt was made to bend the array to match precisely the curve of the cortex. Signals were alternating current coupled and amplified (50×; MultiChannel Concepts, Scottsdale, AZ) before being digitized at 10 kHz and digitally low-pass filtered at 1 kHz. In later experiments, a bank of 10× secondary amplifiers was also used (World Precision Instruments). Data acquisition and signal analyses were performed using Labview (National Instruments, Austin, TX) with routines written specifically for the task. Figure 1a presents a schematic of the cortical region studied and the position of the recording array.
Intracellular recordings were obtained using sharp glass microelectrodes (70–100 MΩ) filled with 3 m potassium acetate. Neurons were retained for data collection if they had resting potentials more negative than –65 mV, threshold potentials at least 20 mV above rest, and action potential peaks above 0 mV. Recordings were allowed to stabilize for 10 min before data acquisition. All recordings were made in current-clamp mode (Axoclamp 2B; Axon Instruments, Union City, CA). Intracellular recordings were low-pass filtered and digitized at 10 kHz.
Epileptiform activity was elicited by adding 10 μm of the GABAA receptor antagonist picrotoxin (PTX) (Sigma, St. Louis, MO) to the ACSF bathing solution; other concentrations were used as indicated. In some experiments, 6,7-dinitroquinoxaline-2,3-diome (DNQX) (Sigma) was used to block AMPA receptors. All drugs were titrated into the bathing solution at concentrations as indicated. Initial concentrations were washed in for at least 1 h and changes in concentration for at least 0.5 h before data collection. Low initial concentrations (e.g., picrotoxin) were allowed to wash in for at least 2 h or longer as indicated. Drug washouts lasted for 2 h or until evoked responses demonstrated convincingly that slices remained viable.
Epileptiform activity was evoked using a bipolar stimulating electrode positioned typically in layer 4 either vertical to one end of the recording array to examine initiation or at a horizontal distance of several millimeters to examine propagation and termination. In the latter case, the activity profile remained constant regardless of the laminar stimulus position or above-threshold amplitude, consistent with previous studies (Hablitz, 1987; Chervin et al., 1988). Stimuli consisted of a square current pulse, 200 μs long, with amplitudes ranging from 10 to 100 μA, as indicated. Interstimulus intervals were at least 30 s except when indicated.
Measurements of evoked responses were quantified using field potential data from the recording array. Response velocity was quantified in meters per second by dividing the spatial distance between two recording channels by their difference in onset time. The two channels were selected arbitrarily but were at least 0.5 mm apart, were such that changes in onset time were fairly linear between them, and were fixed for a given recording session. Response duration was quantified in milliseconds as the width at half-height of the field potential at one recording channel. The channel was selected arbitrarily but was between the channels used to measure wave speed and was fixed for a given recording session. Response amplitude was quantified in millivolts as the minimum response below baseline at the same channel used to measure duration. The onset time for a given channel was defined as the time when the response first reached 30% of the minimum value for that channel; measurements of onset time taken anywhere from 10 to 90% were approximately the same because of the sharp onset of epileptiform activity compared with the absolute latency (Fig. 1b). A threshold of 30% was chosen arbitrarily to automate the measurement procedure while minimizing interference from background activity during low-amplitude events. Response latency was quantified as the time between the applied stimulus and the earliest onset time in any of the recording channels.
In most cases, the relationship between each measure and changes in drug concentration were assessed using linear regression analysis with repeated measure; p values were used to test the null hypothesis that the slope of the regression line was significantly different from zero. In the few cases when the relationship did not meet the criteria for linearity, ANOVAs were applied to the data grouped by concentration. Post hoc pairwise analyses (Tukey-Kramer) were used to assess the source of any differences between groups. The same results were obtained using either parametric or nonparametric (Kruskal-Wallis) ANOVAs. All statistical analyses were performed on the original data (i.e., not normalized) unless indicated otherwise.
Data display and analyses were performed using routines specifically written for the task in Labview (National Instruments) and Origin 5.0 (Microcal Software, Northampton, MA). Statistical analyses were conducted using Instat 3.06 (GraphPad Software, San Diego, CA). Figures were assembled using Canvas 8.0 (ACD Systems, Victoria, British Columbia, Canada). Field potential data were linearly interpolated between channels to generate pseudocolor graphs. Figure 1, b and c, shows the same field potential data in raw form (Fig. 1b) and as a pseudocolor graph (Fig. 1c), respectively. In some cases, data were cropped to maximum and/or minimum values as indicated to focus the color scale on important features of the response. Data are reported as mean ± SEM except when indicated.
Results
Data were collected from 140 slices obtained from 96 Sprague Dawley rats aged P25–P35.
Initiation
Wave initiation is an all-or-none event with a sharp threshold. Waves were evoked by applying a brief stimulus near one end of the recording array. Threshold was defined as the stimulus intensity at which waves were evoked on 50% of the trials. In every slice examined, the stimulus window near threshold was narrow in that small changes in intensity (<1 μA) separated stimuli that evoked waves from those that did not. Figure 2a presents data from a typical example; an increase in stimulus intensity of 4 μA was sufficient to increase the probability of evoking a wave from 0.0 to 0.8. Consistent with previous studies (Traub and Wong, 1983a; Chagnac-Amitai and Connors, 1989a; Lee and Hablitz, 1991), waves evoked by both near-threshold (panel 2) and above-threshold (panel 3) stimuli had nearly identical spatial profiles and velocities, but waves evoked using near-threshold stimuli often emerged only after a substantial temporal delay (panel 2). Both of these phenomena are discussed more fully below.
Figure 2.
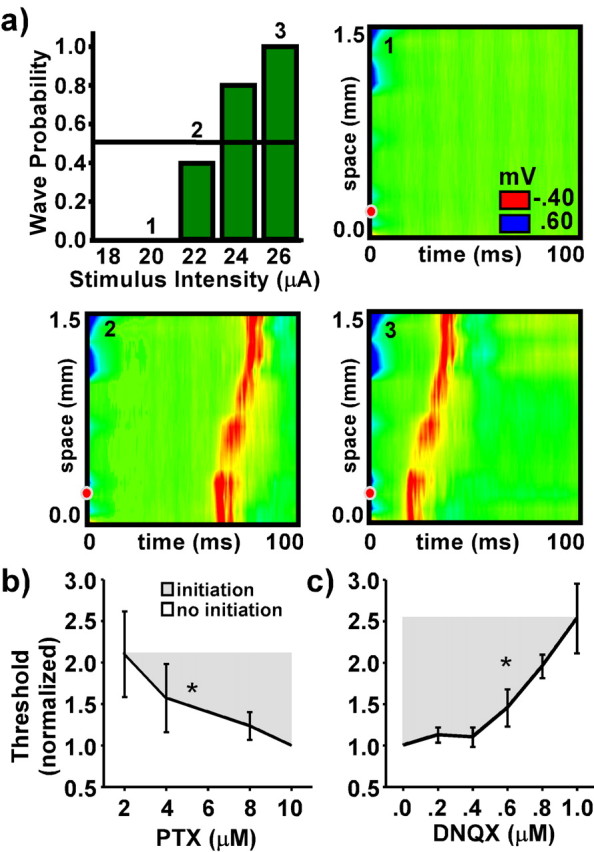
Initiation threshold. a presents a bar graph of wave probability as a function of stimulus intensity and examples of evoked responses below (panel 1), near (panel 2), and above threshold (panel 3). Wave probability was measured as the proportion of trials (of 10) in which a wave was evoked for a given stimulus intensity. Initiation threshold was defined as the lowest intensity that evokes waves on one-half of the trials (horizontal line). Filled red dots along the vertical axes of the color graphs indicate the spatial location of the initiating stimulus. b presents measures of initiation threshold as a function of PTX concentration averaged from 10 slices. c presents measures of initiation threshold as a function of DNQX concentration averaged from seven slices. Measures were normalized to their value when the slice was bathed in 10 μm PTX.
Initiation threshold depends on the strength of both excitatory and inhibitory synaptic transmission. Figure 2b presents summary data averaged from 10 slices in which increasing concentrations of PTX were titrated into the bathing solution; stimulus intensity threshold decreased significantly as GABAA-mediated inhibition was blocked (p = 0.0125). Consistent with previous studies (Chagnac-Amitai and Connors, 1989a), a minimum PTX concentration of 2–3 μm was required before any stimulus intensity could evoke waves; waves could not be induced at lower PTX concentrations (0–2 μm) regardless of stimulus intensity, even when slices were bathed in PTX for up to 4 h (data not shown). Figure 2c presents summary data averaged from seven slices in which increasing concentrations of DNQX were titrated into a bathing solution containing 10 μm PTX; threshold stimulus intensity increased significantly as AMPA-mediated excitation was blocked (p = 0.0001).
At near-threshold intensities, the delay between the time of the applied stimulus and the time of wave onset was variable from trial to trial. Figure 3a presents data from a typical example in which the latency to wave onset varied from <10 ms to more than 100 ms when evoked with a near-threshold stimulus [mean, 39.9 ms; coefficient of variation (CV), 0.43]. When stimulus strength was doubled, the mean latency decreased to 3.9 ms and became much less variable (CV, 0.18). Figure 3b presents data overlaid from five trials taken from the same example; the profile of field potential responses remained the same regardless of latency (Figs. 2a, 4). Figure 3c presents summary data from 12 slices; four slices were bathed in increasing concentrations of PTX, and eight slices were bathed in 10 μm PTX and increasing concentrations of DNQX. There was no change in mean latency with increasing concentrations of PTX or DNQX (PTX, p = 0.4120; DNQX, p = 0.585). The variability (CV) increased slightly with increasing concentrations of DNQX but not with increasing concentrations of PTX (p = 0.1717). The increase in variability with DNQX was not quite significant when the regression analysis was applied to the original data (p = 0.0756) but was significant when the analysis was applied to the transformed (i.e., normalized) data (p = 0.0129).
Figure 3.

Wave onset latency. a presents a histogram of delays between the initiating stimulus and the time of wave onset evoked using near-threshold (black) or twice-threshold (gray) stimuli. b presents traces of field potential data overlaid from five trials obtained from one of the electrodes during the same experiment as in a using near-threshold stimuli. c presents measures of the mean and CV of the latency distributions as a function of DNQX concentration averaged from eight slices and of PTX concentration averaged from four slices using near-threshold stimuli. Measures were normalized to their value when the slice was bathed in 10 μm PTX. d presents three trials obtained while stimulating well above threshold. The wave failed on some trials but reemerged after a delay on other trials and propagated in both directions.
Figure 4.
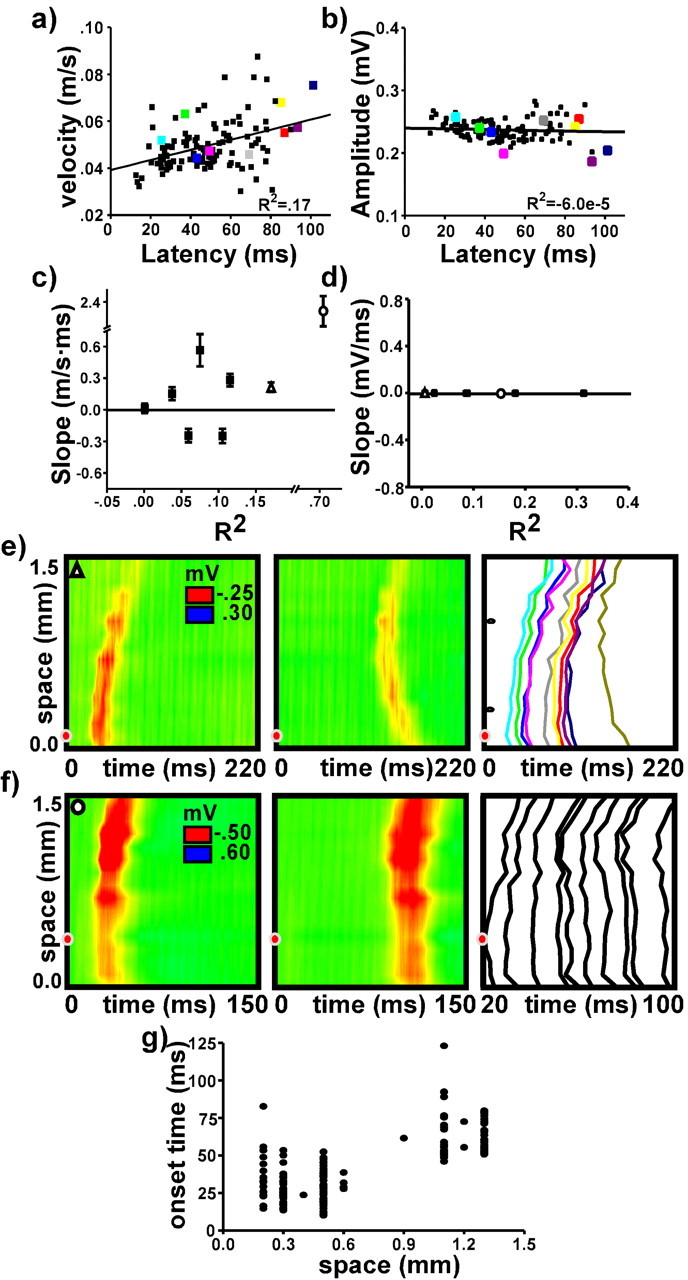
Transition to propagation. a and b present scatter plots measuring wave velocity and wave amplitude, respectively, as a function of onset latency for a single experiment. Colored points correspond to trials described in e below. c and d present summary data from eight slices; slope and R2 values are taken from the line of best fit as in a and b. e presents an example in which the earliest onset latency sometimes occurred at a location distant from the point of stimulation (red dot). The first two graphs present waves emerging with short and long latencies, respectively. The third graph presents onset profiles from 10 trials, plotted as the time to wave onset for each electrode in the array. Shortest and longest latency trials are from the same waves as shown in the first two graphs. Notches on the vertical axis indicate electrode channels used to measure wave velocity as described in Materials and Methods. Measures of velocity, amplitude, and latency of the 10 trials are indicated by points of corresponding color in a and b. Summary data for this example is represented by open triangles in c and d. f presents an example in which the earliest latency occurred with equal likelihood at two discrete locations. Note that the third graph uses an expanded time base. Summary data for this example is represented by the open circle in c and d. g presents a scatter plot measuring onset latency as a function of spatial location for the example presented in f.
Approximately one-third of all slices examined displayed reflected waves or other complex activity patterns after the initial wave, consistent with previous studies (Chagnac-Amitai and Connors, 1989a). A handful of those slices also exhibited variable delays or failures from trial to trial at the point of reflection similar to responses evoked using near-threshold stimuli. Figure 3d presents three trials obtained from one such slice illustrating the phenomenon. In the first panel, the wave propagated only part of the way across the slice. In the second and third panels, activity reemerged after a variable delay from the point of failure and propagated in both directions.
Transition from initiation to propagation
In most cases, the velocity and amplitude of evoked waves were independent of the delay to wave onset. Figure 4, a and b, presents velocity and amplitude data, respectively, from 120 waves evoked using near-threshold stimuli in a slice bathed in 10 μm PTX. In this case, wave amplitude did not vary with latency, but wave velocity increased slightly at longer latencies. Figure 4, c and d, presents R2 values and regression line slopes obtained as in Figure 4, a and b, from seven slices each bathed in 10 μm PTX. Measures from at least 100 waves contributed to the line of best fit for each slice. In every case, wave amplitude did not depend on onset latency. Wave velocity changed slightly, increasing with latency in four slices and decreasing in two slices.
The increase in velocity with onset latency in some slices may result from interactions between multiple initiation zones along the extent of the recording array (Tsau et al., 1998; Ma et al., 2004). In a few cases, the existence of such zones was readily apparent. Figure 4, e and f, presents two examples of the phenomenon. In Figure 4e, the earliest time of wave onset occurred either near the point of stimulation or at a point nearly 1 mm distant. The last panel in Figure 4e presents wave onset profiles from multiple trials. The earliest and latest profiles correspond to the waves shown in the first and second panels, respectively. Figure 4, a and b, also presents data from this experiment. In Figure 4f, the earliest time of wave onset occurred with equal regularity at either the point of stimulation or a point 0.8 mm distant. The last panel in Figure 4f presents onset profiles from multiple trials as in Figure 4e. As shown in Figure 4g, the point of initiation depended on the onset delay: waves emerging with short latency initiated near the stimulating electrode; waves emerging with long latency initiated far from the stimulating electrode; and waves emerging with medium latency initiated nearly simultaneously from both locations and resulted in a high-velocity wave. The outlying point in Figure 4c represents data from this example.
Wave velocity and wave amplitude were independent of stimulus intensity so long as the stimulus was above threshold and was applied at some distance from the recording array. Figure 5, a and b, presents data averaged from 70 waves (7 slices, 10 trials each) examining the effect of stimulus intensity on wave velocity and wave amplitude. Changes in intensity resulted in identical waves when the stimulus was applied at least 1 mm away from the end of the recording array (Far). Near the site of initiation, however (Near), stronger stimuli resulted in larger and faster waves. This is most likely attributable to an increase in the breadth and number of neurons, axons, and synapses activated directly by the applied stimulus. As illustrated in Figure 5c, a strong stimulus evoked broader and larger field potentials than a weak stimulus in a slice with normal inhibition. Correspondingly, a strong stimulus evoked larger and faster waves than a weak stimulus when the same slice was disinhibited.
Figure 5.
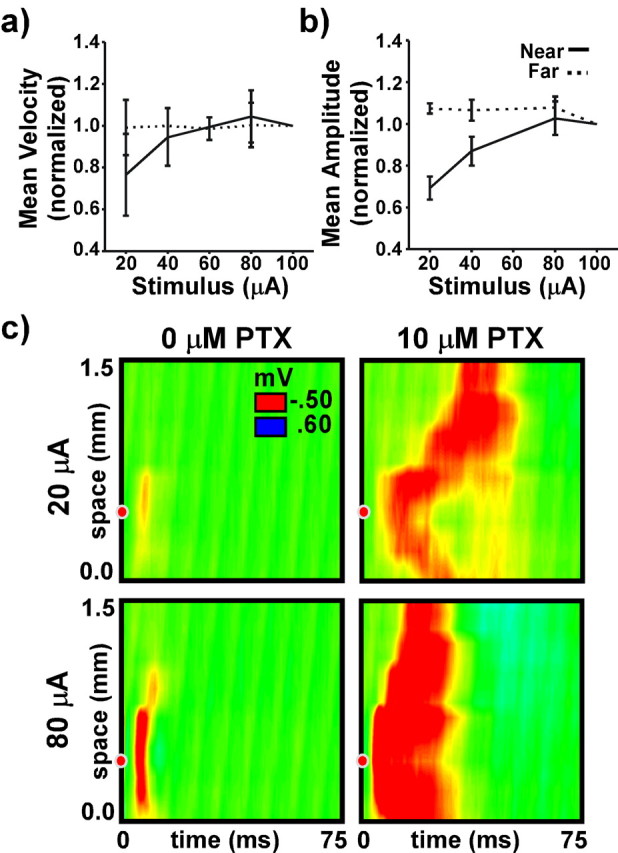
Stimulus intensity and initiation zone. a and b present measures of wave velocity and wave amplitude averaged from seven slices as a function of intensity when the stimulus was applied within range of the recording array (solid line) and at a distance of at least 1 mm from the end of the array (dashed line). Measures were normalized to their values when the intensity was 100 μA. c presents example responses evoked in the same slice, both with and without disinhibition, using two stimulus intensities.
Propagation
Once a wave is initiated, the velocity and amplitude of wave propagation depends on the strength of synaptic excitation but not inhibition. Figure 6a–c present data averaged from 180 waves taken from 11 slices measuring the velocity, amplitude, and duration of evoked waves as a function of PTX and/or DNQX concentration; 10 trials were taken from each wave, and, in seven slices, leftward and rightward waves were considered separately and the data were combined. PTX was titrated into the bathing solution up to 10 μm, and then DNQX was titrated until propagation was blocked. In a few slices, only DNQX was titrated into a bathing solution initially containing 10 μm PTX. Results were the same using either protocol and so the data were combined. With slices bathed in 10 μm PTX, the average velocity was 0.074 ± .006 m/s, the average amplitude was 0.52 ± 0.08 mV, and the average duration was 36.8 ± 6.92 ms (mean ± SE). Data were normalized to values at 10 μm PTX to facilitate comparisons between slices.
Figure 6.

Propagation. a–c present measures of wave velocity, amplitude, and duration averaged from 180 waves as a function of PTX and DNQX concentration (for details, see Results). Measures were normalized to their values at 10 μm PTX. c presents example responses evoked in the same slice bathed in 4 μm PTX, 10 μm PTX, and 10 μm PTX plus 0.25 μm DNQX.
Consistent with previous studies (Golomb and Amitai, 1997), increasing concentrations of DNQX resulted in significant decrease in wave velocity and wave amplitude (velocity, p < 0.0001; amplitude, p = 0.0003). Increasing concentrations of PTX, however, did not significantly change either wave velocity or wave amplitude once threshold levels of disinhibition were achieved (2–3 μm PTX) (velocity, p = 0.7011; amplitude, p = 0.3543) (Fig. 6a,b). Concentrations of PTX up to 50 μm yielded similar results (data not shown).
Wave duration varied nonlinearly with changes in either PTX or DNQX concentration. ANOVAs applied to the original data grouped by concentration suggest no significant difference in wave duration between groups (PTX, p = 0.2732; DNQX, p = 0.7065). Applied to the transformed (i.e., normalized) data, however, the difference between groups was significant (PTX, p = 0.0004; DNQX, p < 0.0001). For the PTX concentrations, post hoc pairwise analysis (Tukey-Kramer) suggests that the difference arises from a significant increase in wave duration from 2.0 to 5.0 μm PTX (p < 0.05) and from 5.0 to 10.0 μm PTX (p < 0.01). For the DNQX concentrations, post hoc analysis suggests that the difference arises from a significant increase in wave duration from 0 to 0.5 μm DNQX (p < 0.01) and from a significant decrease from 0.5 to 1.0 μm DNQX (p < 0.001).
Figure 6d presents a typical example in which increasing concentrations of PTX had little effect on the profile of the initial wave but facilitated secondary activity that followed in the wake of the initial wave; increasing concentrations of DNQX affected both the initial wave and secondary activity.
Single-cell responses during initiation and propagation
Previous studies have suggested that neurons in the deep cortical layers may be responsible for the onset and propagation of synchronous epileptiform events (Gutnick et al., 1982; Connors, 1984; Chagnac-Amitai and Connors, 1989b; Silva et al., 1991) (for review, see Connors and Telfeian, 2000). Here, we examine this hypothesis directly by recording from individual neurons in cortical layers 2/3 and in layer 5 near the zone of wave initiation. We find that neurons in layer 5 but not layer 2/3 are active during the delay preceding wave initiation and that neurons in both layers are active during wave propagation.
During the delay to wave onset (Fig. 2), activity among individual neurons is presumably circulating within the circuit, with additional activity being recruited until the ensemble response reaches a level sufficient to support a propagating wave (Traub and Wong, 1982, 1983). We recorded intracellularly from individual neurons at one end of the electrode array near the point of initiation in slices bathed in 10 μm PTX. Neurons were located in either layer 2/3 or layer 5. A near-threshold stimulus was applied to layer 4 within the same vertical column as schematized in Figure 7. Figure 7b presents example traces from three neurons each from layers 2/3 and five taken from six different experiments; traces are aligned to the time of wave onset in each case. Of the neurons recorded, only neurons in layer 5 generated action potentials during the delay to wave onset (7 of 18; 39%); layer 2/3 neurons exhibited synaptic events (Fig. 7b) but no action potentials (0 of 20; 0%). Figure 7a presents a table summarizing the results. There were no differences in firing properties, input resistance, or the strength of voltage sags between neurons that were active during the delay and those that were not (data not shown). One of the active neurons was also the only intrinsically bursting neuron recorded in the study; the remaining neurons were regular spiking (McCormick et al., 1985). All of the neurons recorded in both layers were active at wave onset. The variable latency to wave onset corresponds to the variable firing patterns of neurons active during the delay. Figure 7c presents overlaid responses from multiple trials of a single layer 5 neuron during the delay to wave onset.
Figure 7.

Single-cell responses during initiation and propagation. a presents a table summarizing the responses of 20 layer 2/3 neurons and 18 layer 5 neurons. Only layer 5 neurons (7 of 20) generated action potentials during the delay to wave onset. b presents a schematic of the protocol and traces from 3 layer 2/3 neurons and 3 layer 5 neurons recorded in the same column as the stimulating electrode in six different experiments. Traces are aligned in time to the time of wave onset for each trial and/or experiment as measured from the field potential data using the electrode array (vertical red line). Small red arrows indicate stimulation times. c presents five overlaid responses from a single layer 5 neuron during the delay preceding wave onset. Traces are aligned to the time of wave onset for each trial (vertical red line).
Termination
Like initiation, wave termination in space occurs at discrete locations that remain consistent from trial to trial. Figure 8a presents two trials from the same slice in which the wave terminated within the extent of the recording array. On some trials, activity reemerged from the point of failure after a delay and propagated in both directions. Both the location of the discontinuity and the profile of the secondary wave were consistent from trial to trial (data not shown). Additional examples from different experiments are presented in Figures 8b and 3d.
Figure 8.
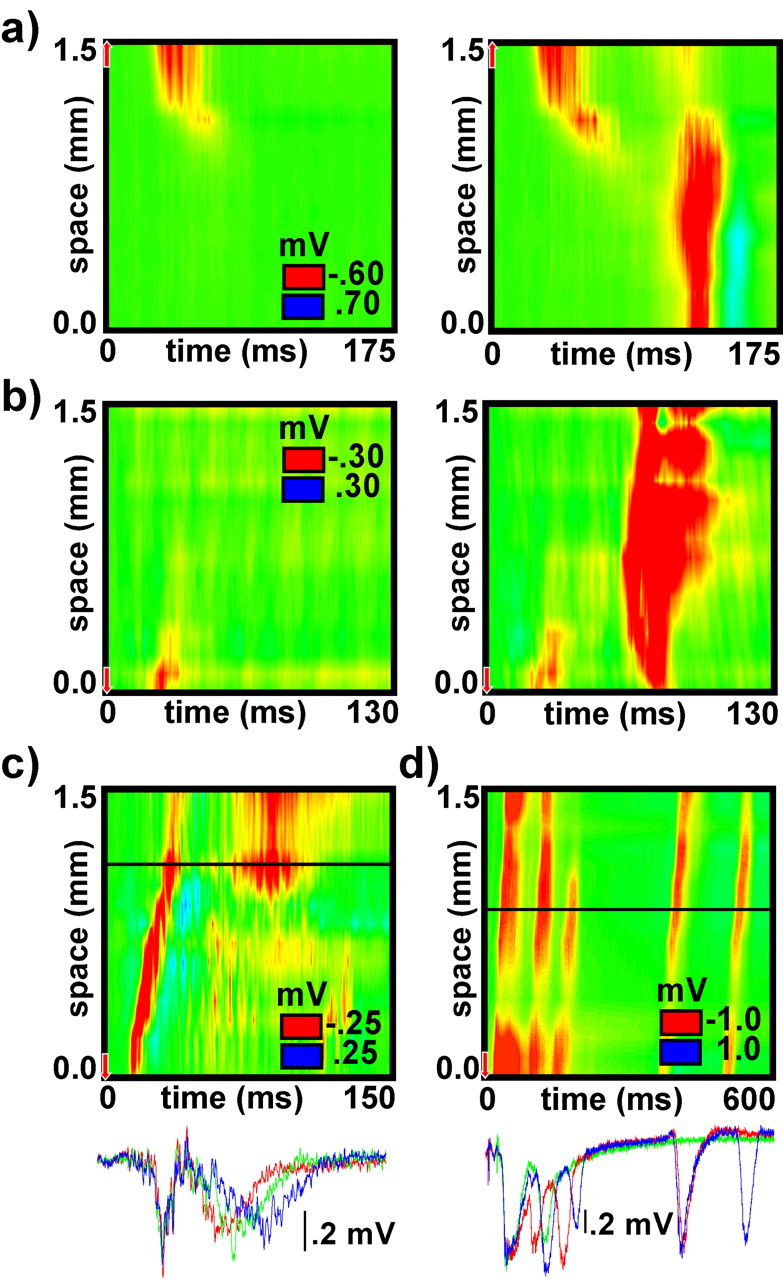
Termination. a presents examples of waves that terminated within range of the recording array. On some trials, activity reemerged and continued to propagate after a delay. b presents an example of the same phenomenon from a different experiment. c presents an example of a wave followed by complex and variable secondary activity. Field potential data are overlaid from multiple trials as recorded from one of the electrodes in the array during the same experiment. The electrode position is indicated by the horizontal line on the color graph. d presents an example of the same phenomenon from a different experiment.
Wave termination, in time, coincided with the end of the initial wave of depolarization in most cases. In approximately one-third of the slices, however, secondary waves or other complex activity patterns followed in the wake of the initial wave. In contrast to the disinhibited hippocampal slice (Miles et al., 1988; Traub et al., 1993), secondary waves were much less robust and more variable from trial to trial than the initial wave. Figure 8, c and d, presents data gathered from two slices that exhibited complex secondary activity patterns. Overlaid field potential data from multiple trials on one electrode illustrates the trial-to-trial variability of secondary activity. An additional example is presented in Figure 9b.
Figure 9.
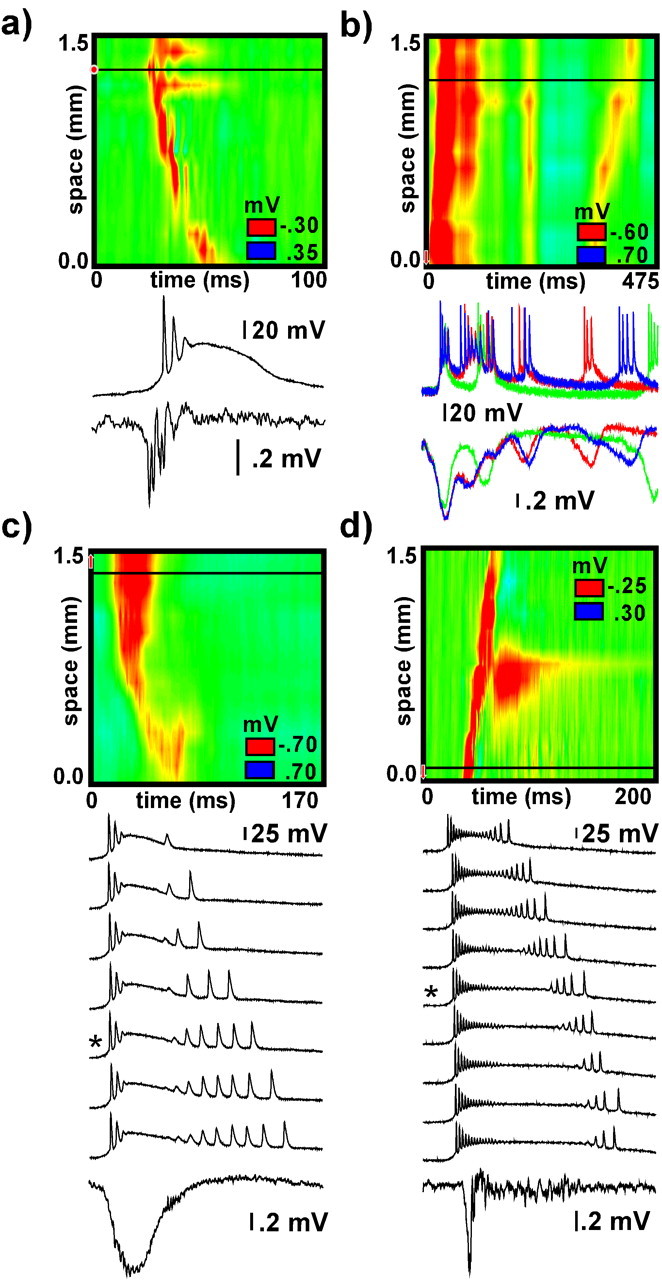
Single-cell responses during termination. a presents typical data from a layer 2/3 neuron that entered a state of depolarization block when the wave reached its spatial location (black horizontal line). b presents an example of complex and variable secondary activity waves reflected in both the field potential and single neuron recordings from a layer 5 cell. c and d show examples from a layer 2/3 neuron and a layer 5 neuron, respectively, that exhibited progressively longer responses when waves were evoked repetitively at a frequency of 1 Hz. Color graph and field potential response were taken from the trial indicated with an asterisk. Horizontal line on color graph indicates both the location of the neuron along the array and the electrode from which field potential recordings were taken.
Single-cell responses: termination
Consistent with previous studies (Prince, 1967; Dichter and Spencer, 1969a,b; Matsumoto et al., 1969; Ayala et al., 1970; Gutnick et al., 1982; Hablitz, 1987), termination of the initial wave coincided with neurons entering a state of prolonged depolarization (i.e., depolarization block). Figure 9a presents a typical example from a neuron located in layer 2/3. Activity in individual neurons also reflected secondary activity patterns following in the wake of the initial wave. Figure 9b presents an example from a slice in which both field potential and intracellular recordings from a layer 2/3 neuron displayed complex secondary activity patterns. Neurons in both layers 2/3 and 5 were active during secondary activity.
Three neurons from three different experiments exhibited responses that changed progressively when waves were evoked repetitively. Figure 9, c and d, shows sequential responses from two such neurons during wave propagation evoked at a frequency of 1 Hz. In Figure 9c, the neuron remained in a depolarized state for the extent of the initial wave and then generated a longer series of recovery spikes on successive trials. The field potential response did not reflect the recovery spikes. In Figure 9d, the neuron remained in a depolarized state longer on successive trials and generated approximately the same number of recovery spikes. The field potential displayed low-amplitude, high-frequency activity that lasted for the duration of the blocked state in the neuron on each trial.
Discussion
Our results support the hypothesis that distinct and independent mechanisms govern the phenomena of initiation, propagation, and termination of epileptiform activity in disinhibited cortical slices. Initiation depends on both synaptic excitation and inhibition. It is a relatively slow and variable process that takes place among the neurons of cortical layer 5 at discrete spatial locations. In contrast, propagation velocity and amplitude depend on synaptic excitation but not inhibition (above a threshold level). Propagation is a relatively fast and reliable process involving neurons throughout the spatial extent of the slice. Termination is modulated by both synaptic excitation and inhibition and is characterized by depolarization block and recovery among neurons in all cortical layers. Like initiation, termination can be a variable process and occurs in space at discrete spatial locations. Termination can also involve secondary activity patterns that propagate in space in a manner similar to the initial wave.
In addition to testing our central hypothesis, our results confirm a number of previously observed phenomena and also present several results not reported previously. Among our more striking novel findings include the subthreshold drift of the point of initiation away from the location of the applied stimulus (Fig. 4), the independence of propagation velocity on the strength of above-threshold disinhibition (Fig. 6), the spiking activity in layer 5 but not 2/3 during wave initiation (Fig. 7), and the variability of ongoing activity relative to the initial wave (Fig. 8).
Initiation
Data presented in Figures 2 and 7 suggest that wave initiation is an all-or-none event with a narrow stimulus threshold window. During initiation, spiking activity circulates among the neurons of layer 5, but not layer 2/3, until the system either returns to rest or reaches a level of activity sufficient to support a propagating wave. The process is best observed in the slice using a near-threshold stimulus; a strong stimulus will activate a large population of neurons directly, bypassing the subtle recruitment process. A similar process explains the delay preceding wave reflections (Fig. 3) and secondary waves (Fig. 8). We detected no common response features to distinguish neurons that were active during the initiation process from those that were not.
The variable delay to wave onset shown in Figure 2 is consistent with previous results (Miles and Traub, 1987; Chagnac-Amitai and Connors, 1989a; Lee and Hablitz, 1991) and is typical of a dynamic system lingering momentarily near an unstable manifold between two stable states. Here, the stable states are rest and stable propagation (Pinto and Ermentrout, 2001). Van Vreeswijk and Hansel (2001) analyzed theoretically the transition of network activity from dispersed and uncorrelated to synchronous and bursting as the level of inhibition decreases.
The persistent activity among layer 5 neurons observed during the recruitment process (Fig. 7c) is reminiscent of activity “bumps” characteristic of some models of working memory (Wang XJ, 2003). Laing and Chow (2001) analyzed conditions under which such activity can either stabilize to a local activity bump or destabilize into a pair of propagating waves. For the conditions used here, activity always destabilized into a pair of propagating waves. It may be possible, however, to adjust the protocol (by modifying the bathing solution or using a different slice angle, for instance) to facilitate and study stable activity bumps in brain slices.
Similar patterns of recruitment leading to initiation have been observed in both hippocampal slices (Wong and Traub, 1983; Knowles et al., 1987), in the developing retina (Feller et al., 1996), and in computational models of both systems (Traub and Wong, 1983b; Traub et al., 1993; Feller et al., 1997; Butts et al., 1999). Waves in disinhibited hippocampal slices initiate exclusively from the CA2 region (Knowles et al., 1987). Waves in the developing retina initiate from randomly distributed sites (Feller et al., 1997). In all three systems, the process is one of recruitment leading to threshold.
Propagation
Rather than a series of sequential initiations, wave propagation may be better understood as the transmission of activity along a continuum of neuronal populations (Ermentrout, 1998). Data presented in Figure 6, a and b, suggests that, once threshold is reached, increasing levels of disinhibition have little effect on either wave velocity or amplitude. Similar results have been reported in a study of hippocampal/entorhinal cortical slices (Menendez de la Prida and Pozo, 2002).
There are at least two explanations for this nonintuitive result. First, the level of disinhibition in the slice may be near-maximal at low concentrations of PTX. This seems unlikely, however, because in a study of hypothalamic slices taken from young rats (P1–P14), Huang and Dillon (2002) report the IC50 value for PTX inhibition of GABAA currents as 2.6 ± 0.4 μm. The value decreases linearly to ∼75% block at 10 μm PTX (Huang and Dillon, 2002). Second, the insensitivity of the wave to inhibition might be explained by the same mechanism that accounts for the processing of transient inputs during sensory processing (Pinto et al., 2003). In this scenario, a propagating wave activates local circuitry in the same manner as a synchronous barrage of input arriving from the thalamus. The incoming signal activates both excitatory and inhibitory neurons, with the response of the excitatory neurons increasing exponentially attributable to locally recurrent excitatory connections. The exponential increase in excitation is relayed to the inhibitory neurons, and, as a result, their activity also increases exponentially. In the context of thalamocortical processing, the delay between the arrival of an input signal and the buildup of network inhibition provides a window of opportunity during which thalamic input can evoke a strong excitatory response (Pinto et al., 2003). In the context of epileptiform activity, the same delay allows an activity wave to escape from the local circuit unimpeded by inhibition; given a delay of 5 ms, a wave propagating at 0.1 m/s will have traveled 0.5 mm. One prediction from this scenario is that increased levels of disinhibition should result in waves having longer duration, which, as shown in Figure 5c, is precisely what happens.
Termination
Conceivably, termination of the initial wave may simply be attributable to the entry of the neurons into depolarization block, resulting in cessation of synaptic transmission; secondary waves would emerge during the recovery from block and the resumption of firing (Bragin et al., 1997). However, even when the soma is in a blocked state, axon terminals might still be active (Gutnick and Prince, 1972; Noebels and Prince, 1978). Moreover, data presented here and previously in studies by others suggest that wave termination involves intrinsic properties of individual neurons, synaptic interactions, glial cell processes, and other factors influencing neuronal activity. For instance, the dependence of wave duration on inhibition (Fig. 6c) argues for a role of synaptic interactions on wave termination. In a model of the hippocampal network, secondary waves could be simulated only with the inclusion of specific intrinsic properties, such as extended dendrites and voltage-activated calcium currents (Traub et al., 1993). Secondary waves also depend on synaptic interactions because they can be suppressed using NMDA receptor antagonists (Miles et al., 1984; Lee and Hablitz, 1991; Traub et al., 1993; Lopantsev and Avoli, 1998; Telfeian and Connors, 1998; Castro-Alamancas and Rigas, 2002). Using a low [Ca2+] protocol to induce waves in hippocampal slices, Bikson et al. (2003) demonstrated that the duration of epileptiform events does not depend on continued somatic neuronal firing. Interestingly, periods of high activity lead to increased intracellular acidification, and manipulation of intracellular pH can shorten the duration of epileptiform discharges in the hippocampal slice (Xiong et al., 2000), possibly attributable to the closing of gap junctions (Rorig et al., 1996; Jahromi et al., 2002). Glial cells are also partly responsible for the clearance and maintenance of excitatory and inhibitory neurotransmitters from the extracellular space, placing them in a position to influence all stages of wave generation (Duffy and MacVicar, 1999; Kettenmann, 1999; Schousboe, 2003). Clearly, wave termination is a complex process that will require additional study to understand completely.
Our study has focused intentionally on the well studied phenomenon of waves evoked in the disinhibited cortical slice. Clinically, such waves are most comparable with interictal events that precede ictal epileptic activity (Prince and Connors, 1986; Dzhala and Staley, 2003; Le Van Quyen et al., 2003). Additional study is required to determine whether other models of epileptiform activity can be divided similarly into distinct mechanistic phases. We propose, however, that epileptiform activity induced by different protocols, both in vitro and in vivo, can be understood and compared in terms of initiation, propagation, and termination. Although the details may differ, the biophysical mechanisms underlying each stage may be similar and hence comparable across protocols.
The mathematical tool of singular perturbation analysis proceeds by dissecting a dynamic process and analyzing separately its constituent components while still acknowledging the complexity of the whole. Our experimental results suggest that a similar strategy may be useful for understanding epileptiform activity in neocortex. Recognizing and elucidating the specific mechanisms underlying each individual stage could form the basis for both comparing epileptiform activity across protocols and more targeted and focused approaches to controlling or curtailing epilepsy in a clinical setting.
Footnotes
This work supported by National Institutes of Health Grants NS25983 and DA125000 and a fellowship from the Burroughs-Wellcome Foundation. We thank Ed Mullen for his assistance in the design and construction of the electrode recording array.
Correspondence should be addressed to David J. Pinto at his present address: Department of Neurobiology and Anatomy and Department of Biomedical Engineering, University of Rochester School of Medicine, Box 603, 601 Elmwood Avenue, Rochester, NY 14625. E-mail: david_pinto@urmc.rochester.edu.
DOI:10.1523/JNEUROSCI.2278-05.2005
Copyright © 2005 Society for Neuroscience 0270-6474/05/258131-10$15.00/0
References
- Agmon A, Connors BW (1991) Thalamocortical responses of mouse somatosensory (barrel) cortex in vitro. Neuroscience 41: 365–379. [DOI] [PubMed] [Google Scholar]
- Ayala GF, Matsumoto H, Gumnit RJ (1970) Excitability changes and inhibitory mechanisms in neocortical neurons during seizures. J Neurophysiol 33: 73–86. [DOI] [PubMed] [Google Scholar]
- Bikson M, Hahn PJ, Fox JE, Jefferys JGR (2003) Depolarization block of neurons during maintenance of electrographic seizures. J Neurophysiol 90: 2402–2408. [DOI] [PubMed] [Google Scholar]
- Bragin A, Penttontn M, Buzsaki G (1997) Termination of epileptic afterdischarge in the hippocampus. J Neurosci 17: 2567–2579. [DOI] [PMC free article] [PubMed] [Google Scholar]
- Bressloff PC (2001) Traveling fronts and wave propagation failure in an inhomogeneous neural network. Physica D 155: 83–100. [Google Scholar]
- Butts DA, Feller MB, Shatz CJ, Rokhsar DS (1999) Retinal waves are governed by collective network properties. J Neurosci 19: 3580–3593. [DOI] [PMC free article] [PubMed] [Google Scholar]
- Castro-Alamancos MA, Rigas P (2002) Synchronized oscillations caused by disinhibition in rodent neocortex are generated by recurrent synaptic activity mediated by AMPA receptors. J Physiol (Lond) 15: 567–581. [DOI] [PMC free article] [PubMed] [Google Scholar]
- Chagnac-Amitai Y, Connors BW (1989a) Horizontal spread of synchronized activity in neocortex and its control by GABA-mediated inhibition. J Neurophysiol 61: 747–758. [DOI] [PubMed] [Google Scholar]
- Chagnac-Amitai Y, Connors BW (1989b) Synchronized excitation and inhibition driven by intrinsically bursting neurons in neocortex. J Neurophysiol 62: 1149–1162. [DOI] [PubMed] [Google Scholar]
- Chervin RD, Pierce PA, Connors BW (1988) Periodicity and directionality in the propagation of epileptiform discharges across neocortex. J Neurophysiol 60: 1695–1713. [DOI] [PubMed] [Google Scholar]
- Connors BW (1984) Initiation of synchronized neuronal bursting in neocortex. Nature 310: 685–687. [DOI] [PubMed] [Google Scholar]
- Connors BW, Telfeian AE (2000) Dynamic properties of cells, synapses, circuits and seizures in neocortex. Adv Neurol 84: 141–152. [PubMed] [Google Scholar]
- Dichter M, Spencer WA (1969a) Penicillin-induced interictal discharges from the cat hippocampus. I. Characteristics and topographical features. J Neurophysiol 32: 649–662. [DOI] [PubMed] [Google Scholar]
- Dichter M, Spencer WA (1969b) Penicillin-induced interictal discharges from the cat hippocampus. II. Mechanisms underlying origin and restriction. J Neurophysiol 32: 663–687. [DOI] [PubMed] [Google Scholar]
- Duffy S, MacVicar BA (1999) Modulation of neuronal excitability by astrocytes. Adv Neurol 79: 573–581. [PubMed] [Google Scholar]
- Dzhala VI, Staley KJ (2003) Transition from interictal to ictal activity in limbic networks in vitro J Neurosci 23: 7873–7880. [DOI] [PMC free article] [PubMed] [Google Scholar]
- Ermentrout GB (1998) Neural nets as spatio-temporal pattern forming systems. Rep Prog Phys 61: 353–430. [Google Scholar]
- Feller MB, Wellis DP, Stellwagen D, Werblin FS, Shatz CJ (1996) Requirement for cholinergic synaptic transmission in the propagation of spontaneous retinal waves. Science 272: 1182–1187. [DOI] [PubMed] [Google Scholar]
- Feller MB, Butts DA, Aaron HL, Rokhsar DS, Shatz CJ (1997) Dynamic processes shape spatiotemporal properties of retinal waves. Neuron 19: 293–306. [DOI] [PubMed] [Google Scholar]
- Finnerty GT, Roberts LSE, Connors BW (1999) Sensory experience modifies the short-term dynamics of neocortical synapses. Nature 400: 367–371. [DOI] [PubMed] [Google Scholar]
- Golomb D, Amitai Y (1997) Propagating neuronal discharges in neocortical slices: computational and experimental study. J Neurophysiol 78: 1199–1211. [DOI] [PubMed] [Google Scholar]
- Gulyas-Kovacs A, Doczi J, Tarnawa I, Detari L, Banczerowski-Pelyhe I, Vilagi I (2002) Comparison of spontaneous and evoked epileptiform activity in three in vitro epilepsy models. Brain Res 945: 174–180. [DOI] [PubMed] [Google Scholar]
- Gutnick MJ, Prince DA (1972) Thalamocortical relay neurons: antidromic invasion of spikes from a cortical epileptogenic focus. Science 176: 424–425. [DOI] [PubMed] [Google Scholar]
- Gutnick MJ, Connors BW, Prince DA (1982) Mechanisms of neocortical epileptogenesis in vitro. J Neurophysiol 48: 1321–1335. [DOI] [PubMed] [Google Scholar]
- Hablitz JJ (1987) Spontaneous Ictal-like discharges and sustained potential shifts in the developing rat neocortex. J Neurophysiol 58: 1052–1065. [DOI] [PubMed] [Google Scholar]
- Huang RQ, Dillon GH (2002) Functional characterization of GABAA receptors in neonatal hypothalamic brain slice. J Neurophysiol 88: 1655–1663. [DOI] [PubMed] [Google Scholar]
- Jahromi SS, Wentlandt K, Piran S, Carlen PL (2002) Anticonvulsant actions of gap junctional blockers in an in vitro seizure model. J Neurophysiol 88: 1893–1902. [DOI] [PubMed] [Google Scholar]
- Jones CKRT (1994) Geometric singular perturbation theory. In: Lecture notes in mathematics 1609. Dynamical systems (Terme M, Arnold L, eds), pp 44–118. Berlin: Springer.
- Kettenmann H (1999) Physiology of glial cells. Adv Neurol 79: 565–571. [PubMed] [Google Scholar]
- Kevorkian J, Cole JD (1996) Applied mathematical sciences, Vol 114. Multiple scale and singular perturbation methods. Berlin: Springer. [Google Scholar]
- Knowles WD, Traub RD, Strowbridge BW (1987) The initiation and spread of epileptiform bursts in the in vitro hippocampal slice. Neuroscience 21: 441–455. [DOI] [PubMed] [Google Scholar]
- Laing CR, Chow CC (2001) Stationary bumps in networks of spiking neurons. Neural Comput 13: 1473–1494. [DOI] [PubMed] [Google Scholar]
- Lee W, Hablitz JJ (1991) Initiation of epileptiform activity by excitatory amino acid receptors in the disinhibited rat neocortex. J Neurophysiol 65: 87–95. [DOI] [PubMed] [Google Scholar]
- Le Van Quyen M, Navarro V, Martinerie J, Baulac M, Varela FJ (2003) Toward a neurodynamical understanding of ictogenesis. Epilepsia 44 [Suppl 12]: 30–43. [DOI] [PubMed] [Google Scholar]
- Lopantsev V, Avoli M (1998) Laminar organization of epileptiform discharges in the rat entorhinal cortex in vitro. J Physiol (Lond) 509: 785–796. [DOI] [PMC free article] [PubMed] [Google Scholar]
- Ma HT, Wu CH, Wu JY (2004) The initiation of spontaneous epileptiform events in the rat neocortex, in vivo. J Neurophysiol 91: 934–945. [DOI] [PMC free article] [PubMed] [Google Scholar]
- Matsumoto H, Ayala GF, Gumnit RJ (1969) Neuronal behavior and triggering mechanism in cortical epileptic focus. J Neurophysiol 32: 688–703. [DOI] [PubMed] [Google Scholar]
- McCormick DA, Connors BW, Lighthall JW, Prince DA (1985) Comparative electrophysiology of pyramidal and sparsely spiny neurons of the neocortex. J Neurophysiol 54: 782–806. [DOI] [PubMed] [Google Scholar]
- Menendez de la Prida L, Pozo MA (2002) Excitatory and inhibitory control of epileptiform discharges in combined hippocampal/entorhinal cortical slices. Brain Res 940: 27–35. [DOI] [PubMed] [Google Scholar]
- Miles R, Traub RD (1987) Inhibitory control of local excitatory circuits in the guinea-pig hippocampus. J Physiol (Lond) 388: 611–629. [DOI] [PMC free article] [PubMed] [Google Scholar]
- Miles R, Wong RKS, Traub RD (1984) Synchronized afterdischarges in the hippocampus: contribution of local synaptic interactions. Neuroscience 12: 1179–1189. [DOI] [PubMed] [Google Scholar]
- Miles R, Traub RD, Wong RKS (1988) Spread of synchronous firing in longitudinal slices from the CA3 region of the hippocampus. J Neurophysiol 60: 1481–1496. [DOI] [PubMed] [Google Scholar]
- Noebels JL, Prince DA (1978) Development of focal seizures in cerebral cortex: role of axon terminal bursting. J Neurophysiol 41: 1267–1281. [DOI] [PubMed] [Google Scholar]
- Pinto DJ, Ermentrout GB (2001) Spatially structured activity in synaptically coupled neural networks. I. Traveling fronts and pulses. SIAM J Appl Math 62: 206–225. [Google Scholar]
- Pinto DJ, Hartings JA, Brumberg JC, Simons DJ (2003) Cortical damping: analysis of thalamocortical response transformations in rodent barrel cortex. Cereb Cortex 13: 33–44. [DOI] [PubMed] [Google Scholar]
- Prince DA (1967) The depolarization shift in “epileptic” neurons. Exp Neurol 21: 467–485. [DOI] [PubMed] [Google Scholar]
- Prince DA, Connors BW (1986) Mechanisms of interictal epileptogenesis. Adv Neurol 44: 275–299. [PubMed] [Google Scholar]
- Rorig B, Klausa G, Sutor B (1996) Intracellular acidification reduced gap junction coupling between immature rat neocortical pyramidal neurones. J Physiol (Lond) 490: 31–49. [DOI] [PMC free article] [PubMed] [Google Scholar]
- Schousboe A (2003) Role of astrocytes in the maintenance and modulation of glutamatergic and GABAergic neurotransmission. Neurochem Res 28: 347–352. [DOI] [PubMed] [Google Scholar]
- Silva LR, Amitai Y, Connors BW (1991) Intrinsic oscillations of neocortex generated by layer 5 pyramidal neurons. Science 251: 432–435. [DOI] [PubMed] [Google Scholar]
- Telfeian AE, Connors BW (1998) Layer-specific pathways for the horizontal propagation of epileptiform discharges in neocortex. Epilepsia 39: 700–708. [DOI] [PubMed] [Google Scholar]
- Traub RD, Wong RKS (1982) Cellular mechanism of neuronal synchronization in epilepsy. Science 216: 745–747. [DOI] [PubMed] [Google Scholar]
- Traub RD, Wong RKS (1983a) Synaptic mechanisms underlying interictal spike initiation in a hippocampal network. Neurology 33: 257–266. [DOI] [PubMed] [Google Scholar]
- Traub RD, Wong RKS (1983b) Synchronized burst discharge in disinhibited hippocampal slice. II. Model of cellular mechanism. J Neurophysiol 49: 459–471. [DOI] [PubMed] [Google Scholar]
- Traub RD, Miles R, Jefferys JGR (1993) Synaptic and intrinsic conductances shape picrotoxin-induced synchronized after-discharges in the guineapig hippocampal slice. J Physiol (Lond) 461: 525–547. [DOI] [PMC free article] [PubMed] [Google Scholar]
- Tsau Y, Guan l, Wu JY (1998) Initiation of spontaneous epileptiform activity in the neocortical slice. J Neurophysiol 80: 978–982. [DOI] [PubMed] [Google Scholar]
- Tyson JJ, Keener JP (1988) Singular perturbation theory of traveling waves in excitable media. Physica D 32: 327–361. [Google Scholar]
- Van Vreeswijk C, Hansel D (2001) Patterns of synchrony in neural networks with spike adaptation. Neural Comput 13: 959–992. [DOI] [PubMed] [Google Scholar]
- Wang XJ (2003) Persistent neural activity: experiments and theory. Cereb Cortex 13: 1123. [DOI] [PubMed] [Google Scholar]
- Wong RKS, Traub RD (1983) Synchronized bust discharge in disinhibited hippocampal slice. I. Initiation in CA2-CA3 region. J Neurophysiol 49: 442–458. [DOI] [PubMed] [Google Scholar]
- Xiong ZQ, Saggau P, Stringer JL (2000) Activity-dependent intracellular acidification correlates with the duration of seizure activity. J Neurosci 20: 1290–1296. [DOI] [PMC free article] [PubMed] [Google Scholar]