

Abstract
Brain insults such as the autoimmune inflammatory process in multiple sclerosis (MS) and experimental autoimmune encephalomyelitis (EAE) induce a measure of neurogenesis, but its regenerative therapeutic consequence is limited, because it fails to regenerate functional neurons and compensate the damage. Here, we investigated whether peripheral immunomodulatory treatment for MS/EAE, glatiramer acetate (GA), can enhance neurogenesis and generate neuroprotection in the CNS of EAE-inflicted mice. EAE was induced by myelin oligodendrocyte glycoprotein peptide, either in yellow fluorescent protein (YFP) 2.2 transgenic mice, which selectively express YFP on their neuronal population, or in C57BL/6 mice. The in situ effect of GA was studied in various brain regions; neuroprotection and neurogeneration were evaluated and quantified by measuring the expression of different neuronal antigens and in vivo proliferation markers. The results demonstrated that in EAE-inflicted mice, neuroproliferation was initially elevated after disease appearance but subsequently declined below that of naive mice. In contrast, GA treatment in various stages of the disease led to sustained reduction in the neuronal/axonal damage typical to the neurodegenerative disease course. Moreover, three processes characteristic of neurogenesis, namely cell proliferation, migration, and differentiation, were augmented and extended by GA treatment in EAE mice compared with EAE-untreated mice and naive controls. The newborn neuroprogenitors manifested massive migration through exciting and dormant migration pathways, into injury sites in brain regions, which do not normally undergo neurogenesis, and differentiated to mature neuronal phenotype. This suggests a direct linkage between immunomodulation, neurogenesis, and an in situ therapeutic consequence in the CNS.
Keywords: neurogenesis, neuroprotection, immunomodulation, multiple sclerosis, MS, experimental autoimmune encephalomyelitis, EAE, glatiramer acetate
Introduction
Current opinions concur that neurogenesis persists in the adult brain, where it may contribute to repair and recovery after injury. Brain insults such as cerebral ischemia (Jin et al., 2003), apoptosis (Magavi et al., 2000), or autoimmune inflammatory demyelination (Picard-Riera et al., 2002) enhance neurogenesis. Hence, multipotent cells located in the hippocampus hilus and the subventricular zone (SVZ) of the lateral ventricle manifest increased proliferation and migration in pathological situations. Moreover, progenitor cells from the SVZ that migrate through the rostral migratory stream (RMS) to the olfactory bulb (OB) can be triggered to differentiate into astrocytes and neurons (Picard-Riera et al., 2004). Nevertheless, the therapeutic significance of self-neurogenesis in CNS pathology is limited, because it fails to regenerate functional neurons that compensate the damage.
In multiple sclerosis (MS) and its animal model experimental autoimmune encephalomyelitis (EAE), the immune system provokes the detrimental process via autoimmune inflammatory mechanisms (Hellings et al., 2002; Behi et al., 2005). Still, neuronal and axonal degeneration, initiated at disease onset and revealed when compensatory CNS resources are exhausted, are the major determinants of the irreversible neurological disability (Bjartmar et al., 2003), particularly in the myelin oligodendrocyte glycoprotein (MOG)-induced model (Hobom et al., 2004). Current treatments for MS are effective in ameliorating the immune inflammatory process, but their ability to enhance the intrinsic CNS repair mechanism and to induce effective neuroprotection and neurogenesis has not been shown.
Glatiramer acetate (GA), an approved drug for MS treatment, exerts a marked suppressive effect on EAE induced by various encephalitogens in several species (Arnon and Sela, 2003). The immunomodulatory effect of GA was attributed to its ability to induce Th2/3 cells, which secrete high levels of anti-inflammatory cytokines (Aharoni et al., 1998; Duda et al., 2000). These cells cross the blood–brain barrier (BBB), accumulate in the CNS (Aharoni et al., 2000, 2002), and express in situ interleukin 10 (IL-10), transforming growth factor-β (TGF-β), and brain derived neurotrophic factor (BDNF) (Aharoni et al., 2003). Furthermore, the GA-specific cells induce the bystander effect on neighboring CNS cells to express these beneficial factors and reduce interferon-γ expression. A key issue in the capability of GA to counteract the pathological process is its effect on the neuronal system, which is the actual target of the pathological process.
The present study was intended to elucidate the effect of EAE induction on neurogenesis and differentiation toward the neural lineage. An additional goal was to investigate whether peripheral immunomodulatory treatment (GA injection in various stages of disease) has any effect on neurogenesis and neuroprotective processes. We report that in EAE mice, neuroproliferation was elevated after disease appearance but subsequently declined below that of naive mice. In contrast, GA treatment led to sustained reduction in the neuronal/axonal damage and augmented neuroprogenitor proliferation and mobilization. The newborn cells migrated into injury sites in brain regions, which do not normally undergo neurogenesis, and differentiated to mature neuronal phenotype, endorsing a direct linkage between immunomodulation, neurogenesis, and therapeutic consequence in the CNS.
Materials and Methods
Animals. C57BL/6 mice were purchased from Harlan (Jerusalem, Israel). Yellow fluorescent protein (YFP) 2.2 transgenic mice (originated from C57BL/6 and CBA hybrids), which selectively express YFP on their motor and sensory neuronal population (Feng et al., 2000), were kindly provided by J. R. Sanes (Washington University, St. Louis, MO). Female mice, 8–10 weeks of age, were used in all experiments.
EAE. Disease was induced by immunization with the peptide encompassing amino acids 35–55 of rat MOG synthesis (Sigma, St. Louis, MO). Mice were injected subcutaneously at the flank, with a 200 μl emulsion containing 300 μg of MOG in complete Freund's adjuvant and 500 μg of heat-inactivated mycobacterium tuberculosis (Sigma). An identical booster was given at the other flank 1 week later. Pertussis toxin (Sigma), 300 μg/mouse, was injected intravenously immediately after the first MOG injection and then 48 h later. Mice were examined daily. EAE was scored as follows: 0, no disease; 1, limp tail; 2, hindlimb paralysis; 3, paralysis of all four limbs; 4, moribund condition; 5, death.
Glatiramer acetate. GA (Copaxone, Copolymer 1) consists of acetate salts of synthetic polypeptides containing four amino acids: l-alanine, l-glutamate, l-lysine, and l-tyrosine. GA from batch 242990599, with an average molecular weight of 7300 kDa (Teva Pharmaceutical Industries, Petah Tiqva, Israel) was used throughout the study. GA treatment was applied by five to eight consecutive daily subcutaneous injections (2 mg/mouse) in different stages of disease [i.e., (1) starting immediately after EAE induction (prevention treatment), (2) starting after the appearance of disease manifestations at day 20 (suppression treatment), or (3) starting during the chronic phase 45 d after induction (delayed suppression)].
5-Bromo-2′-deoxyuridine. 5-Bromo-2′-deoxyuridine (BrdU) (Sigma), a thymidine analog incorporating into the DNA of dividing cells, was injected intraperitoneally (50 mg/kg) either concurrently with GA treatment (once each day) or immediately after completion of GA injections (twice each day).
Perfusion. Animals were deeply anesthetized with Nembutal and perfused transcardially with 2.5% paraformaldehyde. Brains were removed, postfixed in 1% paraformaldehyde, and cryoprotected with 15% sucrose solution in PBS. Free-floating sections (16 μm thick) were cut coronally or sagittally with a sliding microtome (Leica SM 2000r; Leica, Nussloch, Germany) through the entire brain and collected serially in PBS.
Immunohistochemistry. To detect BrdU-incorporated cells, sections were denatured in 2 m HCl in PBS at 37°C for 30 min and then neutralized with 0.1 m borate buffer, pH 8.5, for 10 min at room temperature. To detect specific cell types, sections were preincubated in PBS solution containing 20% serum and 0.5% Triton X-100 for 1 h and then incubated overnight at room temperature with primary antibodies. The following primary antibodies were used: goat anti-Doublecortin (DCX) C-18 (1:200; Santa Cruz Biotechnology, Santa Cruz, CA), mouse anti-neuronal-specific nuclear protein (NeuN) (1:300; Chemicon, Temecula, CA), mouse anti-GFAP (1:100; PharMingen, San Jose, CA), rabbit anti-phospho-histone (1:200; Upstate Biotechnology, Charlottesville, VA), rat anti-BrdU (1:200; Harlan, Indianapolis, IN), rat anti-CD11b (1:50; PharMingen), and chicken anti-BDNF (1:50; Promega, Madison, WI). The second antibody step was performed by labeling with highly cross-absorbed cyanine 2 (Cy2)- or Cy3-conjugated antibodies to rat, mouse, rabbit, goat, or chicken (Jackson ImmunoResearch, West Grove, PA) to avoid cross-reactivity (1:200; 20–40 min). Control slides were incubated with secondary antibody alone. In some cases, to enhance the signal, we used biotinylated secondary antibodies for 90 min, followed by Cy2- or Cy3-conjugated Streptavidin (Jackson ImmunoResearch). Sections were stained with Hoechst 33258 (Molecular Probes, Eugene, OR) for nuclear labeling. For detection of apoptosis, we used either rabbit anti-cleaved caspase-3 (1:75; Cell Signaling Technology, Beverly, MA) or terminal deoxynucleotidyl transferase-mediated biotinylated UTP nick end labeling (TUNEL) assay (Apoptag Fluorescein Detection kit; Intergen, Purchase, NY). In addition, we used Fluro-Jade B derivate (Chemicon), which specifically binds to degenerating neurons.
Microscopy. Stained sections were examined and photographed by a confocal microscope (Axiovert 100M; Zeiss, Oberkochen, Germany) or by a fluorescence microscope (E600; Nikon, Tokyo, Japan) equipped with Plan Fluor objectives connected to a CCD camera (DMX1200F; Nikon). Digital images were collected and analyzed using Image Pro+ software. Images were assembled using Adobe Photoshop (Adobe Systems, San Jose, CA).
Quantification. Neuronal progenitor cells were quantified by counting the BrdU+ cells (those with BrdU/DCX dual staining) and by counting DCX+ cells [in the subgranular zone (SGZ)] or by measuring the DCX-stained area (in the SVZ and RMS, where density did not permit counting of individual cells). Quantification was performed in coronal sections, in the SVZ starting at the level of the medial septum and 640 μm backward, and in the hippocampal dentate gyrus (DG) (in both blades for BrdU/DCX or in the upper blade for DCX) through its septotemporal axis. Quantification in the RMS was done on sagittal sections starting at 1 mm from the median line of the brain and 640 μm laterally. The results for each brain structure were averaged from eight unilateral levels per mouse (80 μm apart, three to four mice in each treatment group) and are expressed as change fold from naive controls. Quantification of BrdU/NeuN double-positive cells in the cortex was performed in areas of 0.15 mm2, selected at random (10 sections counted/mouse; three mice in each treatment group).
Statistical analysis. For BrdU and DCX analysis, the mean ± SEM (averaged from eight unilateral levels per mouse; three to four mice in each treatment group) was subjected to one-way ANOVA, followed by Fisher's least significant difference (LSD), at a comparison-wise error rate of 0.05, where appropriate. Because control values for BrdU incorporation were reduced as a function of time, results were expressed as change fold from naive controls injected concurrently with BrdU. The number of BrdU/NeuN double-positive cells in the cortex was averaged from 10 sections per mouse (three mice in each treatment group) and expressed as cells per cubic millimeter.
Results
Description of the experimental model
To study the manifestations of EAE as well as GA treatment in the CNS, we used the MOG 35–55 peptide-induced EAE model in two mice strains, the C57BL/6 susceptible strain and the YFP 2.2 transgenic mice, which selectively express YFP on their motor and sensory neuronal population and thus provide a simple tool to follow axonal/neuronal damage (Feng et al., 2000). YFP 2.2 mice were susceptible to MOG-induced EAE similarly to C57BL/6 mice (Fig. 1A). In both strains, EAE induction resulted in chronic (nonremitting) disease, starting on days 16–20 (increasing in severity, reaching an average score of 3 by days 20–24), and maintained in chronic phase, grade 2–2.5, until perfusion. GA treatment was applied by five to eight daily injections in different stages: (1) starting immediately after disease induction (prevention treatment), (2) starting after the appearance of disease manifestations at day 20 (suppression treatment), or 3) starting during the chronic phase, 45 d after induction (delayed suppression). GA ameliorated the clinical manifestations of EAE regardless of the stage in which it was administered (Fig. 1B). The beneficial effect was stable over time and sustained until the mice were killed. The in situ manifestations in brains of EAE-inflicted mice (EAE mice) versus EAE-induced mice treated with GA (EAE+GA) were studied compared with brains of naive mice (control).
Figure 1.

Clinical manifestations of EAE induced by MOG peptide 35–55. A, C57BL/6 and YFP2.2 mice. B, The effect of GA treatment in C57BL/6 mice treated by five to eight daily injections of GA in different stages of the disease [i.e., starting immediately after disease induction (prevention treatment), starting after the appearance of disease manifestations at day 20 (suppression treatment), or starting during the chronic phase 6 weeks after disease appearance (delayed suppression)]. The injection period of each treatment is illustrated along the x-axis. Six animals were tested in each treatment group.
Characterization of neurological damage
In YFP 2.2 mice, YFP was expressed mainly by axons and dendrites. Partial population in the cerebral cortex and the hippocampus expressed YFP in cell bodies as well. YFP expression in brain sections from mice that had suffered grade 2–4 EAE revealed multiple neuronal malformations manifested in axonal transection, sparse processes, and fiber deterioration (Fig. 2A). Multiple widespread lesions were frequently observed in various brain regions (Fig. 2B), indicative of considerable neuronal and axonal loss. An additional deformation in cell morphology in EAE mice was enlargement and swelling of neuronal cell body accompanied by margination of the nucleus as evident by distended hollow Hoechst-stained nuclei (Fig. 2C). These defects did not result from abnormality of the transgenic strain, because similar phenomena were observed in EAE-induced C57BL/6 mice stained by the neuronal marker NeuN (data not shown). Staining with Fluoro-jade B, which binds to degenerating neurons, revealed positively stained cells in the cortex 25 d after disease induction, which is the peak of clinical manifestations (Fig. 2D). Yet, we could not see significant amount of apoptosis in the cortex and the striatum of both strains using either cleaved caspase-3 antibody or TUNEL assay, indicating that apoptotic mechanisms could not account for the damage extent in this model. Perivascular infiltrations of CD3-stained cells were found adjacent or inside aberrant regions, indicating the detrimental role of infiltrating T-cells (Fig. 2A) (supplemental Fig. 1A,B, available at www.jneurosci.org as supplemental material). In naive controls as well as in mice injected with GA but not induced with EAE, we did not find neuronal malformations or perivascular infiltrations (data not shown).
Figure 2.

Histological manifestations of EAE induced by MOG peptide 35–55. A–D, The effect of GA treatment in sagittal brain sections of YFP2.2 mice expressing YFP (green) on their neuronal population. A, Deterioration and transaction of YFP-expressing fibers in the cerebellum and correlation with perivascular infiltration. The insets indicate areas with perivascular infiltrations, demonstrated by staining with antibodies for the T-cell markerCD3.B, Elimination of fibers in lesions in the striatum. Note the thin layer of YFP-positive fiber, frequently found over the lesions in GA-treated mice. C, Typical morphology of pyramidal cells in layer 5 of the cerebral cortex. The arrows and inset indicate abnormal neuronal cell bodies with marginalized nuclei in EAE mice. EAE was induced in YFP2.2 mice, 35 d before perfusion. GA treatment was applied by eight daily injections, starting immediately after EAE induction (prevention). Considerably less damages were found in the brains of EAE+GA mice than in the brains of untreated EAE mice (i.e., less deteriorating fibers, reduced number of lesions with smaller magnitude, and less swollen cell nuclei). D, Staining with Fluoro-Jade B (green), which binds to degenerating neurons, in the cortex of C57BL/6 mice 25 d after disease induction. Figures represent five mice in each group. Scale bar: A, 500 μm; B, C, 50 μm; D, 20 μm. L-2, L-5, and L-6, Layers two, five, and six of the cerebral cortex.
In brains of EAE+GA mice (either prevention or suppression treatment), considerably less damage was detected than in brains of EAE mice, revealing a smaller amount of deteriorating fibers (Fig. 2A), reduced number and size of lesions (Fig. 2B), and less swollen cell nuclei (Fig. 2C). The protective effect of GA was especially prominent when GA was applied as prevention treatment (after disease induction) and tested after 1 month, but a considerable reduction in neuronal damage was observed even when treatment started after disease appearance (as suppression treatment) and tested 10–30 d later. A thin layer of YFP-positive fibers was frequently found over the lesions in the GA-treated animals (Fig. 2B), suggesting surviving filaments or axonal sprouting in the damaged areas. T-cell infiltrations were found also in brains of GA-treated mice, yet in smaller amount, and their position was not associated with damage (Fig. 2A) (supplemental Fig. 1C, D, available at www.jneurosci.org as supplemental material).
Microglia activation
Immunostaining for MAC-1 (CD11b, expressed on macrophages and microglia and upregulated after their activation), is correlated with the extent of neuronal injury in EAE mice (shown in the cerebellum) (Fig. 3A). Thus, in areas occupied with activated microglia, sparse fibers and axonal loss were generally evident (box I), whereas in adjacent areas of nonactivated microglia, neuronal structure seemed intact (box II). Perivascular infiltration of activated MAC-1+ cells was found in injured areas, suggesting that peripherally originated macrophages were also involved in the pathological process. As shown in Figure 3B, the vast increase in MAC-1 staining intensity found in EAE mice was demonstrated in additional brain regions (e.g., striatum, thalamus, and hippocampus). MAC-1+ cells in the brains of control mice had relatively small cell body and long branched processes indicative of resting microglia. In contrast, brains of EAE mice, manifested rounding cell body with increased size and numerous retracted short processes, indicative of highly activated microglia (Fig. 3, inset). In brains of EAE+GA mice, MAC-1 expression was significantly reduced, exhibiting a moderate extent of activation. Cell morphology of MAC-1+ cells in GA-treated mice was similar to that of nonactivated microglia in naive mice (Fig. 3, inset). This arrest of microglial activation in EAE+GA mice was found at various times up to 30 d after termination of GA injections (supplemental Table 1, available at www.jneurosci.org as supplemental material).
Figure 3.
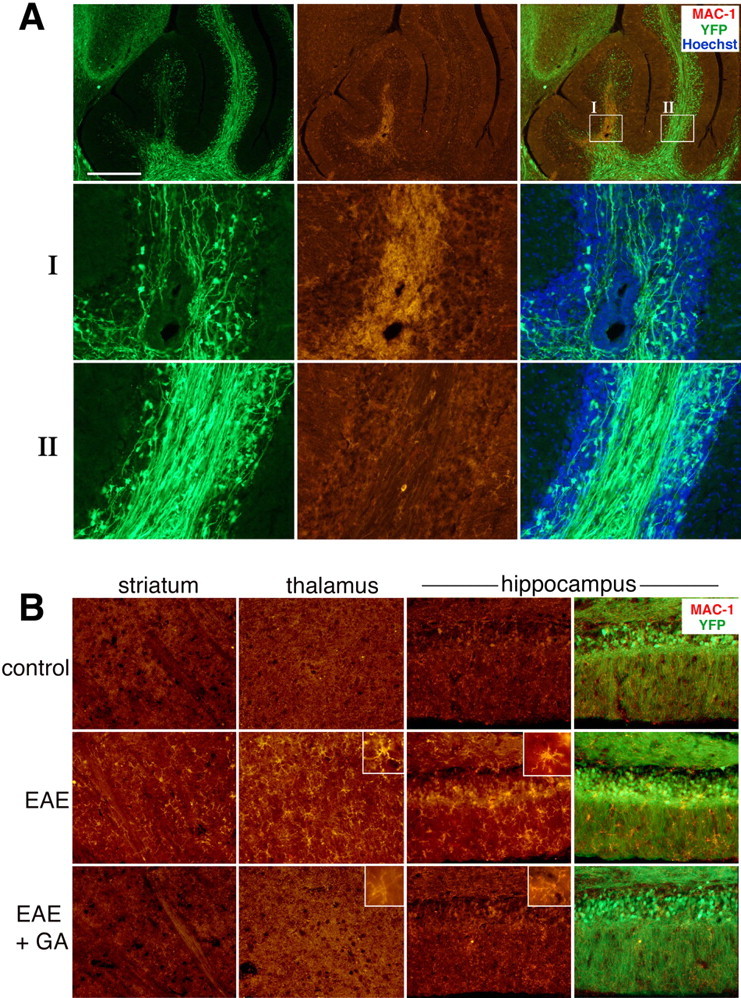
Microglial activation in EAE YFP2.2 mice. A, Correlation of the expression of the microglia and macrophage marker MAC-1 (red) with deterioration and injury of YFP-expressing fiber (green) in the white matter of the cerebellum. In box I, highly activated microglia cells are observed, accompanied by reduction in fiber density, whereas in the nearby area in box II, low MAC-1 expression and normal fiber appearance are present. B, The effect of GA on MAC-1 expression and on microglial cell morphology in various brain regions of EAE mice: striatum, thalamus (dorsal lateral geniculate nucleus), and hippocampus (granular and molecular layers). Increased MAC-1 staining and cell morphology typical for activated microglia were displayed in brains of EAE mice (insets). In contrast, MAC-1 expression in brains of EAE+GA mice was reduced extensively, exhibiting cell morphology similar to that of unactivated microglia in naive mice. EAE was induced in YFP2.2 mice 35 d before perfusion. GA treatment was applied by eight daily injections, starting immediately after EAE induction. Representative figures of four to five mice in each group (sagittal sections). Scale bar: A, 500 μm; B, 100 μm in the striatum and thalamus, 50 μm in the hippocampus.
Proliferation of neuronal progenitor cells
To evaluate the generation and proliferation of neuronal progenitor cells following the pathological process of EAE as well as after GA treatment, we used two markers: the immature neuronal marker DCX (associated with migrating and differentiating neurons of fetal and adult brain) and BrdU (thymidine analog incorporating into DNA of dividing cells), which had been injected concurrently with GA treatment. Hence, DCX expression indicated the amount of new neurons generated 10–14 d before the animal was killed, and the number of BrdU-incorporated cells (those with BrdU/DCX dual staining) indicated the number of neuroprogenitors emerging during the BrdU injection period. Neuroproliferation was studied in the neuroproliferative zones, the SVZ, as well as in the SGZ and granular cell layer (GCL) of the hippocampus. BrdU and DCX manifested overlapping patterns.
In the SVZ of EAE mice, neuroprogenitor proliferation was elevated after disease appearance (25 d after EAE induction; 1 d after the last BrdU injection) compared with the controls (Fig. 4A,BI). This was evident by a 2.1-fold and a 1.4-fold increase in BrdU and DCX expression, respectively (Fig. 4D, SVZ, I, red columns). Still, 10 and 20 d later, there was no significant difference in BrdU and DCX expression between EAE mice and naive controls (Fig. 4B,D, II, III). Furthermore, in mice enduring disease for prolonged periods (35 and 60 d), proliferation manifested by BrdU incorporation was lower than that of controls, either when BrdU was injected concurrently with EAE induction and tested 1 month later (Fig. 4D, first red column) or during the chronic stage before perfusion (D, last red column). GA treatment in EAE mice (administration schedules illustrated in Fig. 4E) augmented neuronal proliferation in the SVZ compared with untreated EAE mice as well as to controls (Fig. 4A,B). This elevation reached statistical significance over control and EAE for both BrdU and DCX by the suppression treatment, 1 and 10 d after termination of GA injection (Fig. 4D). Delayed suppression treatment resulted in significant elevation over EAE but not control. In the prevention treatment, substantial elevation over EAE and control was observed only for DCX (four-fold), although BrdU incorporation was indicative of significant elevation compared with EAE.
Figure 4.

Proliferation of newly generated neurons visualized by immunostaining for the proliferation marker BrdU (red) and the immature neuronal marker DCX (green) in the neuroproliferative zones of C57BL/6 mice. Increased expression of BrdU and DCX in EAE mice and, to a greater extent, in EAE+GA mice in the SVZ (A; confocal images) and in the hippocampus (C) 25 d after EAE induction 1 d after the last GA injection. Right panels are high magnifications of the SGZ and the GCL. Note the DCX+ cells in the hippocampus that migrated into the GCL and manifest a dense and branched dendritic tree. B, DCX expression in the SVZ at different times points: 1 d (I), 10 d (II), and 30 d (III) after the last GA injection. Neuroproliferation declined with time; however, DCX expression in GA-treated mice was higher than that in EAE mice 1 and 10 d after treatment (coronal sections). Scale bar: A, 50 μm; B, C, 200 μm; C, right, 20 μm. st, Striatum; LV, lateral ventricle; IML, inner molecular layer; OML, outer molecular layer. D, Quantitative analysis of BrdU incorporation and DCX expression in EAE (red) and EAE+GA (blue) mice at various time points after EAE induction and GA treatment. Increased neuronal proliferation is observed in both neuroproliferative zones after disease appearance; subsequent decline is observed below that of naive mice and augmentation of neuroproliferation by the various schedules of GA treatment. Quantification was performed in the SVZ by counting BrdU-positive cells (Figure legend continues.)(Figure legend continued.) (those with BrdU/DCX dual staining) and measuring the DCX-stained area, starting at the level of the medial septum and 640 μm backward, and in the hippocampal DG by counting BrdU+/DCX+ cells (in both blades) and DCX+ cells (in the upper blade of the dentate) through its septotemporal axis. The number of BrdU/DCX-stained cells for each brain structure was averaged from eight unilateral levels per mouse (80 μm apart; 3–4 mice for treatment group). Results are expressed as change fold from naive controls. Control values for BrdU incorporation are as follows: SVZ, 211 ± 31 and 23 ± 6; hippocampus, 45 ± 13 and 17 ± 8; BrdU/DCX+ cells, 1 d and 1 month after the last BrdU injection, respectively; DCX staining, in the SVZ, 19, 464 ± 3550 μm2, in the hippocampus, 78 ± 12 -positive cells averaged from 10 naive mice. Statistical analysis was performed by ANOVA followed by Fisher's LSD when appropriate. The asterisk indicates a significant effect over naive control and a significant effect over EAE-untreated mice (p < 0.05). E, Schedule of experiments: time length from EAE induction (day 0) until perfusion; GA injections as prevention (P), suppression (S), or delayed suppression (DS) treatments and BrdU inoculation, concurrently or immediately after GA treatment.
In the SGZ of the hippocampus, neuronal proliferation was elevated after disease appearance but subsequently declined below that of naive control (Fig. 4C,D, hippocampus, red columns). The effect of GA treatment in the hippocampus was similar to its effect in the SVZ, namely increased proliferation manifested by both BrdU incorporation and DCX expression that was not sustained after termination of the suppression treatments. Prevention as well as delayed suppression treatments resulted in higher neuroproliferation than in EAE mice, 1 month and 1 d after termination of GA/BrdU injection, respectively. Notably, in the hippocampus of EAE mice, and to a greater extent in EAE+GA mice (Fig. 4C), BrdU+/DCX+ cells were found in the SGZ and in the adjacent GCL. The DCX-expressing cells manifested dense and branched dendritic trees with well-developed apical dendrites that crossed the inner molecular layer and extended into the outer molecular layer.
GA injection to naive mice (without EAE), either just before perfusion or 1 month earlier, did not result in significant elevation of BrdU or DCX expression in both the SVZ and the DG (Fig. 4D, gray columns).
In brains of EAE+GA mice, in the neuroproliferative zones, CD3-stained T-cells were observed, adjacent to or inside the SVZ as well as in the SGZ of the hippocampus (Fig. 5A–D). T-cells could not be detected in the neuroproliferative zones of EAE untreated or naive mice (Fig. 5E).
Figure 5.
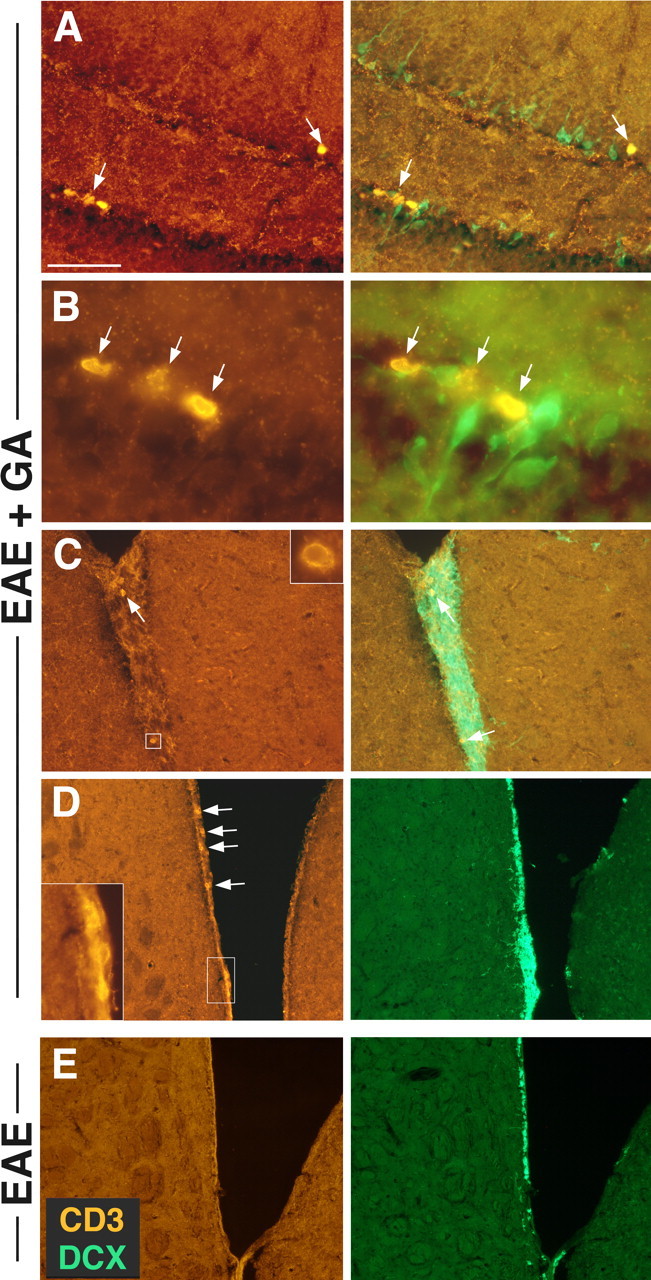
The association of T-cells with the neuroproliferative response induced by GA. CD3-stained T-cells (red) adjacent to DCX+ progenitor cells (green) in the SGZ of the hippocampus (A, B) and in the SVZ (C, D) of EAE+GA mice. T-cells were not detected in the neuroproliferative zones of EAE-untreated mice as shown in the SVZ (E). EAE was induced in C57BL/6 mice 35 d (A–C) and 55 d (D, E) before perfusion. GA treatment was applied by eight daily injections, starting at day 20 from induction, after the appearance of disease manifestations (suppression) (coronal sections). Scale bar: A, 64μm; B, 12μm; C, 100μm; D, 200μm.
Migration of neuronal progenitor cells
To study the destiny of the induced progenitor cells, we first followed their mobilization into the route in which SVZ cells normally migrate in adult mice, the RMS (Fig. 6A). As depicted in a segment adjacent to the SVZ (Fig. 6D) and in a more medial section (Fig. 6E), the amount of BrdU as well as DCX-labeled cells migrating along the RMS of EAE mice (25 d after disease induction, 1 d after the last BrdU injection) was elevated compared with naive controls. This was manifested by a 3.1-fold and 1.6-fold elevation in the number of BrdU+/DCX+ cells and in the DCX-stained area, respectively (Fig. 6F,G, red columns). After GA treatment (on days 20–25; suppression), the amount of neuronal progenitors in the RMS was even higher, exhibiting an extensive stream of BrdU/DCX-expressing cells (Fig. 6B,D,E). Thus, an increase of 7.8-fold and 2.6-fold in BrdU and DCX expression over control and 2.2-fold and 1.6-fold over EAE mice was obtained after GA treatment (Fig. 6F,G, blue columns). Notably, injection of GA alone also enhanced mobilization of progenitors into the RMS but to a lower extent (Fig. 6F,G, gray columns).
Figure 6.

Promoted mobilization and migration of neuronal progenitor cells in EAE mice treated with GA through migratory streams. A, Schematic sagittal representation of the migratory routes from the SVZ through both the RMS (red) and the LCS (yellow). B, Sagittal section through the RMS showing the route of DCX-positive cells (red) from the SVZ to the OB. C, Neuroprogenitors in the LCS, generally functional in the embryonic forebrain and reappear after GA treatment in EAE adult mice. DCX-positive cells (red) migrate alongside the YFP-expressing fibers (green) of the interface between the hippocampus and the corpus callosum toward various cortical regions mainly in the occipital cortex. D, E, Increased mobilization of newly generated neurons visualized with BrdU (orange) and DCX (green) immunostaining in the RMS of EAE+GA mice, compared with EAE mice and naive controls, in an RMS segment adjacent to the SVZ (D) and in a more medial section of the RMS arc (E) (sagittal sections). Scale bar: B, 1000 μm; C, 25; D, 500; E, 50 μm. LV, Lateral ventricle; Ctx, cortex; St, striatum; AC, anterior commissure; cc, corpus callosum; Hip, hippocampus; L-5 and L-6, layers five and six of the cerebral cortex. F–H, Quantitative analysis of BrdU (coexpressing DCX) or DCX in the RMS 1 d (F, G) and 1 month (H) after termination of BrdU and GA injections, indicating a significant increase of neuroprogenitors in the RMS of EAE mice over control, and higher elevation in EAE+GA mice. Note that in one EAE mouse, which exhibited slight, short-term disease and spontaneous recovery (EAE-rec H), enhanced neuronal migration was observed. Quantification was performed by counting the BrdU+/DCX+ cells and measuring the DCX-stained area (0.22mm) along the striatal border. The amount of BrdU/DCX-stained cells was averaged from eight sections per mouse, 80 μm apart. Three mice counted per treatment group, except EAE rec, which shows a single mouse. Results are expressed as change fold from naive controls. Control values: BrdU incorporation, 146 ± 31 BrdU+/DCX+ cells, 1 d after the last BrdU injection; DCX staining, 2193±305 μm2, averaged from six naive mice. *p<0.05 versus naive control. EAE mice in B, C, and H were treated with GA subsequent to disease induction, 1 month before perfusion (prevention); in D–G, EAE-induced mice were injected with GA and BrdU 20 d after disease induction, 1–5 d before perfusion (suppression).
Similar mobilization patterns of neuronal progenitors were found at a later time point (35 d after EAE induction, when GA treatment was given as prevention treatment; i.e., elevated DCX expression in the RMS of EAE vs control mice, and even more robust migration in EAE+GA mice) (Fig. 6H). Interestingly, in one EAE mouse (of 13 mice), we found enhanced neuronal migration similar to that of GA-treated mice. This mouse (denoted EAE-rec) exhibited only slight, short-term disease (score 2; at days 24–26 after induction) and completely recovered by the day of perfusion.
Treatment of EAE mice with GA led not only to enhanced mobilization of neuronal progenitors through the RMS but also to their migration into a region corresponding to the lateral cortical stream (LCS) of neuronal migration naturally found in the developing forebrain (Fig. 6A). Hence, DCX+ cells appeared to travel from the SVZ caudally in a chain along the corpus callosum and the hippocampo-callosal interface toward various cortical regions, mainly the occipital cortex (Fig. 6C). We could not trace such mobilization patterns in corresponding sections of EAE mice not treated with GA. Furthermore, in EAE+GA mice, neuronal progenitors diverged from the classic neuroproliferative zones, as well as the migratory streams, and spread to atypical regions such as the striatum, nucleus accumbens, and cortex (Fig. 7). The DCX+ cells appeared to move away from the RMS in close proximity to YFP-expressing filaments, suggesting their migration along nerve fibers (Fig. 7A). As seen by their direction and orientation, they migrated away from both the RMS and the SVZ, yet in some mice, most cells extended from the SVZ (Fig. 7B), whereas in others, the RMS seemed to be their major origin (Fig. 7C). DCX+ cells appeared to reach into the frontal cortex from the RMS (Figs. 6B, 7D) and to the occipital cortex from the LCS (Fig. 6C). They manifested morphological features characteristic of migrating neurons, such as fusiform somata, with a leading and trailing process (O'Rourke et al., 1995), and their orientation was consistent with migration away from the migratory stream into the internal part of the cortex along nerve fibers (Fig. 7E,F, layers 5 and 6). We did not detect neuroprogenitors in areas remote from the neuroproliferative zones and the migratory streams such as the cerebellum and the pons.
Figure 7.

Migration of neuronal progenitor cells in EAE-induced mice treated with GA. DCX-expressing neuronal progenitors (orange) diverge from the classic neuroproliferative zones or the migratory streams and spread to atypical regions along YFP-expressing fibers (green). A, From the RMS into the striatum. B, C, Toward the region of the nucleus accumbens, from the SVZ (B) and from the RMS (C). D, From the RMS into the internal part of the cortex to layer 5 (E) and layer 6 (F). Note the morphological features of the DCX-expressing cells, fusiform somata with leading and trailing processes (C, inset, E, F), characteristic of migrating neurons, and their orientation, migration away from the migratory stream, along the nerve fibers (A, D–F). Figures represent five GA-treated mice (sagittal sections). Scale bar: A–D, 200 μm; E, 100 μm; F, 10 μm. In A–C, the enlarged box area is depicted in the right panel. St, Striatum; AC, anterior commissure; cc, corpus callosum; L-5 and L-6, layers five and six of the cerebral cortex.
At an early time point after GA treatment and BrdU injection (1–10 d), neuronal progenitors that migrated away from the RMS manifested BrdU and DCX coexpression as shown in the striatum (Fig. 8A) and the nucleus accumbens (Fig. 8B), indicating that they underwent division concurrently with GA treatment. In some cases, these double-positive cells appeared in small clusters, suggesting local divisions as well. Furthermore, staining with phosphorylated histone H3, an endogenous marker of cells in the M phase, indicated that some DCX+ cells had proliferated just before perfusion, as seen for the neuroprogenitors accumulated in the nucleus accumbens in Figure 8C.
Figure 8.

Fate tracing of neuronal progenitor cells generated in the course of GA treatment in EAE mice. BrdU-incorporated cells (red), born during the concurrent injections of BrdU and GA migrated to various brain regions and expressed neuronal markers. A, B, BrdU-positive cells coexpressing the immature neuronal marker DCX (green) 10 d after the last injection in the striatum (A) and the nucleus accumbens (B). Note the clusters of double-positive cells, suggesting local divisions. C, Staining of DCX-expressing cells in the nucleus accumbens with the endogenous proliferation marker phosphohistone (blue), showing DCX-positive cells that had proliferated in situ before the mouse was killed. D–G, BrdU-positive cells coexpressing the mature neuronal marker NeuN (green) 1 month after completion of GA/BrdU injections in the striatum (D, F), nucleus accumbens (E), and cingulate cortex layer 5 confocal image (G). Arrows indicate representative BrdU/NeuN-coexpressing cells. H–K, BrdU-positive cells 1 month after GA/BrdU injection in YFP mice, coexpressing YFP (green) in the cingulate layer 5 (H, I), occipital layer 6 (J), and motor layer 5 (K) of the cortex. Pyramidal cells with characteristic elongated apical dendrites and axons, indicative of mature functional neurons are shown. Representative figures of five GA-treated mice for each time point. G and K are confocal images (sagittal sections). Scale bar: A, B, H, 200 μm; C, D, 100 μm; E, I–K, 50 μm; F, G, 15 μm.
At later time points (1 month after completion of GA treatment), BrdU+ cells coexpressing the neuronal nuclear antigen (NeuN) were found in the striatum (Fig. 8D,F), nucleus accumbens (Fig. 8E), and cortex (Fig. 8G, cingulate cortex layer 5), indicating that some neuroprogenitor cells had differentiated further toward a mature neuronal phenotype. In the cortex (Fig. 8H,I, cingulate, J, occipital, K, motor) of YFP mice, pyramidal cells coexpressing BrdU and YFP with apical dendrites and axons were observed, indicative of mature functional neurons. An average of 128 ± 46/mm3 BrdU+/NeuN+ double-labeled cells was found in the cortex of EAE+GA mice, consisting of 1.3% of all NeuN+ cells. It should be noted that BrdU+/NeuN+ cells were also found in the cortex of EAE mice not treated with GA, although fewer (48 ± 25/mm3; 0.58% from NeuN+ cells). In the cortex of naive mice, BrdU+/NeuN+ cells were not found.
Migration to lesion sites
The newly generated neurons seemed to be attracted to damaged regions. Hence, clusters of DCX/BrdU as well as NeuN/BrdU-coexpressing cells were situated in areas with deteriorating YFP-expressing fibers and lesions (Figs. 7B,C, 8A–D). Furthermore, DCX-expressing cells were found around the margins and inside lesions in the striatum (Fig. 9B,C), cortex (Fig. 9D,E), and nucleus accumbens (Fig. 9F). In EAE mice (not treated by GA), a few DCX+ cells surrounding lesions were also observed (Fig. 9A), but in EAE+GA mice, the amount of progenitors migrating to the lesions was much higher. The DCX+ neuroprogenitors localized into areas extensively occupied with astrocytes expressing GFAP (Fig. 10A–C), suggesting their migration into gliotic scar areas.
Figure 9.

Migration of neuronal progenitors to lesion sites. DCX-expressing cells (orange) were found in injured regions with deterioration of YFP-expressing fibers (green). A, EAE mice (not treated by GA), 35 d after disease induction, in the striatum. B–F, EAE mice, 35 d after disease induction, treated by GA (8 daily injections, starting immediately after disease induction, prevention). DCX-expressing cells are shown diverging from the RMS toward a lesion in the striatum (B), surrounding a lesion in the striatum (C), inside a lesion in the frontal cortex layer 5/6 (D, E), and in a cluster surrounding a lesion in the nucleus accumbens (F). Lesions in GA-treated mice were less extensive than those in untreated mice, yet the amount of progenitors adjoining these lesions was extensively higher. Note the YFP-expressing fibers extending into the lesions and the axonal sprouting in lesions occupied by DCX-expressing cells (D–F). Representative figures from four EAE and five EAE+GA mice (sagittal sections). Scale bar: A, B, 100 μm; C, D, F, 50 μm; E, 20 μm.
Figure 10.

GA-induced neuronal progenitors migrate to gliotic scar areas and express in situ BDNF. A–C, DCX-expressing cells (green) in regions populated with GFAP-expressing astrocytes (red) in the striatum. D–F, DCX-expressing cells (green) manifest extensive expression of BDNF (orange) in the nucleus accumbens (D, E) and the hippocampal dentate gyrus (F). Representative figures from five GA-treated mice (coronal sections). Scale bar: A–C, 100 μm; D, 50 μm; E, 12 μm; F, 30 μm.
In lesions occupied by DCX+ cells (Fig. 9D–F), we observed YFP-expressing fibers extending into lesions, suggesting the induction of axonal regeneration, or sprouting, by the neuroprogenitors. To determine whether the newly generated neurons can actually induce a growth-promoting environment, we tested their ability to express BDNF. As shown in Figure 10, in the nucleolus accumbens (D,E) and the hippocampus (F), a substantial proportion of the migrating DCX+ cells, in EAE+GA mice, manifested extensive expression of BDNF.
Discussion
The major finding reported here is that peripheral immunomodulatory treatment of an inflammatory autoimmune neurodegenerative disease induces neuroprotection as well as augmentation of the self-neurogenesis triggered by the pathological process. This results in massive migration of new neurons into injury sites, in brain regions that do not normally undergo neurogenesis, suggesting relevance to the beneficial effect of GA in EAE and MS.
The histopathological manifestations of MOG induced EAE in both C57BL/6 and YFP 2.2 strains were deteriorating fibers, axonal loss, widespread lesions, and nucleus margination, indicative of severe damage (Fig. 2). Perivascular infiltrations of T-cells (Fig. 2A) and macrophages (Fig. 3A) were found in close proximity to aberrant regions, consistent with their detrimental role in this disease (Stollg and Jander 1999; Behi et al., 2005). The protective effect of GA was manifested in prevention of the typical axonal and neuronal damage as evidenced in less deteriorating fibers, reduced amount of lesions with smaller magnitude, and less marginized cell nuclei. An additional prominent effect of GA was the reduction in microglia activation (Fig. 3B) manifested in all time points (1–30 d after treatment termination) by the various schedules. Microglia function as antigen-presenting cells within the CNS and thereby activate encephalitogenic T-cells and produce inflammatory toxic mediators, although dual function resulting from their capacity to express neurotrophic factors was also demonstrated (Stollg and Jander, 1999). In the current model, microglia activation was markedly elevated in EAE-inflicted mice in various brain regions, and this activation correlated with the amount of neuronal injury. Blockade of microglia activation may thus be a possible modulatory route by which GA prevents neuronal damage.
GA treatment resulted not only in decreased neuronal damage but also in increased neuronal proliferation. The combination of two detection markers allowed us to evaluate both the amount of new neurons generated 10–14 d before the animal was killed, by the overall expression of the immature neuronal marker DCX (Bayer et al., 1991), as well as the number of neuroprogenitors emerging during the concurrent BrdU/GA injection period (those that differentiated into the neuronal lineage and thus presented BrdU/DCX dual staining). Both systems gave comparable results as to the effect of the pathological process of EAE and that of GA treatment. Hence, EAE induction triggered increased neuroprogenitor proliferation in the neuroproliferative zones (the SVZ and the SGZ) after disease appearance (Fig. 4), in accordance with previous studies demonstrating increased cell proliferation in these zones after injury (Magavi et al., 2000; Picard-Riera et al., 2002; Jin et al., 2003). Still, this neuroproliferation decreased gradually and subsequently declined below that of naive control mice, indicative of the impairment inflicted by the disease and the failure of self-neurogenesis to compensate for the damage. GA treatment applied by various schedules to EAE mice augmented neuronal proliferation in both the SVZ and the SGZ over that of EAE mice and prolonged its duration. Of special significance is the neuroproliferative consequence of GA treatment initiated in the chronic phase of the disease (delayed suppression), because this phase in EAE/MS is regarded as the stage in which exhausted self-compensating neurogenesis fails and extensive neurodegeneration overcomes (Bjartmar et al., 2003; Hobom et al., 2004).
Neuroprogenitors originated in the SVZ were mobilized into the route in which they normally migrate in adults, the RMS. This mobilization was increased in EAE mice, and GA augmented it even further (Fig. 6). The therapeutic relevance of this effect is implied by the enhanced neuronal migration found in the EAE mouse that exhibited slight, short-term disease and spontaneous recovery. Still, in GA-treated mice, neuroprogenitor migration was not confined to the RMS. We found recurrence of the LCS (neuronal migratory route, naturally found in the embryonic forebrain) (Francis et al., 1999) as DCX-expressing cells migrated along the corpus callosum and the hippocampo-callosal interface, toward various cortical regions mainly to the occipital cortex (Fig. 6C). Furthermore, neuronal progenitors diverged from the classic neuroproliferative zones as well as the migratory streams and spread to adjacent atypical brain regions that do not normally undergo neurogenesis such as the striatum, nucleus accumbens, and cortex (Fig. 7). In the hippocampus of EAE mice, subsequent to disease appearance and to a greater extent and longer duration in EAE+GA mice, BrdU and DCX-expressing cells migrated from the SGZ into the adjacent GCL, extending branched dendrites through the inner and outer molecular layers (Fig. 4C). However, mobilization of SGL-originating cells was probably restricted to the hippocampus, because we found no evidence for migration beyond this region, in accordance with previous studies identifying the SVZ rather than the SGZ as the source of neuroprecursor migration (Jin et al., 2003).
At early time points after GA and BrdU injection (1–10 d after their last injection), BrdU+ neuroprogenitors expressed the immature neuronal marker DCX, characteristic of migrating and differentiating neurons (Bernier et al., 2002; Brown et al., 2003), and displayed migratory morphology, fusiform somata with a leading and a trailing process (Fig. 7) (O'Rourke et al., 1995). It has been doubted whether progenitors retain their ability to proliferate after leaving the neuroproliferative zones (Gould and Gross, 2002; Iwai et al., 2002). In EAE+GA mice, we found small clusters of BrdU/DCX-coexpressing cells in the striatum and the nucleus accumbens, suggesting local divisions. Furthermore, staining with phosphorylated histone (an endogenous marker of cells in M phase) indicated that some DCX+ cells in these regions had divided just before perfusion (Fig. 8), suggesting in situ proliferation outside the classic neuroproliferative zones. At a later time point (1 month after completion of GA treatment), DCX+ cells with branching processes (Figs. 7, 9) as well as BrdU+ cells expressing the mature neuronal marker NeuN and displaying mature morphology, were observed (Fig. 8). The amount of new neurons in the cortex of EAE mice was comparable with that found in other cases of damage-induced neurogenesis (Magavi et al., 2000; Picard-Riera et al., 2002; Arlotta et al., 2003). GA treatment increased this number by 2.6-fold, indicating substantial elevation of newly generated neurons. BrdU/NeuN+ cells were not found in the cortex of naive mice, confirming that neurogenesis does not normally occur in the adult rodent cortex (Iwai et al., 2002; Arlotta et al., 2003; Jin et al., 2003). Thus, the following three processes composed of neurogenesis were elevated after GA treatment: cell proliferation, migration, and differentiation (Jin et al., 2003; Chen et al., 2004).
These findings establish correlation between GA treatment and generation of neuroprotection and neurogenesis. It is possible that these effects result from suppression of inflammation (the insult initiating the pathological process and thus the subsequent damage), as demonstrated for anti-inflammatory treatment after endotoxin administration (Monje et al., 2003). The ability of GA to shift cytokine secretion from the Th1 inflammatory to the Th2/3 anti-inflammatory pathway was demonstrated in the periphery of mice and humans (Aharoni et al., 1998; Duda et al., 2000). Moreover, GA induces specific Th2/3 cells that cross the BBB, accumulate in the CNS (Aharoni et al., 2000, 2002), and express, in situ, the anti-inflammatory cytokines IL-10 and TGF-β (Aharoni et al., 2003). In this study as well, infiltrating T-cells were found in the brains of EAE+GA mice, and in contrast to EAE mice, their location was not associated with damage (Fig. 1c). However, the effect of the GA-induced cells in the CNS goes beyond blockage of inflammation. Hence, IL-10 was shown to modulate glial activation (Ledeboer et al., 2000), thus its in situ expression may account for the blockade of microglia activation in GA-treated mice (Fig. 3). As for TGF-β, its neuroprotective activity has been shown in various species (Dhandapani and Brann, 2003) as well as its ability to induce neuroproliferation and differentiation (Newman et al., 2000; Kawauchi et al., 2004). Furthermore, GA-specific cells in the brain were shown to express the potent neurotrophic factor BDNF (Aharoni et al., 2003), a key regulator of neuronal survival and neurogenesis in the adult brain (Lessmann et al., 2003). BDNF was shown to stimulate recruitment of SVZ cells and their migration through the RMS to structures that do not exhibit neurogenesis in adulthood and their differentiation into neurons (Pencea et al., 2001), similar to the finding in this study. Of special relevance, therefore, is our previous finding that adoptive transfer of GA-specific T-cells, or GA injection as such, induced a bystander effect on CNS resident cells (e.g., astrocytes and neurons) to extensively express IL-10, TGF-β, and BDNF, resulting in their significant elevation in various brain regions (Aharoni et al., 2003, 2004). In the present study, it is demonstrated that in GA-treated mice, T-cells were indeed found adjacent to or inside the SVZ and the SGZ of the hippocampus (Fig. 5). Because T-cells were not detected in parallel regions in naive or EAE-untreated mice, it could be suggested that T-cells may be involved in the augmentation of the neuroproliferation response induced by GA.
It is of special significance that the newly generated neurons were attracted or recruited to damaged regions, as evidenced by their migration into gliotic scarred areas (Fig. 10) and to regions exhibiting fiber deterioration, neuronal loss, and lesions (Figs. 7B,C, 8A–D, 9). Directed migration of new neurons toward injury sites has been demonstrated after cerebral ischemia (Jin et al., 2003), as well as in this study in EAE mice (Fig. 9A). However, although lesions in EAE mice treated by GA were less extensive, the amount of progenitors migrating into them was drastically larger. These new neurons could constitute a pool for the replacement of dead or dysfunctional cells and/or induce a growth-promoting environment that supports neuroprotection and axonal growth. The latter activity was evidenced by BDNF expression of the new neurons (Fig. 10D–F). Moreover, in lesions occupied by neuroprogenitors, YFP-expressing fibers extending into the lesions were observed (Figs. 2B, 9D–F), suggesting the induction of axonal regeneration or sprouting. The cumulative results presented here support the notion that an immunomodulatory drug can induce neuroprotection and neurogenesis that counteract the neurodegenerative disease course.
Footnotes
This work was supported in part by a research grant from Teva, by a grant from Terry and Dr. Claude Oster, and by a special fund from the Eugene Applebaum Family Foundation (Bloomfield Hills, MI). We are grateful to Prof. Menahem Segal for critical reading of this manuscript, fruitful discussions, and useful advice. We also acknowledge the cordial assistance of Prof. Elior Peles.
Correspondence should be addressed to Prof. Ruth Arnon, Department of Immunology, The Weizmann Institute of Science, Rehovot, 76100 Israel. E-mail: ruth.arnon@weizmann.ac.il.
DOI:10.1523/JNEUROSCI.1859-05.2005
Copyright © 2005 Society for Neuroscience 0270-6474/05/258217-12$15.00/0
References
- Aharoni R, Teitelbaum D, Sela M, Arnon R (1998) Bystander suppression of experimental autoimmune encephalomyelitis by T cell lines and clones of the Th2 type induced by copolymer 1. J Neuroimmunol 2: 135–146. [DOI] [PubMed] [Google Scholar]
- Aharoni R, Teitelbaum D, Leitner O, Meshorer A, Sela M, Arnon R (2000) Specific Th2 cells accumulate in the central nervous system of mice protected against experimental autoimmune encephalomyelitis by copolymer 1. Proc Natl Acad Sci USA 97: 11472–11477. [DOI] [PMC free article] [PubMed] [Google Scholar]
- Aharoni R, Meshorer A, Sela M, Arnon R (2002) Oral treatment of mice with copolymer 1 (glatiramer acetate) results in the accumulation of specific Th2 cells in the central nervous system. J Neuroimmunol 126: 58–68. [DOI] [PubMed] [Google Scholar]
- Aharoni R, Kayhan B, Eilam R, Sela M, Arnon R (2003) Glatiramer acetate-specific T cells in the brain express T helper 2/3 cytokines and brain-derived neurotrophic factor in situ. Proc Natl Acad Sci USA 100: 14157–14162. [DOI] [PMC free article] [PubMed] [Google Scholar]
- Aharoni R, Eilam R, Labunskay G, Sela M, Arnon R (2004) Copaxone (glatiramer acetate) injection augment brain derived neurotrophic factor expression in the brain. Multiple Sclerosis 10: S256. [Google Scholar]
- Arlotta P, Magavi SS, Macklis JD (2003) Induction of adult neurogenesis molecular manipulation of neural precursors in situ. Ann NY Acad Sci 991: 229–236. [DOI] [PubMed] [Google Scholar]
- Arnon R, Sela M (2003) Immunomodulation by the copolymer glatiramer acetate. J Mol Recognit 16: 412–421. [DOI] [PubMed] [Google Scholar]
- Bayer SA, Altman J, Russo RJ, Dai XF, Simmons JA (1991) Cell migration in the embryonic neocortex. I. J Comp Neurol 307: 499–516. [DOI] [PubMed] [Google Scholar]
- Behi ME, Dubucquoi S, Lefranc D, Zephir H, De Seze J, Vermersch P, Prin L (2005) New insights into cell responses involved in experimental autoimmune encephalomyelitis and multiple sclerosis. Immunol Lett 96: 11–26. [DOI] [PubMed] [Google Scholar]
- Bernier PJ, Bedard A, Vinet J, Levesque M, Parent A (2002) Newly generated neurons in the amygdala and adjoining cortex of adult primates. Proc Natl Acad Sci USA 99: 11464–11469. [DOI] [PMC free article] [PubMed] [Google Scholar]
- Bjartmar C, Wujek JR, Trapp BD (2003) Axonal loss in the pathology of MS: consequences for understanding the progressive phase of the disease. J Neurol Sci 15: 165–171. [DOI] [PubMed] [Google Scholar]
- Brown JP, Couillard-Despres S, Cooper-Kuhn CM, Winkler J, Aigner L, Kuhn HG (2003) Transient expression of doublecortin during adult neurogenesis. J Comp Neurol 467: 1–10. [DOI] [PubMed] [Google Scholar]
- Chen J, Magavi SS, Macklis JD (2004) Neurogenesis of corticospinal motor neurons extending spinal projections in adult mice. Proc Natl Acad Sci USA 101: 16357–16362. [DOI] [PMC free article] [PubMed] [Google Scholar]
- Dhandapani KM, Brann DW (2003) Transforming growth factor-beta: a neuroprotective factor in cerebral ischemia. Cell Biochem Biophys 39: 13–22. [DOI] [PubMed] [Google Scholar]
- Duda PW, Schmied MC, Cook SL, Krieger JI, Hafler DA (2000) Glatiramer acetate (Copaxone) induces degenerate Th2-polarized immune responses in patients with multiple sclerosis. J Clin Invest 105: 967–976. [DOI] [PMC free article] [PubMed] [Google Scholar]
- Feng G, Mellor RH, Bernstein M, Keller-Peak Cynthia, Nguyen QT, Wallace M, Nerbonne JM, Lichtman JW, Sanes JR (2000) Imaging neuronal subsets in transgenic mice expressing multiple spectral variants of GFP. Neuron 28: 41–51. [DOI] [PubMed] [Google Scholar]
- Francis F, Koulakoff A, Boucher D, Chafey P, Schaar B, Vinet MC, Friocourt G, McDonnell N, Reiner O, Kahn A, McConnell SK, Berwald-Netter Y, Denoulet P, Chelly J (1999) Doublecortin is a developmentally regulated microtubule-associated protein expressed in migrating and differentiating neurons. Neuron 23: 247–256. [DOI] [PubMed] [Google Scholar]
- Gould E, Gross CG (2002) Neurogenesis in adult mammals: some progress and problems. J Neurosci 22: 619–623. [DOI] [PMC free article] [PubMed] [Google Scholar]
- Hellings N, Raus J, Stinissen P (2002) Insights into the immunopathogenesis of multiple sclerosis. Immunol Res 25: 27–51. [DOI] [PubMed] [Google Scholar]
- Hobom M, Storch MK, Weissert R, Maier K, Radhakrishnan A, Kramer B, Bahr M, Diem R (2004) Mechanisms and time course of neuronal degeneration in experimental autoimmune encephalomyelitis. Brain Pathol 14: 148–157. [DOI] [PMC free article] [PubMed] [Google Scholar]
- Iwai M, Sato K, Omori N, Nagano I, Manabe Y, Shoji M, Abe K (2002) Three steps of neural stem cells development in gerbil dentate gurus after transient ischemia. J Cereb Blood Flow Metab 22: 411–419. [DOI] [PubMed] [Google Scholar]
- Jin K, Sun Y, Xie L, Peel A, Mau XO, Batteur S, Greenberg DA (2003) Directed migration of neuronal precursors into the ischemic cerebral cortex and striatum. Mol Cell Neurosci 24: 171–189. [DOI] [PubMed] [Google Scholar]
- Kawauchi S, Beites CL, Crocker CE, Wu HH, Bonnin A, Murray R, Calof AL (2004) Molecular signals regulating proliferation of stem and progenitor cells in mouse olfactory epithelium. Dev Neurosci 26: 166–180. [DOI] [PubMed] [Google Scholar]
- Ledeboer A, Breve JP, Poole S, Tilders FJ, Van Dam AM (2000) Interleukin-10, interleukin-4, and transforming growth factor-beta differentially regulate lipopolysaccharide-induced production of pro-inflammatory cytokines and nitric oxide in co-cultures of rat astroglial and microglial cells. Glia 30: 134–141. [DOI] [PubMed] [Google Scholar]
- Lessmann V, Gottmann K, Maclcangio M (2003) Neurotrophin secretion: current facts and future prospect. Prog Neurobiol 69: 341–374. [DOI] [PubMed] [Google Scholar]
- Magavi SS, Leavitt BR, Macklls J (2000) Induction of neurogenesis in the neocortex of adult mice. Nature 405: 951–955. [DOI] [PubMed] [Google Scholar]
- Monje ML, Toda H, Palmer TD (2003) Inflammatory blockade restores adult hippocampal neurogenesis. Science 302: 1760–1765. [DOI] [PubMed] [Google Scholar]
- Newman MP, Feron F, Mackay-Sim A (2000) Growth factor regulation of neurogenesis in adult olfactory epithelium. Neuroscience 99: 343–350. [DOI] [PubMed] [Google Scholar]
- O'Rourke NA, Sullivan DP, Kaznowsky CE, Jacobs AA, McConnell SK (1995) Tangential migration of neurons in the developing cerebral cortex. Development 121: 2165–2176. [DOI] [PubMed] [Google Scholar]
- Pencea V, Bingaman KD, Wiegand SJ, Luskin MB (2001) Infusion of brain-derived neurotrophic factor into the lateral ventricle of the adult rat leads to new neurons in the parenchyma of the striatum, septum, thalamus, and hypothalamus. J Neurosci 1: 6706–6717. [DOI] [PMC free article] [PubMed] [Google Scholar]
- Picard-Riera N, Decker L, Delarasse C, Goude K, Nait-Oumesmar B, Liblau R, Pham-Dinh D, Evercooren (2002) Experimental autoimmune encephalomyelitis mobilized neuronal progenitors from the subventricular zone to undergo oligodendrogenesis in adult mice. Proc Natl Acad Sci USA 99: 13211–13216. [DOI] [PMC free article] [PubMed] [Google Scholar]
- Picard-Riera N, Nait-Oumesmar B, Baron-Van Evercooren A (2004) Endogenous adult neural stem cells: limits and potential to repair the injured central nervous system. J Neurosci Res 76: 223–231. [DOI] [PubMed] [Google Scholar]
- Stollg G, Jander S (1999) The role of microglia and macrophages in the pathophysiology of the CNS. Prog Neurol 58: 233–247. [DOI] [PubMed] [Google Scholar]