

Abstract
We developed a naturalistic behavioral task to investigate the influence of spatial and temporal expectations on attentional orienting to moving targets. In this task, the movement of an object before its disappearance under an occluding barrier generated expectations concerning the location and/or time of its reappearance. Four different trial types were intermixed, each inducing a different state of expectation: no expectation, only spatial expectation about the location of reappearance, only temporal expectation about the moment of reappearance, and combined spatial and temporal expectation. The behavioral validity of the task was shown by the fact that all expectation conditions produced significantly shorter reaction times than the control state of no expectation. Spatial attention modulated early perceptual analysis in extrastriate areas, as demonstrated by significant enhancement of the visual P1 component. Temporal attention alone had no effect on P1 but instead modulated response-specific components. However, when spatial and temporal attention were combined, the enhancement of perceptual processing was significantly augmented, leading to a greater enhancement of the P1 component than by spatial attention alone. Perceptual analysis reflected by the P1 component correlated significantly with reaction times. In summary, event-related potentials revealed the presence of individual modulatory effects attributable to spatial and temporal expectation as well as synergistic effects indicative of an interaction of the two. This synergistic effect is likely to play a critical role in directing attention to the reappearance of a temporarily occluded moving target, a process of obvious importance in everyday situations.
Keywords: occlusion, event-related potentials, P1, spatial orienting, temporal orienting, parietal, attention
Introduction
The concept of selective attention arises because we continually receive vast quantities of sensory information but only have limited resources with which to process them. Attentional functions prioritize the allocation of these resources based on changes in motivation, volition, and expectation. The most commonly studied type of selective attention is spatial orienting (Posner, 1980), but it is also possible to orient attention to nonspatial attributes, such as objects (Duncan, 1984) or instants in time (Coull and Nobre, 1998; Griffin et al., 2001; Griffin and Nobre, 2005). In all cases, the consequences of attentional orienting can be measured by behavioral enhancements, such as the speeding of responses to relevant stimuli.
The prevailing view is that selective attention is controlled by a common network of multimodal parietal and frontal brain regions, which bias perceptual analysis through top-down neural connections (Heilman and Watson, 1977; Mesulam, 1981; Kastner and Ungerleider, 2000). However, recent investigations of temporal orienting have suggested that different mechanisms can contribute to attentional control and modulation. Imaging studies have shown that the control of spatial and temporal attention involve only partly overlapping systems (Coull and Nobre, 1998; Coull et al., 2000). Studies using event-related potentials (ERPs) have revealed striking differences in the modulation of target processing by spatial and temporal attention. Temporal orienting has not been found to affect early components representing topographically specific perceptual analysis, such as the visual P1 component (Miniussi et al., 1999; Griffin et al., 2002). Instead, the effects of temporal orienting are later than those of spatial orienting and include latency modulation of components thought to reflect decision- or response-related processes, like the P300. The emerging alternative view is more flexible, in which brain areas with relevant functional specializations for task goals participate in attentional orienting and influence stimulus analysis at multiple levels (Nobre, 2004).
Spatial and temporal orienting have been typically investigated in tasks using symbolic cues that predict the spatial location or temporal instant, respectively, of an upcoming stimulus. This traditional paradigm, although widely used, is not particularly representative of everyday experience. In real life, expectations about perceptual events develop by observing their spatial or temporal attributes, such as in the case of transient occlusion of moving objects (Wertheimer, 1961; Michotte et al., 1964; Assad and Maunsell, 1995). In addition, different types of expectation do not occur in isolation. Temporal expectation is normally accompanied by expectations about stimulus location and identity. One major challenge is to understand the ability of different types of expectation to interact to sharpen attentional functions.
We developed a task to investigate whether and how expectations along the two major constructed perceptual dimensions (space and time) compare and how they interact. Participants used the information inherent in the way a ball moved across the screen to anticipate where and/or when it would appear from behind an occluding strip. Implicit, rather than explicit, information was used to “cue” subjects to the target's appearance, mirroring the way information might be presented in everyday situations.
Materials and Methods
Subjects. The experimental methods were noninvasive and had ethical approval from the University of Oxford Department of Experimental Psychology. All participants reported being free of neurological disorders and took part as paid volunteers. Visual acuity was normal or corrected to normal. Thirty healthy, right-handed (Oldfield, 1971) subjects [mean age, 23.9 years (SD, 4.9 years); range, 19–32 years; 9 males) took part in the ERP experiment. Data were accepted from 24 subjects, whereas the remainder were discarded because of unsatisfactory ERP recordings (see below).
Stimuli and task. The task, illustrated in Figure 1, consisted of four different conditions: spatial and temporal expectation (ST), spatial expectation only (S), temporal expectation only (T), and neither temporal nor spatial expectation (N). In all conditions, a red “ball” (diameter, 0.7°) appeared on the left side of the screen and moved from the left to the right across the screen in 15 steps of 1.3°. An occluding band was positioned at an eccentricity of 11.4–14.7° (width, 3.5°). The ball, after reaching this occluder, disappeared underneath for two steps. When it reappeared on the right side of the occluder, subjects were required to discriminate the presence of a black dot in its center (diameter, 0.15°). This was only present for the reappearance step and only appeared on 50% of trials. If the black dot was present, subjects were required to respond by pressing the space bar. If it was not present, they did not respond. The trial ended when the ball exited the screen on the right side. There was a variable interval of 700–1000 ms between trials.
Figure 1.
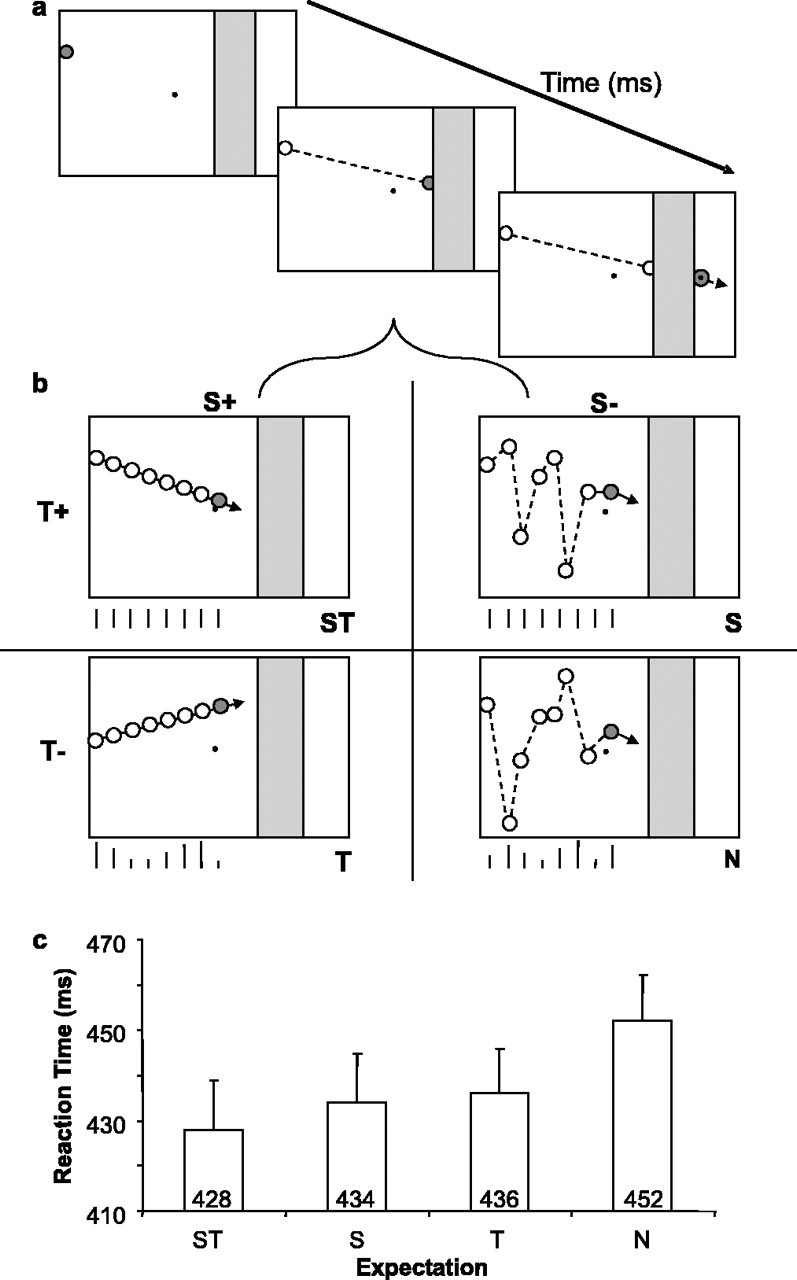
Task and behavioral results. a, The three pictures represent the task at three different stages. First, a red ball (dark gray) appeared at the left side of a black screen (white) and moved across the screen in steps (its previous trajectory is indicated by the dashed line). After reaching the gray occluding band, the ball disappeared underneath for two steps. After reappearance, it contained a black dot on 50% of trials. This was only present for the reappearance step. Subjects were required to respond if the black dot was present. b, This expands on the movement of the ball across the screen. The task manipulated spatial and temporal expectations factorially. The four resulting trial types were randomly intermixed: ST, S, T, and N. To create spatial expectation, the ball moved with a straight-line trajectory across the screen (S+ conditions; left column). When there was no spatial expectation, the ball still moved from the left to the right but was placed randomly on the vertical axis at each step (S– conditions; right column). Temporal expectation was created by steps of the same time period (550 ms; T+ conditions; top row). When there was no temporal expectation, each step took a different length of time (200–900 ms) (T-conditions; bottom row). The upright lines below each display represent schematically the duration of each time step. c, A bar graph indicating the median reaction time averaged over subjects (n = 24) for the four conditions. Error bars indicate SE.
The different types of expectation (ST, S, T, or N) were set up using the movement of the ball. To create spatial expectation, the ball moved with a constant spatial trajectory across the screen. Thus, the subject was able to anticipate and orient toward the specific location along the vertical extent of the occluder at which the ball would exit. When there was no spatial expectation, the ball still moved from the left to the right across the screen but was placed randomly on the vertical axis on each step (giving the impression that it was bouncing erratically). Therefore, when it exited the occluder, subjects did not know where on the vertical axis it would reappear. To create temporal expectation, the ball was present on the screen for the same amount of time on each step (550 ms) so that it moved at regular intervals. This enabled subjects to anticipate and orient toward the point in time when the ball would exit the occluder (1100 ms after entry). When there was no temporal expectation, the ball was present on the screen for a different time interval on each step (between 200 and 900 ms). Hence, the subjects were unable to predict when the ball would reappear from behind the occluder.
The experimental task lasted ∼70 min. There were seven blocks, each containing 56 trials. Within each block, there were equal proportions of the four conditions: ST, S, T, and N. Each condition also contained 50% “dot” (go) trials and 50% “no-dot” (no-go) trials. This gave 98 trials in each condition for ERP analysis when the dot and no-dot conditions were collapsed and 49 trials when they were separated. The conditions were presented in a random sequence within each block. There was one practice block of 16 trials. The first of the seven blocks was discarded for the purposes of analyzing the behavioral data.
Median reaction times and accuracies to detect the target (Fig. 1; black dot indicates the reappearance of the ball) were analyzed for the four different conditions (spatial and temporal expectation, spatial expectation only, temporal expectation only, and no expectation). The effects of spatial and temporal expectation were tested using a repeated-measures ANOVA, with two factors: spatial expectation (present, absent) and temporal expectation (present, absent).
Procedure. Subjects were comfortably seated in a dimly illuminated, electrically shielded room, facing a computer monitor positioned 100 cm in front of them. They were instructed to use the information inherent in the way the ball moved, if possible, to anticipate its reappearance. They were also instructed to respond as quickly as possible if the ball contained a black dot and to refrain from responding if it did not contain a black dot. To discriminate the black dot, focused processing of the ball was needed on its reappearance. Subjects were required to maintain their gaze on a small fixation point (diameter, 0.18°) in the center of the monitor throughout the trial. Finally, they were asked to suppress saccades and refrain from blinking during the trials. The position of eye gaze and eye movements were monitored on-line with an infrared camera and video system (iView; SensoMotoric Instruments, Tetlow, Germany) with >0.1° theoretical precision in a subgroup of participants to ensure they performed the task covertly and without breaking fixation from the central point. Only the 24 subjects whose ERP data were suitable for analysis (see below) were included in the behavioral analysis.
ERP recording and analysis. The EEG was recorded continuously from 34 scalp sites using Ag/AgCl electrodes mounted on an elastic cap (Easy Cap; Falk Minow Services, Herrsching-Breitbrunn, Germany), positioned according to the 10–20 International system (American Electroencephalographic Society, 1991) using NuAmp amplifiers (Neuroscan, El Paso, TX). The montage included six midline sites (FZ, FCZ, CZ, CPZ, PZ, and OZ) and 14 sites over each hemisphere (FP1/FP2, F7/F8, F3/F4, FT7/FT8, FC3/FC4, T7/T8, C3/C4, TP7/TP8, CP3/CP4, P7/P8, P3/P4, PO7/PO8, PO3/PO4, and O1/O2). Additional electrodes were used as ground and reference sites and for recording the electrooculogram (EOG). Recordings were referenced to the right mastoid and then re-referenced off-line to the algebraic average of the right and left mastoids. The horizontal and vertical EOGs were recorded bipolarly with electrodes placed around the eyes to measure horizontal and vertical eye movements, respectively. The signal was digitized at a sampling rate of 500 Hz. Data were recorded with a low-pass filter of 200 Hz and with no high-pass filter (DC). No additional filtering of the data was performed.
The epoching of ERPs was performed off-line. Epochs started 200 ms before and ended 822 ms after the reappearance of the ball. The pre-stimulus interval (–200 to 0 ms) was used to calculate the baseline. Epochs containing excessive noise or drift (±100 μV) at any electrode were rejected. Epochs with eye-movement artifacts (blinks or saccades) were also rejected. Blinks and large saccades were identified as large deflections (±50 μV) in the horizontal or vertical EOG electrodes. Additionally, all trials were inspected for smaller saccades and blinks and discarded if necessary.
Separate averaged ERP waveforms were constructed for the ST, S, T, and N conditions, both with and without collapsing the dot and no-dot trials. To ensure a sufficient signal-to-noise ratio in the ERP waveforms, a minimum criterion of 30 trials per condition was set. Any participant with <30 trials in any condition was excluded. Six subjects were consequently excluded from analysis.
The main aim of the ERP analysis was to compare the consequences of temporal versus spatial expectation after processing of target stimuli and to investigate the possibility that these two different types of expectation interact to optimize further perceptual or motor-related processes. The analysis focused on particular areas of interest in the target waveform in which modulation has been observed in past studies of temporal and spatial attention. In particular, we investigated the effects of temporal and spatial expectation on the visual P1 and N1 components and also on the later N2 and P3 components, which are sensitive to motor variables. To explore the data for additional putative effects, successive point-wise t tests for each data point between 0 and 500 ms were performed, comparing each expectation condition (ST, S, and T) to the neutral condition at each electrode (Guthrie and Buchwald, 1991; Murray et al., 2002). Effects were considered significant if α = 0.05 two-tailed criterion was exceeded for >20 ms over a region of at least three adjacent electrodes. No additional effects were identified in the data.
Mean amplitudes of the components were analyzed over electrodes and time periods when they were maximal. The topographical distributions of the components were examined using both data referenced to the average of the mastoids and data re-referenced to the average of all electrodes and normalized according to the global field power (Cartool 3.11; Denis Brunet, Geneva, Switzerland). In both cases, the early P1 and N1 components were maximally distributed over lateral posterior electrodes and were analyzed accordingly at electrodes PO7/8, PO3/4, and O1/2. To obtain an estimate of the amplitude of each visual component around its peak, a narrow symmetrical temporal window was set around the peak latency of each visual component, ensuring that there was no activity from other overlapping components during this time. P1 and N1 were therefore analyzed between 110 and 130 ms and 160 and 200 ms, respectively. The N2 and P3 components, which are more broadly distributed both spatially and temporally, were analyzed over midline and lateral flanking electrodes spanning frontal to parietal scalp sites (F3/Z/4, FC3/Z/4, C3/Z/4, CP3/Z/4, and P3/Z/4) between 220 and 330 ms and 400 and 600 ms, respectively. The peak latency for the P3 component was also analyzed, with a temporal window of 350–600 ms (Miniussi et al., 1999; Griffin et al., 2002). Amplitude values were calculated with reference to the 200 ms pretarget baseline for all components.
Repeated-measures ANOVAs assessed the effects of temporal expectation (present, absent), spatial expectation (present, absent), response requirements (go, no-go trials), and variables linked to electrode location and side. To adjust for possible violations of the sphericity assumption, the Greenhouse–Geisser ϵ correction factor was used where appropriate (Jennings and Wood, 1976). When the response factors did not exert any effect or interact with other factors, simplified analyses were also performed with go and no-go data collapsed assessing the effects of temporal expectation (present, absent), spatial expectation (present, absent), and variables linked to electrode location and side. Subsidiary ANOVAs were also used to clarify the nature of interactions. In addition, to test the influence of the level of processing reflected by each component to behavioral performance, Pearson correlations were calculated between reaction time and the mean amplitude of the component (combined over the electrodes analyzed) for the go trials in the four expectation conditions.
If the mechanisms of attention are similar when expectations are extracted implicitly from the dynamic attributes of stimuli compared with when expectations are guided by explicit cues or instruction, we would expect the effects of spatial and temporal expectation to differ significantly. Specifically, spatial expectation should enhance the amplitudes of the visual components P1 and N1 in a retinotopically specific way, as well as the amplitude of the later N2 and P3 components (Eason et al., 1969; Hillyard et al., 1973; Van Voorhis and Hillyard, 1977; Harter et al., 1982). Instead, temporal expectation should not modulate visual components but should enhance the amplitude of the N2 component and shorten the latency of the late P3 component (Miniussi et al., 1999; Griffin and Nobre, 2005). Still untested by previous studies is the ability of the two types of expectation to interact and boost these modulatory mechanisms, and at what level this might occur. We were particularly interested in determining whether predictive temporal information could enhance early perceptual modulation by spatial attention at the level of the visual P1 component.
Results
Behavioral results
Reaction time and accuracy measures are summarized in Table 1. Both spatial and temporal expectations were found to speed reaction times significantly (spatial factor, F(1,23) = 15.3, p = 0.001; temporal factor, F(1,23) = 8.9, p < 0.05). The interaction between the two factors was not significant (F(1,23) = 2.15). Post hoc subsidiary analyses using paired-samples t tests demonstrated that the reaction-time advantage was present when comparing S and N (t(23) = 3.3; p < 0.05), T and N (t(23) = 3.3; p < 0.05), and ST and N (t(23) = 5.0; p < 0.001). This indicates that subjects responded faster when they had spatial or temporal expectation and could orient their attention to the point in space or time at which the target reappeared. The effects of temporal and spatial expectations were additive, and subjects were fastest when they had combined spatial and temporal expectation than when they had spatial or temporal expectation alone. The difference between the ST and T conditions was statistically significant (t(23) = 2.4; p < 0.05), but the difference between the ST and S conditions failed to meet significance (t(23) = 1.4).
Table 1.
Behavioral results
|
|
Median reaction times (ms) |
% Correct, go-trials |
% False-alarms, no-go trials |
|---|---|---|---|
| ST | 428 (SD = 52; SE = 11) | 91% (SD = 9.0; SE = 1.8) | 9% (SD = 11.0; SE = 2.3) |
| S | 434 (SD = 53; SE = 11) | 91% (SD = 8.3; SE = 1.7) | 7% (SD = 7.1; SE = 1.4) |
| T | 436 (SD = 48; SE = 10) | 86% (SD = 12.5; SE = 2.6) | 7% (SD = 7.6; SE = 1.6) |
| N |
452 (SD = 49; SE = 10) |
87% (SD = 12.1; SE = 2.5) |
7% (SD = 5.7; SE = 1.2) |
Accuracy for identifying the small dot within the ball target in go trials was improved by spatial expectation (F(1,23) = 10.0; p < 0.05) but was not affected significantly by temporal expectation (F(1,23) = 1.8). The spatial and temporal factors did not interact (F(1,23) = 0.62). The maximal accuracy benefits were achieved by combined spatial and temporal expectations. Post hoc paired-samples t tests showed that only accuracies in the combined ST condition were significantly higher than those in the no-expectation condition (t(23) = 2.2; p < 0.05). Although spatial expectation alone yielded a similar percentage of correct responses, the paired t test showed only a marginal improvement relative to the no-expectation condition (t(23) = 1.8; p = 0.08). Comparison of accuracies in the condition of combined expectations relative to single expectations showed performance improvements relative to temporal expectation alone (t(23) = 3.6; p < 0.05) and equivalent performance relative to spatial expectation (t(23) = 0.21). Accuracy in the no-go trials was high overall (93%), with the percentage of false alarms unaffected by temporal or spatial expectations (F(1,23) < 1.3).
ERP results
Visual components P1 and N1
The P1 component reflects activity in multiple ventral (Di Russo et al., 2002) and dorsal (Foxe et al., 2001, 2005) extrastriate visual areas as well as possibly the striate cortex (Simpson et al., 1995). In the present task, the visual P1 component peaked at 116 ms at contralateral electrodes (maximal at PO7) and at 128 ms at ipsilateral electrodes (maximal at PO8). Its mean amplitude analysis showed no effects or interactions with response requirements. Data from go and no-go trials were therefore combined to simplify the analysis (Fig. 2). As predicted, analysis with the combined data showed that spatial expectation significantly enhanced P1 amplitude (F(1,23) = 7.2; p < 0.05). Enhancement of the P1 component by spatial expectation was focused over the left scalp, contralateral to the location of the target stimulus, and was largest at the PO7 electrode (spatial × side interaction, F(1,23) = 11.9, p < 0.05; spatial × electrode × side interaction, F(1.9,43.6) = 4.3, p < 0.05). As predicted, temporal expectation did not modulate P1 amplitude on its own (F(1,23) = 1.2). However, surprisingly, it interacted significantly with spatial expectation to potentiate the P1 enhancement (spatial × temporal interaction, F(1,23) = 6.1; p < 0.05). Scalp topographies averaged from 110 to 130 ms (Fig. 2) show the positive modulation of P1 by spatial expectation and its enhanced modulation by the combined temporal and spatial expectation.
Figure 2.
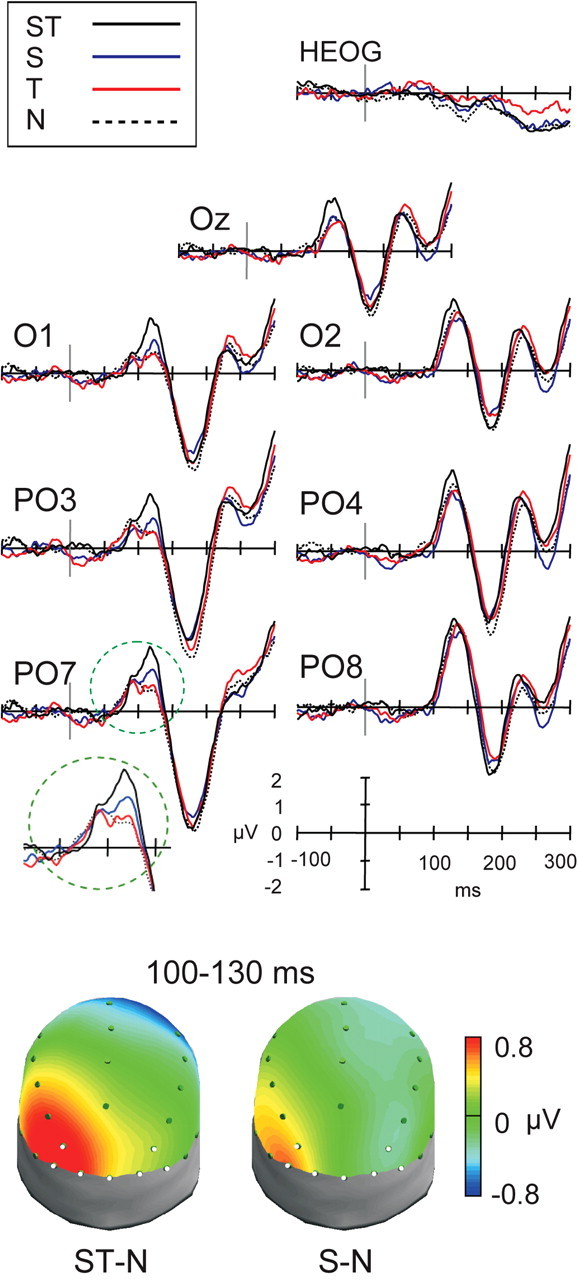
Enhanced attentional modulation of visual components by combined spatial and temporal expectations. Visual components P1 and N1 from grand-averaged waveforms (n = 24 subjects) are shown for the lateral posterior electrodes analyzed as well as midline occipital electrode Oz for the four attentional conditions: combined spatial and temporal expectations (black line), spatial expectation alone (blue line), temporal expectation alone (red line), and no expectation (dashed line). The grand-averaged waveform for the horizontal eye channel is also shown. The polarity of the waveforms is plotted with positive values upward in this and the following figure. The P1 component, showing a main effect of spatial expectation and an interaction between spatial and temporal expectation is highlighted at electrode PO7. The region of the P1 is enlarged in the inset directly below electrode PO7 to show its enhancement by spatial expectation relative to no expectation and its further enhancement by combined spatial and temporal expectations. The topographies of the attentional modulations on P1 (110–130 ms) are shown in the bottom panel (using data referenced to the average of the mastoids), plotted using Advanced Source Analysis software (Advanced Neuro Technology, Enschede, The Netherlands). Topographies are shown on a realistic three-dimensional head model from a posterior and superior perspective, with the left side of the head shown on the left. The voltage values for each expectation condition minus the no-expectation condition (ST-N, S-N) are plotted at each electrode location and interpolated at intermediate sites. Positive voltage is plotted in red, and negative voltage is plotted in blue. The same voltage values are used in both cases to enable comparison of the magnitude of the effects. Contralateral P1 amplitudes were enhanced by spatial expectation and further enhanced by combined spatial and temporal expectation. No modulation by temporal expectation occurred during this time period. The locations of the electrodes from which waveforms are shown are shaded white on the topographies. HEOG, Horizontal electrooculogram.
The mean amplitude of the P1 component in the “go” trials showed a significant negative correlation with reaction-time measures. Larger P1 components were systematically associated with shorter response times, with correlations being stronger for the left-hemisphere, contralateral posterior electrodes (r = –0.35, p = 0.001) than for ipsilateral electrodes (-0.25, p < 0.05).
Like the P1, the N1 reflects summation of activity in multiple visual areas (Di Russo et al., 2002). The precise function or stage of processing reflected in this component has been difficult to pin down, and indeed it is possible that multiple types of functional activity can contribute during this time period (Miniussi et al., 2002). Specific proposals include spatial orienting toward a relevant stimulus (Luck et al., 1990; Nobre et al., 2000), discrimination processes within an attended location (Vogel and Luck, 2000), and automatic recognition related to sensory traces (Doniger et al., 2001). In the present task, the N1 component peaked at 180 ms and was maximal at the PO7 electrode. Inspection of the waveforms did not reveal sizeable modulation of this component by spatial or temporal expectation. Spatial expectation resulted in a focal diminution of the N1 component over the more medial posterior electrodes (PO3/4 and O1/2) (spatial × electrode interaction, F(1.4,32.1) = 9.7; p < 0.05). Temporal expectation also diminished N1 amplitude, but unexpectedly the effect interacted with response variables (temporal × electrode interaction, F(1.7,39.2) = 5.2, p < 0.05; temporal × response interaction, F(1,23) = 9.9, p < 0.05; temporal × response × electrode interaction, F(1.4,31.2) = 4.9, p < 0.05; temporal × response × electrode × side interaction, F(1.6,36.8) = 3.9, p < 0.05). There were no significant interactions between spatial and temporal expectation in modulating N1 amplitude. The N1 component did not correlate significantly with reaction times.
Later components N2 and P3
Attention has also been shown to affect the later N2 and P3 components (Donchin and Coles, 1988; Luck and Hillyard, 1994; Wijers et al., 1996), which are more pronounced over central electrodes. Figure 3 shows the grand-averaged waveforms at these sites, combined for midline and flanking lateral electrodes, for go and no-go trials in the presence and absence of temporal and spatial expectation.
Figure 3.
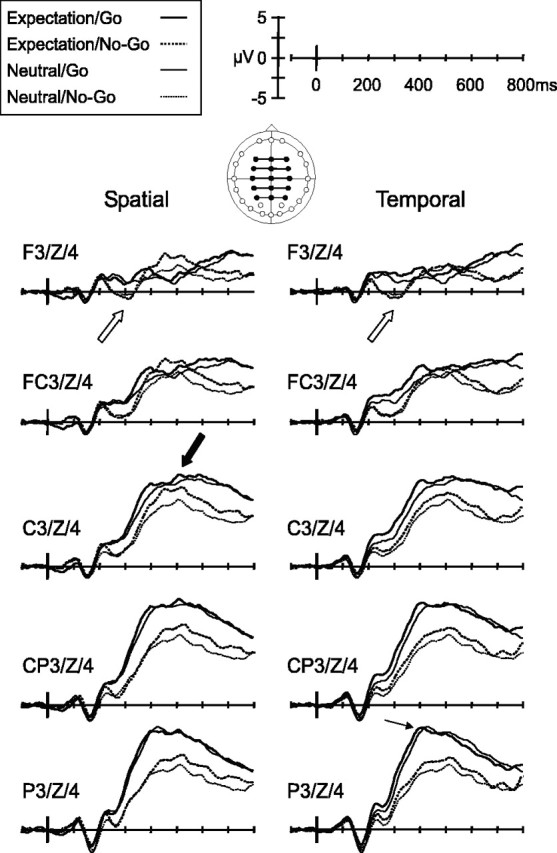
Distinct ERP modulations by spatial versus temporal expectation alone. Grand-averaged waveforms (n = 24 subjects) combined for midline and flanking electrodes over frontal to parietal sites for go (solid line) and no-go (dashed line) trials in the presence (thick line) and absence (thin line) of spatial expectations (left column) and temporal expectations (right column). ERPs for midline and flanking electrodes were averaged together, as indicated by the line joining them in the diagram of the electrode montage. Open arrows point to the main effect of response requirement (go versus no-go trials) on the frontal N2 component. The thick filled arrow points to the main effect of spatial expectation on the amplitude of the P3 component. The thin arrow points to the shortening of the peak latency of the P3 component in go trials.
Negative potentials (classed as N2) were observed between 220 and 330 ms, primarily over frontal, central, and parietal regions, peaking at ∼300 ms in the frontal regions compared with 270 ms in more central and parietal areas. Spatial expectation did not influence the N2 component. In contrast, response requirements and temporal expectation both influenced the N2 component, and these two factors also interacted. No-go trials elicited significantly larger N2 components (main effect of response, F(1,23) = 22.5; p < 0.001), especially over midline frontal and frontal-central electrodes (response × side interaction, F(1.8,41.8) = 22.2, p < 0.001; response × electrode × side interaction, F(3.8,87.0) = 6.9, p < 0.001) (Fig. 3, open arrow). The N2 component was attenuated by temporal expectation (main effect of temporal, F(1,23) = 4.2; p = 0.05), especially over central to parietal midline electrodes (temporal × electrode interaction, F(1.4,31.6) = 7.0, p < 0.05; temporal × electrode × side interaction, F(4.9,112.4) = 2.8, p < 0.05). Temporal expectation interacted with response requirements in modulating the N2 component (temporal × response interaction, F(1,23) = 5.6; p < 0.05). Follow-up subsidiary analyses compared the N2 component elicited in T versus N conditions, for go and no-go trials separately. The N2 component was attenuated by temporal expectation more in go trials than in no-go trials (main effect of temporal expectation in go trials, F(1,23) = 6.9, p < 0.05; main effect of temporal expectation in no-go trials, F(1,23) = 0.5; p = NS). There were no interactions between spatial and temporal expectation in modulating N2 amplitude. The mean amplitude of the N2 component did not correlate significantly with reaction times.
Analysis of P3 amplitude showed strong effects of response requirements and spatial expectation, which did not interact. The P3 component was significantly larger in go than no-go trials (F(1,23) = 13.9; p = 0.001). This effect was graded over the scalp, being maximal over midline parietal electrodes and diminishing gradually until it reversed over midline frontal electrodes (response × electrode interaction, F(1.4,32.1) = 104.1, p < 0.001; response × side interaction, F(1.7,39.0) = 3.8, p < 0.05; response × electrode × side interaction, F(4.0,92.0) = 17.7, p < 0.001). Spatial expectation also led to larger P3 components overall (F(1,23) = 6.4; p < 0.05) (Fig. 3, filled arrow). The effect tended to be larger over midline electrodes and over central and frontal-central electrodes overall (spatial × electrode interaction, F(1.1,26.3) = 3.6, p = 0.06; spatial × electrode × side interaction, F(3.9,90.6) = 2.5, p = 0.05). Temporal expectation interacted with response requirements to modulate P3 amplitude over selected electrodes (temporal × response × electrode interaction, F(1.2,28.6) = 4.6; p < 0.05). Subsidiary analyses comparing P3 amplitude for T versus N conditions separately for go and no-go trials showed the effect to be restricted to go trials and to be larger over frontal electrodes (temporal × electrode interaction in go trials, F(1.3,29.9) = 6.6, p < 0.05; no significant main effects or interactions with temporal expectation in no-go analysis; F values <2.3). Spatial and temporal expectation did not interact in the modulation of P3 amplitude.
Analysis of P3 latency showed no modulation involving spatial expectation. In contrast, a significant effect of temporal expectation was observed, which interacted with response requirements. The P3 component peaked significantly earlier when temporal expectation was present in go trials (main effect of temporal expectation, F(1,23) = 4.7, p < 0.05; interaction temporal × response, F(1,23) = 23.2, p < 0.001) (Fig. 3, thin arrow). Subsidiary comparisons of P3 latency in T versus N conditions in go and no-go trials separately showed the effect of temporal expectation to be significant in go trials only (effect of temporal expectation in go trials, F(1,23) = 12.48, p < 0.05; no significant main effect or interaction with temporal expectation in no-go trials, F values <1.5). There were no significant interactions between spatial and temporal expectations in modulating P3 latency.
Both mean amplitude and peak latency of the P3 component were significantly correlated with behavioral performance. Mean amplitude of the P3, combined over the electrodes analyzed, showed a significant negative correlation with reaction times (r = –0.27; p < 0.01). Large P3 amplitudes were systematically related to short response times. In a complementary way, latency of the P3 at the midline parietal electrode PZ, in which its amplitude is maximal, showed a positive correlation with reaction times (r = +0.32; p = 0.001). Short P3 latencies were systematically associated with short response times.
Discussion
Our task was designed to investigate how spatial and temporal information extracted from the trajectory and speed of motion can be used to deploy attentional resources to the expected emergence of a transiently occluded target. Behavioral measures showed that both spatial and temporal orienting improved performance. Predictably, spatial orienting conferred greater accuracy to the difficult peripheral discriminations, whereas temporal expectation alone did not. Both spatial and temporal expectations significantly enhanced response speed, with additive effects. The behavioral enhancements by spatial and temporal expectation in the present task provide important validation of the effects of voluntary spatial and temporal orienting in a more naturalistic setting. It is also noteworthy that the effects of spatial expectation in the current task indicated that it is possible to orient spatial attention readily within a hemi-field as well as between hemi-fields, which is more usually investigated.
Analysis of ERP data, reflecting neural processing of the target after its reappearance, showed that spatial and temporal expectation acting alone optimized the neural processing of target stimuli through distinct mechanisms. However, when both expectations were present together, they cooperated to enhance further the perceptual analysis of relevant stimuli.
Synergistic modulation of early visual processing
Replicating many previous studies (for review, see Mangun, 1995; Eimer, 1998; Hillyard et al., 1998), spatial expectation alone increased the amplitude of the early visually evoked P1 potential. The effect was lateralized to the left occipital region, contralaterally to the target, which always appeared in the right visual field. P1 amplitude enhancement is thought to represent facilitation of processing through relative gain-control mechanisms (Eason, 1981; Hillyard and Mangun, 1987). However, unlike in most previous studies, the P1 modulation was obtained when spatial attention was oriented to different locations along the vertical dimension at the same lateral eccentricity. Therefore, the P1 effect does not require spatial selection between hemi-fields but can result from top-down biasing of processing within one visual field.
As expected from previous visual temporal orienting studies (Miniussi et al., 1999; Griffin et al., 2002), temporal expectation alone had no effect on early stages of target analysis. Strikingly, however, the combination of spatial and temporal expectations led to significantly greater enhancement of the early P1 visual component than spatial expectation alone (Fig. 2). This demonstrates that temporal information can access perceptual analysis through top-down pathways when spatial information is also present. It will be interesting to investigate in future studies whether temporal information can also interact with nonspatial features to enhance perceptual analysis.
The synergism between spatial and temporal expectation in enhancing this stage of perceptual analysis did not translate into a significant behavioral synergism as measured with an ANOVA. However, the behavioral effects of temporal and spatial expectation were additive, and P1 amplitude correlated significantly with reaction times. Given the multiple potential bottlenecks in translating perception into action, it was not surprising that correspondence between P1 effects and motor responses was imperfect.
Our ERP findings complement the observations from single-unit studies that the magnitude of modulation of activity in V4 neurons by spatial attention is correlated to the temporal hazard function for the appearance of relevant events (Ghose and Maunsell, 2002). The hazard function plots the conditional probability that a relevant stimulus will appear given that it has not yet occurred. In our occlusion task, the temporal hazard function is sharpened in the temporal orienting conditions, in which there is 100% probability that the target event will occur at the predicted time.
Together, these findings clearly show that the temporal predictability of events can be a critical factor in determining the relative efficacy of neural processing, even during perceptual stages of stimulus analysis. Furthermore, they show that the spatial and temporal dimensions, which ubiquitously frame perception and action, can interact from early stages of perceptual analysis to optimize behavior. In addition, they suggest that temporal parameters used in tasks could significantly influence the timing of the effects measured and therefore urge for greater consideration for temporal orienting factors when designing and interpreting cognitive experiments in general and attention-related experiments specifically (Griffin and Nobre, 2005).
Specific effects of spatial expectation
The later N1 component is also typically enhanced by spatial orienting in tasks using predictive or instructive cues (Mangun, 1995; Eimer, 1998), but this did not occur in the present occlusion task. Instead, N1 amplitude was diminished at some posterior electrodes. One explanation may be that spatial attention was limited to one eccentricity within one visual field. If the effect is validated by future studies in which spatial attention can also be directed between visual fields, it may suggest that the N1 component is modulated differently when spatial expectation is generated implicitly by object movement versus explicitly by an informative cue or task instruction.
Effects of spatial orienting after the visual components did not interact with response-related variables. Spatial orienting did not modulate the N2 component, which was highly sensitive to response requirements. Instead, spatial orienting significantly increased the amplitude of the late-positive P3 component. The P3 component was sensitive to response requirements, and indeed its amplitude correlated with reaction times. However, the effect of spatial expectation did not interact with response requirements. Modulation of P3 amplitude has been attributed previously to a number of different processes, such as preparation for a motor response, processing of novel or improbable events, or closure of cognitive processes (Polich, 2003). Considering that our task did not include novel or improbable events and that spatial attention enhanced P3 amplitude whether or not the subject responded, it seems likely that spatial attention may affect the closure of cognitive processes.
Specific effects of temporal expectation
Temporal expectation alone modulated stimulus analysis only after the P1 period. In contrast to the effects of spatial expectation, the effects of temporal expectation consistently interacted with the response requirements (go versus no-go) of the stimulus. The first interaction between temporal expectation and response variables occurred surprisingly early (during the N1 period). Previous temporal attention experiments, in which it was not possible to assess the contributions of response variables, have exhibited diverse effects on the N1 component (Miniussi et al., 1999; Griffin et al., 2002). Additional experiments will be required before a consistent view on N1 modulation by temporal orienting emerges. The interaction with response variables in the present task suggests that postvisual processing may also contribute to the N1 component and to its modulation in temporal orienting tasks. Possible candidates are activity in parietal cortex sensitive to time perception (Leon and Shadlen, 2003), hazard functions (Janssen and Shadlen, 2005), and/or motor selection (Rushworth et al., 2003).
Consistent with previous experiments, the N2 component over frontal scalp regions reflected response inhibition (Kok, 1986; Jodo and Kayama, 1992) and was significantly enhanced in no-go trials. Temporal expectation attenuated the mean amplitude during the N2 time period over more posterior central and parietal scalp regions. The effect replicated that previously observed in cued temporal orienting tasks (Griffin et al., 2002). In the present task, it was possible to observe that the effect was carried by go trials. The effects of temporal orienting during the N2 time period may have reflected activity in a number of neural generators, including those related to response inhibition (Kok, 1986; Jodo and Kayama, 1992), temporal certainty about target appearance (Loveless, 1986), and decision making and response execution. The different distribution of the N2 effects by temporal expectation in the present task (central parietal) compared with previously described ERP effects of response inhibition (frontal central) or temporal certainty (frontal central) suggest the contribution of different or additional factors. In addition, the posterior N2 effect in the present task had the same distribution and went in the same direction as the modulation of the successive P3 component, which, therefore, may also have contributed during the N2 time period.
As in previous studies (Miniussi et al., 1999; Griffin et al., 2002), temporal expectation caused the late-positive P3 component to rise and peak earlier for targets that occurred at the temporally anticipated moment. The early rise of the P3 component may have contributed to the attenuation of the negative activity during the N2 component described above. In previous temporal orienting studies, latency modulation of the P3 was speculated to reflect sharpening of processes related to decision making or response execution. However, it had not been possible to test this conjecture because response parameters were not manipulated directly. In the present task, it was possible to verify that the latency modulation of the P3 component was indeed limited to trials requiring responses and was significantly correlated with response times. Therefore, the long-lasting positive shift indicated by the reduction in the N2 peak, followed by the early latency of the P3, is clearly connected to response-related processing. This agrees with functional magnetic resonance imaging studies, which have revealed that temporal orienting selectively activates brain areas implicated in motor preparation and selection processes (Coull and Nobre, 1998; Coull et al., 2000). Overall, this indicates that motor-related activity is readily accessible to modulation by top-down temporal expectations even in the absence of any additional perceptual factors.
Footnotes
This study was supported by an award from the James S. McDonnell Foundation (A.C.N.) and a studentship from the Wellcome Trust (J.R.D.). We thank Steven Young for programming the task.
Correspondence should be addressed to Anna Christina Nobre, Department of Experimental Psychology, University of Oxford, South Parks Road, Oxford OX1 3UD, UK. E-mail: kia.nobre@psy.ox.ac.uk.
DOI:10.1523/JNEUROSCI.1821-05.2005
Copyright © 2005 Society for Neuroscience 0270-6474/05/258259-08$15.00/0
References
- American Electroencephalographic Society (1991) American Electroencephalographic Society guidelines for standard electrode position nomenclature. J Clin Neurophysiol 8: 200–202. [PubMed] [Google Scholar]
- Assad JA, Maunsell JH (1995) Neuronal correlates of inferred motion in primate posterior parietal cortex. Nature 373: 518–521. [DOI] [PubMed] [Google Scholar]
- Coull JT, Nobre AC (1998) Where and when to pay attention: the neural systems for directing attention to spatial locations and to time intervals as revealed by both PET and fMRI. J Neurosci 18: 7426–7435. [DOI] [PMC free article] [PubMed] [Google Scholar]
- Coull JT, Frith CD, Buchel C, Nobre AC (2000) Orienting attention in time: behavioural and neuroanatomical distinction between exogenous and endogenous shifts. Neuropsychologia 38: 808–819. [DOI] [PubMed] [Google Scholar]
- Di Russo F, Martinez A, Sereno MI, Pitzalis S, Hillyard SA (2002) Cortical sources of the early components of the visual evoked potential. Hum Brain Mapp 15: 95–111. [DOI] [PMC free article] [PubMed] [Google Scholar]
- Donchin E, Coles MG (1988) Is the P300 component a manifestation of contex updating. Behav Brain Sci 11: 357–427. [Google Scholar]
- Doniger GM, Foxe JJ, Schroeder CE, Murray MM, Higgins BA, Javitt DC (2001) Visual perceptual learning in human object recognition areas: a repetition priming study using high-density electrical mapping. NeuroImage 13: 305–313. [DOI] [PubMed] [Google Scholar]
- Duncan J (1984) Selective attention and the organization of visual information. J Exp Psychol Gen 113: 501–517. [DOI] [PubMed] [Google Scholar]
- Eason R (1981) Visual evoked potential correlates of early neural filtering during selective attention. Bull Psychonom Soc 18: 203–206. [Google Scholar]
- Eason R, Harter M, White C (1969) Effects of attention and arousal on visually evoked cortical potentials and reaction time in man. Physiol Behav 4: 283–289. [Google Scholar]
- Eimer M (1998) Mechanisms of visuospatial attention: evidence from event-related brain potentials. Vis Cogn 5: 257–286. [Google Scholar]
- Foxe JJ, Doniger GM, Javitt DC (2001) Early visual processing deficits in schizophrenia: impaired P1 generation revealed by high-density electrical mapping. NeuroReport 12: 3815–3820. [DOI] [PubMed] [Google Scholar]
- Foxe JJ, Murray MM, Javitt DC (2005) Filling-in in schizophrenia: a high-density electrical mapping and source-analysis investigation of illusory contour processing. Cereb Cortex, in press. [DOI] [PubMed]
- Ghose G, Maunsell M (2002) Attentional modulation in visual cortex depends on task timing. Nature 419: 616–620. [DOI] [PubMed] [Google Scholar]
- Griffin IC, Nobre AC (2005) Temporal orienting of attention. In: Neurobiology of attention (Itti L, Rees G, Tsotsos J, eds), pp 257–263. San Diego: Elsevier.
- Griffin IC, Miniussi C, Nobre AC (2001) Orienting attention in time. Front Biosci 6: D660–D671. [DOI] [PubMed] [Google Scholar]
- Griffin IC, Miniussi C, Nobre AC (2002) Multiple mechanisms of selective attention: differential modulation of stimulus processing by attention to space or time. Neuropsychologia 40: 2325–2340. [DOI] [PubMed] [Google Scholar]
- Guthrie D, Buchwald JS (1991) Significance testing of difference potentials. Psychophysiology 28: 240–244. [DOI] [PubMed] [Google Scholar]
- Harter MR, Aine C, Schroeder C (1982) Hemispheric differences in the neural processing of stimulus location and type: effects of selective attention on visual evoked potentials. Neuropsychologia 20: 421–438. [DOI] [PubMed] [Google Scholar]
- Heilman KM, Watson RT (1977) Mechanisms underlying the unilateral neglect syndrome. Adv Neurol 18: 93–106. [PubMed] [Google Scholar]
- Hillyard SA, Mangun GR (1987) Sensory gating as a physiological mechanism for visual selective attention. Electroencephalogr Clin Neurophysiol Suppl 40: 61–67. [PubMed] [Google Scholar]
- Hillyard SA, Hink RF, Schwent VL, Picton TW (1973) Electrical signs of selective attention in the human brain. Science 182: 177–180. [DOI] [PubMed] [Google Scholar]
- Hillyard SA, Vogel EK, Luck SJ (1998) Sensory gain control (amplification) as a mechanism of selective attention: electrophysiological and neuroimaging evidence. Philos Trans R Soc Lond B Biol Sci 353: 1257–1270. [DOI] [PMC free article] [PubMed] [Google Scholar]
- Janssen P, Shadlen MN (2005) A representation of the hazard rate of elapsed time in macaque area LIP. Nat Neurosci 8: 234–241. [DOI] [PubMed] [Google Scholar]
- Jennings JR, Wood CC (1976) The epsilon-adjustment procedure for repeated-measures analyses of variance. Psychophysiology 13: 277–278. [DOI] [PubMed] [Google Scholar]
- Jodo E, Kayama Y (1992) Relation of a negative ERP component to response inhibition in a Go/No-go task. Electroencephalogr Clin Neurophysiol 82: 477–482. [DOI] [PubMed] [Google Scholar]
- Kastner S, Ungerleider LG (2000) Mechanisms of visual attention in the human cortex. Annu Rev Neurosci 23: 315–341. [DOI] [PubMed] [Google Scholar]
- Kok A (1986) Effects of degradation of visual stimulation on components of the event-related potential (ERP) in go/nogo reaction tasks. Biol Psychol 23: 21–38. [DOI] [PubMed] [Google Scholar]
- Leon MI, Shadlen MN (2003) Representation of time by neurons in the posterior parietal cortex of the macaque. Neuron 38: 317–327. [DOI] [PubMed] [Google Scholar]
- Loveless NE (1986) Potentials evoked by temporal deviance. Biol Psychol 22: 149–167. [DOI] [PubMed] [Google Scholar]
- Luck SJ, Hillyard SA (1994) Electrophysiological correlates of feature analysis during visual search. Psychophysiology 31: 291–308. [DOI] [PubMed] [Google Scholar]
- Luck SJ, Heinze HJ, Mangun GR, Hillyard SA (1990) Visual event-related potentials index focused attention within bilateral stimulus arrays. II. Functional dissociation of P1 and N1 components. Electroencephalogr Clin Neurophysiol 75: 528–542. [DOI] [PubMed] [Google Scholar]
- Mangun GR (1995) Neural mechanisms of visual selective attention. Psychophysiology 32: 4–18. [DOI] [PubMed] [Google Scholar]
- Mesulam MM (1981) A cortical network for directed attention and unilateral neglect. Ann Neurol 10: 309–325. [DOI] [PubMed] [Google Scholar]
- Michotte A, Thines G, Crabbe G (1964) Amodal completion and perceptual organization (Tr.). Louvein: Studia Psychologica.
- Miniussi C, Wilding EL, Coull JT, Nobre AC (1999) Orienting attention in time. Modulation of brain potentials. Brain 122: 1507–1518. [DOI] [PubMed] [Google Scholar]
- Miniussi C, Rao A, Nobre AC (2002) Watching where you look: modulation of visual processing of foveal stimuli by spatial attention. Neuropsychologia 40: 2448–2460. [DOI] [PubMed] [Google Scholar]
- Murray MM, Wylie GR, Higgins BA, Javitt DC, Schroeder CE, Foxe JJ (2002) The spatiotemporal dynamics of illusory contour processing: combined high-density electrical mapping, source analysis, and functional magnetic resonance imaging. J Neurosci 22: 5055–5073. [DOI] [PMC free article] [PubMed] [Google Scholar]
- Nobre AC (2004) Probing the flexibility of attentional orienting in the human brain. In: Cognitive neuroscience of attention (Posner M, ed), pp 157–179. New York: Guilford.
- Nobre AC, Sebestyen GN, Miniussi C (2000) The dynamics of shifting visuospatial attention revealed by event-related potentials. Neuropsychologia 38: 964–974. [DOI] [PubMed] [Google Scholar]
- Oldfield RC (1971) The assessment and analysis of handedness: the Edinburgh inventory. Neuropsychologia 9: 97–113. [DOI] [PubMed] [Google Scholar]
- Polich J (2003) Overview of P3a and P3b. In: Detection of change: event-related potential and fMRI findings (Polich J, ed), pp 83–98. New York: Kluwer Academic.
- Posner MI (1980) Orienting of attention. Q J Exp Psychol 32: 3–25. [DOI] [PubMed] [Google Scholar]
- Rushworth MF, Johansen-Berg H, Gobel SM, Devlin JT (2003) The left parietal and premotor cortices: motor attention and selection. NeuroImage 20 [Suppl 1]: S89–S100. [DOI] [PubMed] [Google Scholar]
- Simpson GV, Foxe JJ, Vaughan Jr HG, Mehta AD, Schroeder CE (1995) Integration of electrophysiological source analyses, MRI and animal models in the study of visual processing and attention. Electroencephalogr Clin Neurophysiol Suppl 44: 76–92. [PubMed] [Google Scholar]
- Van Voorhis S, Hillyard SA (1977) Visual evoked potentials and selective attention to points in space. Percept Psychophys 22: 54–62. [Google Scholar]
- Vogel EK, Luck SJ (2000) The visual N1 component as an index of a discrimination process. Psychophysiology 37: 190–203. [PubMed] [Google Scholar]
- Wertheimer M (1961) Experimental studies on the seeing of motion. In: Classics in psychology (Shipley T, ed), pp 1032–1089. New York: Philosophical Library.
- Wijers AA, Mulder G, Gunter TC, Smid HGOM (1996) Brain potential analysis of selective attention. In: Handbook of perception and action (Neumann O, Sanders AF, eds), pp 333–387. Tullamore, Ireland: Academic.