

Abstract
The correlation between functional and structural neuronal plasticity is by now well documented. However, the molecular mechanisms translating patterns of neuronal activity into specific changes in the structure of neurons remain unclear. Neurotrophins can be released in an activity-dependent manner, and they are capable of controlling both neuronal morphology and functional synaptic changes. They are thus attractive molecules to be studied in the context of synaptic plasticity. In the CNS, most of the work so far has focused on the role of BDNF and of its tyrosine kinase B receptor (TrkB), but relatively little is known about the function of the pan-neurotrophin receptor p75NTR. In this study, we show in loss-of-function experiments that postnatal hippocampal pyramidal cells in two mutant lines of p75NTR have a higher spine density and greater dendritic complexity than wild-type (WT) mice. Conversely, in a gain-of-function approach, p75NTR overexpression in WT neurons significantly reduces dendritic complexity, as well as spine density in all dendritic compartments. These results show that p75NTR negatively modulates dendritic morphology in adult hippocampal pyramidal neurons and documents a new case of functional antagonism between Trk and p75NTR signaling.
Keywords: dendritic morphology, neurotrophin receptors, spine density, hippocampus, pyramidal neurons, p75 neurotrophin receptor
Introduction
A striking feature of mammalian neurons is the complexity of their dendritic tree, on which they receive, process, and integrate inputs from their presynaptic partners. Dendrites of many neurons are decorated with spines, which are small and specialized compartments representing the postsynaptic sites of excitatory synapses. The shape and extent of the dendritic arbor of a neuron undergo significant alterations during development, and they are profoundly influenced by neuronal activity (Bliss and Collingridge, 1993; Dunaevsky et al., 1999; Malenka and Nicoll, 1999). In addition, changes in synaptic strength have been correlated with the remodeling of spines (Engert and Bonhoeffer, 1999; Maletic-Savatic et al., 1999; Toni et al., 1999) (for review, see Yuste and Bonhoeffer, 2004).
Among attractive molecular candidates as modulators of neuronal morphology are the neurotrophins and their receptors. Neurotrophins constitute a family of molecules, which includes nerve growth factor, brain-derived neurotrophic factor (BDNF), neurotrophin-3, and neurotrophin-4. They are secretory proteins that are released from neurons in an activity-dependent manner. Two types of receptors mediate neurotrophin action: tyrosine kinase A (TrkA), TrkB, and TrkC, (Patapoutin and Reichardt, 2001) and a pan-neurotrophin receptor p75 (p75NTR) that belongs to the tumor necrosis factor receptor (TNFR) family (Dechant and Barde, 2002). This dual-receptor system accounts for the diverse, often antagonistic, effects exerted by neurotrophins. The well known trophic functions of neurotrophins, including, for example, the prevention of programmed cell death during development (Levi Montalcini and Booker, 1960; Snider, 1988; Ernfors et al., 1995), are mediated by Trk receptors. Conversely, the binding of neurotrophins to p75NTR can cause cell death in the nervous system (e.g., the septal nucleus, the spinal cord, and the retina) (Frade et al., 1996) (for review, see Friedman, 2000). Neurotrophins also exert antagonistic effects during activity-dependent synaptic plasticity processes. For example, BDNF and its receptor TrkB play a crucial role in the induction and maintenance of hippocampal long-term potentiation (LTP) (for review, see Poo, 2001). In contrast, deletion of p75NTR leads to a significant impairment in long-term depression (Rösch et al., 2005; Woo et al., 2005), without affecting LTP.
With regard to structural plasticity, neurotrophins control neuronal morphology by promoting both dendritic (for review, see McAllister et al., 1999) and axonal elongation and arborization (Cohen-Cory and Fraser, 1995). These effects are thought to be mediated by activation of Trk receptors. In contrast, p75NTR is thought to block process elongation by virtue of its ability to activate a Rho GTPase (Yamashita et al., 1999). It has also been shown to mediate axonal growth inhibition by myelin-derived neurite growth inhibitors (Wang et al., 2002). In the developing cerebral cortex, there is striking evidence that neurotrophins play an important role in regulating dendrite growth and branching in developing cortical neurons in a layer-specific and activity-dependent manner (McAllister et al., 1999). Also, BDNF exogenous application modulates the number and shape of dendritic spines in mature hippocampal pyramidal neurons (Tyler and Pozzo-Miller, 2001).
To further explore the mechanisms controlling neuronal morphology, we analyzed whether p75NTR is involved in modulating the dendritic structure of mature neurons.
Materials and Methods
Preparation of hippocampal slice cultures. Hippocampal organotypic cultures were prepared from postnatal day 5 (P5) to P6 C57BL/6 wild-type (WT), p75NTRexonIV (p75NTRIV), or p75NTRexonIII (p75NTRIII) knock-out (KO) mice following the method of Stoppini et al. (1991). Briefly, the hippocampus was dissected in ice-cold sterile Gey's balanced salt solution, containing 0.5 ml of kynurenic acid (100 mm stock solution) and 0.5 ml of glucose (50% stock solution) and adjusted to pH 7.2. Hippocampi were then sliced transversely at a thickness of 400 μm on a tissue chopper (McIllwain, Wood Dale, IL). The slices were plated onto Millicell CM membrane inserts (Millipore, Bedford, MA) and cultivated in a 37°C, 7% CO2, 99% humidity incubator. The slices were maintained in a medium containing 50% DMEM with HBSS without glutamine, 25% HBSS, 1 ml of glucose (50%), 25% Donor Equine Serum (HyClone, Logan, UT), and 0.5 ml of l-glutamine (200 mm stock solution) with medium changes every third day. To reduce the number of non-neuronal cells, the slices were treated for 24 h with a mixture of antimitotic drugs (cytosine arabinoside, uridine, and fluorodeoxyuridine, 10-6 to 10-7 m each; Sigma, Munich, Germany).
Plasmids and reagents. To visualize pyramidal cells within organotypic cultures, we transfected individual neurons with green fluorescent protein (GFP; GFP-N1; Clontech, Mountain View, CA) under a cytomegalovirus (CMV) promoter. To analyze spine morphology, we expressed a farnesylated form of GFP, targeted specifically to the membrane, driven by the CMV promoter (Clontech). The mouse full-length p75NTR cDNA plasmid (GenBank accession number BC038365) was subcloned into the pSP70 vector.
Particle-mediated gene transfer. Hippocampal slice cultures were transfected using the particle-mediated gene-transfer device Helios Gene Gun System (Bio-Rad, Hercules, CA) after 15 d in vitro (DIV). Plasmids were purified on a Qiagen (Valencia, CA) column and precipitated onto 0.6 μm gold microcarrier particles according to the instruction manual for the Helios Gene Gun (Bio-Rad). For cotransfection, the DNA loading ratio was 3:1 (p75NTR to GFP) for a total of 2 μg/mg gold. For control experiments with GFP, the plasmid total amount was also 2 μg/mg gold. The gold beads coated with expression plasmids were then propelled from plastic tubing bullets onto the slices with a rapid helium burst of 50 psi. The gold beads exited the gene gun at ∼1 cm above the slices and passed through a filter with a pore size of 3 μm to prevent big clusters of beads from reaching the slices. Between 2 and 4 d after transfection, slices were fixed and used for immunohistochemistry.
Immunohistochemistry. Immunohistochemistry using antibodies to p75NTR was performed routinely on all slices to distinguish p75NTR overexpressing from control neurons expressing only GFP. Slices were briefly fixed with 4% paraformaldehyde and incubated for 1 h in a blocking solution containing 0.2% Triton X-100 and 10% normal goat serum in PBS. Slices were then incubated overnight at 4°C with primary antibody (anti-human p75 NTR; Promega, Madison, WI) diluted 1:500 in blocking solution and, finally, with the secondary antibody diluted 1:400 in PBS [cyanine 3 (Cy3)- or Cy5-conjugated anti-rabbit IgG; Jackson ImmunoResearch, West Grove, PA] for 4 h at room temperature. After washing, the slices were mounted using an aqueous mounting medium containing anti-fading agents (Biomeda, Foster City, CA). For the synapsin I staining, we used a lengthy protocol in which shot slices were fixed in 4% PFA overnight and incubated for 1 d in a blocking solution containing 0.4% Triton X-100, 1.5% normal horse serum, and 0.1% BSA in PBS. Slices were then incubated for 7-10 d at 4°C in the primary antibody (anti-human synapsin I; Chemicon, Temecula, CA) diluted 1:500 in the same blocking solution without BSA. The secondary antibody was diluted 1:400 in PBS, and the slices were incubated for 1-2 d at 4°C in the dark. After washing, the slices were mounted using an aqueous mounting medium containing anti-fading agents (Biomeda). Appropriate controls, lacking the primary antibodies, were performed for each antibody.
Neuron selection. The delivery of a single gold particle carrying GFP under the control of the CMV promoter resulted in the intense labeling of the entire dendritic arbor (see Fig. 2 A, B) as well as of all dendritic spines (see Fig. 3A) of individual pyramidal neurons. Only nonoverlapping labeled neurons were selected for our analysis to allow an unambiguous reconstruction of the entire dendritic tree. Reliable cotransfection was achieved by coating gold particles with a 3:1 mixture of DNAs encoding the p75NTR construct as well as GFP. Post hoc immunohistochemistry was used to confirm p75NTR overexpression. All analyzed neurons derived from cultures prepared from P5-P6 mice and cultivated for 14-18 DIV. Small numbers of individual pyramidal neurons were transfected in each culture, allowing to easily follow the complete dendritic processes of each labeled neuron. Anatomical criteria were used to identify a neuron as a dentate gyrus granule cell, CA1 pyramidal cell, CA3 pyramidal cell, or interneuron, respectively. Neurons selected for analysis were both CA1 and CA3 pyramidal cells, completely filled with GFP and not showing signs of degeneration.
Figure 2.
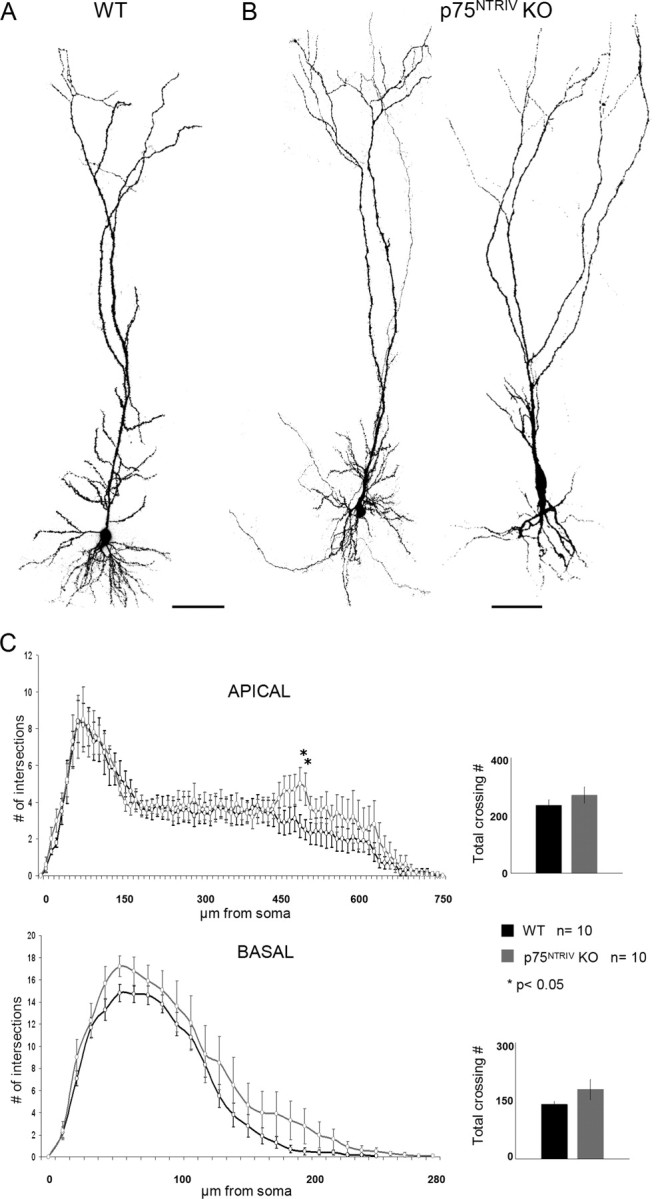
Dendrite morphology of GFP-expressing pyramidal neurons from WT and p75NTRIV knock-out animals. A, Confocal image, consisting of stacks of multiple optical sections showing the normal morphology of GFP-labeled hippocampal pyramidal neurons. Note the complete filling of dendrites as well as the absence of any sign of degeneration. Scale bar, 100 μm. B, Confocal images showing two representative examples of p75NTRIV KO-derived pyramidal neurons. Note the largely normal dendritic complexity and length. Scale bar, 100 μm. C, Sholl analysis comparing both apical and basal dendrite in WT and p75NTRIV KO pyramidal neurons. *p < 0.05.
Figure 3.
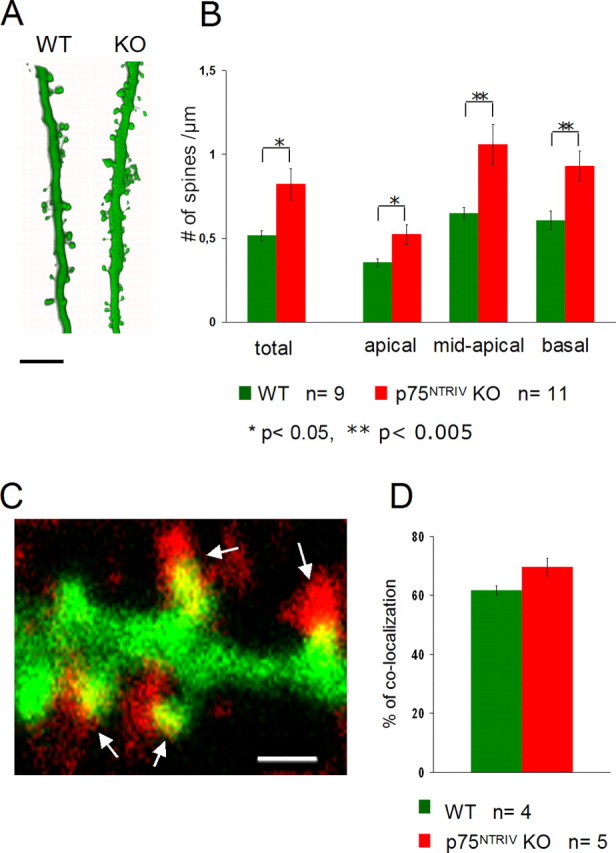
Spine density counts in GFP-expressing pyramidal neurons from WT and p75NTRIV knock-out animals. A, Two high-power confocal images of representative stacks of apical dendrites of WT and p75NTRIV KO neurons. Note the higher spine density in KO neurons versus WT. Scale bar, 3 μm. B, Histograms showing the spine density counts confirming the qualitative impression of a higher spine density in KO (red) versus WT (green) neurons. Both total spine density and the density in the different dendritic compartments are shown. Note the higher differences in spine density in the mid-apical and basal dendritic compartments than in the apical dendritic compartment. *p < 0.05; **p < 0.005. C, Left, Higher-magnification view of GFP-labeled spines with some synapsin I-positive presynaptic terminals (red; arrows). Scale bar, 1 μm. Right, Quantification of the proportion of dendritic spines colocalized with synapsin I-positive dots in WT and p75NTRIV KO dendrites. Error bars represent SEM.
Neuronal imaging and analysis. Neurons selected for analysis were imaged with either a Leica (Nussloch, Germany) TCS-NT or a Leica SP2 confocal microscope. Each neuron was first imaged using a 40× objective [numerical aperture (NA), 1.25] and z-sectioned at 0.5 μm increments. Single image stacks were then collapsed, imported in Photoshop (Adobe Systems, San Jose, CA) and mounted to obtain a two-dimensional reconstruction of the entire neuron subsequently used for Sholl analysis (Sholl, 1953) of dendritic length and complexity. The Sholl analysis was obtained using the Neurolucida software (MicroBrightField, Colchester, VT), which calculates the cumulative number of dendritic intersections at 10-μm-interval distance points from each neuron starting from the cell body. The analysis of the number of dendrite crossings was performed separately for basal and apical dendrites. We also calculated the total number of crossings for each cell as an index for total dendritic complexity. Spine density was measured separately for basal, mid-apical, and most-apical dendrites. The selected dendrite segments were imaged using a 63× objective (NA, 1.32) with a zoom of 2 and were z-sectioned at 0.3 μm increments. The number of spines and the dendritic length were counted on three-dimensional (3D) stacks using the measurement tool of the Imaris software (Bitplane, Zürich, Switzerland). Care was taken to ensure that each spine was counted only once by following its course through the adjacent z-sections. The number of spines was normalized per micrometer of dendritic length. Spine counts were performed blindly, without knowledge of the identity of the samples during the analysis. Both for dendritic complexity, as well as for spine density values, we did not find any significant difference between CA1 and CA3 pyramidal dendrites. Therefore, neurons from both areas were combined in our quantification.
Classification of spines. Dendritic spines were classified according to two main criteria (Harris et al., 1992; Koh et al., 2002). First, their length was measured from their base at the dendrite to the tip of their head (see Fig. 4 A, L). In addition, spine shape was defined by the ratio between the minimum (min) and the maximum (max) diameters of the spine, neck, and head, respectively, allowing us to classify them following standard categories (Peters and Kaisrman-Abramof, 1969) as stubby (type I), mushroom (type II) and thin (type III) (see Fig. 4 A). In particular, spines were analyzed one by one and were allocated to a specific category depending on the relationship between their length, their minimum diameter, and their maximum diameter We were thus able to distinguish three main spine subtypes: stubby, in which the length is <1 μm and the maxhead/minneck ratio is <1.5; thin, in which the maxhead/minneck ratio is <1.5 and the length ≥1 μm; and mushroom, in which the maxhead/minneck ratio is ≥1.5 (independent of their length). This method has the advantage that the category of the spines is determined by objective criteria. To measure spine length, max diameter, and min diameter, the images of dendrite stretches, from the most-apical, mid-apical, and basal compartments, were acquired using a Leica SP2 confocal microscope with a 63× objective (NA, 1.32) and a zoom of 8 and were z-sectioned at 0.3 μm increments. During the measurements, we did not consider any 3D information. Spine measurements were performed using the measurement tool in the Imaris software (Bitplane).
Figure 4.
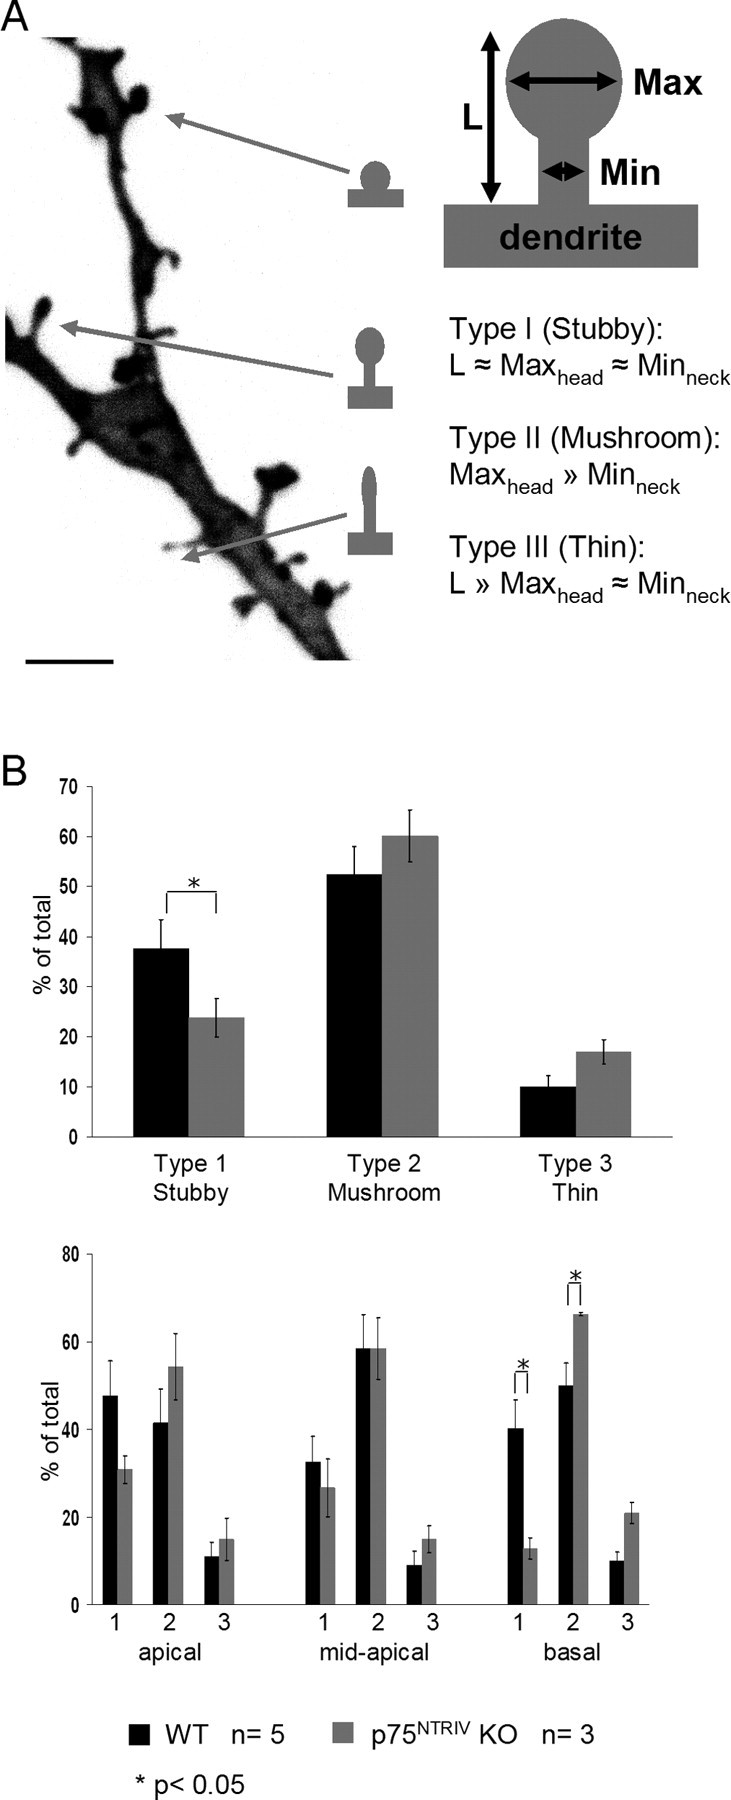
Classification of spine types in WT and p75NTRIV KO neurons. A, Representative image of a dendrite from a WT neuron showing the different type of dendritic spines. Scale bar, 2 μm. Spine types were classified in three categories, as shown on the right, based on the spine length (L) as well as the ratio between their maximum head (Maxhead) and minimum neck (Minneck) diameter: stubby (type I), mushroom (type II), and thin (type III). B, The top chart shows the proportions of the three spine types for WT (green) and p75NTRIV KO (red) neurons. The bottom chart shows these differences plotted for apical, mid-apical, and basal compartment separately. In the basal dendritic compartment of p75NTRIV KO neurons, the proportion of stubby spines is significantly reduced, but the proportion of mushroom spines is significantly higher than in WT neurons. *p < 0.05. Error bars represent SEM.
Quantification of synapsin I-positive dendritic spines. To assess whether the additional spines in p75NTR KO mice contained functional synapses, we performed immunolabeling for synapsin I in hippocampal slices, and we analyzed the proportion of dendritic spines colocalized to synapsin I-positive dots both in WT and p75NTRIV KO mice. GFP-labeled dendritic spines were considered colocalized when in close apposition to a synapsin I-positive dot in the same z-section or in one section above or below. Images of stretches of the most apical, mid-apical and basal dendritic tree were acquired using a Leica SP2 confocal microscope with a 63× (NA 1.32) objective using a zoom of 8 and z-sectioned at 0.3 μm increments. Spine measurements were performed blindly using the measurement tool in the Imaris software (Bitplane).
Statistical analysis. The statistical analysis was performed using Microsoft (Redmond, WA) Excel or Statistica. The data obtained were compared between two different experimental conditions using either a two-tailed Student's t test or, for n ≤ 5, a Mann-Whitney nonparametric test. Values of p < 0.05 were considered significant. The Sholl analysis data were tested applying a two-tailed Student's t test point by point. All data shown are presented as mean ± SEM.
Real-time PCR analysis. Quantitative real-time PCR was performed to determine relative gene expression levels of p75NTR in the developing hippocampus and cerebellum and in hippocampal slices. Total RNA was extracted (Chomczynski and Sacchi, 1987) and was converted into cDNA using Superscript II reverse transcriptase (Invitrogen, Carlsbad, CA). Primer Express software (Applied Biosystems, Foster City, CA) was used to design two independent p75NTR primer and probe combinations: probe set p75NTR-A, “p75 primer sense 1,” 5′-CCC CAC CAG AGG GAG AGA A; “p75 primer antisense (AS) 2,” 5′-GGC TAC TGT AGA GGT TGC CAT CA and “p75 probe #3” 5′-(FAM)-5′-ACT GCC TCA GCC CAA GCC CTC AA-3′-(TAMRA); probe set p75NTR-A, “p75 primer sense 13,” 5′-TGT GGG CCT TGT GGC TTA TAT; “p75 primer AS 14,” 5′-AGT TTC TCT CCC TCT GGT GGG; and “p75 probe 15,” 5′-(FAM)-5′-TTG CTT GCA GCT GTT CCA TCT CTT GAA AG-3′-(TAMRA). To normalize p75NTR expression GAPDH mRNA levels were determined with a described primer/probe set (Giulietti et al., 2001). All real-time PCRs were performed in triplicate using the 2× Thermo-start QPCR system (ABgene, Epsom, UK) and 0.5 μl of synthesized cDNA. Thermal cycling was performed on a GenAmp 5700 system (Applied Biosystems), and real-time PCR data were analyzed using GenAmp 5700 SDS and Excel software (Microsoft).
Riboprobe synthesis and in situ hybridization. Nucleotide positions 835-1270 of a p75NTR cDNA plasmid (GenBank accession number BC038365) were subcloned into the pSP70 vector. This allowed the generation of strand-specific p75NTR riboprobes labeled with digoxigenin (Holz et al., 1996). The probe corresponded to parts of the extracellular, transmembrane, and death domains of the p75NTR molecule without overlap with conserved TNFR domains.
In situ hybridization of slice cultures and tissue sections was performed as described previously (Holz et al., 1996). Tissue was fixed with 4% paraformaldehyde in phosphate buffer, acetylated, and permeabilized. After incubation in hybridization buffer [50% formamide, 5× SSC, and 2% blocking reagent (Roche Diagnostics, Indianapolis, IN)], tissue was hybridized with either the sense or antisense p75NTR riboprobe at 68°C for 16 h. After stringent washes in 0.2× SSC at 70°C, specifically bound riboprobes were detected by an alkaline phosphatase-conjugated anti-digoxigenin antibody (Roche Diagnostics) and a nitroblue tetrazolium/5-bromo-4-chloro-indolyl-phosphate color reaction. Before photomicroscopic analysis, the tissue was counterstained with 4′,6′-diamidino-2-phenylindole dihydrochloride.
Results
Expression levels of p75NTR in hippocampal organotypic cultures
We first determined the expression levels of p75NTR in the cultured mouse hippocampal slices and compared them with those found in vivo at the same age. We used a quantitative real-time PCR assay and found significant levels of p75NTR transcripts in the hippocampus of both P10 and P28 mice (Fig. 1A). As expected (Buck et al., 1988; Lu et al., 1989) p75NTR expression in the hippocampus was developmentally regulated (Fig. 1A). Likewise, significant levels of p75NTR were also detected in hippocampal slice cultures isolated at P5 and allowed to mature in vitro for an additional 5 or 23 d. Similar to our in vivo observations, p75NTR expression was found to be reduced after 2 additional weeks of in vitro maturation (Fig. 1A).
Figure 1.

Expression pattern of the p75NTR in the mouse hippocampus. A, Quantitative real-time PCR assays document the expression of p75NTR in the developing hippocampus (HIP) and cerebellum (CER) as well as in hippocampal slice cultures (HIP slice). CNS tissues were obtained from animals 10 or 28 d of age. The slices had a corresponding age and were isolated from a P5 mouse brain allowed to mature in vitro for an additional 5 or 23 d, respectively. Note that, in each case, p75NTR expression is developmentally downregulated. Gene expression data are shown as percentage relative p75NTR transcript levels normalized to GAPDH mRNA. The error bars indicate the SD of the mean of three measurements. A total of four independent real-time PCR experiments were performed (3 using probe set p75NTR-A and 1 with probe set p75NTR-B), all giving similar results. B, Micrographs showing in situ hybridization for p75NTR mRNA in the P21 mouse hippocampus. Note p75NTR gene expression in the dentate gyrus and in both the CA1 and CA3 region [4′,6′-diamidino-2-phenylindole dihydrochloride (DAPI) staining in the bottom panels]. Sections incubated with the p75NTR sense probe did not show specific staining (right panels). Scale bar, 1 mm. C, Micrographs showing the in situ hybridization for p75NTR mRNA in hippocampal slice cultures derived from P5 mouse and cultivated for 15 d. Similar to the in vivo condition, p75NTR mRNA was detected in the dentate gyrus as well as in CA1 and CA3. Sections incubated with the sense probe did not reveal specific staining (right panel). Scale bar, 1 mm. D, Left, Higher magnification of the CA1 area of a culture stained with the p75NTR antisense probe showing a significant number of positive cells in all of the areas mentioned above. Right, A higher magnification shows several positive cells in the CA1 region. Scale bar, 500 and 100 μm, respectively. In situ hybridizations shown in B-D were performed on more than five occasions each with identical outcome.
To determine which cell types express the p75NTR gene, we performed in situ hybridization experiments using a p75NTR-specific antisense riboprobe and compared p75NTR expression in the brain of P21 mice with hippocampal cultures obtained from the P5 mouse brain and cultivated for 2 weeks in vitro. At P21, p75NTR expression was limited to the hippocampus, the cerebellum, and the septum (data not shown). In the P21 hippocampus, the specific p75NTR antisense detected high levels of p75NTR mRNA in neurons of the dentate gyrus and of the CA1 and CA3 regions (Fig. 1B; compare with the sensetreated sections on the right). Similarly, age-matched hippocampal organotypic cultures showed significant levels of p75NTR expression (Fig. 1C). Neurons in both the CA1 and CA3 region of the hippocampal cultures showed p75NTR expression (Fig. 1D). In both areas, two different cell populations were observed and characterized by either a high (Fig. 1D, arrow) or low (arrowhead) p75NTR expression level.
Analysis of dendritic morphology using particle-mediated GFP transfection
To visualize the fine structure of pyramidal neurons in organotypic cultures, we transfected individual cells with enhanced GFP using particle-mediated gene transfer. As described for ferret cortical neurons (Lo et al., 1994), this technique typically yields between one and a few transfected cells per slice and reveals fine structural details without exerting any toxic effect (Lo et al., 1994). We could thus readily visualize the complete dendritic arbor, including fine branches as well as dendritic spines, of individual neurons (Figs. 2A, 3A). We analyzed neurons in hippocampal slices prepared from P5 mice and cultured for 2 weeks in vitro. By this age, the neurons have developed a complex, three-dimensional morphology with many oblique dendritic branches extending from the primary apical and basal processes. In addition, dendrites are studded with numerous spine-like protrusions of varying size and shape. In WT, the morphology of CA1 and CA3 pyramidal neurons detected by GFP (Fig. 2A) was similar to the one described in previous studies filling neurons with a fluorescent dye (Tyler and Pozzo-Miller, 2001). Specifically, both CA1 and CA3 pyramidal cells are characterized by a basal dendritic tree consisting of three to five primary branched dendrites and by an apical dendritic tree formed by a single thick, highly branched, apical dendrite emerging from the opposite portion of the cell body. A detailed analysis of dendritic complexity and length using the Sholl analysis (Fig. 2C) (n = 10) confirmed previous descriptions of hippocampal pyramidal neurons (Nakayama et al., 2000), thus demonstrating that the GFP biolistic transfection did not cause any detectable deleterious effect on neuronal morphology, as shown previously (Lo et al., 1994).
Dendrite morphology and spine density in p75NTRIV neurons
To examine the role of p75NTR, we first used a mouse line in which the exon IV of the p75NTR (P75NTRIV) gene was targeted (von Schack et al., 2001). Compared with GFP-expressing WT neurons (Fig. 2A), GFP-expressing p75NTRIV KO pyramidal neurons show a largely normal dendritic morphology (Fig. 2B). We used Sholl analysis to calculate the total number of dendrite crossings as an objective measurement of the total dendritic complexity. This analysis revealed for p75NTRIV KO neurons an increase in dendritic complexity that was somewhat more pronounced for the basal compartment when compared with WT neurons. However, for the apical and for the basal compartment, the difference was not statistically significant (Fig. 2C, inset) (apical, p = 0.344; basal, p = 0.15; WT, n = 10; KO, n = 10). A more detailed Sholl analysis revealed a statistically significant increase in dendritic complexity in the mid-distal portion of the apical dendrite (Fig. 2C, left) (WT, n = 10; KO, n = 10; p < 0.05 between 480 and 520 μm from the soma). This area roughly corresponds to the distal portion of the stratum radiatum in which most of the CA3 and mossy fiber axons synapse, respectively, on CA1 and CA3 pyramidal neurons. No significant differences were apparent in the total length of the apical and basal dendritic compartments between WT and p75NTRIV KO neurons (Fig. 2C, left) (apical, p = 0.67; basal, p = 0.77).
In contrast to the relatively mild phenotype on dendrite morphology, spine density was significantly higher in p75NTRIV KO pyramidal neurons when compared with WT neurons (Fig. 3A). This finding was quantified by detailed spine density counts in three-dimensional high-magnification stacks of the apical, midapical, and basal dendrites. In GFP-labeled WT pyramidal cells, both spine density values were in agreement with those reported previously for neurons in organotypic cultures (Fig. 3B) (n = 9; total spine density, 0.51 ± 0.03 spines per micrometer of dendrite; apical dendrites, 0.35 ± 0.02 spines per micrometer of dendrite; mid-apical dendrites, 0.64 ± 0.03 spines per micrometer of dendrite; basal dendrites, 0.6 ± 0.05 spines per micrometer of dendrite) (Engert and Bonhoeffer, 1999; Tyler and Pozzo-Miller, 2001). The inhomogeneous distribution of spine densities in the different dendritic compartments is in accord with a previous description of the distribution of excitatory synapses on the dendrites of CA1 pyramidal cells in vivo (Megías et al., 2001). Still, we cannot completely exclude that minor differences with regard to spine density values between the different dendritic compartments may be attributable to the fact that, in hippocampal slice cultures, some of the main afferent inputs have been axotomized. Total spine density was significantly higher in p75NTRIV KO pyramidal neurons (Fig. 3B) (n = 11; 0.82 ± 0.09 spines per micrometer of dendrite; p = 0.01) than in WT neurons. In addition, a significant increase in spine density in p75NTRIV KO neurons compared with WT neurons was observed in all dendritic compartments (apical: KO, 0.52 ± 0.02 spines per micrometer of dendrite; p = 0.014; mid-apical: KO, 1.05 ± 0.11 spines/μm of dendrite; p = 0.002; basal: KO, 0.92 ± 0.008 spines per micrometer of dendrite; p = 0.007) and was most pronounced in the mid-apical and basal compartment (Fig. 3B). Interestingly, the increase in the mean total spine density was highly significant in 50% of the p75NTRIV KO pyramidal neurons (1.058 ± 0.14 spines per micrometer of dendrite; p = 0.0004). In contrast, in the other half of the p75NTRIV KO pyramidal neurons, spine density was only slightly increased but was still significantly different from WT (0.62 ± 0.04 spines per micrometer of dendrite; p = 0.01), suggesting the existence of two different populations of p75NTRIV KO pyramidal neurons.
We did not observe any correlation between the total dendritic complexity and the spine density values within individual pyramidal cells both in WT and in p75NTRIV KO.
Additional spines in p75NTRIV-deficient animals contain synapses
To ascertain whether the additional spines observed in p75NTRIV KO-derived neurons bear synapses, we stained our slices with antibodies to synapsin I to mark presynaptic terminals. We then analyzed the proportion of dendritic spines colocalized with synapsin I-positive puncta in both genotypes. Dendritic spines of WT neurons were in close apposition (±0.3 μm) with synapsin I dots (Fig. 3C, left) in 61.6 ± 1.68% of the cases (four cells from three WT slices) (Fig. 3C, right). In p75NTRIV KO neurons, the proportion of spines colocalized with a synapsin I-positive dot was slightly, but not significantly, higher (69.5 ± 3.05%; p = 0.07; five cells from three KO slices) (Fig. 3C) than in WT cells. The equal proportion of spines colocalized with synapsin I suggests a net higher number of synapses in p75NTRIV KO than in WT neurons. The percentage of colocalized spines in our samples represents a lower limit of the proportion of spines with presynaptic partners. However, because it is consistent with previously published studies (Tyler and Pozzo-Miller, 2001), we suggest that this is attributable to the limited detection sensitivity of the immunocytochemical reaction in slice cultures and therefore does not influence the comparison between WT and KO neurons.
Changes in spine size and shape in p75NTRIV KO versus WT neurons
In addition to alterations in spine number, spine size, and shape have also been shown to be modified by neuronal activity (Lang et al., 2004; Matsuzaki et al., 2004). We therefore analyzed whether spine density changes in p75NTRIV KO pyramidal neurons were combined with alterations of the size and shape as well. Because of the great variety of spine morphologies (Fig. 4A), we adopted a set of criteria that have been shown to be useful in classifying spines (Harris et al., 1992; Koh et al., 2002). First, using highzoom three-dimensional stacks (63×; zoom 8), we measured the total length of each spine from its base at the dendrite to the tip (Fig. 4A). In addition, we calculated the ratio between the maximal head diameter and the minimal neck diameter of each spine (Fig. 4A). We then used spine length and maxhead/minneck ratio to evaluate each single spine and to assign it to one specific spine category. By this means, we were able to distinguish the three classical main spine subtypes: stubby (type I), in which the length is <1 μm and the maxhead/minneck ratio is <1.5; thin (type III), in which the maxhead/minneck ratio is <1.5, and the length is ≥1 μm; and mushroom (type II), in which the maxhead/minneck ratio is ≥1.5 (independent of the length). With this classification, we then compared the proportion of the different spine types in WT and p75NTRIV KO neurons (WT, n = 5; KO, n = 3). This analysis confirmed our impression of a significantly lower percentage of stubby (type I) spines in p75NTRIV KO neurons (p = 0.03) accompanied by a non-statistically significant increase in mushroom (type II) spines (p = 0.38) as well as in thin spines (type III, p = 0.09) (Fig. 4B). We therefore plotted the proportion of different spine types for each dendritic compartment of WT and p75NTRIV KO neurons separately (WT, n = 5; KO, n = 3). We observed a significant increase of mushroom (type II) spines (p = 0.03) paralleled by a decrease in stubby (type I) spines (p = 0.03) in the basal compartment of p75NTRIV KO neurons when compared with the same location in WT cells. In the same compartment, we also detected a nonsignificant increase in thin (type III) spines (p = 0.07).
Dendrite morphology and spine density in p75NTRIII KO neurons
To corroborate our observations suggesting that p75NTR plays an important role in negatively modulating dendrite as well as spine morphology, we took advantage of the existence of a second mutant of the p75NTR gene in which the exon III has been targeted (p75NTRIII) (Lee et al., 1992). The analysis of a second mutant mice line became especially important after a recent report by Paul et al. (2004) suggesting that, in the p75NTRIV mutant, mice might still express a proapoptotic fragment of the receptor. In the p75NTRIII KO mouse, the full-length receptor (FL-p75) is completely absent, whereas a truncated form of the p75NTR (S-p75), missing the neurotrophin-binding domain, is still expressed (von Schack et al., 2001) (Fig. 5A).
Figure 5.
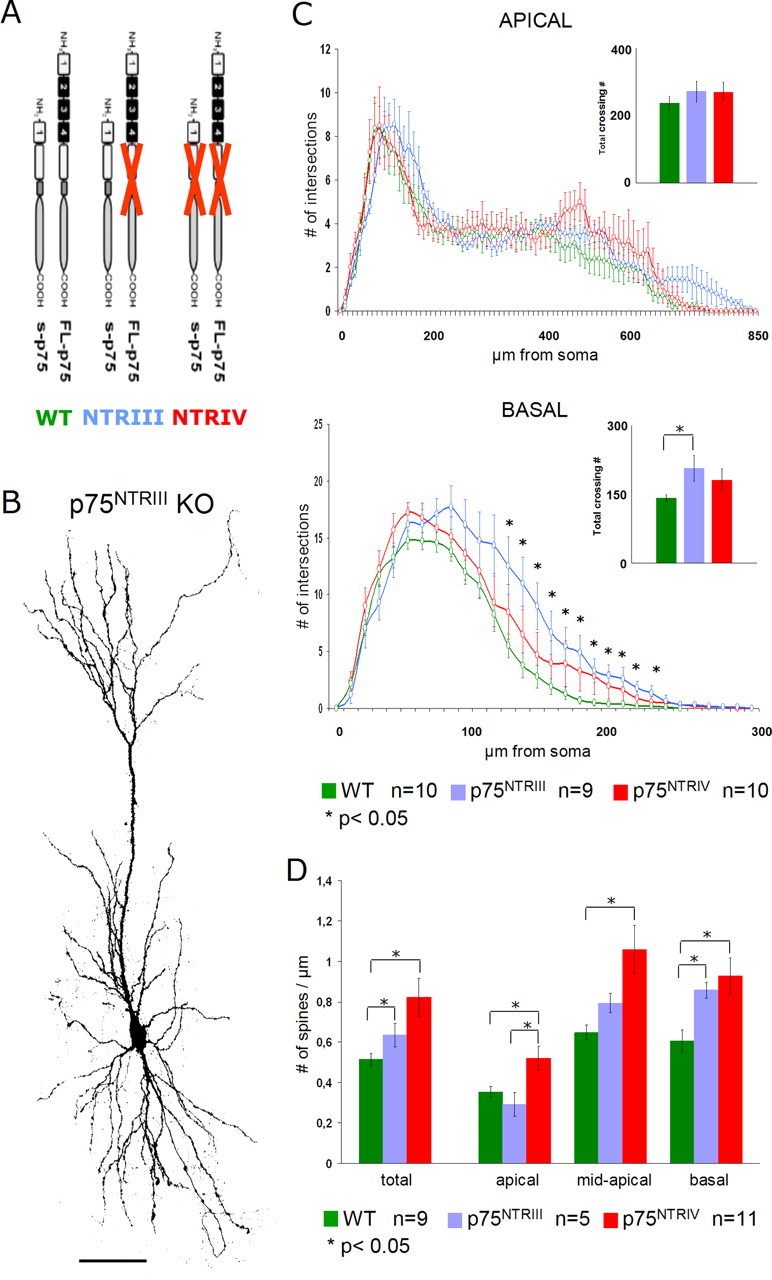
Morphology of GFP-expressing p75NTRIII KO-derived pyramidal neurons. A, Diagram summarizing the p75NTR isoforms respectively expressed in WT (green), p75NTRIII (violet), and p75NTRIV (red) KO mice in which FL-p75 depicts the full-length receptors, whereas S-p75 represents the short p75NTR isoform lacking the neurotrophin-binding domain. Adapted from von Schack et al. (2001). B, Confocal image showing a representative example of a p75NTRIII KO-derived pyramidal neuron. Note the largely normal dendritic morphology. Scale bar, 100 μm. C, Sholl analysis comparing both apical and basal dendrite in WT (green), p75NTRIII (violet), p75NTRIV (red), and KO pyramidal neurons. D, Histograms showing the spine density count in WT (green) and p75NTRIII (violet), versus p75NTRIV KO (red) KO neurons. Spine numbers are shown per micrometer of dendrite. Both total spine density and the density in the different dendritic compartments are shown. Note the intermediate phenotype of p75NTRIII (violet) KO neurons between WT and p75NTRIV KO spine density values. *p < 0.05. Error bars represent SEM.
As in the p75NTRIV mutant mice, the p75NTRIII KO pyramidal neurons also showed a largely normal dendritic morphology (Fig. 5B). Similar to the p75NTRIV mutant, the total number of dendrite crossings showed an increase in dendrite complexity, only significant for the basal dendritic compartment (apical compartment, p = 0.35; basal compartment, p = 0.02) when compared with WT dendrites (Fig. 5C). Total dendrite complexity of p75NTRIII KO-derived pyramidal neurons was, however, not different from that of p75NTRIV KO neurons (Fig. 5C) (basal, p = 0.48; apical, p = 0.99). Interestingly, the Sholl analysis for apical dendrites of p75NTRIII neurons showed a slight increase in dendritic complexity specifically in the mid-distal portion of the apical dendrite, reproducing, albeit not significantly, the trend we observed in the p75NTRIV KO neurons (Fig. 5C) (WT, n = 10; p75NTRIII, n = 9; p75NTRIV, n = 10). Moreover, although in the Sholl analysis the p75NTRIII apical dendrites seemed to be longer and therefore more complex than p75NTRIV neurons in the most apical portion, this observation again did not reach a significance level (no points with p < 0.05 for Sholl analysis, for length p = 0.71). A similar effect was also observed at the level of basal dendrites. Here, p75NTRIII neurons were longer (p = 0.04) as well as significantly more complex than wild-type neurons (Fig. 5C) (p < 0.05 between 120 and 230 μm from the soma). However, we again did not observe a significant difference in dendritic complexity and length between p75NTRIV and p75NTRIII neurons (Fig. 5C) (no point with p < 0.05 for Sholl analysis, for length p = 0.12). Together, p75NTRIII KO pyramidal neurons by and large showed the same differences to WT animals as those seen with p75NTRIV KO neurons.
Spine density measurements for the p75NTRIII KO neurons showed an intermediate phenotype between WT and p75NTRIV KO neurons. Total spine density was significantly increased in p75NTRIII KO pyramidal neurons when compared with WT neurons (p75NTRIII, 0.63 ± 0.05 spines/μm, n = 5; WT, 0.51 ± 0.03 spines/μm, n = 9; p = 0.02) (Fig. 5D). In contrast, total spine density in p75NTRIII mutant neurons was notably, but not significantly, lower than the one observed in p75NTRIV KO neurons (0.82 ± 0.09 spines/μm; p = 0.37; n = 11). The tendency of an intermediate phenotype was maintained in all different dendritic compartments, although it was more pronounced for the mid-apical and basal dendrites in which the spine density values in P75NTRIII are significantly different from WT but not from the P75NTRIV (apical: P75NTRIII, 0.29 ± 0.05 spines per micrometer of dendrite, versus WT, p = 0.32, against P75NTRIV, p = 0.02; mid-apical: P75NTRIII 0.79 ± 0.4 spines per micrometer of dendrite, versus WT, p = 0.06, against P75NTRIV, p = 0.07; basal: P75NTRIII 0.85 ± 0.03 spines per micrometer of dendrite, against WT, p = 0.04, against P75NTRIV, p = 0.99) (Fig. 5D).
Overexpression of full-length p75NTR significantly reduces both dendrite complexity and dendritic spine density
Our observations in both lines of p75NTR KO mice support the hypothesis that p75NTR plays an important role in negatively modulating the morphology of mature hippocampal pyramidal neurons. To corroborate this view, we took a gain-of-function approach, in which we overexpressed a full-length mouse p75NTR cDNA in our slices. Immunohistochemistry for p75NTR was used to distinguish GFP only (green) from GFP- and p75NTR-overexpressing neurons (Fig. 6A, yellow). The entire extent of the dendritic tree was positive for p75NTR, with a more intense labeling in the proximal compartments. Qualitatively, neurons overexpressing the full-length p75NTR (Fig. 6A,B) did not seem to show a profound alteration of the dendritic architecture when compared with WT pyramidal neurons. However, quantification of the total number of dendritic branches per each neuron indicated a significant decrease in total dendrite complexity for the apical dendrites of p75NTR-overexpressing cells (Fig. 6C, inset) (p = 0.02). The basal dendrites of p75NTR-expressing neurons did not show any significant difference from those of the control cells (Fig. 6C, inset) (p = 0.86). We then used the Sholl analysis to compare in detail the morphology of apical dendrites in control versus p75NTR-expressing neurons. The reduction in complexity of p75NTR-overexpressing neurons was confined to both the most proximal and most distal portions of the apical dendrite (Fig. 6C) (WT, n = 9; p75NTR-expressing cells, n = 11; p < 0.05 between 60 and 120 μm and between 640 and 680 μm from the soma). The length of apical dendrites in p75NTR-expressing neurons was not significantly different from WT neurons (p = 0.5).
Figure 6.
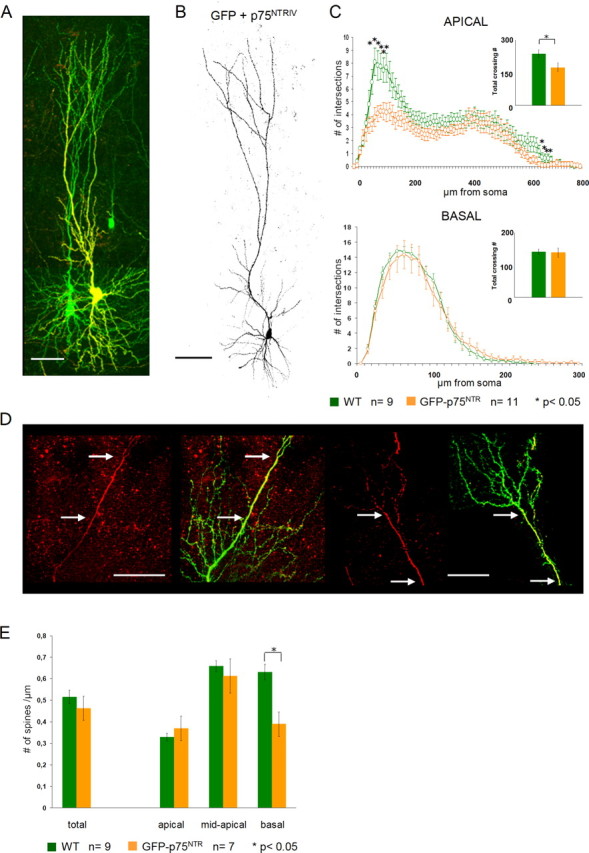
Morphology of full-length p75NTR-overexpressing neurons. A, Confocal image showing two GFP-expressing CA1 pyramidal neurons. The neuron on the right side (yellow) is positive for p75NTR immunohistochemistry. Scale bar, 100 μm. B, Confocal image showing a representative example of a mouse p75NTR-overexpressing pyramidal neuron. Scale bar, 100 μm. C, Sholl analysis showing a highly significant reduction in the dendritic complexity of the apical compartment (top panel) of mouse p75NTR-overexpressing neurons (orange). The reduced dendritic complexity in the apical dendrites (top panel) of p75NTR-overexpressing neurons is confined to the most proximal and most distal portions of the apical dendrite. The insets show the differences in total dendritic complexity between WT (green) and p75NTR-overexpressing neurons (orange). D, Two examples of confocal images showing an inhomogeneous expression of p75NTR (GFP left, p75NTR immunohistochemistry and GFP overlay, right). The number of dendritic branches seems to be inversely correlated to the expression level of p75NTR (i.e., regions of high expression are less complex than the low-expressing ones) (between arrows). Scale bar, 50 μm. E, Histograms showing the difference in spine density count in p75NTR-overexpressing (orange) versus WT (green) neurons. Both total spine density (left) and the density in the different dendritic compartments (right) are shown. *p < 0.05. Error bars represent SEM.
In a few instances, the immunohistochemistry revealed an inhomogeneous expression pattern of the p75NTR, providing us with control and p75NTR-expressing portions of the dendritic tree within the same neuron (Fig. 6D, arrows) (n = 2). At a qualitative level, the observation of this p75NTR expression pattern suggested a strong correlation between high levels of p75NTR expression and a reduced dendritic complexity (Fig. 6D, arrows). Together, our analysis of dendritic complexity in hippocampal pyramidal cells suggests that p75NTR overexpression reduces the complexity of apical dendritic branches.
We also analyzed spine density in the p75NTR-overexpressing cells. Total spine density values were only slightly reduced in p75NTR-overexpressing hippocampal pyramidal cells when compared with control cells (Fig. 6E) (p75NTR-expressing cells, 0.46 ± 0.03 spines per micrometer dendrite, n = 7; WT, 0.515 ± 0.32 spines per micrometer of dendrite, n = 9; p = 0.39). However, the reduction in total spine density was most obvious in the basal dendritic compartment of p75NTR-expressing cells, where it did reach statistical significance compared with WT cells (p75NTR-expressing cells, 0.38 ± 0.05 spines per micrometer of dendrite; WT, 0.63 ± 0.03 spines per micrometer of dendrite, p = 0.02). Everywhere else, the changes in spine density were not significantly different from WT controls.
One of the best established functions of p75NTR is the induction of apoptosis in various cells, including developing neurons (Troy et al., 2002). To exclude that, in our experimental conditions, the overexpression of the full-length p75NTR would cause the death of hippocampal pyramidal cells, we added propidium iodide in the medium of our cultures 2-3 h before fixing them to label all dead or dying cells. Both GFP-labeled WT neurons, as well as neurons expressing full-length p75NTR, clearly show a nonapoptotic nucleus indicating that the neurons we analyzed were neither dead nor dying (data not shown).
Discussion
Understanding how molecular cues control dendritic morphology is of high relevance to the question of how neuronal activity can be translated into structural changes of the neurons in the developing and the adult brain. In this study, we demonstrate that p75NTR controls dendrite morphology as well as spinedensity and spine morphology in hippocampal pyramidal neurons of organotypic slice cultures.
Previous work showed that neurotrophin receptors can influence neuronal morphology both during development and in the mature CNS (for review, see Bibel and Barde, 2000). Interestingly, by neutralizing endogenous neurotrophins in cortical organotypic cultures, McAllister et al. (1997) have shown that different neurotrophins oppose each others actions in a layer-specific manner to regulate the dendritic growth of pyramidal neurons. Thus, neurotrophins appear to modulate neuronal morphogenesis acting as growth-promoting as well as growth-inhibiting molecules.
Overexpression of full-length and truncated TrkB isoforms into developing cortical neurons increased, respectively, the number and the length of their dendrites (Yacoubian and Lo, 2000). Accordingly, cortical pyramidal neurons of TrkB mutant mice are characterized by thinner and less complex dendrites than those in WT mice (Xu et al., 2000). Moreover, the increase in spine numbers both in Purkinje cells and in hippocampal neurons was blocked by inhibiting TrkB signaling (Shimada et al., 1998; Tyler and Pozzo-Miller, 2001). Overall, these results suggest that positive structural changes are induced via the activation of Trk receptors. P75NTR has also been shown to control the growth of neuronal processes. In immature neurons, unoccupied p75NTR negatively regulates neurite and filopodial length by activating RhoA (Gehler et al., 2004), whereas neurotrophin binding to p75NTR stimulates neurite growth by decreasing RhoA activation (Yamashita et al., 1999). In adult dorsal root ganglion neurons and postnatal cerebellar neurons, binding of myelin-derived proteins to p75NTR activates RhoA and thereby inhibits growth (Yamashita et al., 2002). Recent studies also suggest a multipotential role of p75NTR in modulating dendrite morphology during development of hippocampal neuronal cultures, by either reducing the number of primary dendrites and by controlling the cellular targets of Notch (Salama-Cohen et al., 2005) or by mediating the filopodia growth promoting activity of TrkB-T1 (Hartmann et al., 2004). These and related observations suggest that the effects of p75NTR strongly depend on the cellular context in which it is expressed and that, under certain cellular conditions, it can act antagonistically to the Trk receptors.
Our results point to p75NTR as an overall negative modulator of dendritic complexity in mature hippocampal neurons. In p75NTR KO mice, dendritic complexity is significantly increased both in the basal and in the mid-distal portion of the apical dendritic compartment. In contrast, pyramidal neurons overexpressing the full-length p75NTR show a significant reduction in dendrite complexity, specifically in the most proximal portions of the apical as well as basal dendritic trees. Accordingly, although both spine density and synaptic contacts showed a significant increase in p75NTR KO mice, spine density was significantly reduced in p75NTR-overexpressing pyramidal neurons. The difference between our loss- and gain-of-function experiments corroborates our results in the p75NTR KO neurons and makes it unlikely that the phenotype we describe is a result of compensatory mechanisms activated in the mutant mice.
Our observations are significant with respect to the previously described correlations between activity-dependent synaptic plasticity and positive as well as negative changes in spine density (Engert and Bonhoeffer, 1999; Maletic-Savatic et al., 1999; Toni et al., 1999; Nägerl et al., 2004; Zhou et al., 2004). In this context, it is interesting that long-term depression (LTD) has been shown to be significantly impaired in p75NTR KO mice, whereas LTP was shown to be unaffected (Xu et al., 2000; Rösch et al., 2005; Woo et al., 2005). In addition to an increase in spine numbers in p75NTR KO neurons, there is also a significant difference in spine morphology determining a clear shift in spine type: in p75NTR KO neurons we found an increased proportion of mushroom (type II) as well as thin (type III) spines. It has been described that the length and diameter of the spine neck play an important role in isolating Ca2+ transients from the parent dendrite and the neighboring spines (Majewska et al., 2000a,b; Kasai et al., 2003). In addition, there is evidence that the number of AMPA receptors on a spine is proportional to the area of postsynaptic densities and the volume of the spine head (Harris and Stevens, 1989), suggesting that spine morphology directly influences synaptic transmission. Interestingly, it has been shown recently that induction of LTD results in shrinkage of dendritic spines (Zhou et al., 2004) as opposed to an enlargement of the spine head, which is observed after LTP (Matsuzaki et al., 2004).
To better corroborate our observation in the p75NTRIV KO mouse, we took advantage of the existence of a second mutant mouse in which exon III has been targeted (Lee et al., 1992) resulting in the expression of a truncated isoform of the receptor missing the neurotrophin-binding domain, albeit at low levels (von Schack et al., 2001). The analysis of the second mutant mouse for p75NTR became especially critical as a recent study suggested the possibility that a proapoptotic fragment of the p75NTR may still be expressed in the p75NTRIV KO mice (Paul et al., 2004). The authors suggested that aspects of the p75NTRIV KO phenotype may reflect a gain, rather than a loss of p75NTR function. With regard to the morphological analysis of pyramidal neurons, this possibility can be excluded because the morphological effects for both p75NTR mutant lines are similar. We also note that the overexpression of p75NTR causes the opposite phenotype, namely massive cell losses (Majdan et al., 1997) and that, in Schwann cells cultured from p75NTRIV KO animals, no p75NTR fragments were detected (von Schack et al., 2001). Similar to the results in the peripheral nervous system and in the medial septal nucleus (von Schack et al., 2001; Naumann et al., 2002), the morphology of hippocampal pyramidal cells is also more strongly affected in the p75NTRIV mutation than in the p75NTRIII mutation. As previously suggested, this may indicate that the S-p75 in p75NTRIII KO mice partially compensates the lack of FL-p75 in the p75NTRIV KO mice by interacting both with cytoplasmic interactors of p75NTR as well as Trk receptors (Bibel et al., 1999; von Schack et al., 2001).
P75NTR is known to be strongly expressed in hippocampal pyramidal cells in the early postnatal period and downregulated within the first 2 weeks (Buck et al., 1988; Lu et al., 1989), although it is still expressed at detectable levels at P9-P14 (Buck et al., 1988). These results are consistent with our observations. In addition, we also showed p75NTR expression in pyramidal cells in 2-week-old organotypic hippocampal cultures, thus indicating that p75NTR is indeed expressed at relevant time points and in the appropriate cell types in our experimental preparation. Most importantly, we clearly see detectable levels of p75NTR expression in both CA1 and CA3 pyramidal cells as well as in granule cells of the dentate gyrus in vivo up to P21.
This opens the possibility that the p75NTR receptor has acute effects in the adult nervous system. How might p75NTR interact with the cytoskeleton to change spine and dendritic morphology in an acute manner? Previous observations indicate that p75NTR controls the activity of RhoA (Yamashita et al., 1999, 2002) and that the Rho GTPases are involved in maintaining dendritic branches and spine development in pyramidal neurons (Nakayama et al., 2000; Tashiro et al., 2000; Li et al., 2002). Specifically, unoccupied p75NTR has been shown to constitutively activate RhoA and, consequently, to negatively modulate the length of neurites and filopodia, whereas binding of neurotrophins modulates p75NTR function by decreasing RhoA activation (Yamashita et al., 1999; Gehler et al., 2004). In addition, p75NTR has been also shown to inhibit axonal growth mediating the negative effect of myelin-associated glycoprotein (Yamashita et al., 2002) and Nogo (Wang et al., 2002). In addition, Woo et al. (2005) have recently described a specific function of pro-BDNF in facilitating hippocampal LTD via the activation of p75NTR. However, our results should not be taken to necessarily imply that the effects of p75NTR in regulating the morphology of hippocampal pyramidal cells are ligand mediated. They may be accounted for by intracellular mechanisms such as the modulation of small GTP-binding protein (see above).
In conclusion, our results add new insights to the bidirectional mode of neurotrophin signaling in controlling the morphology of neurons in the CNS. Specifically, they suggest a role of p75NTR as a negative modulator of structural changes in neurons and further strengthen the view of a functional antagonism mediated by the two different neurotrophin receptor types.
Footnotes
This work was supported by the Max Planck Society (A.H., M.K., M.Z., T.B.), the Volkswagen Foundation (Project I176781 to M.K., T.B., and Y.-A.B.), by a Heisenberg stipend from the Deutsche Forschungsgemeinschaft (DFG), and by the DFG Research Unit 471 (M.K.). We thank Irene Arnold-Ammer and Volker Staiger for their outstanding technical assistance and Hans Thoenen for comments on previous versions of this manuscript.
Correspondence should be addressed to Dr. Martin Korte, Zoological Institute, Technische Universität Braunschweig, Mendelssohnstrasse 4, D-38106 Braunschweig, Germany. E-mail: m.korte@tu-bs.de.
Copyright © 2005 Society for Neuroscience 0270-6474/05/259989-11$15.00/0
References
- Bibel M, Barde YA (2000) Neurotrophins: key regulators of cell fate and cell shape in the vertebrate nervous system. Genes Dev 14: 2919-2937. [DOI] [PubMed] [Google Scholar]
- Bibel M, Hoppe E, Barde YA (1999) Biochemical and functional interactions between the neurotrophin receptors trk and p75NTR EMBO J 18: 616-622. [DOI] [PMC free article] [PubMed] [Google Scholar]
- Bliss TVP, Collingridge GL (1993) A synaptic model of memory-long-term potentiation in the hippocampus. Nature 361: 31-39. [DOI] [PubMed] [Google Scholar]
- Buck CR, Martinez HJ, Chao MV, Black IB (1988) Differential expression of the nerve growth factor receptor gene in multiple brain areas. Dev Brain Res 44: 259-268. [DOI] [PubMed] [Google Scholar]
- Chomczynski P, Sacchi N (1987) Single-step method of RNA isolation by acid guanidinium thiocyanate-phenol-chloroform extraction. Anal Biochem 162: 156-159. [DOI] [PubMed] [Google Scholar]
- Cohen-Cory S, Fraser SE (1995) Effects of brain-derived neurotrophic factor on optic axon branching and remodelling in vivo. Nature 378: 192-196. [DOI] [PubMed] [Google Scholar]
- Dechant G, Barde YA (2002) The neurotrophin receptor p75(NTR): novel functions and implications for diseases of the nervous system. Nat Neurosci 5: 1131-1136. [DOI] [PubMed] [Google Scholar]
- Dunaevsky A, Tashiro A, Majewska A, Mason C, Yuste R (1999) Developmental regulation of spine motility in the mammalian central nervous system. Proc Natl Acad Sci USA 96: 13438-13443. [DOI] [PMC free article] [PubMed] [Google Scholar]
- Engert F, Bonhoeffer T (1999) Dendritic spine changes associated with hippocampal long-term synaptic plasticity. Nature 399: 66-70. [DOI] [PubMed] [Google Scholar]
- Ernfors P, Van de Water T, Loring J, Jaenisch R (1995) Complementary roles of BDNF and NT-3 in vestibular and auditory development. Neuron 14: 1153-1164. [ [DOI] [PubMed] [Google Scholar]; Erratum (1995) 15: 739] [Google Scholar]
- Frade JM, Rodriguez-Tebar A, Barde YA (1996) Induction of cell death by endogenous nerve growth factor through its p75 receptor. Nature 383: 166-168. [DOI] [PubMed] [Google Scholar]
- Friedman WJ (2000) Neurotrophins induce death of hippocampal neurons via the p75 receptor. J Neurosci 20: 6340-6346. [DOI] [PMC free article] [PubMed] [Google Scholar]
- Gehler S, Gallo G, Veien E, Letourneau PC (2004) p75 neurotrophin receptor signaling regulates growth cone filopodial dynamics through modulating RhoA activity. J Neurosci 24: 4363-4372. [DOI] [PMC free article] [PubMed] [Google Scholar]
- Giulietti A, Overbergh L, Valckx D, Decallonne B, Bouillon R, Mathieu C (2001) An overview of real-time quantitative PCR: applications to quantify cytokine gene expression. Methods 25: 386-401. [DOI] [PubMed] [Google Scholar]
- Harris KM, Stevens JK (1989) Dendritic spines of CA 1 pyramidal cells in the rat hippocampus: serial electron microscopy with reference to their biophysical characteristics. J Neurosci 9: 2982-2997. [DOI] [PMC free article] [PubMed] [Google Scholar]
- Harris KM, Jensen FE, Tsao B (1992) Three-dimensional structure of dendritic spines and synapses in rat hippocampus (CA1) at postnatal day 15 and adult ages: implications for the maturation of synaptic physiology and long-term potentiation. J Neurosci 12: 2685-2705. [DOI] [PMC free article] [PubMed] [Google Scholar]
- Hartmann M, Brigadski T, Erdmann KS, Holtmann B, Sendtner M, Narz F, Lessmann V (2004) Truncated TrkB receptor-induced outgrowth of dendritic filopodia involves the p75 neurotrophin receptor. J Cell Sci 117: 5803-5814. [DOI] [PubMed] [Google Scholar]
- Holz A, SchaerenWiemers N, Schaefer C, Pott U, Colello RJ, Schwab ME (1996) Molecular and developmental characterization of novel cDNAs of the myelin-associated oligodendrocytic basic protein. J Neurosci 16: 467-477. [DOI] [PMC free article] [PubMed] [Google Scholar]
- Kasai H, Matsuzaki M, Noguchi J, Yasumatsu N, Nakahara H (2003) Structure-stability-function relationships of dendritic spines. Trends Neurosci 26: 360-368. [DOI] [PubMed] [Google Scholar]
- Koh IY, Lindquist WB, Zito K, Nimchinsky EA, Svoboda K (2002) An image analysis algorithm for dendritic spines. Neural Comput 14: 1283-1310. [DOI] [PubMed] [Google Scholar]
- Lang C, Barco A, Zablow L, Kandel ER, Siegelbaum SA, Zakharenko SS (2004) Transient expansion of synaptically connected dendritic spines upon induction of hippocampal long-term potentiation. Proc Natl Acad Sci USA 101: 16665-16670. [DOI] [PMC free article] [PubMed] [Google Scholar]
- Lee KF, Li E, Huber LJ, Landis SC, Sharpe AH, Chao MV, Jaenisch R (1992) Targeted mutation of the gene encoding the low affinity NGF receptor p75 leads to deficits in the peripheral sensory nervous system. Cell 69: 737-749. [DOI] [PubMed] [Google Scholar]
- Levi-Montalcini R, Booker B (1960) Destruction of the sympathetic ganglia in mammals by an antiserum to a nerve-growth protein. Proc Natl Acad Sci USA 46: 384-391. [DOI] [PMC free article] [PubMed] [Google Scholar]
- Li Z, Aizenman CD, Cline HT (2002) Regulation of rho GTPases by crosstalk and neuronal activity in vivo. Neuron 33: 741-750. [DOI] [PubMed] [Google Scholar]
- Lo DC, McAllister AK, Katz LC (1994) Neuronal transfection in brain slices using particle-mediated gene transfer. Neuron 13: 1263-1268. [DOI] [PubMed] [Google Scholar]
- Lu B, Buck CR, Dreyfus CF, Black IB (1989) Expression of NGF and NGF receptor mRNAs in the developing brain: evidence for local delivery and action of NGF. Exp Neurol 104: 191-199. [DOI] [PubMed] [Google Scholar]
- Majdan M, Lachance C, Gloster A, Aloyz R, Zeindler C, Bamji S, Bhakar A, Belliveau D, Fawcett J, Miller FD, Barker PA (1997) Transgenic mice expressing the intracellular domain of the p75 neurotrophin receptor undergo neuronal apoptosis. J Neurosci 17: 6988-6998. [DOI] [PMC free article] [PubMed] [Google Scholar]
- Majewska A, Brown E, Ross J, Yuste R (2000a) Mechanisms of calcium decay kinetics in hippocampal spines: role of spine calcium pumps and calcium diffusion through the spine neck in biochemical compartmentalization. J Neurosci 20: 1722-1734. [DOI] [PMC free article] [PubMed] [Google Scholar]
- Majewska A, Tashiro A, Yuste R (2000b) Regulation of spine calcium dynamics by rapid spine motility. J Neurosci 20: 8262-8268. [DOI] [PMC free article] [PubMed] [Google Scholar]
- Malenka RC, Nicoll RA (1999) Long-term potentiation—a decade of progress? Science 285: 1870-1874. [DOI] [PubMed] [Google Scholar]
- Maletic-Savatic M, Malinow R, Svoboda K (1999) Rapid dendritic morphogenesis in CA1 hippocampal dendrites induced by synaptic activity. Science 283: 1923-1927. [DOI] [PubMed] [Google Scholar]
- Matsuzaki M, Honkura N, Ellis-Davies GCR, Kasai H (2004) Structural basis of long-term potentiation in single dendritic spines. Nature 429: 761-766. [DOI] [PMC free article] [PubMed] [Google Scholar]
- McAllister AK, Katz LC, Lo DC (1997) Opposing roles for endogenous BDNF and NT-3 in regulating cortical dendritic growth. Neuron 18: 767-778. [DOI] [PubMed] [Google Scholar]
- McAllister AK, Katz LC, Lo DC (1999) Neurotrophins and synaptic plasticity. Annu Rev Neurosci 22: 295-318. [DOI] [PubMed] [Google Scholar]
- Megías M, Emri Z, Freund TF, Gulyás AI (2001) Total number and distribution of inhibitory and excitatory synapses on hippocampal CA1 pyramidal neurons. Neuroscience 102: 527-540. [DOI] [PubMed] [Google Scholar]
- Nägerl UV, Eberhorn N, Cambridge SB, Bonhoeffer T (2004) Bidirectional activity-dependent morphological plasticity in hippocampal neurons. Neuron 44: 759-767. [DOI] [PubMed] [Google Scholar]
- Nakayama AY, Harms MB, Luo L (2000) Small GTPases Rac and Rho in the maintenance of dendritic spines and branches in hippocampal pyramidal neurons. J Neurosci 20: 5329-5338. [DOI] [PMC free article] [PubMed] [Google Scholar]
- Naumann T, Casademunt E, Hollerbach E, Hofmann J, Dechant G, Frotscher M, Barde YA (2002) Complete deletion of the neurotrophin receptor p75NTR leads to long-lasting increases in the number of basal forebrain cholinergic neurons. J Neurosci 22: 2409-2418. [DOI] [PMC free article] [PubMed] [Google Scholar]
- Patapoutin A, Reichardt LF (2001) Trk receptors: mediators of neurotrophin action. Curr Opin Neurobiol 11: 272-280. [DOI] [PubMed] [Google Scholar]
- Paul CE, Vereker E, Dickson KM, Barker PA (2004) A pro-apoptotic fragment of the p75 neurotrophin receptor is expressed in p75NTRExonIV null mice. J Neurosci 24: 1917-1923. [DOI] [PMC free article] [PubMed] [Google Scholar]
- Peters A, Kaisreman-Abramof IR (1969) Small pyramidal neuron of rat cerebral cortex-synapses upon dendritic spines. Z Zellforsch Mikrosk Anat 100: 487-506. [DOI] [PubMed] [Google Scholar]
- Poo MM (2001) Neurotrophins as synaptic modulators. Nat Rev Neurosci 2: 24-32. [DOI] [PubMed] [Google Scholar]
- Rösch H, Schweigreiter R, Bonhoeffer T, Barde YA, Korte M (2005) The neurotrophin receptor p75NTR modulates long-term depression and regulates the expression of AMPA receptor subunits in the hippocampus. Proc Natl Acad Sci USA 102: 7362-7367. [DOI] [PMC free article] [PubMed] [Google Scholar]
- Salama-Cohen P, Arevalo MA, Meier J, Grantyn R, Rodriguez-Tebar A (2005) NGF controls dendrite development in hippocampal neurons by binding to p75(NTR) and modulating the cellular targets of notch. Mol Biol Cell 16: 339-347. [DOI] [PMC free article] [PubMed] [Google Scholar]
- Shimada A, Mason CA, Morrison ME (1998) TrkB signaling modulates spine density and morphology independent of dendrite structure in cultures neonatal Purkinje cells. J Neurosci 18: 8559-8570. [DOI] [PMC free article] [PubMed] [Google Scholar]
- Sholl DA (1953) Dendritic organization in the neurons of the visual and motor cortices of the cat. J Anat 87: 387-406. [PMC free article] [PubMed] [Google Scholar]
- Snider WD (1988) Nerve growth-factor enhances dendritic arborization of sympathetic-ganglion cells in developing mammals. J Neurosci 8: 2628-2634. [DOI] [PMC free article] [PubMed] [Google Scholar]
- Stoppini L, Buchs PA, Muller D (1991) A simple method for organotypic cultures of nervous tissue. J Neurosci Methods 37: 173-182. [DOI] [PubMed] [Google Scholar]
- Tashiro A, Minden A, Yuste R (2000) Regulation of dendritic spine morphology by the rho family of small GTPases: antagonistic roles of Rac and Rho. Cereb Cortex 10: 927-938. [DOI] [PubMed] [Google Scholar]
- Toni N, Buchs PA, Nikonenko I, Bron CR, Muller D (1999) LTP promotes formation of multiple spine synapses between a single axon terminal and a dendrite. Nature 402: 421-425. [DOI] [PubMed] [Google Scholar]
- Troy CM, Friedman JE, Friedman WJ (2002) Mechanisms of p75-mediated death of hippocampal neurons. Role of caspases. J Biol Chem 277: 34295-34302. [DOI] [PubMed] [Google Scholar]
- Tyler WJ, Pozzo-Miller LD (2001) BDNF enhances quantal neurotransmitter release and increases the number of docked vesicles at the active zones of hippocampal excitatory synapses. J Neurosci 21: 4249-4258. [DOI] [PMC free article] [PubMed] [Google Scholar]
- von Schack D, Casademunt E, Schweigreiter R, Meyer M, Bibel M, Dechant G (2001) Complete ablation of the neurotrophin receptor p75NTR causes defects both in the nervous and the vascular system. Nat Neurosci 4: 977-978. [DOI] [PubMed] [Google Scholar]
- Wang KC, Kim JA, Sivasankaran R, Segal R, He Z (2002) p75 interacts with the Nogo receptor as a co-receptor for Nogo, MAG and OMgp. Nature 420: 74-78. [DOI] [PubMed] [Google Scholar]
- Woo NH, Teng HK, Siao C-J, Chiaruttini C, Pang PT, Milner TA, Hempstead BL, Lu B (2005) Activation of p75NTR by proBDNF facilitates hippocampal long-term depression. Nat Neurosci 8: 1069-1077. [DOI] [PubMed] [Google Scholar]
- Xu BJ, Gottschalk W, Chow A, Wilson RI, Schnell E, Zang KL, Wang DA, Nicoll RA, Lu B, Reichardt LF (2000) The role of brain-derived neurotrophic factor receptors in the mature hippocampus: modulation of longterm potentiation through a presynaptic mechanism involving TrkB. J Neurosci 20: 6888-6897. [DOI] [PMC free article] [PubMed] [Google Scholar]
- Yacoubian TA, Lo DC (2000) Truncated and full-length TrkB receptors regulate distinct modes of dendritic growth. Nat Neurosci 3: 342-349. [DOI] [PubMed] [Google Scholar]
- Yamashita T, Tucker KL, Barde YA (1999) Neurotrophin binding to the p75 receptor modulates Rho activity and axonal outgrowth. Neuron 24: 585-593. [DOI] [PubMed] [Google Scholar]
- Yamashita T, Higuchi H, Tohyama M (2002) The p75 receptor transduces the signal from myelin-associated glycoprotein to Rho. J Cell Biol 157: 565-570. [DOI] [PMC free article] [PubMed] [Google Scholar]
- Yuste R, Bonhoeffer T (2004) Genesis of dendritic spines: insights from ultrastructural and imaging studies. Nat Neurosci Rev 5: 24-34. [DOI] [PubMed] [Google Scholar]
- Zhou Q, Homma KJ, Poo Mm (2004) Shrinkage of dendritic spines associated with long-term depression of hippocampal synapses. Neuron 44: 749-757. [DOI] [PubMed] [Google Scholar]