

Abstract
The role of hyperpolarization-activated, cyclic nucleotide-modulated (HCN) channel isoforms and hyperpolarization-activated cation current (Ih) for seizure-related burst firing in thalamocortical (TC) neurons was investigated in a rat genetic model of absence epilepsy [Wistar Albino Glaxo rats, bred in Rijswijk (WAG/Rij)]. Burst discharges in TC neurons locked to seizure activity in vivo were prolonged during blockade of Ih by Cs+ and ZD7288 (4-ethylphenylamino-1,2-dimethyl-6-methylaminopyrimidinium chloride). In vitro analyses revealed a hyperpolarizing shift of half-maximal Ih activation (Vh) in WAG/Rij (Vh = -93.2 mV) compared with nonepileptic controls [August × Copenhagen-Irish (ACI) (Vh = -88.0 mV)]. This effect is explained by a shift of the responsiveness of Ih to cAMP toward higher concentrations in TC neurons from WAG/Rij, as revealed by application of 8-bromo-cAMP and the phosphodiesterase inhibitor IBMX. During blockade of adenylyl cyclase activity, Ih activation was similar in the two strains, whereas the difference in cAMP responsiveness persisted, thereby voting against different ambient cAMP levels between strains. Increasing the intracellular cAMP level and shifting Ih activation led to a change from burst to tonic firing mode in WAG/Rij but not in ACI rats. Furthermore, HCN1 expression was significantly increased on mRNA and protein levels, with no changes in HCN2-4 expression. In conclusion, there is an increase in HCN1 expression in the epileptic thalamus, associated with a decrease in cAMP responsiveness of Ih in TC neurons and resulting impairment to control the shift from burst to tonic firing, which, in turn, will prolong burst activity after recruitment of Ih during absence seizures.
Keywords: absence epilepsy, h-current, HCN channels, thalamic dysfunction, spike-and-wave, cAMP
Introduction
The thalamocortical system is able to generate rhythmic network activity during slow-wave sleep (Steriade et al., 1997). The cellular substrate of these oscillations include the periodic interaction of intrinsic and synaptic membrane currents, to which the hyperpolarization-activated cation current (Ih) makes an important contribution (Pape, 1996). In thalamocortical (TC) neurons, Ih functions as a pacemaker mechanism during rhythmic burst discharges accompanying δ sleep (Pape, 1996). Activation and deactivation of Ih have been shown to shape the typical waxing and waning activity characterizing sleep spindles (Lüthi and McCormick, 1998). Furthermore, regulation of the voltage dependence of Ih through the adenylyl cyclase/cAMP system provides one important mechanism for the control of sleep-related burst firing (Pape, 1996; Lüthi and McCormick, 1998). Although it is known that thalamocortical mechanisms and networks that generate oscillatory activity during sleep are critically involved also in the pathological transformation toward spike-wave discharges (SWDs) characterizing absence seizures during petit mal epilepsy (McCormick and Bal, 1997; Crunelli and Leresche, 2002), the role of Ih has remained elusive.
Views on Ih have evolved along two important lines. (1) Four members of a gene family encoding mammalian hyperpolarization-activated, cyclic nucleotide-gated cation channels (HCN1-4) have been cloned (Kaupp and Seifert, 2001; Santoro and Baram, 2003). Four subunits are thought to assemble to form homomeric or heteromeric functional channels, of which the kinetics, voltage dependency, and cAMP sensitivity are primarily determined by the particular subunit composition. For instance, compared with HCN2, the HCN1 isoform confers faster activation kinetics, a more depolarized membrane voltage of activation, and very little response to direct cAMP-dependent modulation. Furthermore, the expression pattern of HCN isoforms in the mammalian brain displays regional and species differences (Moosmang et al., 1999) and is developmentally regulated (Bender et al., 2001). (2) Evidence has been obtained recently for an effect of neuronal activity on Ih channel expression and function, with particular relationship to epileptic activity. Seizures resulted in altered electrophysiological properties of Ih and influenced the ratio of HCN1 and HCN2 expression in different cell types of the hippocampus and entorhinal cortex (K. Chen et al., 2001; Brewster et al., 2002; Bender et al., 2003; Shah et al., 2004). In addition, the genetic knock-out of the HCN2 isoform resulted in altered Ih in TC neurons and absence of seizure-like activity (Ludwig et al., 2003), and a reduced HCN1 protein expression has been found in the neocortex of a rat genetic absence epilepsy model (Strauss et al., 2004). These results suggested the differential regulation of HCN isoforms in neuropathological conditions and prompted HCN subunits to be proposed as candidates for antiepileptic strategies (Chen et al., 2002), although a causal relationship between the expression of HCN isoforms, Ih function, and spontaneous seizures in chronic epilepsy had not been obtained from these studies. Therefore, we have undertaken the present study to analyze the possible contribution of HCN channels to the evolution of SWD using a rat genetic model of absence epilepsy (WAG/Rij) (Renier and Coenen, 2000), combined with electrophysiological and molecular biological techniques.
Materials and Methods
Electrophysiology in vivo
Operative procedures. Experiments in rats of the WAG/Rij strain in vivo were performed as described previously (Seidenbecher et al., 1998; Staak and Pape, 2001) and were approved by the Regierungspräsidium Dessau (AZ 53a-42502/2-028/5). Data are from a total of 30 WAG/Rij (aged 130-307 d; weight, 356 ± 5 g). Operative procedures were performed under deep pentobarbital anesthesia (40-60 mg/kg, i.p), with Xylocaine cream (ASTRA GmbH, Wedel, Germany) applied to wound and pressure points. Animals were fixed in a stereotaxic frame (David Kopf Instruments, Tujunga, CA) with bregma and lambda in a horizontal plane. The epidural EEG was monitored bilaterally [anteroposterior (AP), +2.0 mm; mediolateral (ML), 3.6 mm from bregma], and body temperature was kept at 36-38°C. Recordings were performed under neurolept anesthesia [0.079 ± 0.003 mg · kg-1 · h-1 fentanyl (Janssen-Cilag, Neuss, Germany or CuraMed, Karlsruhe, Germany) and 6.67 ± 0.27 mg · kg-1 · h-1 droperidol (Sigma, St. Louis, MO)]. In some animals, recordings were obtained under pentobarbital anesthesia (n = 5; 24.0 ± 1.5 mg · kg-1 · h-1 pentobarbital; Sigma) or deep neurolept anesthesia (0.107 ± 0.006 mg · kg-1 · h-1 fentanyl, n = 5; 8.25 ± 0.28 mg · kg-1 · h-1 droperidol, n = 5). The level of anesthesia and analgesia was monitored through the EEG and limb withdrawal in response to tactile stimuli. At signs of insufficient anesthesia, fentanyl and droperidol were additionally applied intraperitoneally.
Microiontophoretic and recording techniques in vivo. Five-barrel (Hil-genberg, Malsfeld, Germany) glass microelectrodes were used for extracellular unit recording and microiontophoresis. The recording barrel was filled with 0.6 m sodium acetate and connected to an amplifier (high-pass and low-pass filters set at 0.5 and 10 kHz, respectively; EXT-20F; npi Electronic GmbH, Tamm, Germany). One barrel filled with 0.6 m sodium-acetate and 2-6% Chicago sky blue was used for current balancing and for labeling the recording site. The remaining barrels contained CsCl (Sigma, Taufkirchen, Germany) (150 mm, pH 3.4-3.55) or 4-ethylphenylamino-1,2-dimethyl-6-methylaminopyrimidinium chloride (ZD7288; 0.2 or 2 mm in 0.9% NaCl, pH 3.4-3.55; Biotrend, Cologne, Germany). Microiontophoresis was controlled with a Neuro-Phore-BH-2 (Medical Systems, Greenvale, NY). Impedance of the electrodes (at 1 kHz) was 10-20 MΩ; ejection and retaining currents were +3 to +30 nA and -10 nA, respectively. Electrodes were lowered into the ventrobasal complex (VB) (coordinates in mm from bregma: AP, -3.0; ML, 3.3; depth, 5.45-6.0) using a micropositioner (model 650; David Kopf Instruments). Analog data were fed into a computer via an analog-to-digital interface (1401plus; Cambridge Electronic Design, Cambridge, UK) and analyzed using the Spike-2 software (Cambridge Electronic Design). Unit activity was discriminated from noise using a level-time function of Spike-2.
Histological procedures. Animals were killed by an overdose of pentobarbital (150 mg/kg, i.p.), the brains were fixed with 4% phosphate-buffered paraformaldehyde, pH 7.4, and immersed in 30% sucrose. Chicago sky blue injections were identified in frozen frontal sections (40 μm) counterstained with cresyl violet. Only data from recordings with histologically verified recording sites were included in the analysis.
Electrophysiology in vitro
Preparation of slices. In the present study, the WAG/Rij model was compared with rats of the August × Copenhagen-Irish (ACI) strain, the only inbred rat strain free of spike-wave activity (Coenen and Van Luijtelaar, 2003). ACI (n = 81) and WAG/Rij (n = 65) rats of either sex [postnatal day 16 (P16) to P29] were anesthetized with halothane and decapitated. A block of tissue containing the thalamus was removed and placed in ice-cold saline, containing the following (in mm): 200 sucrose, 20 PIPES, 2.5 KCl, 1.25 NaH2PO4, 10 MgSO4, 0.5 CaCl2, and 10 dextrose, pH 7.35 with NaOH. Thalamic slices were prepared as coronal sections on a vibratome. Before recording, slices were kept submerged in standard artificial CSF containing the following (in mm): 125 NaCl, 2.5 KCl, 1.25 NaH2PO4, 24 NaHCO3, 2 MgSO4, 2 CaCl2, and 10 dextrose, pH adjusted to 7.35 by bubbling with a mixture of 95% O2 and 5% CO2.
Whole-cell patch clamp. Recordings were performed on TC neurons of the dorsal lateral geniculate nucleus (dLGN) and VB at room temperature. Slices were recorded in a solution containing the following (in mm): 125 NaCl, 3 KCl, 1.25 NaH2PO4, 22 NaH2PO4, 2 MgSO4, 2 CaCl2, and 10 dextrose, pH 7.35 adjusted by bubbling with 95% O2/5% CO2. Individual cells were visually identified by infrared differential interference contrast video microscopy (Dodt and Zieglgänsberger, 1990). Membrane currents were measured with pipettes pulled from borosilicate glass (GC150T-10; Clark Electromedical Instruments, Pangbourne, UK), connected to an EPC-10 amplifier (HEKA Elektronik, Lamprecht, Germany), and filled with the following (in mm): 95 K-gluconate, 20 K3-citrate, 10 NaCl, 10 HEPES, 1 MgCl2, 0.5 Ca Cl2, 3 BAPTA, 3 Mg-ATP, and 0.5 Na-GTP. The internal solution was set to a pH of 7.25 with KOH and an osmolarity of 295 mOsm/kg. Typical electrode resistance was 2-3 MΩ, with an access resistance in the range of 5-15 MΩ. Series resistance compensation of >40% was routinely used. Electrophysiological experiments were governed by Pulse software (HEKA Elektronik) operating on an IBM-compatible computer. A liquid junction potential of 10 ± 1 mV (n = 6) was measured and taken into account (Neher, 1992). Resting potential was determined as zero current potential under current-clamp conditions. Thereafter, input resistance was determined by applying small (5-10 pA) depolarizing and hyperpolarizing current steps and dividing the resulting voltage deflection by the applied current.
Experimental protocol and data analysis
Peri-event time (PT) histograms of unit activity were constructed using the maximum peak of the spike component of a given SWD on the EEG as a trigger (EEG-triggered analysis) (Staak and Pape, 2001). The counts were calculated in 3 ms bins in a time range 39 ms before and 6 ms after the spike peak on the EEG (spike-locked activity) and 15-60 ms after the spike peak on the EEG (wave-locked activity) (see Fig. 1 B). This temporal range seemed feasible, because spike-locked burst firing in various brain regions of WAG/Rij or genetic absence epilepsy rats from Stras-bourg (GAERS), including thalamocortical relay nuclei, the reticular thalamic nucleus, and the somatosensory cortex, peaks ∼20-5 ms before the peak of the EEG spike and sharply declines within 5 ms after the EEG spike peak (Inoue et al., 1993; Seidenbecher et al., 1998; Staak and Pape, 2001). Activity in intralaminar nuclei, by comparison, sharply peaks at ∼10 ms after the spike peak on the EEG and is considered wave-locked (Seidenbecher and Pape, 2001). An overall duration of the time window of 105 ms was used in view of the mean frequency of occurrence of SWD at 7-10 Hz. The average number of discharges per each SWD was calculated from the number of spikes in PT histograms divided by the respective number of SWD. For evaluation of Cs+ or ZD7288 effects, SWD were monitored within intervals of 40 s duration. When no change in SWD frequency was observed (control period), application of a drug commenced, and the effect on SWD-related activity was monitored in intervals of 40 s duration every 2 min, followed by cessation of drug application (recovery period). The number of unit discharges per SWD was calculated from these intervals. Data from different unit recordings were averaged using this protocol. In addition, the effects of Cs+ and ZD7288 on burst activity were monitored in rats displaying no SWD in intervals of 30 s over a time period of 6 min (two control intervals of 30 s duration with no drug application preceded each drug application). Patterns of unit activity were considered as a burst when a minimum of two initial spikes occurred at a frequency exceeding 300 Hz, and subsequent spikes occurred at frequencies exceeding 125 Hz (as specified by the Spike-2 software). Mean burst length was calculated for each interval and averaged from different experiments. One drug was applied only once during a single penetration.
Figure 1.
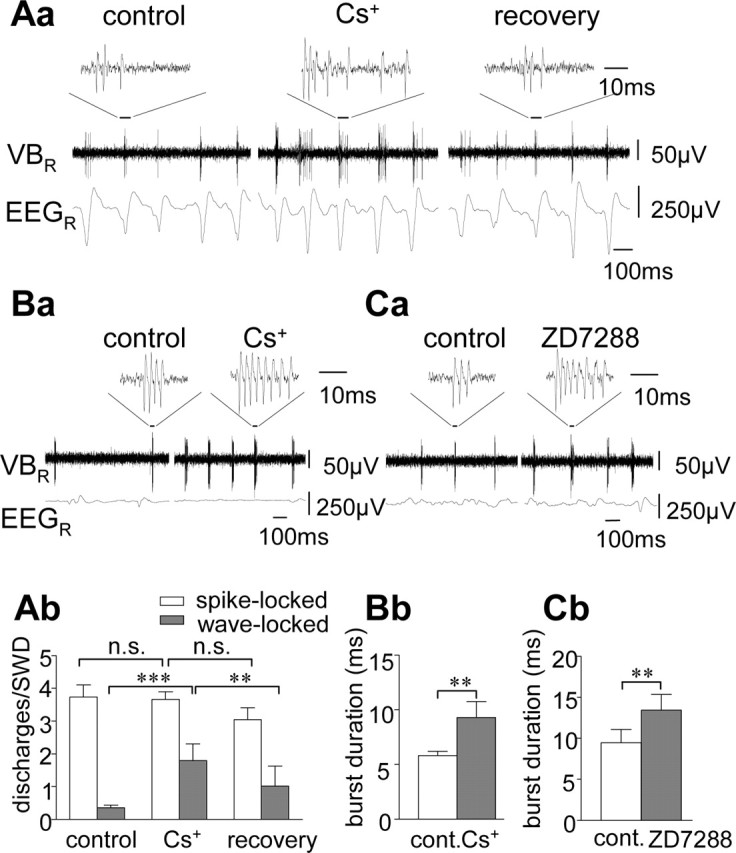
Effect of Ih blockade on unit discharges in the VB in WAG/Rij in vivo. A, Effect of microiontohoretic application of Cs+ on SWD-related VB activity recorded under neurolept anesthesia (Aa) SWD on the EEG recorded from the right hemisphere (bottom trace), single-unit recording in the right VB (middle trace), and expanded-unit recording (top trace) before (control), during, and after (recovery) microiontophoretic application of cesium (Cs+). Note the spike-locked burst firing of the VB unit and prolongation of burst firing during action of Cs+. Ab, Histograms of spike-locked (open bars) and wave-locked (filled bars) unit discharges per SWD on the EEG before (control), during, and after (recovery) application of Cs+. Data are averaged from recordings of 12 VB units. B, Effect of Cs+ on burst firing in a VB unit during pentobarbital anesthesia (Ba) and averaged data from nine VB units (Bb) showing burst duration before (control) and during action of Cs+. C, Effect of ZD7288 on burst firing in a VB unit during deep neurolept (Ca) and averaged data from 10 VB units (Cb) showing burst duration before (control) and during action of ZD7288. **p < 0.01; ***p < 0.0005. n.s., Not significant; cont., control; R, right. Error bars represent SEM.
Ih was activated using hyperpolarizing voltage steps from a holding potential of -50 mV (-40 mV in some experiments) to -130 mV (-120 mV in some experiments) in 10 mV increments. To increase stability of whole-cell recordings, the pulse length was decreased by 500 ms with increasing depth of the hyperpolarization (1.5 s pulse length at -130 mV). In subset of cells protocols eliciting long hyperpolarizations ranging from 15.5 s at -50 mV to 3.5 s at -130 mV (1.5 s decrement) were used for comparison. Steady-state activation of Ih, p(O), was estimated by normalizing the tail current amplitudes (I), 50 ms after stepping to a constant potential from a variable amplitude step using the following equation: p(O) = (I - Imin)/(Imax - Imin), with Imax being the tail current amplitude for the voltage step from -130 mV (in some experiments -120 mV) to -80 mV (-90 mV in some experiments) and Imin for the voltage step from -40 mV (in some experiments -50 mV) to -80 mV (-90 mV in some experiments), respectively. Ih activation was usually well accounted for a Boltzmann distribution of the following form: p(O) = 1/(1 + exp((V - Vh)/k)), where Vh is the voltage of half-maximal activation and k the slope factor.
The fully activated current versus voltage relationship was obtained from instantaneous tail currents. Ih was evoked by a hyperpolarizing step to -120 mV from a holding potential of -50 mV. The poststep test potential was varied between -110 and -60 mV in 10 mV increments. The tail current amplitude was plotted against the test pulse potential, fitted using a linear regression, and fully activated conductance and reversal potential were taken from slope and zero-crossing, respectively.
The density of Ih was determined from 20 randomly chosen cells and calculated by dividing the Ih current amplitude at -120 mV by the membrane capacitance obtained during whole-cell recordings.
The time course of Ih activation in TC neurons in several species is best approximated by a single-exponential function (Pape, 1996), a finding that is corroborated by the present study. The following equation was used: Ih (t) = Ao + A1 × e-t/τ, where Ih (t) is the amplitude of the current at time t, and A0/A1 and τ are amplitude coefficients and the time constant, respectively.
During experiments with 8-bromo-cAMP added to the recording pipette, properties of Ih were determined after a steady state of cAMP action had been reached, as indicated by constant Ih activation kinetics and Ih amplitude at a given hyperpolarizing voltage step (∼5 min after obtaining the whole-cell configuration). Data were included for analysis when a stable Vh value was obtained in three or more consecutive activation protocols.
All results were presented as mean ± SEM. Statistical analysis was performed using the two-tailed nonparametric Wilcoxon pair test or the Mann-Whitney U test, as applicable. Differences of p < 0.05 were considered statistically significant.
Drugs
ZD7288, CsCl, and 8-bromo-cAMP (Sigma) were prepared as stock solutions in water and dissolved directly in the external and internal recording solution, respectively. IBMX and 9-(tetrahydro-2-furanyl)-9H-purin-6-amine (SQ22.536) were obtained from Sigma and prepared as stock solutions in DMSO. The final solvent concentration did not exceed 1%. At this concentration, DMSO had no effect on the investigated ion currents. 8-Bromo-cAMP was applied in two different ways: (1) To follow the effect over time, 8-bromo-cAMP was added in a concentration of 1 mm to the extracellular medium (experiments shown in Figs. 3, 5, and 6). (2) To construct a dose-response curve of the 8-bromo-cAMP effect (experiments shown in Fig. 4), we added defined concentrations to the pipette solution.
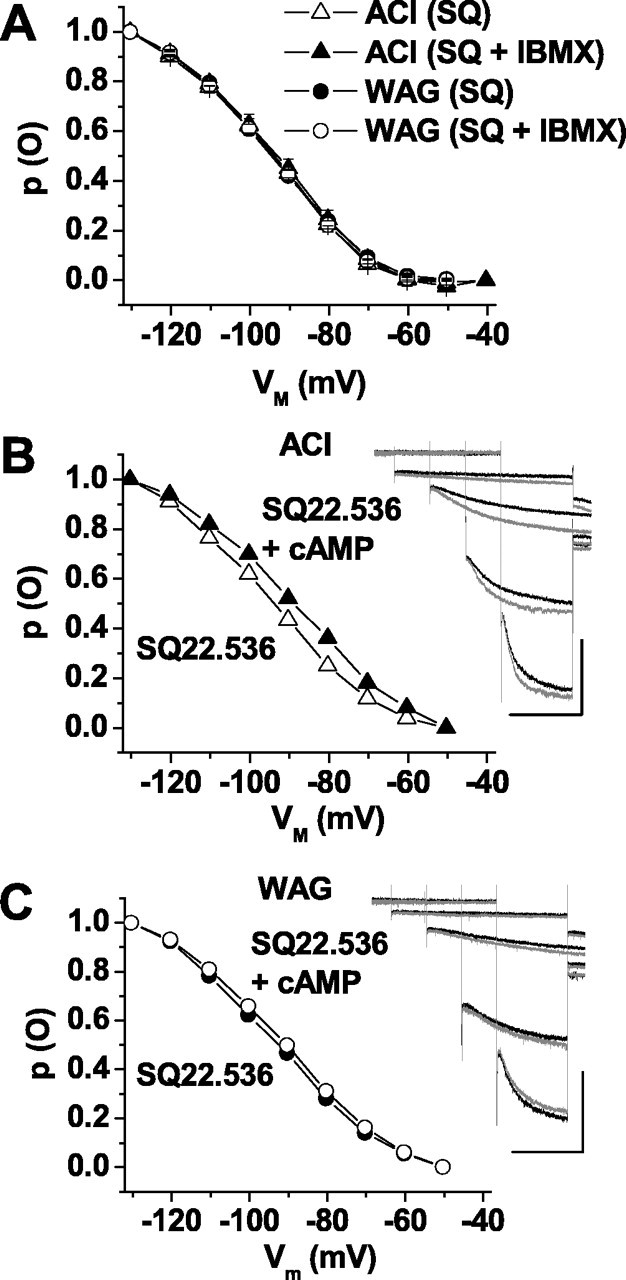
Figure 3.

Modulation of Ih by exogenously applied cAMP and by endogenous cAMP production. Families of current traces recorded in TC neurons of ACI (A, C) and WAG/Rij (B, D) rats under control conditions (black traces) and during substance application (gray traces; A, B, 1 mm 8-bromo-cAMP; C, D, 100 μm IBMX). Current traces at -60, -90, -110, and -130 mV are shown. Calibration bars: 2 s, 300 pA. The main panels show the corresponding steady-state activation curves derived from the same cells. The solid lines represent best fits of a Boltzmann distribution to the data points. cAMP effect: ACI control (open triangles in A), Vh = -84 mV, k = -13 mV; ACI cAMP (filled triangles in A), Vh = -78 mV, k = -12 mV; WAG/Rij control (closed circles in B), Vh = -87 mV, k = -11 mV; WAG/Rij cAMP (open circles in B), Vh = -84 mV, k = -10 mV. IBMX effect: ACI control (open triangles in C), Vh = -89 mV, k = -12 mV; ACIIBMX (filled triangles in C), Vh = -82 mV, k = -11 mV; WAG/Rij control (filled circles in D), Vh = -97 mV, k = -16 mV; WAG/Rij IBMX (open circles in D), Vh = -94 mV, k = -14. WAG, WAG/Rij.
Figure 5.
Modulation of Ih after adenylyl cyclase inhibition. A, Mean steady-state activation curves of Ih in dLGN after preincubation with SQ22.536 (300 μm; ACI, open triangles; WAG/Rij, filled circles) and consecutive application of IBMX (100 μm; ACI, open circles; WAG/Rij, filled circles). B, C, Families of current traces recorded in dLGN neurons of ACI (B) and WAG/Rij (C) rats after preincubation with SQ22.536 (300 μm; black traces) and subsequent extracellular application of 8-bromo-cAMP (1 mm; gray traces). Current traces at -60, -90, -110, and -130 mV are shown. Calibration bars: 2 s, 300 pA. The main panels show the corresponding steady-state activation curves derived from the same cells [ACI control (open triangles in B), Vh = -95 mV, k = -16 mV; ACI cAMP (filled triangles in B), Vh = -88 mV, k = -17 mV; WAG/Rij control (filled circles in C), Vh = -94 mV, k = -17 mV; WAG/Rij cAMP (open circles in C), Vh = -91 mV, k = -17 mV]. WAG, WAG/Rij; SQ, SQ22.536.
Figure 6.

Effect of cAMP on thalamic activity modes. TC neurons were recorded under current-clamp conditions. Action potential firing was elicited by 300 ms depolarizing current pulses (50-75 pA) from a holding potential of about -71 mV. Calibration bars: 100 ms, 20 mV. A, D, Endogenous and exogenous increases in intracellular cAMP levels by application of IBMX (100 μm; A) and 8-bromo-cAMP (1 mm; D) resulted in a reversible depolarization of the membrane potential. The horizontal bars indicate duration of substance application. B, C, E, F, Under control conditions (top voltage traces), depolarizing current steps elicited burst responses in both rat strains. Application of IBMX (B, C; middle traces) and 8-bromo-cAMP (E, F; middle traces) resulted in a change from burst to tonic firing only in ACI (B, E) but not WAG/Rij (C, F) rats.
Figure 4.
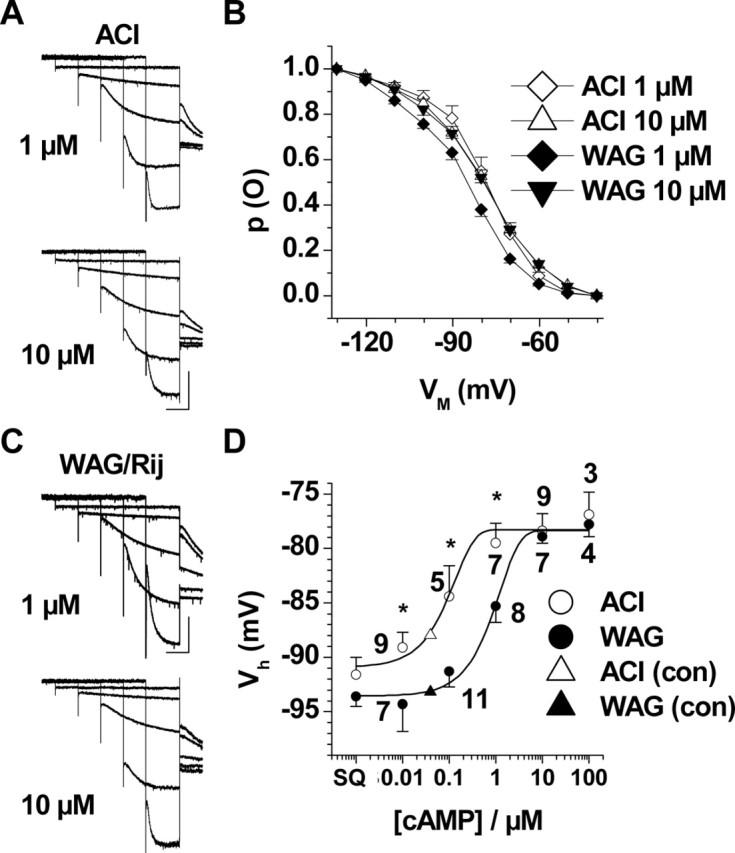
Modulation of Ih by defined intracellular cAMP concentrations. A, C, Families of current traces recorded in TC neurons of ACI (A) and WAG/Rij (C) rats obtained after loading of the cells with 1 μm (top) and 10 μm (bottom) 8-bromo-cAMP. Current traces at -50, -70, -90, -110, and -130 mV are shown. Calibration bars: 1 s, 300 pA. B, Mean steady-state activation curves of Ih at different intracellular cAMP concentrations in TC neurons from ACI (1 μm cAMP, open diamonds, n = 5; 10 μm cAMP, open triangles, n = 9) and WAG/Rij (1 μm, filled diamonds, n = 11; 10 μm, filled triangles, n = 7). D, Dose-response curve of cAMP applied via the intracellular solution. The mean half-maximal activation of Ih is plotted against the cAMP concentration for TC neurons from ACI (open circles) and WAG/Rij (filled circles). The numbers near the symbols indicate number of recorded cells; differences between epileptic and nonepileptic strains are significant (*p < 4.7 × 10⁻²) at 0.01, 0.1, and 1 μm cAMP. The triangles indicate endogenous cAMP levels in TC neurons of ACI (open triangle) and WAG/Rij (filled triangle), as extrapolated from the values of half-maximal Ih activation with no addition of cAMP to the recording pipette (see Fig. 2 B). WAG, WAG/Rij; con, control. Error bars represent SEM.
Molecular biological and biochemical experiments
In situ hybridization. WAG/Rij and ACI rats (21 d of age) were anesthetized deeply using halothan. Brains were removed and frozen in -50°C isopentane. Cryostat coronal sections of 16 μm thickness were cut at the level of the dLGN, thaw-mounted onto silane-coated slide glasses, and air dried. Digoxigenin-labeled antisense and sense riboprobes were generated by in vitro transcription from vectors containing cDNA of rat HCN1 (corresponding to base pairs 2562-2787), HCN2 (base pairs 1879-2143), and HCN4 (base pairs 2938-3221). In situ hybridization was performed as described previously (Meuth et al., 2003). In brief, sections were fixed in 4% paraformaldehyde, washed three times in PBS for 5 min followed by acetylation, and then prehybridized for 2 h at 55°C. The prehybridization solution consisted of 50% formamide, 5× SSC, 1× Denhardt's solution, 0.5 mg/ml yeast tRNA, and 1.0 mg/ml total yeast RNA. For hybridization, sections were exposed in 50% formamide, 1× Denhardt's solution, 0.1 mg/ml yeast tRNA, 0.1 mg/ml total yeast RNA, 10% dextran sulfate, 0.125% SDS, 10 mm Tris-HCl, pH 7.5, 1 mm EDTA, and 300 mm NaCl. Digoxigenin-labeled RNA probes were added (with a final concentration of 50 pg/ml prehybridization buffer), and sections were incubated at 55°C for 16-18 h. For all steps, RNase-free solutions were used. After hybridization, sections were subjected to washes of increasing stringency including 2× SSC at room temperature (once for 2 min), 50% formamide/2× SSC at 60°C (twice for 60 min), 2× 50% formamide/0.2× SSC at 60°C (twice for 90 min), and 0.1× SSC at 60°C (once for 90 min). Labeled cells were detected with an anti-digoxigenin antibody tagged with alkaline phosphatase (1:500; Roche, Mannheim, Germany). Staining was performed using 4-nitro blue tetrazolium chloride and 5-bromo-4-chloro-3-indolyl phosphate as substrates (Roche).
Specificity of the hybridization reaction was verified by substituting labeled sense probes for the antisense probes. No labeling was observed under these conditions.
In situ hybridization combined with immunocytochemistry. For double labeling, fresh-frozen sections were processed first for in situ hybridization for HCN1 (except an acetylation step). After hybridization and washing, sections were treated with Proteinase K (1 μg/ml) for 30 min, then subjected to 0.3% H2O2 for 30 min and intensively washed. A rabbit polyclonal antibody to parvalbumin (1:1000; SWANT, Bellinzona, Switzerland) was added together with an anti-digoxigenin antibody in 2% normal goat serum, 2% BSA, 0.3% Triton X-100 in TBS. The anti-parvalbumine antibody was detected using a biotinylated anti-rabbit antibody (1:200; Vector Laboratories, Burlingame, CA) after in situ detection. For immunohistochemical visualization, an avidin-biotin-peroxidase system (ABC-Kit; Vector Laboratories) with 3,3′-diaminobenzidine as chromogen (0.02% solution in 0.005% H2O2) was used.
Reverse transcription-PCR assays. Poly(A) mRNA was prepared from freshly dissected tissue by extraction with Trizol reagent according to the manufacturer's instructions (Oligotex; Qiagen, Hilden, Germany). First-strand cDNA was primed with oligo(dT) from 0.5-1 μg of mRNA and synthesized using the SuperScript II enzyme (Invitrogen, San Diego, CA) at 42°C for 50 min. PCR amplification was performed in 30 μl of reaction mixture containing 0.75 U Taq polymerase (Qiagen), 1.5 mm MgCl2, 0.2 mm of each dNTP, and 50 pmol of each primer with following cycling protocol: 3 min at 94°C, then 35 cycles of 94°C for 30 s, 58°C for 1 min, 72°C for 1 min, with a final elongation of 7 min at 72°C. The following intron spanning primer pairs were used: β-actin (nucleotides 253-1080; GenBank accession number NM_031144), forward, ATT TGG CAC CAC ACT TTC TAC AAT, reverse, CTG CTT GCT GAT CCA CAT CTG C; glyceraldehyde-3-phosphate dehydrogenase (G3PDH; nucleotides 561-1012; GenBank accession number AB017801), forward, ACC ACA GTC CAT GCC ATC AC, reverse, TCC ACC ACC CTG TTG CTG TA; HCN1 (nucleotides 1462-1750; GenBank accession number AF247450), forward, CTC TCT TTG CTA ACG CGG AT, reverse, TTG AAA TTG TCC ACC GAA; HCN2 (nucleotides 1059-1428; GenBank accession number AF247451), forward, GTG GAG CGA ACT CTA TTC GT, reverse, GTT CAC AAT CTC CTC ACG CA; HCN3 (nucleotides 1713-1945; GenBank accession number AF247452), forward, GCA GCA TTT GGT ACA ACA CG, reverse, AGC GTC TAG CAG ATC GAG C; and HCN4 (nucleotides 1871-2042; GenBank accession number AF247453), forward, GCA GCG CAT CCA CGA CTA C, reverse, CGT CAC AAA GTT GGG GTC TGC.
Semiquantitative reverse transcription-PCR. The optimal number of cycles required for the detection of products in the linear range of amplification was determined for each combination of cDNA-primer pairs. The levels of mRNAs from both ACI and WAG/Rij rat tissues were normalized to each other using the constitutively expressed housekeeping genes G3PDH and β-actin. Serial dilutions prepared from cDNA samples of WAR/Rij and ACI rats were used for comparative quantification of the HCN isoforms. Furthermore, each round of analysis included the coamplification of house-keeping genes to control the ratio of amplified cDNAs more precisely. Quantification of each gene is achieved by the densitometric analysis of PCR products followed by calculation of the expression difference determined as a ratio of the PCR product of the WAG/Rij gene to the PCR product of the ACI gene. Each target gene was amplified a minimum of three separate times.
Quantitative real-time PCR. The hybridization primer/probe assays for real-time PCR detection were purchased as assays-on-demand from Applied Biosystems (Foster City, CA). Real-time PCR was performed using the Taq-Man universal PCR master mix (Applied Biosystems) and the ABI Prism 7000 sequence detection system (Applied Biosystems). The PCR program was the following: 2 min at 50°C, 10 min at 95°C, 50 cycles of 15 s at 95°C and 1 min at 60°C. Results were analyzed with the ABI Prism 7000 SDS software. The efficiency of real-time primer/probes was nearly identical. Quantification was done using the comparative CT or ΔΔCT method as described in the ABI User Bulletin #2 (Applied Biosystems). Hybridization primer/probe assays for real-time PCR detection were purchased from Applied Biosystems (HCN1, Rn00584498_m1; HCN2, Rn01408575_gH; HCN3, Rn00586666_m1; HCN4, Rn00572232_m1; β2-microglobulin, Rn00560865_m1). Hybridization primer/probe assays for real-time PCR detection were purchased from Applied Biosystems (HCN1, Rn00584498_m1, exon boundary, 2/3; HCN2, Rn01408575_gH, exon boundary, 6/7; HCN3, Rn00586666_m1, exon boundary, 6/7; HCN4, Rn00572232_m1, exon boundary, 6/7; β2-microglobulin, Rn00560865_m1).
Western blot. Protein samples were separated by 10% SDS-PAGE and electroblotted onto nitrocellulose membrane. Blots were blocked and incubated with the primary antibody (HCN1, rat polyclonal IgG, 1:400, Alomone Labs, Jerusalem, Israel; β-actin, mouse monoclonal IgG1, 1:2000, Abcam, Cambridge, MA) for 2 h and room temperature. Primary antibodies were then detected using peroxidase-conjugated anti-rat and anti-mouse Igs (1:2000 for each antibody; DakoCytomation, High Wycombe, UK) followed by visualization (ECL plus Western blotting detection system; Amersham Biosciences, Braunschweig, Germany). Quantification of comparative HCN1 expression is achieved by the densitometric analysis of protein bands followed by calculation of the expression difference determined as a ratio of the normalized expression of WAG/Rij HCN1 to the normalized ACI HCN1 expression.
Results
Effect of Ih current blockers on SWD-related thalamic activity in vivo
In a first experimental step, we evaluated the possible involvement of Ih during SWD-related activity in thalamic neurons of the VB during spontaneous absence seizures in WAG/Rij in vivo. The VB was chosen because it contains mostly TC neurons in the rat, and SWD-related activity is well documented (Renier and Coenen, 2000). All rats of the WAG/Rij strain investigated under standard neurolept anesthesia in the present study (n = 20) spontaneously developed bilaterally synchronized SWD at ∼5 Hz on the epidural EEG, which started and ended on a normal back-ground pattern (Inoue et al., 1993, 1994). Unit activity in the VB during SWD was similar to that described previously (Inoue et al., 1993, 1994; Seidenbecher et al., 1998; Staak and Pape, 2001) in that synchronized burst firing occurred with the SWD component on the EEG (Fig. 1A). EEG spike-triggered analysis revealed the phase-locking of unit activity in the VB with the spike component on the EEG (Fig. 1A). Microiontophoretic application of the Ih blocker cesium (Cs+) resulted in a prolongation of seizure-related single-unit burst firing in the VB, thereby increasing unit activity correlated with the wave component on the EEG from an average of 0.36 ± 0.07 discharges per SWD under control conditions to 1.80 ± 0.51 (n = 12) (Fig. 1A). Spike-locked unit activity was not affected by Cs+ (3.74 ± 0.37 vs 3.66 ± 0.24; n = 12). Recovery was obtained within 2-10 min after cessation of drug application (Fig. 1A). Microiontophoretic application of the Ih blocker ZD7288 at 0.2 mm (n = 7; data not shown) significantly enhanced wave-locked activity (from 0.16 ± 0.04 to 0.71 ± 0.12 discharges per SWD) and did not influence spike-locked activity (3.06 ± 0.30 vs 3.12 ± 0.40; n = 7), thereby resembling the effect of Cs+. Furthermore, ZD7288 resulted in an overall depression of activity in the VB, as indicated by an increase in the percentage of SWD on the EEG that were not accompanied by burst firing in the VB (from 5.2 ± 2.1% under control conditions to 36.3 ± 9.9% during ZD7288; p < 2 × 10⁻²). Effects of local application of Cs+ or ZD7288 on the SWD components on the EEG were not observed. At higher concentrations (2 mm), ZD7288 strongly blocked SWD-locked burst firing in the VB. In remaining bursts, both the spike-locked and the wave-locked discharges were significantly (p < 5 × 10⁻⁴) reduced during action of ZD7288 compared with control conditions (spike-locked, 4.23 ± 0.44-2.08 ± 0.39 discharges per SWD; wave-locked, 0.72 ± 0.16-0.33 ± 0.06; n = 12; data not shown). A comparable depressant effect was not observed during application of Cs+, and therefore it seems reasonable to conclude that the depressant effect of ZD7288 observed in the present study reflects the inhibitory influence on glutamatergic synaptic transmission (Chevaleyre and Castillo, 2002) or low-threshold Ca2+ channels (Felix et al., 2003). Under pentobarbital or deep neurolept anesthesia (see Materials and Methods), SWDs were primarily suppressed, and unit activity in the VB was dominated by randomized burst discharges. Microiontophoretic application of Cs+ (n = 9) and ZD7288 (0.2 mm; n = 10) under these conditions significantly increased the duration of burst discharges by an average of 57.6 ± 17.6% (p < 1 × 10⁻²) and 45.8 ± 7.3% (p < 1 × 10⁻²), respectively (Fig. 1B,C). These data indicated that Ih contributes to burst discharges in VB TC neurons of WAG/Rij, both during seizure-related SWD and during seizure-free states, and, more specifically, that a reduction of Ih results in a prolongation of SWD-related burst firing.
Ih properties in TC neurons of epileptic and a nonepileptic rat strains
Next, we used in vitro slice preparations to investigate the basic properties of Ih in TC neurons in VB and the dLGN of epileptic WAG/Rij and compared them with those of the specific nonepileptic ACI strain and control strains with lesser or undetermined epileptic susceptibility (Wistar, Long-Evans). A series of hyperpolarizing voltage steps (ranging from 15.5 s at -50 mV to 3.5 s at -130 mV) elicited a slow inward current exhibiting typical Ih-like characteristics in dLGN TC neurons of ACI (Fig. 2A, left) and WAG/Rij (Fig. 2A, right). The construction of steady-state activation curves from tail currents in animals older than P15 revealed that the Vh in ACI rats (Vh = -85.3 ± 2.1 mV; n = 16) was significantly (p < 2 × 10⁻²) shifted to more positive potentials compared with WAG/Rij (Vh = -92.3 ± 1.4 mV; n = 14) (Fig. 2B). Because long hyperpolarization was not readily tolerated by TC neurons, shortened activation protocols ranging from 5.5 s at -50 mV to 1.5 s at -130 mV (Ludwig et al., 2003) were used in the following and gave rise to very similar results. The construction of steady-state activation curves revealed Vh values in ACI (-88.0 ± 0.5 mV; n = 79) and WAG/Rij (Vh = -93.2 ± 0.6 mV; n = 59), which were significantly (p < 1 × 10⁻⁴) more positive in nonepileptic rats. Interestingly, two other rat strains, Wistar (Vh = -88.2 ± 0.6 mV; n = 42) and Long-Evans (Vh = -84.6 ± 1.3 mV; n = 14), revealed values of half-maximal Ih activation in dLGN TC neurons resembling those in the nonepileptic control strain (data not shown). Similar differences in Ih voltage dependency were observed in TC neurons recorded in the VB (ACI, Vh = -83.1 ± 0.8 mV, n = 19; WAG/Rij, Vh = -85.9 ± 0.8 mV, n = 14; p < 5 × 10⁻³), although the steady-state activation of Ih in the VB was more depolarized compared with that in the dLGN (data not shown). The differences in Ih steady-state activation properties between TC cells from epileptic and nonepileptic animals were associated with differences in the time course of activation of Ih at a given membrane potential. Activation of Ih was well described by a monoexponential function in dLGN neurons of the two strains (Fig. 2C), and the time constant of Ih activation in WAG/Rij was significantly below that in ACI (Fig. 2D). Importantly, time constants of Ih activation were also different in the two strains at the voltage of maximal activation (Fig. 2D). In contrast, the current/voltage (I/V) relationship of the fully activated Ih conductance was not different in dLGN neurons from ACI (slope, 13 ± 1 mS; reversal potential, -40 ± 2 mV; n = 10) and WAG/Rij (slope, 16 ± 1 mS; reversal potential, -38 ± 1 mV; n = 11). Furthermore, the Ih current density was not different in the two rat strains (WAG/Rij, 3.2 ± 0.2 pA/pF, n = 20; ACI, 3.4 ± 0.2 pA/pF, n = 20).
Figure 2.

Basic electrophysiological properties of Ih in TC neurons in the dLGN of epileptic and nonepileptic rat strains. A, Families of current traces recorded in a TC neuron of ACI (left) and WAG/Rij (right) rats. Current traces at -50, -70, -90, -110, and -130 mV are shown. Calibration bars: 2 s, 300 pA. B, Mean steady-state activation curves of Ih under control conditions in TC neurons of ACI (open triangles; n = 16) and WAG/Rij (filled circles; n = 14) rats. Note the positive shift of the activation curve in ACI rats. C, Monoexponential fits (continuous lines) to Ih current traces elicited by a step from -50 to -130 mV in ACI (open triangles) and WAG/Rij (filled circles) rats. D, Mean time constants of Ih activation plotted semilogarithmically against the step potential in TC neurons of ACI (open bars; n = 24) and WAG/Rij (WAG; filled bars; n = 16) rats. All differences between the two rat strains were statistically significant (p < 3 × 10⁻²).
Differences in cAMP-mediated regulation of Ih in TC neurons from epileptic and nonepileptic animals
One characteristic property of HCN channels is the cAMP-evoked positive shift in the steady-state voltage dependence (S. Chen et al., 2001). Extracellular application of a membrane-permeable cAMP analog (8-bromo-cAMP; 1 mm) to dLGN TC neurons of ACI significantly (p < 6 × 10⁻⁷) shifted the midpoint of Ih activation by 5.1 ± 1.0 mV (n = 15) to more positive potentials (Fig. 3A), thereby resembling the effect of 8-bromo-cAMP in dLGN neurons of various species (McCormick and Pape, 1990; Budde et al., 1997). By comparison, in the same type of neuron in WAG/Rij, the shift in the Vh value induced by 8-bromo-cAMP (1 mm) averaged 2.3 ± 0.3 mV (n = 12; p < 2 × 10⁻⁴) (Fig. 3B). The difference between the two strains was significant (p < 2 × 10⁻²). Similar differences (p < 8 × 10⁻³) were observed after application of the phosphodiesterase inhibitor IBMX (100 μm) in that Vh was positively shifted by 5.6 ± 0.7 mV (n = 14; p < 4 × 10⁻⁶) (Fig. 3C) in ACI rats and by 2.6 ± 0.5 mV in WAG/Rij (n = 10; p < 3 × 10⁻³) (Fig. 3D).
To ensure that the same levels of cyclic nucleotides were reached in the two rat strains, dLGN TC neurons were recorded with defined concentrations of 8-bromo-cAMP (range, 0.01-100 μm) included in the pipette solution. After stable recordings had been obtained at a defined 8-bromo-cAMP concentration under whole-cell conditions (see Materials and Methods), the time course and activation range of Ih were determined. The data revealed significant (p < 4.7 × 10⁻²) differences between dLGN TC neurons from WAG/Rij and ACI at a range of 0.01-1 μm 8-bromo-cAMP but not at higher concentrations (10-100 μm). Data are illustrated in Figure 4. For instance, the midpoint of Ih activation at 1 μm 8-bromo-cAMP (Fig. 4A,C) was significantly (p < 3 × 10⁻²) different between ACI (-79.5 ± 1.8 mV; n = 7) and WAG/Rij (-85.3 ± 1.5 mV; n = 8) (Fig. 4B), whereas activation curves at 10 μm 8-bromo-cAMP (Fig. 4B) were indistinguishable between the two strains (ACI, -78.4 ± 1.6 mV, n = 9; WAG/Rij, -78.9 ± 0.6, n = 7) (Fig. 4A,C). For comparison, the longer activation protocol (see above) was used at an intracellular 8-bromo-cAMP concentration of 0.1 μm and revealed significant (p < 1 × 10⁻⁵) differences between ACI (-76.7 ± 1.3 mV; n = 14) and WAG/Rij (-91.8 ± 1.1 mV; n = 14). Furthermore, activation time constants of Ih were highly cAMP dependent. For instance, in ACI, the time constants of Ih during a pulse step from -40 to -80 mV ranged from 5637 ± 223 ms (n = 5) at 0.01 μm to 2997 ± 481 (n = 9) at 100 μm. By comparison, activation of the respective Ih in WAG/Rij rats was typically faster, ranging from 5022 ± 216 ms (n = 11) at 0.01 μm to 2983 ± 185 ms (n = 7). Differences of Ih activation kinetics between the two strains were significant (p < 1.4 × 10⁻²) under control conditions (no added cAMP; see above) and at 0.01 μm 8-bromo-cAMP (data not shown). The dose-dependent effect is summarized in Figure 4D, in which the mean half-maximal activation of Ih is plotted against the 8-bromo-cAMP concentration. For comparison, values of Ih activation under control conditions (with no added cAMP; see above) and under conditions of deprived intracellular cAMP (through blockade of adenylyl cyclase by SQ22.536; see below) have been added to Figure 4D. The data show that Ih is also responsive to cAMP in TC neurons from epileptic animals, but at a higher range of concentrations compared with TC neurons from nonepileptic animals.
Next, we investigated the possibility that the ambient level of cAMP may have contributed to the observed difference in Ih properties between the epileptic and nonepileptic strains. Thalamic slices were preincubated with the adenylyl cyclase inhibitor SQ22.536 (300 μm, 45 min) before electrophysiological recordings. Under these conditions, the Ih activation curves were no longer different between the two rat strains in TC neurons of the dLGN (ACI, Vh = -91.6 ± 1.3 mV, n = 18; WAG/Rij, Vh = -93.6 ± 0.9 mV, n = 18) (Figs. 5A, 4D) and the VB (ACI, Vh = -85.9 ± 1.1 mV, n = 11; WAG/Rij, Vh = -84.3 ± 0.7 mV, n = 10; data not shown). Application of IBMX to SQ22.536-treated slices had no influence on Ih in dLGN TC neurons from ACI (Vh = -93.5 ± 1.7 mV; n = 3) and WAG/Rij (Vh = -95.3 ± 1.6 mV; n = 4) (Fig. 5A), indicating an effective block of basal adenylyl cyclase activity by SQ22.536. Nevertheless, extracellular application of 8-bromo-cAMP (1 mm) significantly shifted the Ih activation curve to more positive potentials in TC neurons both from ACI (9.7 ± 1.5 mV; n = 8; p < 2 × 10⁻⁴) (Fig. 5B) and WAG/Rij (4.4 ± 1.3 mV; n = 9; p = 1 × 10⁻²) (Fig. 5C), but the effect was significantly smaller in WAG/Rij than in ACI (p < 2 × 10⁻²). Together, these data indicated a reduction in cAMP sensitivity of Ih in TC neurons from epileptic and nonepileptic rats.
cAMP-induced changes in activity mode of TC neurons
TC neurons can generate two different patterns of electrical activity, dependent on the prevailing membrane potential (Steriade et al., 1997). At membrane potentials negative from rest, depolarizing stimuli elicit a burst of fast spikes triggered by a low threshold-activated T-type Ca2+ current; at membrane potentials positive to rest, IT is inactivated and depolarizing stimuli evoke tonic series of Na+/K+-mediated action potentials. We tested the possible functional relevance of altered Ih properties in dLGN TC neurons from WAG/Rij and ACI recorded under current-clamp conditions. Barium (Ba2+; 150 μm) was added to the bathing medium to block inwardly rectifying K+ currents, a cAMP-depending leakage current, and TWIK (tandem of P-domains in a weakly inward rectifying K+ channel)-related acid-sensitive K+ channels (Budde et al., 1997; Meuth et al., 2003), which interfere with activation of Ih at membrane potentials at or negative from rest. Under these experimental conditions, resting membrane potential (WAG/Rij, -64.1 ± 1.1 mV, n = 8; ACI, -61.0 ± 2.2 mV, n = 7) and input resistance (WAG/Rij, 2.8 ± 0.9 GΩ, n = 8; ACI, 2.0 ± 0.5 GΩ, n = 7) were not different in TC neurons in the two rat strains. To induce robust burst activity, TC neurons were held at a membrane potential of -70.9 ± 0.1 mV (n = 15). Under these conditions, depolarizing current pulses (50-75 pA, 300 ms duration) elicited typical low-threshold Ca2+-spikes (LTSs) with two to six fast Na+/K+ action potentials riding on top (Fig. 6). Application of 100 μm IBMX (9-10 min) to TC neurons of ACI resulted in a slow depolarization of the membrane potential to -64.7 ± 0.4 mV (n = 3) (Fig. 6A, open triangles). This effect was accompanied by a change in firing pattern from burst to tonic and was reversible (Fig. 6B). In contrast, application of IBMX to TC neurons in WAG/Rij evoked a depolarization from the holding potential to only -67.4 ± 0.4 mV (n = 4) (Fig. 6A filled circles), which was not sufficient to change the firing pattern from burst to tonic (Fig. 6C). The average depolarizing effect of IBMX was significantly (p < 1 × 10⁻³) smaller in WAG/Rij compared with ACI. Similar results were obtained after application of 8-bromo-cAMP (1 mm, 14-15 min) in that the resulting depolarization shifted the firing pattern from burst to tonic in TC neurons from ACI but not WAG-Rij (Fig. 6E,F). On average, the 8-bromo-cAMP-evoked depolarization was significantly (p < 1 × 10⁻³) smaller in WAG/Rij (-67.3 ± 0.2 mV; n = 3) (Fig. 6D filled circles) compared with ACI (-66. 3 ± 0.2 mV; n = 4) (Fig. 6D, open triangles).
Reverse transcription-PCR analysis of HCN isoform expression
To test whether the differences in Ih properties observed in TC neurons from ACI and WAG/Rij are based on differences in HCN gene expression, we designed a multiplex reverse transcription-PCR (RT-PCR) protocol to simultaneously detect HCN1-4 channels in rat brain slices. In the dLGN of both strains, mRNA of the four HCN isoforms was detected. Whereas HCN2, HCN3, and HCN4 revealed strong PCR signals, HCN1 mRNA was detectable in WAG/Rij rats but barely expressed in ACI rats (Fig. 7A). Next, we used semiquantitative PCR analysis of all HCN isoforms, with G3PDH and β-actin as internal standards, and assessed the expression of HCN isoforms from dLGN preparations in WAG/Rij and ACI (Fig. 7B). The mRNA expression level of the HCN1 isoform was 3.67 ± 0.04 times higher in WAG/Rij compared with ACI (p < 1 × 10⁻²; seven independent dLGN preparations were used for each rat strain and compared pair-wise during semiquantitative PCR analysis), whereas no significant differences were found for the mRNA expression of the other HCN isoforms in the two rat strains (ratio of expression WAG/Rij divided by ACI; HCN2, 0.89 ± 0.04; HCN3, 1.03 ± 0.07; HCN4, 0.92 ± 0.06). These findings were corroborated by two independent lines of evidence. A real-time RT-PCR approach (after normalization to a passive reference dye and mRNA of the housekeeping gene β2-microglobulin) indicated that HCN1 expression in WAG/Rij rats is 3.85 ± 0.53 times higher compared with ACI rats (p < 1 × 10⁻²; 10 independent dLGN preparations were used for each rat strain) (Fig. 7C). Furthermore, HCN1 protein levels were assessed through semiquantitative Western blot analysis of dLGN tissue using a HCN1-specific antibody (Fig. 7D). Data from multiple independent preparations revealed an increase in HCN1 protein level by a factor of 2.13 ± 0.18 in WAG/Rij compared with ACI (p < 1 × 10⁻²; eight protein preparations from dLGN were used for each rat strain).
Figure 7.
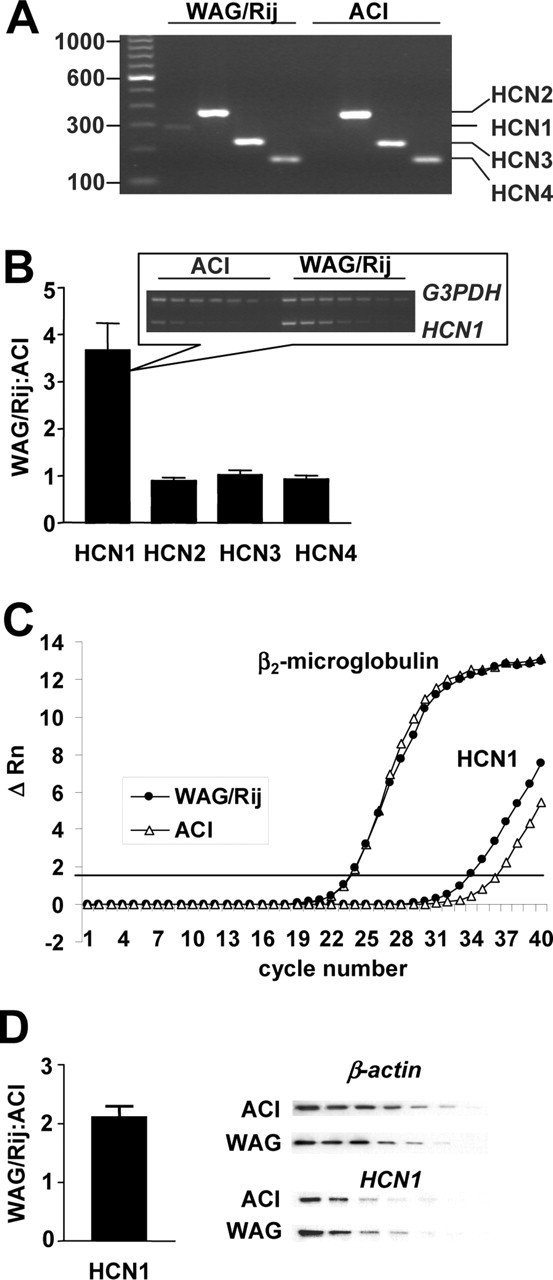
Expression pattern and level of HCN mRNA in dLGN. A, RT-PCR expression profiles of HCN1-4 after 30 amplification cycles, initial cDNA concentration of 10 pg. B, Differences in mRNA expression of HCN1-4 determined by semiquantitative RT-PCR; inset shows an example of a corresponding PCR profile. C, Real-time PCR amplification plots for HCN1 and β2-microglobulin. ΔRn, Normalized and baseline-corrected fluorescence signal. D, Protein expression of HCN1. WAG, WAG/Rij. Error bars represent SEM.
In a next experimental step, the expression of HCN isoforms in TC neurons was demonstrated through in situ hybridization and immunohistochemistry/in situ hybridization double labeling. The use of isoform-specific digoxigenin-labeled antisense RNA probes revealed a dense and strong expression of HCN2 and HCN4 mRNA in the dLGN of both rat strains (Fig. 8B,C). Furthermore, HCN1 mRNA was expressed weakly in ACI (Fig. 8A, right) but was readily detectable in WAG/Rij (Fig. 8A, left). To confirm that HCN1 isoforms are expressed in TC neurons, in situ hybridization for HCN1 was combined with immunohistochemical labeling of parvalbumin, a TC neuron-specific cell marker in the dLGN of several species (Jones and Hendry, 1989; Sieg et al., 1998; Meuth et al., 2005). The large majority of parvalbumin-positive neurons in the dLGN of WAG/Rij were positive for HCN1, whereas parvalbumin-immunonegative HCN1-positive neurons were rarely detected (Fig. 8D). The size and shape of double-labeled cells were reminiscent of multipolar neurons, which are thought to represent TC neurons in the dLGN (Gabbott et al., 1986). In a representative sample of slices (n = 16), 87 ± 2% of the parvalbumin-positive cells (n = 1687) were also positive for HCN1.
Figure 8.
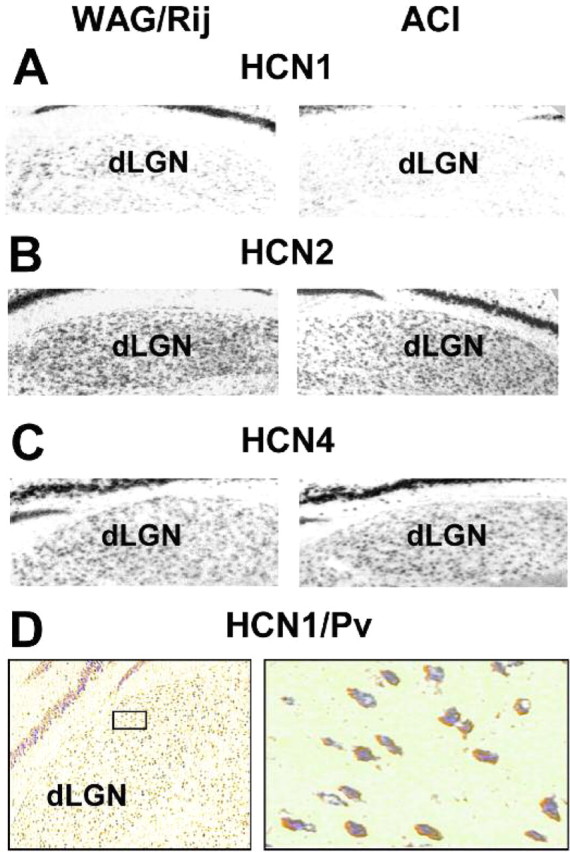
Cellular localization of HCN gene products in dLGN. A-C, In situ hybridization analysis of rat brain coronal sections for WAG/Rij (left) and ACI (right). Sections were labeled with riboprobes directed against HCN1 (A), HCN2 (B), and HCN4 (C). D, Combined in situ hybridization for HCN1 (blue) and parvalbumin (Pv) immunocytochemistry (brown) demonstrates expression of this HCN isoform in TC neurons.
Discussion
The present study indicates a recruitment of Ih in TC neurons during spike-and-wave discharges accompanying spontaneous seizures in a rat model of absence epilepsy, an alteration of the basic electrophysiological properties of Ih, and increased expression of HCN1 in TC neurons of epileptic WAG/Rij rats compared with nonepileptic control strains (ACI). Functionally, the reduced responsiveness to cAMP prevents the shift from burst to tonic firing modes after increases in the intracellular cAMP level occurring at ages before spontaneous seizure activity is evident (Renier and Coenen, 2000). Therefore, the alteration in Ih properties may relate to the generation of seizures rather than being induced by seizures.
Expression of HCN isoforms related to Ih properties in TC neurons
The four HCN channels display different voltage-dependent properties and modulation by cAMP, there is evidence for the formation of heteromeric channels, and the properties of Ih recorded in various cell types correlate with the mRNA expression profile of HCN genes (Santoro et al., 2000; Much et al., 2003; Santoro and Baram, 2003). Of particular interest here is that HCN1 channels are characterized by fast kinetics of activation, a rather positive voltage range of activation, and low cAMP sensitivity (Santoro and Baram, 2003). Indeed, Ih in TC neurons, which mostly express HCN2 and HCN4, possesses slower kinetics and higher cAMP sensitivity than, for instance, Ih in CA1 pyramidal neurons, which mostly express HCN1 and HCN2 (Franz et al., 2000; Santoro et al., 2000). The following line of evidence indicates that the reduced cAMP sensitivity and faster kinetics of Ih activation observed in individual TC neurons from WAG/Rij rats compared with ACI seem is correlated with the increase in HCN1: (1) HCN1 expression mostly localizes to parvalbumin-immunopositive cells in thalamic relay nuclei, representing the population of TC neurons (Jones and Hendry, 1989; Sieg et al., 1998; Meuth et al., 2005). (2) The selective alteration in HCN1 expression, with unaltered HCN2-4 expression, in thalamic relay nuclei from epileptic versus nonepileptic animals, and the unchanged passive membrane properties and Ih current densities in the respective TC neurons, vote against more general influences, such as neuronal morphologies. (3) The difference in the Ih activation curve with no difference in the fully activated I/V observed in TC neurons between the two rat strains reflect the profile of cAMP action on Ih in these neurons (McCormick and Pape, 1990; Pape, 1996). (4) Negative shifts in the Ih activation curve in TC neurons are indicative of responses that are negatively coupled to the intracellular cAMP system (Pape, 1992). (5) The similar basal Ih activation curve and the difference in cAMP-evoked shifts of Ih activation during pharmacological blockade of endogenous adenylyl cyclase activity are explained best by a change in sensitivity toward cAMP. This finding also votes against the possible contribution of technical constraints, relating, for instance, to the somato-dendritic distribution of the Ih channels. (6) Differences in cAMP sensitivity of Ih occur at 0.01-1 μm but not at lower or higher concentrations of cAMP, thereby indicating a shift of the cAMP dose-response curve toward higher cyclic nucleotide concentrations, which is within the range of physiological cytosolic cyclic nucleotide levels (0.02-1.5 μm) and stimulus-induced concentrations changes (maximally 5 μm) (Adams et al., 1991; Trivedi and Kramer, 1998; Zaccolo et al., 2000; Heine et al., 2002). It should be taken into consideration that 8-bromo-cAMP may not well penetrate the slice and, thus, that the recordings obtained in 1 mm extracellular 8-bromo-cAMP are at steady state rather than at equilibrium. In line with the results obtained with defined concentrations of intracellular 8-bromo-cAMP, it may be concluded that 8-bromo-cAMP achieves no higher intracellular concentration than ∼1 μm, implying that the gating of Ih is only partially facilitated, although to a different extend, in the two rat strains.
The finding that an increase in HCN1, despite its rather low overall expression level, is associated with significant changes of Ih properties in TC neurons should be interpreted in light of the following evidence: (1) Ih in TC neurons appears to be dominated by HCN2 (80% reduction in amplitude in HCN2-deficient mice) and slowed in activation kinetics by the contribution of HCN4 (Franz et al., 2000; Santoro et al., 2000; Ludwig et al., 2003). (2) Heterologous expression studies indicate that HCN1 subunits impose a positive shift to the Ih activation curve associated with faster kinetics and low cAMP sensitivity (Robinson and Siegelbaum, 2003). (3) The activation range of HCN2, but not HCN1, depends on basal adenylyl cyclase activity (Ulens and Tytgat, 2001b). (4) Functional HCN1/HCN2 heteromers reveal steady-state activation properties and cAMP dependency that are rather HCN2 dominated, whereas activation time constants are rather HCN1 dominated (Ulens and Tytgat, 2001a). (5) In hippocampal areas, the ratio of HCN1 and HCN2 expression is changed in febrile seizures and leads to augmented formation of HCN1/HCN2 heteromerization (K. Chen et al., 2001; Brewster et al., 2002, 2005; Bender et al., 2003). The properties of Ih after febrile seizures resembles neither those of heterologously expressed homomeric HCN1 or HCN2 channels nor their arithmetic intermediates (S. Chen et al., 2001; Ulens and Tytgat, 2001a). (6) Therefore, it seems feasible to conclude that the basic range of steady-state voltage dependency and cAMP sensitivity of Ih in TC neurons is primarily determined through HCN2, whereas the slow activation kinetics reflects the contribution of HCN4. Addition of HCN1 can modulate Ih kinetics and basic cAMP responsiveness. As a result of the low overall expression level, an increase in HCN1 expression does not shift the Ih voltage dependence and kinetics from a HCN2/4-into a HCN1-dominated form but merely modulates the cAMP sensitivity within a physiological range of concentrations. The molecular elements connecting the increase in HCN1 expression to the decrease in cAMP sensitivity and altered voltage dependency are unknown at present but may relate to functional interactions between the various subunits in heteromultimeric Ih channels (Yu et al., 2001; Decher et al., 2003; Much et al., 2003), alterations in allosteric Ih regulation (Wang et al., 2002), and/or differences in cAMP/cGMP pathways known to affect Ih in TC neurons (Lüthi and McCormick, 1998a, 1999; Frere and Lüthi, 2004).
Regulation of HCN expression related to epileptic seizures
HCN gene expression changes as the consequence of developmental processes (Bender et al., 2001), neuronal activity (K. Chen et al., 2001), and epileptic seizures (Brewster et al., 2002; Bender et al., 2003). An increase in maximal Ih amplitude lowered the threshold of febrile seizures in rats (K. Chen et al., 2001) as well as neocortical SWD in the stargazer mouse (Di Pasquale et al., 1997). The balance of HCN1 and HCN2 expression may be critical for seizure activity because genetic knock-out of the HCN2 isoform (Ludwig et al., 2003) and a reduction of HCN1 protein expression in the neocortex (Strauss et al., 2004) is associated with absence-like activity in HCN2 knock-out mice and WAG/Rij rats, respectively. The present study extends those observations in that it reveals a selective increase in HCN1 expression in TC neurons of a rat genetic model of absence epilepsy, which is associated with an impaired cAMP-dependent Ih regulation and hence an impaired regulation of burst activity in the thalamus (see below). Together, the available evidence suggests a regional- and isoform-specific regulation of HCN gene expression related to seizure generation and/or epileptogenesis.
Contribution of Ih in TC neurons to spike-and-wave discharges
In TC neurons of two genetic rat models (WAG/Rij, GAERS), burst discharges are locked to the spike component on the EEG (Inoue et al., 1993; Seidenbecher et al., 1998). Spike-locked discharges in TC neurons, in turn, reflect bursts of action potentials triggered by a low-threshold T-type Ca2+ current, which are activated as rebound during barrages of GABAA-mediated IPSPs (Pinault et al., 1998; Staak and Pape, 2001; Destexhe and Sejnowski, 2003). An involvement of Ih in burst discharges of TC neurons during absence seizures is indicated by the present finding that local application of Ih blockers interfered with the strict spike-locked burst pattern. In thalamic slices, the periodic activation and deactivation of Ih is thought to shape the waxing and waning sequence of spindle-like burst firing in TC neurons, which is replaced by more irregular patterns during action of Ih blockers (Lüthi et al., 1998; Lüthi and McCormick, 1998a, 1999). The positive shift of the Ih activation curve resulting from an increase in intracellular cAMP concentration accompanying Ca2+-mediated burst firing is an important mechanism for termination of the bursts (Lüthi and McCormick, 1998b, 1999). In contrast, a negative shift in the Ih activation curve promotes burst firing in TC neurons in vitro (Pape, 1992). The increase in HCN1 expression, the decrease in cAMP sensitivity, and the negative shift of the activation curve of Ih in TC neurons from WAG/Rij may thus interfere with the termination of spike-locked burst firing, resulting in facilitation and/or prolongation of synchronized activity in thalamic circuits related to seizure generation. More specifically, the following scenario emerges from the data: (1) Spindle rhythm during sleep and SWD during absence seizures are sustained by very similar mechanisms and synaptic networks of the thalamocortical system (Destexhe and Sejnowski, 2003; Steriade, 2003). (2) Ih makes a significant contribution to both burst patterns. (3) Regulation of Ih through cAMP effectively terminates spindle-like burst firing in vitro (Lüthi and McCormick, 1999). (4) The decrease in cAMP sensitivity of Ih in TC neurons from epileptic animals will prevent an effective regulation of Ih and hence an effective termination of burst firing (present study). As a conclusion, the alteration in Ih properties will facilitate and/or prolong the generation of SWD-locked burst firing related to absence seizures, indicating a cellular dysfunction that makes a direct contribution to this pathological condition. In support of this is the observation that the knock-out of the HCN2 gene and resulting reduction in magnitude and cAMP responsiveness of Ih in TC neurons promote the spontaneous occurrence of absence seizure-like activity (Ludwig et al., 2003). Thus, the balance of HCN1 and HCN2 gene expression in TC neurons seems to be critical for the regulation of burst firing in thalamic networks toward either spindle-like or spike-wave-like patterns.
Footnotes
This work was supported by Deutsche Forschungsgemeinschaft (BU 1019/5-1, MU 1686/1-2, Leibniz-Program to H.-C. P.) and Kultusministerium Sachsen-Anhalt. We thank S. Staak for expert help with the in vivo experiments, A. Reupsch for expert histology, and A. Jahn and R. Ziegler for expert technical assistance.
Correspondence should be addressed to Hans-Christian Pape, Institut für Physiologie I, Westfälische Wilhelms-Universität Münster, Robert-Koch-Strasse 27 a, D-48149 Münster, Germany. E-mail: papechris@ukmuenster.de.
Copyright © 2005 Society for Neuroscience 0270-6474/05/259871-12$15.00/0
T.B., L.C., and T.K. contributed equally to this work.
References
- Adams SR, Harootunian AT, Buechler YJ, Taylor SS, Tsien RY (1991) Fluorescence ratio imaging of cyclic AMP in single cells. Nature 349: 694-697. [DOI] [PubMed] [Google Scholar]
- Bender RA, Brewster A, Santoro B, Ludwig A, Hofmann F, Biel M, Baram TZ (2001) Differential and age-dependent expression of hyperpolarization-activated, cyclic nucleotide-gated cation channel isoforms 1-4 suggests evolving roles in the developing rat hippocampus. Neuroscience 106: 689-698. [DOI] [PMC free article] [PubMed] [Google Scholar]
- Bender RA, Soleymani SV, Brewster AL, Nguyen ST, Beck H, Mathern GW, Baram TZ (2003) Enhanced expression of a specific hyperpolarization-activated cyclic nucleotide-gated cation channel (HCN) in surviving dentate gyrus granule cells of human and experimental epileptic hippocampus. J Neurosci 23: 6826-6836. [DOI] [PMC free article] [PubMed] [Google Scholar]
- Brewster A, Bender RA, Chen Y, Dube C, Eghbal-Ahmadi M, Baram TZ (2002) Developmental febrile seizures modulate hippocampal gene expression of hyperpolarization-activated channels in an isoform- and cell-specific manner. J Neurosci 22: 4591-4599. [DOI] [PMC free article] [PubMed] [Google Scholar]
- Brewster AL, Bernard JA, Gall CM, Baram TZ (2005) Formation of heteromeric hyperpolarization-activated cyclic nucleotide-gated (HCN) channels in the hippocampus is regulated by developmental seizures. Neurobiol Dis 19: 200-207. [DOI] [PMC free article] [PubMed] [Google Scholar]
- Budde T, Biella G, Munsch T, Pape H-C (1997) Lack of regulation by intracellular Ca2+ of the hyperpolarization-activated cation current in rat thalamic neurons. J Physiol (Lond) 503: 79-85. [DOI] [PMC free article] [PubMed] [Google Scholar]
- Chen K, Aradi I, Thon N, Eghbal-Ahmadi M, Baram TZ, Soltesz I (2001) Persistently modified h-channels after complex febrile seizures convert the seizure-induced enhancement of inhibition to hyperexcitability. Nat Med 7: 331-337. [DOI] [PMC free article] [PubMed] [Google Scholar]
- Chen K, Aradi I, Santhakumar V, Soltesz I (2002) H-channels in epilepsy: new targets for seizure control? Trends Pharmacol Sci 23: 552-557. [DOI] [PubMed] [Google Scholar]
- Chen S, Wang J, Siegelbaum SA (2001) Properties of hyperpolarization-activated pacemaker current defined by coassembly of HCN1 and HCN2 subunits and basal modulation by cyclic nucleotide. J Gen Physiol 117: 491-504. [DOI] [PMC free article] [PubMed] [Google Scholar]
- Chevaleyre V, Castillo PE (2002) Assessing the role of Ih channels in synaptic transmission and mossy fiber LTP. Proc Natl Acad Sci USA 99: 9538-9543. [DOI] [PMC free article] [PubMed] [Google Scholar]
- Coenen AM, Van Luijtelaar EL (2003) Genetic animal models for absence epilepsy: a review of the WAG/Rij strain of rats. Behav Genet 33: 635-655. [DOI] [PubMed] [Google Scholar]
- Crunelli V, Leresche N (2002) Childhood absence epilepsy: genes, channels, neurons and networks. Nat Rev Neurosci 3: 371-382. [DOI] [PubMed] [Google Scholar]
- Decher N, Bundis F, Vajna R, Steinmeyer K (2003) KCNE2 modulates current amplitudes and activation kinetics of HCN4: influence of KCNE family members on HCN4 currents. Pflügers Arch 446: 633-640. [DOI] [PubMed] [Google Scholar]
- Destexhe A, Sejnowski TJ (2003) Interactions between membrane conductances underlying thalamocortical slow-wave oscillations. Physiol Rev 83: 1401-1453. [DOI] [PMC free article] [PubMed] [Google Scholar]
- Di Pasquale E, Keegan KD, Noebels JL (1997) Increased excitability and inward rectification in layer V cortical pyramidal neurons in the epileptic mutant mouse Stargazer. J Neurophysiol 77: 621-631. [DOI] [PubMed] [Google Scholar]
- Dodt HU, Zieglgänsberger W (1990) Visualizing unstained neurons in living brain slices by infrared DIC-videomicroscopy. Brain Res 537: 333-336. [DOI] [PubMed] [Google Scholar]
- Felix R, Sandoval A, Sanchez D, Gomora JC, De la Vega-Beltran JL, Trevino CL, Darszon A (2003) ZD7288 inhibits low-threshold Ca2+ channel activity and regulates sperm function. Biochem Biophys Res Commun 311: 187-192. [DOI] [PubMed] [Google Scholar]
- Franz O, Liss B, Neu A, Roeper J (2000) Single-cell mRNA expression of HCN1 correlates with a fast gating phenotype of hyperpolarization-activated cyclic nucleotide-gated ion channels (Ih) in central neurons. Eur J Neurosci 12: 2685-2693. [DOI] [PubMed] [Google Scholar]
- Frere SG, Lüthi A (2004) Pacemaker channels in mouse thalamocortical neurones are regulated by distinct pathways of cAMP synthesis. J Physiol (Lond) 554: 111-125. [DOI] [PMC free article] [PubMed] [Google Scholar]
- Gabbott PL, Somogyi J, Stewart MG, Hamori J (1986) A quantitative investigation of the neuronal composition of the rat dorsal lateral geniculate nucleus using GABA-immunocytochemistry. Neuroscience 19: 101-111. [DOI] [PubMed] [Google Scholar]
- Heine M, Ponimaskin E, Bickmeyer U, Richter DW (2002) 5-HT-receptor-induced changes of the intracellular cAMP level monitored by a hyperpolarization-activated cation channel. Pflügers Arch 443: 418-426. [DOI] [PubMed] [Google Scholar]
- Inoue M, Duysens J, Vossen JM, Coenen AM (1993) Thalamic multiple-unit activity underlying spike-wave discharges in anesthetized rats. Brain Res 612: 35-40. [DOI] [PubMed] [Google Scholar]
- Inoue M, Ates N, Vossen JM, Coenen AM (1994) Effects of the neurolept-analgesic fentanyl-fluanisone (Hypnorm) on spike-wave discharges in epileptic rats. Pharmacol Biochem Behav 48: 547-551. [DOI] [PubMed] [Google Scholar]
- Jones EG, Hendry SH (1989) Differential calcium binding protein immunoreactivity distinguishes classes of relay neurons in monkey thalamic nuclei. Eur J Neurosci 1: 222-246. [DOI] [PubMed] [Google Scholar]
- Kaupp UB, Seifert R (2001) Molecular diversity of pacemaker ion channels. Annu Rev Physiol 63: 235-257. [DOI] [PubMed] [Google Scholar]
- Ludwig A, Budde T, Stieber J, Moosmang S, Wahl C, Holthoff K, Langebartels A, Wotjak C, Munsch T, Zong X, Feil S, Feil R, Lancel M, Chien KR, Konnerth A, Pape HC, Biel M, Hofmann F (2003) Absence epilepsy and sinus dysrhythmia in mice lacking the pacemaker channel HCN2. EMBO J 22: 216-224. [DOI] [PMC free article] [PubMed] [Google Scholar]
- Lüthi A, McCormick DA (1998a) Periodicity of thalamic synchronized oscillations: the role of Ca2+-mediated upregulation of Ih Neuron 20: 553-563. [DOI] [PubMed] [Google Scholar]
- Lüthi A, McCormick DA (1998b) H-current: properties of a neuronal and network pacemaker. Neuron 21: 9-12. [DOI] [PubMed] [Google Scholar]
- Lüthi A, McCormick DA (1999) Modulation of a pacemaker current through Ca2+-induced stimulation of cAMP production. Nat Neurosci 2: 634-641. [DOI] [PubMed] [Google Scholar]
- Lüthi A, Bal T, McCormick DA (1998) Periodicity of thalamic spindle waves is abolished by ZD7288, a blocker of Ih J Neurophysiol 79: 3284-3289. [DOI] [PubMed] [Google Scholar]
- McCormick DA, Bal T (1997) Sleep and arousal: thalamocortical mechanisms. Annu Rev Neurosci 20: 185-215. [DOI] [PubMed] [Google Scholar]
- McCormick DA, Pape H-C (1990) Noradrenergic and serotonergic modulation of a hyperpolarization-activated cation current in thalamic relay neurones. J Physiol (Lond) 431: 319-342. [DOI] [PMC free article] [PubMed] [Google Scholar]
- Meuth SG, Budde T, Kanyshkova T, Broicher T, Munsch T, Pape H-C (2003) Contribution of TWIK-related acid-sensitive K+ channel 1 (TASK1) and TASK3 channels to the control of activity modes in thalamocortical neurons. J Neurosci 23: 6460-6469. [DOI] [PMC free article] [PubMed] [Google Scholar]
- Meuth SG, Kanyshkova T, Landgraf P, Pape HC, Budde T (2005) Influence of Ca2+-binding proteins and the cytoskeleton on Ca2+-dependent inactivation of high-voltage activated Ca2+ currents in thalamocortical relay neurons. Pflügers Arch 450: 111-122. [DOI] [PubMed] [Google Scholar]
- Moosmang S, Biel M, Hofmann F, Ludwig A (1999) Differential distribution of four hyperpolarization-activated cation channels in mouse brain. Biol Chem 380: 975-980. [DOI] [PubMed] [Google Scholar]
- Much B, Wahl-Schott C, Zong X, Schneider A, Baumann L, Moosmang S, Ludwig A, Biel M (2003) Role of subunit heteromerization and N-linked glycosylation in the formation of functional hyperpolarization-activated cyclic nucleotide-gated channels. J Biol Chem 278: 43781-43786. [DOI] [PubMed] [Google Scholar]
- Neher E (1992) Correction for liquid junction potentials in patch clamp experiments. Methods Enzymol 207: 123-131. [DOI] [PubMed] [Google Scholar]
- Pape H-C (1992) Adenosine promotes burst activity in guinea-pig geniculocortical neurones through two different ionic mechanisms. J Physiol (Lond) 447: 729-753. [DOI] [PMC free article] [PubMed] [Google Scholar]
- Pape H-C (1996) Queer current and pacemaker: the hyperpolarization-activated cation current in neurons. Annu Rev Physiol 58: 299-327. [DOI] [PubMed] [Google Scholar]
- Pinault D, Leresche N, Charpier S, Deniau JM, Marescaux C, Vergnes M, Crunelli V (1998) Intracellular recordings in thalamic neurones during spontaneous spike and wave discharges in rats with absence epilepsy. J Physiol (Lond) 509: 449-456. [DOI] [PMC free article] [PubMed] [Google Scholar]
- Renier WO, Coenen AML (2000) Human absence epilepsy: the WAG/Rij rat as a model. Neurosci Res Com 26: 181-191. [Google Scholar]
- Robinson RB, Siegelbaum SA (2003) Hyperpolarization-activated cation currents: from molecules to physiological function. Annu Rev Physiol 65: 453-480. [DOI] [PubMed] [Google Scholar]
- Santoro B, Baram TZ (2003) The multiple personalities of h-channels. Trends Neurosci 26: 550-554. [DOI] [PMC free article] [PubMed] [Google Scholar]
- Santoro B, Chen S, Luthi A, Pavlidis P, Shumyatsky GP, Tibbs GR, Siegelbaum SA (2000) Molecular and functional heterogeneity of hyperpolarization-activated pacemaker channels in the mouse CNS. J Neurosci 20: 5264-5275. [DOI] [PMC free article] [PubMed] [Google Scholar]
- Seidenbecher T, Pape HC (2001) Contribution of intralaminar thalamic nuclei to spike-and-wave-discharges during spontaneous seizures in a genetic rat model of absence epilepsy. Eur J Neurosci 13: 1537-1546. [DOI] [PubMed] [Google Scholar]
- Seidenbecher T, Staak R, Pape H-C (1998) Relations between cortical and thalamic cellular activities during absence seizures in rats. Eur J Neurosci 10: 1103-1112. [DOI] [PubMed] [Google Scholar]
- Shah MM, Anderson AE, Leung V, Lin X, Johnston D (2004) Seizure-induced plasticity of h channels in entorhinal cortical layer III pyramidal neurons. Neuron 44: 495-508. [DOI] [PMC free article] [PubMed] [Google Scholar]
- Sieg F, Obst K, Gorba T, Riederer B, Pape H-C, Wahle P (1998) Postnatal expression pattern of calcium-binding proteins in organotypic thalamic cultures and in the dorsal thalamus in vivo. Brain Res Dev Brain Res 110: 83-95. [DOI] [PubMed] [Google Scholar]
- Staak R, Pape HC (2001) Contribution of GABAA and GABAB receptors to thalamic neuronal activity during spontaneous absence seizures in rats. J Neurosci 21: 1378-1384. [DOI] [PMC free article] [PubMed] [Google Scholar]
- Steriade M (2003) Neuronal substrates of sleep and epilepsy. Cambridge, UK: Cambridge UP.
- Steriade M, Jones EG, McCormick DA (1997) Thalamus, Ed 1. Amsterdam: Elsevier.
- Strauss U, Kole MH, Brauer AU, Pahnke J, Bajorat R, Rolfs A, Nitsch R, Deisz RA (2004) An impaired neocortical Ih is associated with enhanced excitability and absence epilepsy. Eur J Neurosci 19: 3048-3058. [DOI] [PubMed] [Google Scholar]
- Trivedi B, Kramer RH (1998) Real-time patch-cram detection of intracellular cGMP reveals long-term suppression of responses to NO and muscarinic agonists. Neuron 21: 895-906. [DOI] [PubMed] [Google Scholar]
- Ulens C, Tytgat J (2001a) Functional heteromerization of HCN1 and HCN2 pacemaker channels. J Biol Chem 276: 6069-6072. [DOI] [PubMed] [Google Scholar]
- Ulens C, Tytgat J (2001b) Gi- and Gs-coupled receptors up-regulate the cAMP cascade to modulate HCN2, but not HCN1 pacemaker channels. Pflügers Arch 442: 928-942. [DOI] [PubMed] [Google Scholar]
- Wang J, Chen S, Nolan MF, Siegelbaum SA (2002) Activity-dependent regulation of HCN pacemaker channels by cyclic AMP: signaling through dynamic allosteric coupling. Neuron 36: 451-461. [DOI] [PubMed] [Google Scholar]
- Yu H, Wu J, Potapova I, Wymore RT, Holmes B, Zuckerman J, Pan Z, Wang H, Shi W, Robinson RB, El-Maghrabi MR, Benjamin W, Dixon J, McKinnon D, Cohen IS, Wymore R (2001) MinK-related peptide 1: a beta subunit for the HCN ion channel subunit family enhances expression and speeds activation. Circ Res 88: E84-E87. [DOI] [PubMed] [Google Scholar]
- Zaccolo M, De Giorgi F, Cho CY, Feng L, Knapp T, Negulescu PA, Taylor SS, Tsien RY, Pozzan T (2000) A genetically encoded, fluorescent indicator for cyclic AMP in living cells. Nat Cell Biol 2: 25-29. [DOI] [PubMed] [Google Scholar]