Abstract
Ribeye is the only known protein specific to synaptic ribbon, but its function is unclear. We show that the teleost fish, Fugu and zebrafish, have two ribeye genes, ribeye a and ribeye b. Whole-mount in situ hybridization revealed that ribeye a is expressed in tissues containing synaptic ribbons, including the pineal gland, inner ear, and retina. Ribeye b is absent in the pineal gland. In the retina, ribeye a is expressed in both photoreceptors and bipolar cells, whereas ribeye b is detected only in photoreceptors. To study the function of Ribeye a in retina, we depleted it by morpholino antisense oligos. Fish deficient in Ribeye a lack an optokinetic response and have shorter synaptic ribbons in photoreceptors and fewer synaptic ribbons in bipolar cells. Their bipolar cells still target Syntaxin-3 proteins to the inner plexiform layer and have abundant vsx1 mRNA. However, they lack large synaptic terminals and show increased apoptosis. Rod bipolar cells are fewer in number and/or deficient in PKCα. Recovery of Ribeye a levels rescues the optokinetic response, increases the number of PKCα-positive bipolar cells, and stops apoptosis. We conclude that Ribeye a is important for late steps in bipolar cell development.
Keywords: Ribeye, optokinetic response, retina, synaptic ribbon, synaptogenesis, bipolar cells, apoptosis, morpholino antisense oligo
Introduction
In sensory neurons that release neurotransmitters continuously and at high rates, such as photoreceptors, retinal bipolar cells, and the hair cells of the inner ear, the presynaptic terminals carry electron-dense structures called dense bodies or synaptic ribbons (Sjostrand, 1953; Smith and Sjostrand, 1961). The synaptic ribbons are thought to act as “conveyor belts” that transport a steady stream of synaptic vesicles to their docking sites on the plasma membrane (Bunt, 1971; Gray and Pease, 1971; Raviola and Gilula, 1975) or act as a safety belt to tether vesicles stably in mutual contact and thus facilitate multivesicular release by compound exocytosis (Parsons and Sterling, 2003). Such a specialized function may require unique proteins. Thus far, the only known protein specific to synaptic ribbons is Ribeye (Schmitz et al., 2000). To date, however, the precise function of Ribeye has not been determined.
Ribeye was identified from synaptic ribbon-enriched bovine retinal extract (Schmitz et al., 2000), which consists of two parts. The N-terminal A domain can form aggregates in cultured cells and bears no recognizable similarity to other proteins or protein domains. The C-terminal B domain is identical to a transcriptional corepressor, C-terminal binding protein 2 (CtBP2), but without the first 20 residues encoded by the first coding exon. Because Ribeye can form cellular aggregates, it may function by assembling other proteins into the ribbons (Schmitz et al., 2000). The ribbons may then be anchored to the presynaptic sites by the scaffolding proteins Bassoon and Piccolo/Aczonin, which are present both in conventional synapses and in ribbon synapses (Grabs et al., 1996; Wang et al., 1997; Brandstatter et al., 1999; Muresan et al., 1999; Von Kriegstein et al., 1999; Dick et al., 2001, 2003; Piatigorsky, 2001; Von Kriegstein and Schmitz, 2003). If the primary function of Ribeye is to organize a ribbon, one would predict that its removal would have a fairly specific effect, namely the absence of synaptic ribbons.
To determine the function of Ribeye, we used zebrafish. Its retina is structurally and physiologically similar to mammalian retina (Bilotta and Saszik, 2001). Synaptic ribbons in the photoreceptor and bipolar cells of zebrafish appear at approximately the same time as the optokinetic response (OKR) (Easter and Nicola, 1996; Schmitt and Dowling, 1999), an indicator of visual function. Moreover, the zebrafish no optokinetic response c (nrc) mutant, resulting from a truncated synaptojanin 1, has fewer and unanchored photoreceptor synaptic ribbons (Allwardt et al., 2001; Van Epps et al., 2001, 2004). We therefore hypothesized that Ribeye may be essential for visual function.
Here, we report two homologs of the mammalian Ribeye in zebrafish and fugu, ribeye a and ribeye b. In zebrafish retina, ribeye b is expressed only in photoreceptors, whereas ribeye a is also expressed in bipolar cells. When we diminished Ribeye a using morpholino antisense oligos in embryos, they did not react to visual stimuli. The embryos also had shorter photoreceptor ribbons, fewer bipolar ribbons, smaller synaptic terminals, and a markedly decreased number of PKCα-positive bipolar cells with a concomitant burst of apoptosis in the bipolar cell layer. However, earlier steps in bipolar cell development still occurred, because they still expressed early bipolar cell-specific marker vsx1 and target Syntaxin-3 to nascent synaptic sites. Hence, Ribeye a is required for the complete development of bipolar cells as well as their survival.
Materials and Methods
Zebrafish husbandry. TAB14 zebrafish (Danio rerio) were maintained and bred according to procedures as described previously (Westerfield, 1993; Amsterdam et al., 1999). To inhibit pigmentation in the in situ hybridization experiments, 0.003% phenothiourea (Sigma, St. Louis, MO) was added to the fish water from 12 h postfertilization (hpf) until the embryos were fixed. Embryos and larvae were anesthetized with 0.005% tricaine (ethyl 3-aminobenzoate methanesulfonate; Sigma) and then fixed with 4% paraformaldehyde (Sigma) in PBS at room temperature for 3 h. The fixed samples were used directly or stored at -20°C after dehydration by methanol until use.
Molecular biology. A degenerate primer based on a conserved sequence in the Ribeye A domains of humans, rat, and pufferfish (Fugu), 5′-TAYACNGTNCCNATGGAR-3′ (N = A + C + G + T; r = A + G; Y = C + T), and a primer for zebrafish CtBP2 near the 5′-end of the putative B domain of Ribeye, 5′-GCATCTCCACAGTACAGTCT-3′, were used to amplify a 321 bp fragment of ribeye a, as indicated by sequence analysis, from a zebrafish retina cDNA library (a gift from Dr. Susan Brockerhoff, University of Washington, Seattle, WA). The sequence of that fragment was used to design primers for 5′-RACE (rapid amplification of cDNA ends) to acquire the full-length sequence of the A domain of ribeye a. Partial sequences of ribeye b were found by Blast searches of the sequence traces from the zebrafish genome project using the Fugu ribeye b sequence as a query. The sequence information was subsequently used to design primers for 5′-RACE using a zebrafish retina cDNA library.
For gene expression analysis, groups of 10 embryos or larvae were collected at various times after fertilization and used for making total RNA by using TRIzol reagent (Invitrogen, Carlsbad, CA). The isolated RNA (10%) was analyzed by reverse transcription (RT)-PCR according to the instructions of the manufacturer (TITAIUM One-Step RT-PCR kit; Clontech, Palo Alto, CA). Primers used for each transcript are as follows: ribeye a, 5′-CTATACCGTACCAATGGAGCTAATG-3′ and 5′-GCATCTCCACAGTACAGTCTCTC-3′; ribeye a2, 5′-TCACATTATGGGATGATGGCAGGTC-3′ and 5′-GCATCTCCACAGTACAGTCTCTC-3′; ribeye b,5′-CAGGAGCGGCTCCGAAGACGTTTTCCGGC-3′ and 5′-ACAGAAGGCAACGGTTGCCAGATC-3′; and β-actin, 5′-CATCAGCATGGCTTCTGCTCTGTATGG-3′ and 5′-GACTTGTCAGTGTACAGAGACACCCTG-3′.
In situ hybridization, immunohistochemistry, and terminal deoxynucleotidyl transferase-mediated fluorescein-labeled UTP nick end labeling assay. Whole-mount in situ hybridization and immunostaining were performed as described previously (Chen et al., 2001). Digoxygenin (DIG)-labeled riboprobes for zebrafish ribeye genes were made from plasmids harboring the entire coding sequence of the A-domain of ribeye a or b, using the DIG RNA labeling system (Roche, Indianapolis, IN). To determine histological localization of staining, representative samples were sectioned using a cryostat after color development.
For immunohistochemistry, anesthetized zebrafish larvae were fixed in 4% paraformaldehyde in PBS at room temperature for 3 h and equilibrated with sucrose, first at 15% and then at 30%, for a minimum of 1 h before embedded in optimal cutting temperature compound (Sakura, Tokyo, Japan). Cryosections (20 μm thick) on polylysine-coated slides were permeabilized in blocking buffer (BB) consisting of 1% bovine serum albumin (v), 10% normal goat serum (v/v), and 0.5% Triton X-100 in PBS at room temperature for 30 min, followed by overnight incubation with primary antibodies diluted in BB at 4°C. Antibodies and their dilutions used in this study are as follows: rabbit anti-Xenopus CtBP antibody for Ribeye (1:200; kindly provided by Dr. Arie P. Otte, University of Amsterdam, Amsterdam, The Netherlands); monoclonal antibody Zpr1 for red/blue cones (1:100; University of Oregon, Eugene, OR); rabbit anti-PKCα antibody for rod bipolar cells (1:100; s.c.-208 rabbit; Santa Cruz Biotechnology, Santa Cruz, CA); monoclonal antibody Zn5 for retinal ganglion cells (RGCs) (1:200; University of Oregon); rabbit anti-Syntaxin3 antibody for presynaptic plasma membrane of ribbon synapse (1:100; 110-033; Synaptic Systems, Gottingen, Germany); mouse anti-synaptophysin 1 monoclonal antibody for synaptic vesicle (1:200; 101-011; Synaptic Systems). In addition, a CtBP antibody-depleted serum was used as a control as described previously (Zenisek et al., 2003). For fluorescent staining, the immunoreactivity was exhibited by 30 min incubation at room temperature with Alexa Fluor 488-conjugated goat anti-rabbit IgG (H+L) F(ab′)2 fragment or Alexa Fluor 568-conjugated goat anti-mouse IgG (H+L) F(ab′)2 fragment (1:1200; Molecular Probes, Eugene, OR) and viewed by confocal imaging systems (MRC 1000, Bio-Rad, Hercules, CA; or Olympus FluoView FV300, Olympus America, Melville, NY) as reported previously (Zenisek et al., 2003). For colorimetric double staining, anti-PKCα immunoreactivity was revealed by HRP-conjugated goat anti-rabbit IgG(H+L) (Molecular Probes) and DAB substrate (SK-4100; Vector Laboratories, Burlingame, CA) to label bipolar cells brown, according to the instructions of the manufacturer. The sections were subsequently submerged in 0.1 m glycine, pH 2.2, at room temperature for 30 min to strip away the anti-PKCα antibody and probed again with Zpr1 and Zn5 monoclonal antibodies. The immunoreactivity was detected by incubation with HRP-conjugated goat antimouse IgG(H+L) (Molecular Probes) and the SG substrate (SK-4700; Vector Laboratories) to mark cones and RGCs blue.
The terminal deoxynucleotidyl transferase-mediated fluorescein-labeled UTP nick end labeling (TUNEL) assay was performed to detect apoptosis in retinal tissue using an In Situ Cell Death Detection kit (Roche), following the instructions of the manufacturer. The fluorescein-UTP incorporated by apoptotic cells was visualized by confocal microscopy. Labeled cells in the three retinal layers were counted using MetaMorph software (Universal Imaging, West Chester, PA), and data were analyzed using Origin7.0 software (OriginLab Corporation, Northampton, MA).
Electron microscopy. The heads of anesthetized zebrafish larvae were fixed in Karnovsky's solution at room temperature for 1 h and submerged in 0.1 m sodium cacodylate buffer, pH 7.2, for 20 min. The samples were further treated with 1% osmium tetroxide in 0.1 m sodium cacodylate buffer for 1 h and rinsed with distilled water. The tissues were prestained with 4% uranyl acetate for 1 h and rinsed with distilled water, followed by dehydration in increasing concentration of acetone. The dehydrated samples were infiltrated with Epon 812 and acetone (1:1) for 12 h and polymerized in 100% Epon 812 in BEEM capsules at 60°C for 24 h. The polymerized blocks were sectioned on a Leica (Nussloch, Germany) Ultracut E microtome. The thin sections (60-80 nm) were mounted on 300 mesh copper grids and stained with 8% uranyl acetate for 30 min followed by lead citrate staining for 10 min. Sections on grids were viewed with a FEI/Philips Morgagni 268 transmission electron microscope (FEI, Hillsboro, OR), and images were recorded with a digital camera (model ES 4.0; Advanced Microscopy Techniques, Danvers, MA)
Microinjection of antisense morpholino oligos. We purchased three ribeye antisense morpholino oligos (MO) from Gene Tools LLC (Philomath, OR): MO1, 5′-CTGGAGATCAACATGAGGAAAAGAT-3′, complementary to -11 to +14 (A of initiation codon is +1); MO2, 5′-ATACCTTACTCACAGGGAAGAAAAG-3′, complementary to -12 to -36; and Mis4, 5′-CTaGAGtTCAACATGAGcAAAtGAT-3′, a four-base mismatch variant of MO1. One nanoliter of 0.05 mm solution of each oligo (∼0.2 ng) dissolved in endotoxin-free water was pressure injected into the yolk of one to two cell-stage embryos near the animal pole. Injected embryos were raised in 0.3× Daneau's solution [in mm: 58 NaCl, 0.7 KCl, 0.4 MgSO4, 0.6 Ca (NO3)2, 5 HEPES, pH 7.6] containing antibiotics (5 U of penicillin/ml and 5 μg of streptomycin/ml) at 28.5°C.
Optokinetic response test. An apparatus for monitoring OKR of larvae was built as described previously (Brockerhoff et al., 1995; Easter and Nicola, 1996) with a few modifications. To test OKR, five to seven larvae were put in a 3 cm Petri dish containing 4% methylcellulose (Sigma). The dish was placed on a stage surrounded by a cylinder with 22.5° wide black and white stripes on its inner surface. The larvae were positioned dorsal side up. The cylinder rotated at a speed from 2.4-13°, either clockwise or counterclockwise; this corresponded to 0.1-0.58 stripes per second. Eye movements were observed on a monitor through a CCD camera (OS-1802CA; Mintron Enterprise, Taipei Hsien, Taiwan) mounted on a stereomicroscope and recorded by video cassette recorder in some experiments for additional analysis. A single smooth pursuit, reset, and saccade eye movement in the proper direction within 1 min was scored as OKR positive. The tested larvae were returned to fish water for additional experiments, including fixation for immunostaining, homogenization for Western blot analysis, and re-examination for OKR.
Western blot analysis. The retinal tissues from adult rat, goldfish, and zebrafish were isolated as described previously (Zenisek et al., 2003). Small pieces of retina or individual larvae were transferred into a tube containing sample buffer [125 mm Tris, pH 6.8, 10% (v/v) β-mercaptoethanol, 20% (v/v) glycerol, 4% SDS, and 0.01% bromophenol blue]. The tubes were heated at 100°C for 5 min and homogenized by pipette method. The samples were cleared by centrifugation, and supernatants were fractionated on a 7.5% SDS-polyacrylamide gel for Western blot analysis using the anti-Xenopus CtBP polyclonal antibody (1:2000) and chemiluminescence (NEN, Boston, MA). The signals were scanned and analyzed on an Image Station 440 CF supported by Kodak digital science 1D software (Eastman Kodak, Rochester, NY). The quantified data were further analyzed by Origin 7.0 software.
Image processing. Unless specifically mentioned, all images were acquired on a M2Bio microscope equipped with an AxioCam HRc digital camera and Axiovision 3.1 software (Zeiss, Oberkochen, Germany) and processed in Adobe Photoshop (Adobe Systems, San Jose, CA).
Results
Structure of teleost ribeye genes
When we began this study, the zebrafish genome sequence project was in its early phase. We therefore searched the nearly completed Fugu fish genome for the teleost ribeye gene. Using both the human Ribeye sequence as a query and the tblastN program (Altschul et al., 1997), we found two contigs that contained fragments with significant homology to both the A and B domains. In these contigs, the sequences encoding A and B domains were separated by 11 and 18 kb putative intronic sequences, respectively. Furthermore, an exon encoding the first 20 residues of CtBP2 could be found ∼6 and 4 kb upstream of the A domain encoding sequences, respectively. These properties of the two contigs match those of the Ribeye genes of humans and rats (Schmitz et al., 2000). Therefore, they are likely the Fugu ribeye genes. One of the two encodes a larger A domain, and we will refer to it as ribeye a. The smaller gene will be referred to as ribeye b.
The B domain of the predicted Fugu Ribeye proteins was highly conserved. Compared with the B domain of human Ribeye, the B domain of Ribeye a was 82% identical, whereas that of Ribeye b was 87% identical (data not shown). The identity between the B domain of the two Fugu Ribeye was 82%.
However, the conservation in the A domain among vertebrate Ribeye proteins was relatively poor. The A domains of the two Fugu Ribeye were only 32% identical to the human A domains and only 32% identical to each other (supplemental Fig. 1, available at www.jneurosci.org as supplemental material). In particular, the A domain of the longer of the two Fugu proteins, Ribeye a, contained a striking 170-amino acid-long glutamine-rich region that is absent in Ribeye b and in the mammalian sequences. Nonetheless, there were several conserved motifs in the A domains of vertebrate Ribeye sequences. Among them, the YTVPME motif near the end of A domain (absent in Fugu Ribeye b) was suitable for designing a primer with moderate degeneracy. Using this degenerate primer, together with a primer based on the highly conserved region near the N terminus of the B domain according to a published zebrafish CtBP2 sequence (Muraoka et al., 2000), we obtained a 321 bp fragment of a zebrafish ribeye cDNA by RT-PCR. The sequence of the fragment allowed us to obtain the full-length cDNA by 5′ and 3′ RACE from an adult retinal cDNA library. The A domain encoded by the cDNA that we identified was 50% identical to the A domain of Fugu Ribeye a, and, like the Fugu A domain, contained a Q-rich stretch, which is therefore likely the cDNA of zebrafish ribeye a. With respect to amino acids, the identity between zebrafish Ribeye a and human Ribeye was 34% in the A domain and 80% in the B domain. The predicted full-length Ribeye a protein contained 1147 amino acids.
In the 5′ RACE experiment, we discovered a variant of ribeye a that contains an intact B domain but only the first 286 residues of the A domain. In particular, the Q-rich region was absent (supplemental Fig. 1, available at www.jneurosci.org as supplemental material). This short form of ribeye a cDNA (termed ribeye a2) has a predicted molecular weight (MW) of 73.8 kDa. The sequence at the truncation site agreed well with the consensus sequence of a splicing donor site. Hence, ribeye a2 is likely a product of alternative splicing. Interestingly, this splice donor site is conserved in all known ribeye sequences, suggesting that short forms of Ribeye may exist in mammals.
We identified the zebrafish ribeye b by a virtual “genomic walk” through the sequence traces we obtained from the zebrafish genome project. We first used the A domain sequence of Fugu Ribeye b to query the assembled zebrafish sequences using tblastN. This yielded a ∼2 kb continuous sequence for the A domain of the putative zebrafish ribeye b. We then used the 5′-most 200 bp of that sequence to query the Whole-Genome-Shotgun traces to obtain additional 5′ sequences, using blastN. This was reiterated three times to obtain an open reading frame. We then confirmed the predicted sequence encoding the A domain of Ribeye b by sequencing the PCR products from zebrafish genomic DNA and an adult zebrafish retinal cDNA library. We also performed 3′ RACE using the adult retinal cDNA library to obtain the sequence encoding the B domain. Zebrafish Ribeye b had a predicted MW of 93.2 kDa. Its A domain was >50% identical to that of Fugu Ribeye b and was shorter, because it was missing the N-terminal 100 amino acids. Although the A domain of Fugu Ribeye b was predicted to have the N-terminal residues, its similarity to that of other known Ribeye proteins was very poor (supplemental Fig. 1, available at www.jneurosci.org as supplemental material). However, the two zebrafish Ribeye proteins shared only ∼34% identity in the A domain, suggesting that the duplication of the two genes may have occurred before the divergence of Fugu and zebrafish. Again, the B domain of the two teleost Ribeye b proteins was >85% identical.
The expression pattern of zebrafish ribeye
We studied the expression of zebrafish ribeye a and b mRNA by RT-PCR (Fig. 1A). No ribeye expression was detected in embryos at 0 and 5 hpf; hence, they are not maternally supplied. Both ribeye a and ribeye b were expressed at 24 hpf, but ribeye a2 was not detected until 72 hpf.
Figure 1.
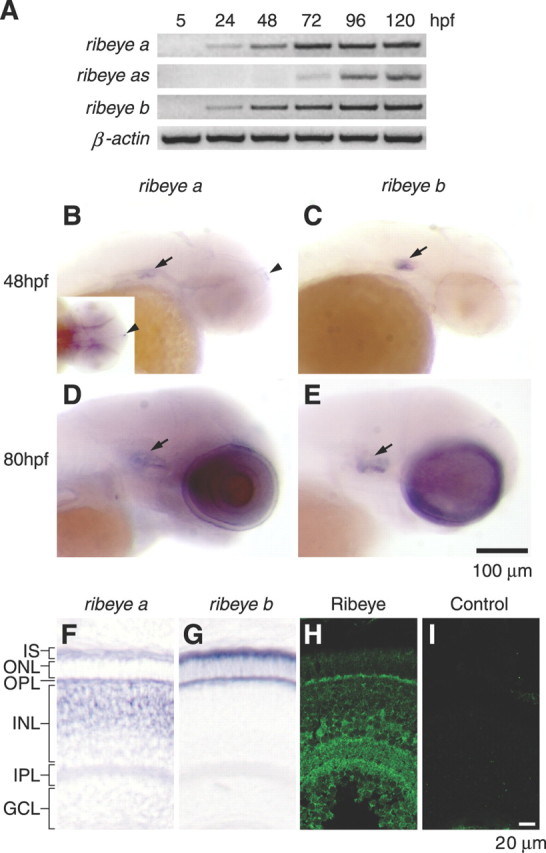
Expression of the two zebrafish ribeye genes during early development. A, RT-PCR analysis. The expression of ribeye a and ribeye b was detected at 24 hpf, whereas ribeye a2 expression was not detected until 72 hpf. β-Actin was used as a control. B, D, Whole-mount in situ hybridization analysis of ribeye a at 48 hpf (B) and 80 hpf (D). The transcripts of ribeye a were found in the inner ears (arrow), pineal gland (arrowhead and inset), and retina. C, E, Whole-mount in situ hybridization analysis of ribeye b at 48 hpf (C) and 80 hpf (E). ribeye b mRNA was identified in the inner ears (arrow) and the retina but not the pineal gland. F, G, Ribeye mRNA distribution by in situ hybridization in transverse eye sections (80 hpf). Ribeye a mRNA was found in the outer half of the inner nuclear layer, presumably bipolar cells, and in the outer nuclear layer in photoreceptor cells (F). Ribeye b was found in photoreceptor cells only (G). H, I, Immunofluorescence labeling of CtBP and Ribeye in transverse eye sections. Ribeye proteins were preferentially localized in the outer and inner plexiform layers, likely in the presynaptic terminals of photoreceptors and bipolar cells. Retinal layers are indicated as follows: IS, inner segment; ONL, outer nuclear layer; INL, inner nuclear layer; GCL, ganglion cell layer.
We used whole-mount in situ hybridization to determine the spatial pattern of ribeye a and ribeye b expression. We did not detect expression of either ribeye gene at 24 hpf (data not shown), possibly because of the lower sensitivity of the method compared with RT-PCR.
At 48 hpf, ribeye a was detected in both the inner ear and the pineal gland, but staining was relatively weak. The ribeye b probe gave a strong signal in the inner ear but was barely detectable, or undetectable, in the pineal gland (Fig. 1B,C). Both genes were also expressed in the retina, weakly at 48 hpf (Fig. 1B) (data not shown) and strongly at 80 hpf (Fig. 1D,E). Retinal sections from embryos at 80 hpf were inspected. For both ribeye a and ribeye b, there were two stripes of strong hybridization in the outermost portion of the retina, typical of photoreceptor-expressed transcripts. There was also a strong ribeye a signal in the inner nuclear layer, presumably from bipolar cells. The transcripts of ribeye b were not detectable in bipolar cells.
We used an anti-Xenopus CtBP antibody to characterize the expression zebrafish Ribeye proteins in the retina. At 80 hpf, immunoreactivity was strong in both the inner plexiform layer (IPL) and outer plexiform layer (OPL), presumably from the presynaptic termini of bipolar and photoreceptor cells, respectively (Fig. 1H). There was also staining in the inner nuclear layer, presumably because of CtBP in the nuclei. Together, the data suggest that both ribeye genes are transcribed. The location and onset of their expression correlates with synaptic ribbon formation.
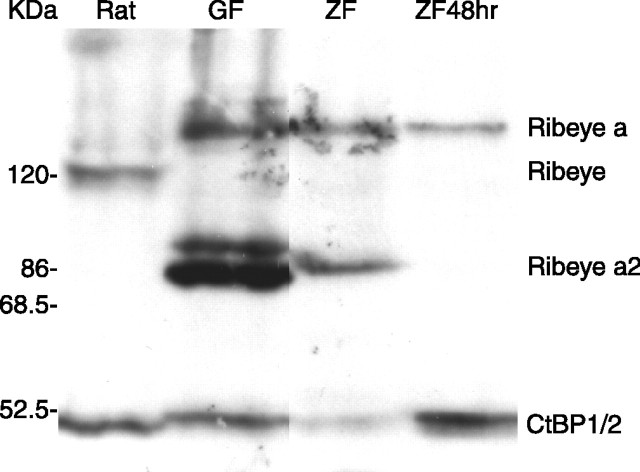
We performed Western blot analysis to verify the predicted size differences between zebrafish and mammalian Ribeye proteins. An antibody against CtBP1/2 detected two proteins in extracts from rat retina that correspond to Ribeye and CtBP1/2, as reported previously (Schmitz et al., 2000). In adult zebrafish retina, however, the antibody detected three major bands. One corresponded to CtBP1/2, another was smaller than rat Ribeye but similar to the predicted size of Ribeye a2, and a third was larger than rat Ribeye but similar to the predicted size of Ribeye a (Fig. 2). All three bands were also present in adult goldfish retina (Fig. 2). The presence of a protein of a size similar to Ribeye a in adult goldfish retinas suggests that the Q-rich region is likely to also be present in the A-domain of goldfish Ribeye a. The band corresponding to Ribeye a2 was absent in extracts from zebrafish embryos at 48 hpf, agreeing with our RT-PCR data. Interestingly, however, there was very weak or no detectable signal at the position expected for Ribeye b. Evidently, the protein has a low abundance or low affinity to the antibody, or both.
Figure 2.
Western blot analysis confirms the predicted teleost Ribeye a and a2. The antibody detected CtBP1/2 (50 kDa) in all samples and also detected Ribeye (120 kDa) in retinal extract from adult rat (Rat). In addition, a 144 kDa protein similar to the size of predicted Ribeye a was revealed in retinal extract of adult goldfish (GF), adult zebrafish (ZF), and in extract from zebrafish whole embryos at 48 hpf (ZF48 h). Furthermore, the antibody also detected a 86 kDa protein similar to the size of predicted Ribeye a2 in adult fish retina but not in 48 hpf embryos.
Ribeye a deficiency causes defective visual response
We chose to determine the function of Ribeye a in vivo using a morpholino antisense oligo-mediated translational inhibition approach (Nasevicius and Ekker, 2000). We concentrated on Ribeye a, because, in bipolar cells, it is the only isoform present in detectable amounts, and thus its absence would be most likely to have a strong phenotype. We designed two oligos, MO1 and MO2, that targeted the translation start region and therefore should inhibit Ribeye a and a2 but not CtBP2a or Ribeye b, because neither oligo is complementary to ribeye b cDNA. An oligo with four mismatches (Mis4) was used as a control. Embryos injected with MO1 and MO2 developed normally but had smaller eyes.
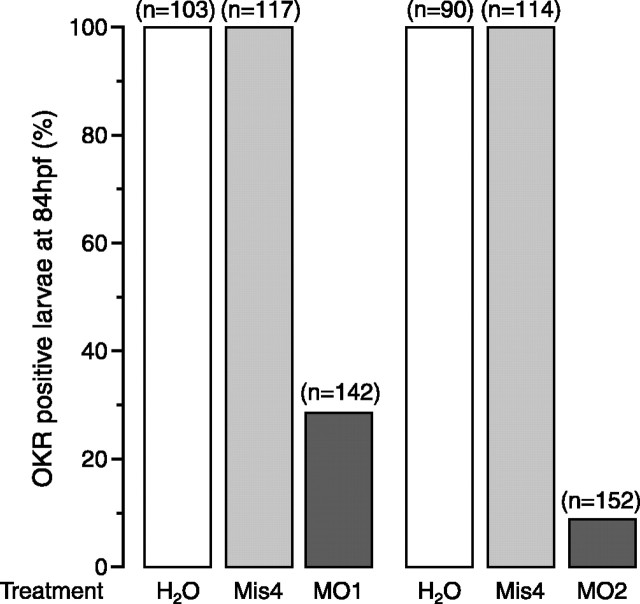
To test whether Ribeye a knock-down impairs visual function, we measured the OKR, a behavioral assay widely used to evaluate visual function in fish and other vertebrates (Brockerhoff et al., 1995; Easter and Nicola, 1996). In control zebrafish larvae, OKR appears in some larvae as early as 70 hpf and in all larvae by 80 hpf (Easter and Nicola, 1996). All larvae injected with either water or Mis4 tested positive for OKR at 84 hpf, although a few tracked the rotating drum only in one direction, possibly because of side effects from the injection (Fig. 3). In contrast, OKR was rare in MO1- and MO2-injected larvae, with a failure rate of 76% for MO1 or 90% for MO2 (Fig. 3). Together with the low dosage of MO (0.2 ng) used to induce the phenotype, the data support that the phenotype was caused by inhibition of Ribeye a production.
Figure 3.
Ribeye a is essential for OKR. Embryos injected with water (H2O), mismatch-MO (Mis4), MO1, or MO2 were tested for OKR at 84 hpf. The bars represent the percentage of embryos that were tested positive; the number of tested embryos is given in parentheses.
To ascertain that the MO1 and MO2 did inhibit the translation of Ribeye a, we performed Western blot analysis on embryos at different time points after injection. We found a marked reduction of Ribeye a at 72 and 84 hpf in MO1- and MO2-injected embryos compared with Mis4-injected ones (Fig. 4A,B) (data not shown). The effect diminished by 96 hpf (data not shown).
Figure 4.
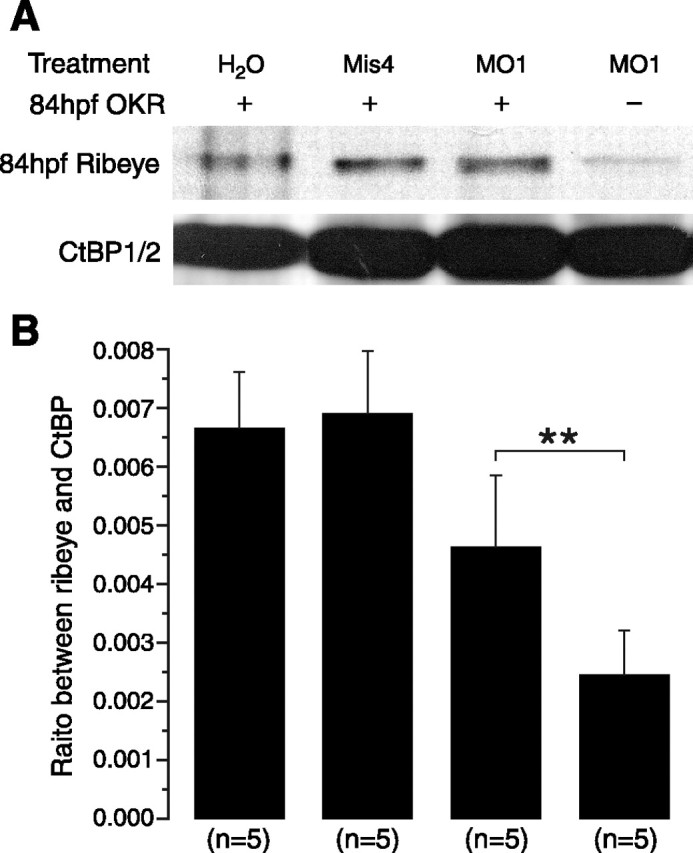
MO suppresses Ribeye a expression. Western blot analysis of Ribeye a levels. A, MO-injected embryos contained markedly decreased Ribeye a compared with those injected with H2O or Mis4. However, in MO-injected embryos that were OKR positive, Ribeye a levels were not significantly decreased. B, Bar graph representing quantitative analysis of Western data. Ribeye a was reduced by >60% in MO-injected, OKR-negative embryos. In contrast, it was decreased only ∼30% in MO-injected, OKR-positive embryos. **p < 0.01.
To test whether the OKR correlated with levels of Ribeye a, we analyzed Ribeye a levels by Western blot in OKR-negative and OKR-positive MO1-injected larvae as well as in larvae that received either water or Mis4. OKR-negative MO1-injected larvae had >2.5-fold less Ribeye a than controls (Fig. 4A,B). MO1-injected larvae that passed the OKR test also had less Ribeye a. However, their Ribeye a levels were significantly higher than in OKR-negative larvae (n = 5; p < 0.01). These results are consistent with the idea that visual function fails when there is too little Ribeye a.
Effect of Ribeye a depletion on synaptic structures
The vision defect may be because of abnormalities in synaptic ribbons. We therefore examined the ultrastructure of OPL and IPL. In the OPL of control animals (Mis4-injected larvae at 84 hpf), ribbon synapses were readily seen. As previously reported, zebrafish photoreceptor ribbons consisted of an electron-dense stripe (the ribbon), for which one end was associated with a characteristic arciform density and postsynaptic membranes (Fig. 5A) (Schmitt and Dowling, 1999; Allwardt et al., 2001; Van Epps et al., 2004). In MO1-injected larvae, ribbon-like structures were still detectable and nearly as numerous, but the ribbons were shorter, often no longer than their width (Fig. 5B, Table 1). The shortened ribbons may contain ribeye b. In the IPL, synaptic ribbons of control animals were visible as electron-dense bodies with a characteristic pentalaminar structure as described previously (von Gersdorff et al., 1996; Schmitt and Dowling, 1999) (Fig. 5C). After MO1 injection, such structures were rarely seen (Table 1). Instead, we sometimes observed electron-dense aggregates close to putative synaptic membranes (Fig. 5D). The aggregates may be precursors of ribbons that were arrested in an immature state. Overall, we conclude that a diminished content of Ribeye a prevents photoreceptor ribbons from reaching a normal length and bipolar cell ribbons from attaining their regular morphology.
Figure 5.
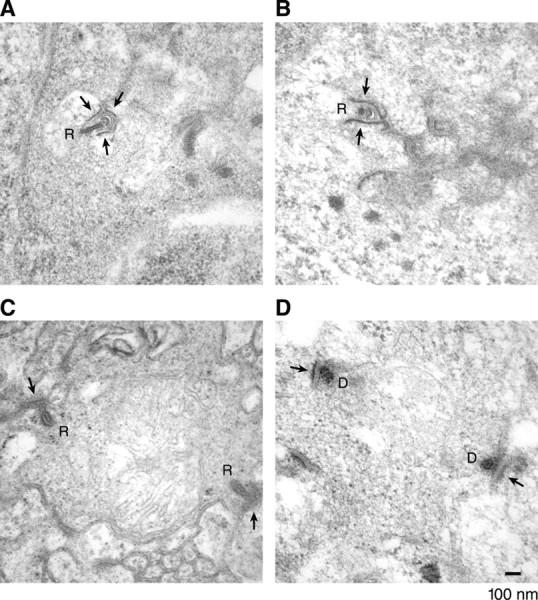
Ribeye a deficiency alters retinal ribbon structures. A, Synaptic ribbon in the OPL (photoreceptor layer) of a control (Mis4-injected) embryo, which associates with the presynaptic membrane via an arciform density. Nearby are the densely stained membranes of postsynaptic cells, probably two horizontal cells and one bipolarcell. B, As in A but from an MO1-injected embryo; the ribbon is shorter. C, Ribbon in the IPL (bipolar cell layer) from a Mis4-injected embryo, which has a pentalaminar appearance and is associated with densely staining synaptic membranes. D, A sin C but from an MO1-injected embryo; pentalaminar structure is absent. The arrows indicate synaptic membranes. R, Ribbons; D, dense bodies. Scale bar, 100 nm.
Table 1.
Effect of Ribeye a depletion on synaptic ribbons
|
|
Ribbons in OPL |
Ribbons in IPL |
||
|---|---|---|---|---|
| Injection |
Number (μm2) |
Length (nm) |
Number (μm2) |
|
| Mis4+ | 0.0089 ± 0.0016 (n = 26) | 226 ± 32 (n = 20) | 0.018 ± 0.002 (n = 63) | |
| MO1- | 0.0069 ± 0.0013 (n = 28) | 111 ± 20 (n = 21) | 0.001 ± 0.001 (n = 66) | |
|
t test |
p > 0.05 |
p < 0.005 |
p < 0.0001 |
|
Retinas from two larvae of each phenotype were sectioned and analyzed by electron microscopy. MO1-injected larvae tested negative for OKR. In the OPL, ribbons were counted in images of 108 μm2 area at a resolution of 5 nm/pixel. We used 26 images from Mis- and 28 images from MO1-injected larvae. Electron dense structures were recognized as ribbons if they were juxtaposed to synaptic membranes. Length measurements did not include the arciform density. In the IPL, ribbons were counted in images of 38 μm2 area and resolution of 3 nm/pixel. Ribbons were recognized by their pentalaminar structure as in Figure 6C. Sixty-three images from Mis- and 66 images from MO1- injected larvae.
Ribeye a deficiency inhibits late steps in the development of bipolar cells
We wanted to determine whether other aspects of retinal development are affected after Ribeye a depletion. First, we examined the expression of vsx1, a gene encoding a bipolar cell-specific transcription factor (Levine et al., 1994; Passini et al., 1997). In the retina, vsx1 mRNA is known to be abundant specifically in bipolar cells at early stages of retinal development (50 hpf). The abundance of vsx1 mRNA in bipolar cells decreases at 60 hpf to a level similar to adult bipolar cells (Passini et al., 1997). When we probed for vsx1 mRNA at 84 hpf, transcript was detected in retinal sections of both control and Ribeye a-deficient larvae, and in both, transcript appeared in the layer normally occupied by bipolar cells (Fig. 6A,B). We would not expect to detect abundant vsx1 mRNA if MO1-injected larvae simply failed to generate bipolar cells.
Figure 6.
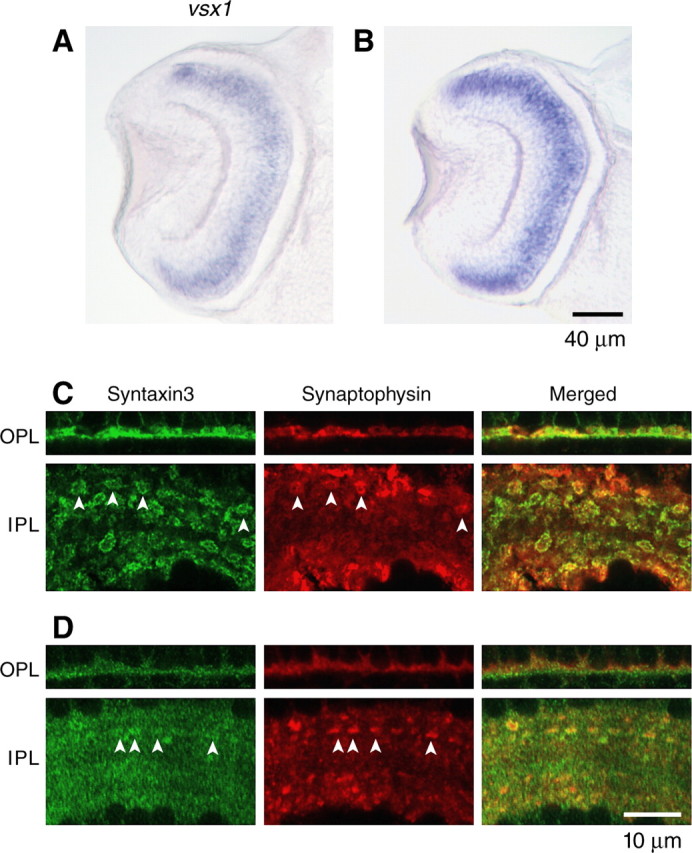
Development of bipolar cells in Ribeye a-deficient larvae. A, B, Expression of vsx-1 in retinal bipolar cells at 84 hpf embryos by in situ hybridization in Mis4-injected (A) and MO1-injected (B) embryos. C, D, Immunofluorescence of Syntaxin-3 (green) and synaptophysin (red) in OPL (top panel) and IPL (bottom panel) in Mis4-injected (C) and MO1-injected (D) embryos. Throughout, MO1-injected larvae tested negative for OKR. The arrowheads indicate probable presynaptic terminals. Scale bar, 10 μm.
In the mouse retina, the synaptic membrane protein Syntaxin-3 is specifically expressed in cells with ribbon synapses (Morgans et al., 1996; Von Kriegstein and Schmitz, 2003). In control larvae, Syntaxin-3 immunofluorescence was detected in the OPL and in both sublaminas of the IPL (Fig. 6C) (data not shown). In the IPL, there was an abundance of ring-shaped structures well over 1 μm in diameter, which most probably represent membrane staining of bipolar synaptic terminals. Consistent with this idea, they contained the synaptic vesicle marker synaptophysin. A similar analysis was performed in MO1-injected larvae (Fig. 6D). The staining for Syntaxin-3 was no less bright than in control, especially in the IPL. Furthermore, there continued to be structures where Syntaxin-3 and synaptophysin colocalize, suggestive of nascent presynaptic sites. Overall, however, the Syntaxin-3 stain appeared more diffuse, and in particular, the ring-shaped structures were absent.
We tested a third marker, protein kinase C isoform PKCα, specific to ON bipolar cells (Yazulla and Studholme, 2001). PKCα is undetectable until 60 hpf in zebrafish retina, suggesting that it appears later than vsx1, and in that sense is a marker for more mature ON bipolar cells (data not shown). To investigate the expression of PKCα, we used polyclonal anti-PKCα together with the monoclonal antibody Zn-5 to mark retinal ganglion cells and the monoclonal antibody Zpr-1 to mark blue/red cone photoreceptors (Trevarrow et al., 1990). All three antibodies stained cells in their appropriate layer of the retina, both in control animals and in MO1-injected larvae that were OKR positive (Fig. 7A-C). In OKR-negative larvae, however, there were markedly fewer PKCα-positive bipolar cells, whereas retinal ganglion and photoreceptor cells as well as the lamination of the retina appeared normal (Fig. 7D). Amacrine cells and rod photoreceptors also appeared normal in MO-injected, OKR-negative larvae (data not shown). We conclude that lack of Ribeye a predominantly affects bipolar cell development.
Figure 7.
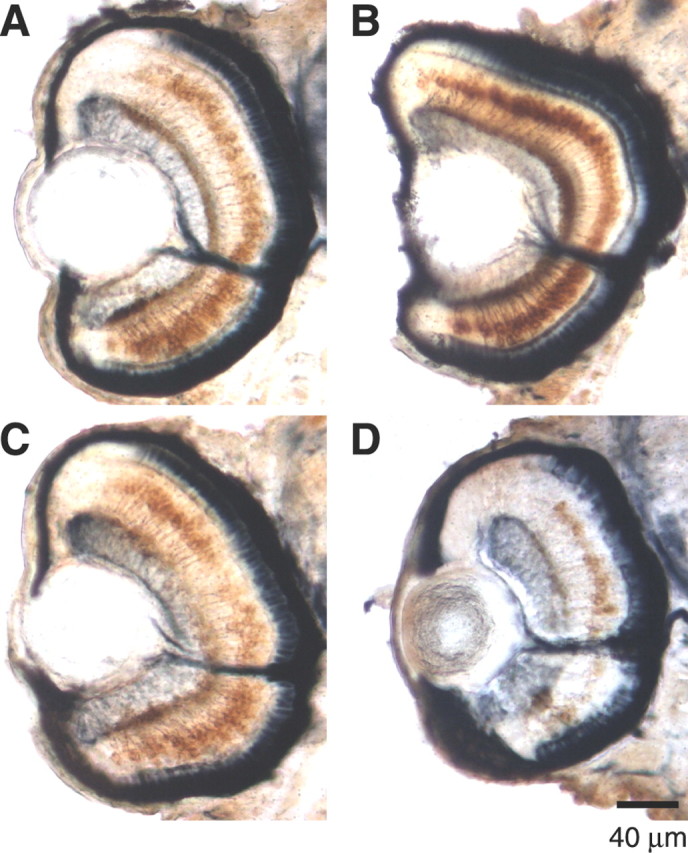
PKCα expression in rod bipolar cells requires Ribeye a. A-D, Cell-specific immunostaining of retinal ganglion cells (Zn-5; navy blue next to the lens), bipolar cells (PKCα; brown), and photoreceptor cells (Zpr-1; navy blue next to pigment epithelium) in embryos injected with water (A), Mis4 (B), MO1 and OKR positive (C), or MO1 and OKR negative (D). Note the diminished PKCα staining in D. Larvae are at 84 hpf throughout.
In summary, MO1 does not inhibit the formation of vsx1-expressing bipolar cells and the targeting of Syntaxin-3 to nascent bipolar presynaptic terminals. At least in bipolar cells, however, the presynaptic terminals were smaller (Fig. 6D) and lacked normal synaptic ribbons (Fig. 5D). Furthermore, MO1 diminishes the expression of PKCα. We conclude that bipolar cells still form in Ribeye a-deficient animals, but they are arrested at a late step. This idea is consistent with the higher levels of vsx1 mRNA expression in MO1 injected larvae. Elevated vsx1 mRNA levels are indicative of immature bipolar cells, because they are highest at 50 hpf and then decline (Passini et al., 1997).
Ribeye a deficiency causes apoptosis
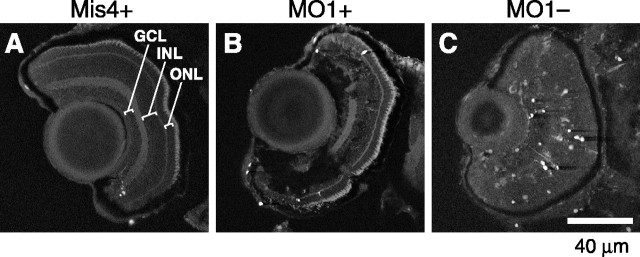
When bipolar cells are prevented from developing fully, they may undergo apoptosis (Bramblett et al., 2004). To determine whether bipolar cells are prone to apoptosis in Ribeye a-depleted animals, we performed TUNEL assay, which marks DNA fragmentation in cells undergoing apoptosis. Retinas of Mis4-injected larvae and MO1-injected larvae testing positive for OKR had few dying cells. However, MO1-injected larvae that were OKR negative contained a larger number of apoptotic cells, most strikingly in the INL where bipolar cells reside (Fig. 8A-C). This finding is consistent with the idea that a lack of Ribeye a causes developmental arrest.
Figure 8.
Ribeye a deficiency induces cell death. A, B, Cell death in the retina at 84 hpf was limited in embryos injected with Mis4 (A) and MO1 but OKR positive (B). C, In contrast, significant more cell death, particularly in the inner nuclear layer (INL), was seen in the retina of MO1-injected OKR-negative embryos. GCL, Ganglion cell layer; ONL, outer nuclear layer.
Recovery of Ribeye a expression restores retinal defects
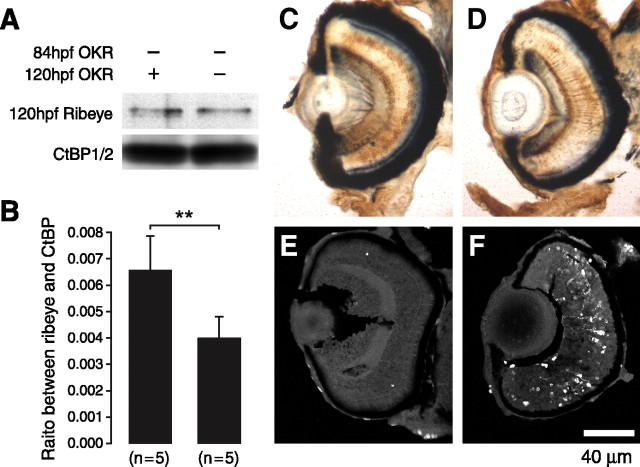
Because the effect of morpholino oligo wears off with time, resulting from degradation and dilution, one may test whether the loss of Ribeye a is temporary and whether function returns. We kept the larvae that tested OKR negative at 84 hpf, allowed them to recover, and retested them at 120 hpf. Of the 67 larvae, 39 became OKR positive. We analyzed the OKR-positive and OKR-negative larvae again using Western blot, immunohistochemistry, and TUNEL assays. Western blot analysis indicated that in fish that regained their OKR, Ribeye a expression also partially recovered (Fig. 9A,B). Immunohistochemistry studies indicated that although the staining of RGCs and cones was comparable between the two groups (Fig. 9A,B), significantly more PKCα-positive bipolar cells were found in fish that had regained their OKR (Fig. 9C,D). In addition, cells had stopped dying in OKR-positive fish (Fig. 9E). In contrast, larvae that were still OKR negative still had fewer PKCα-positive bipolar cells and more dying cells in all layers of retina (Fig. 9F).
Figure 9.
Recovery of Ribeye a expression restores retinal defects. A, Western blot analysis of Ribeye a levels in recovered embryos and in OKR-negative embryos. B, Bargraph indicating that significantly more Ribeye a is present in the recovered animals (**p < 0.01; ttest) (B). C,D, Immunohistological graphs indicating that recovered embryos also have more PKCα-positive bipolar cells (C) than OKR-negative embryos (D). E, F, Fluorescence micrographs showing that apoptosis is limited in retinas of recovered embryos (E) but extensive in retinas of nonrecovered animals (F).
Discussion
Teleosts have two ribeye genes with divergent A domains
We found two ribeye genes in Fugu by sequence search and in zebrafish by cloning. In zebrafish, both genes are expressed, as revealed by RT-PCR and in situ hybridization, indicating that both genes are functional (Figs. 1,2). This is consistent with the theory that the ancestral teleost underwent one round more genome duplication than did other vertebrate classes, and some of the duplicated genes are preserved (Amores et al., 1998; Taylor et al., 2001). A leading theory for the preservation of some of the duplicated genes is the duplication-degeneration-complementation hypothesis, which proposes that mutations in duplicated genes subdivide the roles played by their ancestor rather than acquire new functions (Force et al., 1999). A common mechanism of such “functional subdivision” is that the two genes are expressed in separate subsets of the cells formerly served by the ancestor (Force et al., 1999). However, Ribeye genes do not completely fit this pattern, because ribeye a is present in some, and perhaps all, tissues that express ribeye b. Interestingly, the differential distribution of two ribeye isoforms in retinal neurons is similar to localization of two ribbon-related scaffold proteins, Bassoon and Piccolo. Bassoon is only associated with photoreceptor ribbons, whereas the Piccolo is located in ribbons of both photoreceptor and bipolar cells (Brandstatter et al., 1999; Dick et al., 2001). This correlation might imply a functional linkage between those molecules. Nevertheless, we cannot rule out the possibility that within the tissues, the two genes are expressed in nonoverlapping cell types. For instance, ribeye a may be expressed in rods, whereas ribeye b is expressed in cones.
Ribeye is essential for late phase of bipolar cell development
Before our study, no other study has addressed the function of Ribeye, although both structural and regulatory roles have been suggested on the basis of its localization in ribbon terminals (Schmitz et al., 2000). Our study demonstrates that Ribeye a deficiency impairs or abolishes visual function, as assayed by OKR. Because ribeye a is the only ribeye gene that is expressed in bipolar cells at detectable levels, one might expect that the bipolar cells are most strongly affected. This was indeed observed. Nevertheless, Ribeye a deficiency also resulted in shorter synaptic ribbons in photoreceptors (Fig. 5). Ribeye a deficiency did not affect the early stage of bipolar cell development, such as vsx1 expression, presynaptic targeting of Syntaxin-3 and synaptophysin, and formation of postsynaptic densities. It inhibited late steps of development of bipolar cells, including formation of normal synaptic ribbons, downregulation of vsx1 expression, the formation of large synaptic terminals, and PKCα expression, The arrest of developing bipolar cells seems to be reversible. Although neurons in the teleost retina are known to form continuously at the ciliary margin after the completion of retinogenesis (Johns and Easter, 1977; Meyer, 1978; Marcus et al., 1999), the PKCα-positive bipolar cells in the recovered animals are unlikely from the ciliary margin. Had they come from the margin, one would have expected more PKCα staining near the retinal periphery. No such gradient in PKCα immunoreactivity was observed (Fig. 9C). Thus, immature bipolar cells in Ribeye a-deficient larvae can resume differentiation when Ribeye a expression is recovered.
Several mouse mutant lines display similar defects. These include the Chx10or-J/or-J mice and Mash1-/-Math3-/- double-mutant mice as well as Bhlhb4-/- mice. They all lack PKCα-positive bipolar cells (Burmeister et al., 1996; Ferda Percin et al., 2000; Tomita et al., 2000; Hatakeyama et al., 2001; Bramblett et al., 2004). However, because Ribeye a is excluded from the nucleus, it is the only protein in this group that is not a transcription factor.
The developmental role of Ribeye is intriguing and may be a novel function of the protein that is independent of synaptic ribbons and their role in making transmitter release more efficient. Alternatively, the only role of Ribeye may be to facilitate transmitter release, and lack of transmitter release caused by faulty ribbons may be the only defect in Ribeye a-deficient animals, and all other defects are secondary. For example, when mice lack Munc18, a priming factor in exocytosis, their brains develop normally at first but then suffer massive neuronal apoptosis. This apoptosis is attributed to a lack of transmitter release (Verhage et al., 2000). If the apoptosis of Ribeye a-deficient bipolar cells occurs by a similar mechanism, it could result from an insufficient synaptic input from photoreceptors or from the lack of an unidentified retrograde messenger that is normally secreted from ganglion cells or amacrine cells when they are activated. Unfortunately, the transient activity of morpholino antisense oligos precluded us from examining synaptic activity in bipolar cells.
In conclusion, we have identified two teleost homologs of the mammalian Ribeye gene, ribeye a and ribeye b. The two genes display different expression profiles: ribeye a is the more abundant form and is expressed in all four regions examined here: photoreceptors and bipolar cells in the retina as well as in the pineal gland and inner ear. Ribeye b is expressed most strongly in the inner ear and is absent from bipolar cells. Ribeye a deficiency inhibits synaptic ribbon assembly, impairs visual function, arrests bipolar cell development, and induces apoptosis in the bipolar cell lineage. Thus, we have provided evidence that Ribeye a is essential for synaptic ribbon formation and for the development or survival of bipolar cells.
Footnotes
This work was supported by National Institutes of Health Grants DK44239 (L.W.), MH60600 (W.A.), and EY14171 (W.C.). We thank Casey Corliss for fish care, Dr. Michael Webb for help in electron microscopy, and Drs. Rachel Dresbeck, Dick Goodman, Mike Forte, and Jose Machado-Ponce for critical reading of this manuscript. We also thank other members in the Chen and Almers laboratories for stimulating discussions.
Correspondence should be addressed to Wenbiao Chen, Oregon Health and Science University, Vollum Institute, 3181 Southwest Sam Jackson Park Road, Portland, OR 97239. E-mail: chenwb@ohsu.edu.
Copyright © 2005 Society for Neuroscience 0270-6474/05/250941-09$15.00/0
References
- Allwardt BA, Lall AB, Brockerhoff SE, Dowling JE (2001) Synapse formation is arrested in retinal photoreceptors of the zebrafish nrc mutant. J Neurosci 21: 2330-2342. [DOI] [PMC free article] [PubMed] [Google Scholar]
- Altschul SF, Madden TL, Schaffer AA, Zhang J, Zhang Z, Miller W, Lipman DJ (1997) Gapped BLAST and PSI-BLAST: a new generation of protein database search programs. Nucleic Acids Res 25: 3389-3402. [DOI] [PMC free article] [PubMed] [Google Scholar]
- Amores A, Force A, Yan YL, Joly L, Amemiya C, Fritz A, Ho RK, Langeland J, Prince V, Wang YL, Westerfield M, Ekker M, Postlethwait JH (1998) Zebrafish hox clusters and vertebrate genome evolution. Science 282: 1711-1714. [DOI] [PubMed] [Google Scholar]
- Amsterdam A, Burgess S, Golling G, Chen W, Sun Z, Townsend K, Farrington S, Haldi M, Hopkins N (1999) A large-scale insertional mutagenesis screen in zebrafish. Genes Dev 13: 2713-2724. [DOI] [PMC free article] [PubMed] [Google Scholar]
- Bilotta J, Saszik S (2001) The zebrafish as a model visual system. Int J Dev Neurosci 19: 621-629. [DOI] [PubMed] [Google Scholar]
- Bramblett DE, Pennesi ME, Wu SM, Tsai MJ (2004) The transcription factor Bhlhb4 is required for rod bipolar cell maturation. Neuron 43: 779-793. [DOI] [PubMed] [Google Scholar]
- Brandstatter JH, Fletcher EL, Garner CC, Gundelfinger ED, Wassle H (1999) Differential expression of the presynaptic cytomatrix protein bassoon among ribbon synapses in the mammalian retina. Eur J Neurosci 11: 3683-3693. [DOI] [PubMed] [Google Scholar]
- Brockerhoff SE, Hurley JB, Janssen-Bienhold U, Neuhauss SC, Driever W, Dowling JE (1995) A behavioral screen for isolating zebrafish mutants with visual system defects. Proc Natl Acad Sci USA 92: 10545-10549. [DOI] [PMC free article] [PubMed] [Google Scholar]
- Bunt AH (1971) Enzymatic digestion of synaptic ribbons in amphibian retinal photoreceptors. Brain Res 25: 571-577. [DOI] [PubMed] [Google Scholar]
- Burmeister M, Novak J, Liang MY, Basu S, Ploder L, Hawes NL, Vidgen D, Hoover F, Goldman D, Kalnins VI, Roderick TH, Taylor BA, Hankin MH, McInnes RR (1996) Ocular retardation mouse caused by Chx10 homeobox null allele: impaired retinal progenitor proliferation and bipolar cell differentiation. Nat Genet 12: 376-384. [DOI] [PubMed] [Google Scholar]
- Chen W, Burgess S, Hopkins N (2001) Analysis of the zebrafish smoothened mutant reveals conserved and divergent functions of hedgehog activity. Development 128: 2385-2396. [DOI] [PubMed] [Google Scholar]
- Dick O, Hack I, Altrock WD, Garner CC, Gundelfinger ED, Brandstatter JH (2001) Localization of the presynaptic cytomatrix protein Piccolo at ribbon and conventional synapses in the rat retina: comparison with Bassoon. J Comp Neurol 439: 224-234. [DOI] [PubMed] [Google Scholar]
- Dick O, Dieck TS, Altrock WD, Ammermuller J, Weiler R, Garner CC, Gundelfinger ED, Brandstatter JH (2003) The presynaptic active zone protein bassoon is essential for photoreceptor ribbon synapse formation in the retina. Neuron 37: 775-786. [DOI] [PubMed] [Google Scholar]
- Easter Jr SS, Nicola GN (1996) The development of vision in the zebrafish (Danio rerio). Dev Biol 180: 646-663. [DOI] [PubMed] [Google Scholar]
- Ferda Percin E, Ploder LA, Yu JJ, Arici K, Horsford DJ, Rutherford A, Bapat B, Cox DW, Duncan AM, Kalnins VI, Kocak-Altintas A, Sowden JC, Traboulsi E, Sarfarazi M, McInnes RR (2000) Human microphthalmia associated with mutations in the retinal homeobox gene CHX10. Nat Genet 25: 397-401. [DOI] [PubMed] [Google Scholar]
- Force A, Lynch M, Pickett FB, Amores A, Yan YL, Postlethwait J (1999) Preservation of duplicate genes by complementary, degenerative mutations. Genetics 151: 1531-1545. [DOI] [PMC free article] [PubMed] [Google Scholar]
- Grabs D, Bergmann M, Urban M, Post A, Gratzl M (1996) Rab3 proteins and SNAP-25, essential components of the exocytosis machinery in conventional synapses, are absent from ribbon synapses of the mouse retina. Eur J Neurosci 8: 162-168. [DOI] [PubMed] [Google Scholar]
- Gray EG, Pease HL (1971) On understanding the organisation of the retinal receptor synapses. Brain Res 35: 1-15. [DOI] [PubMed] [Google Scholar]
- Hatakeyama J, Tomita K, Inoue T, Kageyama R (2001) Roles of homeobox and bHLH genes in specification of a retinal cell type. Development 128: 1313-1322. [DOI] [PubMed] [Google Scholar]
- Johns PR, Easter Jr SS (1977) Growth of the adult goldfish eye. II. Increase in retinal cell number. J Comp Neurol 176: 331-341. [DOI] [PubMed] [Google Scholar]
- Levine EM, Hitchcock PF, Glasgow E, Schechter N (1994) Restricted expression of a new paired-class homeobox gene in normal and regenerating adult goldfish retina. J Comp Neurol 348: 596-606. [DOI] [PubMed] [Google Scholar]
- Marcus RC, Delaney CL, Easter Jr SS (1999) Neurogenesis in the visual system of embryonic and adult zebrafish (Danio rerio). Vis Neurosci 16: 417-424. [DOI] [PubMed] [Google Scholar]
- Meyer RL (1978) Evidence from thymidine labeling for continuing growth of retina and tectum in juvenile goldfish. Exp Neurol 59: 99-111. [DOI] [PubMed] [Google Scholar]
- Morgans CW, Brandstatter JH, Kellerman J, Betz H, Wassle H (1996) A SNARE complex containing syntaxin 3 is present in ribbon synapses of the retina. J Neurosci 16: 6713-6721. [DOI] [PMC free article] [PubMed] [Google Scholar]
- Muraoka O, Ichikawa H, Shi H, Okumura S, Taira E, Higuchi H, Hirano T, Hibi M, Miki N (2000) Kheper, a novel ZFH/deltaEF1 family member, regulates the development of the neuroectoderm of zebrafish (Danio rerio). Dev Biol 228: 29-40. [DOI] [PubMed] [Google Scholar]
- Muresan V, Lyass A, Schnapp BJ (1999) The kinesin motor KIF3A is a component of the presynaptic ribbon in vertebrate photoreceptors. J Neurosci 19: 1027-1037. [DOI] [PMC free article] [PubMed] [Google Scholar]
- Nasevicius A, Ekker SC (2000) Effective targeted gene “knockdown” in zebrafish. Nat Genet 26: 216-220. [DOI] [PubMed] [Google Scholar]
- Parsons TD, Sterling P (2003) Synaptic ribbon. Conveyor belt or safety belt? Neuron 37: 379-382. [DOI] [PubMed] [Google Scholar]
- Passini MA, Levine EM, Canger AK, Raymond PA, Schechter N (1997) Vsx-1 and Vsx-2: differential expression of two paired-like homeobox genes during zebrafish and goldfish retinogenesis. J Comp Neurol 388: 495-505. [DOI] [PubMed] [Google Scholar]
- Piatigorsky J (2001) Dual use of the transcriptional repressor (CtBP2)/ribbon synapse (RIBEYE) gene: how prevalent are multifunctional genes? Trends Neurosci 24: 555-557. [DOI] [PubMed] [Google Scholar]
- Raviola E, Gilula NB (1975) Intramembrane organization of specialized contacts in the outer plexiform layer of the retina. A freeze-fracture study in monkeys and rabbits. J Cell Biol 65: 192-222. [DOI] [PMC free article] [PubMed] [Google Scholar]
- Schmitt EA, Dowling JE (1999) Early retinal development in the zebrafish, Danio rerio: light and electron microscopic analyses. J Comp Neurol 404: 515-536. [PubMed] [Google Scholar]
- Schmitz F, Konigstorfer A, Sudhof TC (2000) RIBEYE, a component of synaptic ribbons: a protein's journey through evolution provides insight into synaptic ribbon function. Neuron 28: 857-872. [DOI] [PubMed] [Google Scholar]
- Sjostrand FS (1953) The ultrastructure of the outer segments of rods and cones of the eye as revealed by the electron microscope. J Cell Physiol 42: 15-44. [DOI] [PubMed] [Google Scholar]
- Smith CA, Sjostrand FS (1961) Structure of the nerve endings on the external hair cells of the guinea pig cochlea as studied by serial sections. J Ultrastruct Res 5: 523-556. [DOI] [PubMed] [Google Scholar]
- Taylor JS, Van de Peer Y, Braasch I, Meyer A (2001) Comparative genomics provides evidence for an ancient genome duplication event in fish. Philos Trans R Soc Lond B Biol Sci 356: 1661-1679. [DOI] [PMC free article] [PubMed] [Google Scholar]
- Tomita K, Moriyoshi K, Nakanishi S, Guillemot F, Kageyama R (2000) Mammalian achaete-scute and atonal homologs regulate neuronal versus glial fate determination in the central nervous system. EMBO J 19: 5460-5472. [DOI] [PMC free article] [PubMed] [Google Scholar]
- Trevarrow B, Marks DL, Kimmel CB (1990) Organization of hindbrain segments in the zebrafish embryo. Neuron 4: 669-679. [DOI] [PubMed] [Google Scholar]
- Van Epps HA, Yim CM, Hurley JB, Brockerhoff SE (2001) Investigations of photoreceptor synaptic transmission and light adaptation in the zebrafish visual mutant nrc. Invest Ophthalmol Vis Sci 42: 868-874. [PubMed] [Google Scholar]
- Van Epps HA, Hayashi M, Lucast L, Stearns GW, Hurley JB, De Camilli P, Brockerhoff SE (2004) The zebrafish nrc mutant reveals a role for the polyphosphoinositide phosphatase synaptojanin 1 in cone photoreceptor ribbon anchoring. J Neurosci 24: 8641-8650. [DOI] [PMC free article] [PubMed] [Google Scholar]
- Verhage M, Maia AS, Plomp JJ, Brussaard AB, Heeroma JH, Vermeer H, Toonen RF, Hammer RE, van den Berg TK, Missler M, Geuze HJ, Sudhof TC (2000) Synaptic assembly of the brain in the absence of neurotransmitter secretion. Science 287: 864-869. [DOI] [PubMed] [Google Scholar]
- von Gersdorff H, Vardi E, Matthews G, Sterling P (1996) Evidence that vesicles on the synaptic ribbon of retinal bipolar neurons can be rapidly released. Neuron 16: 1221-1227. [DOI] [PubMed] [Google Scholar]
- Von Kriegstein K, Schmitz F (2003) The expression pattern and assembly profile of synaptic membrane proteins in ribbon synapses of the developing mouse retina. Cell Tissue Res 311: 159-173. [DOI] [PubMed] [Google Scholar]
- Von Kriegstein K, Schmitz F, Link E, Sudhof TC (1999) Distribution of synaptic vesicle proteins in the mammalian retina identifies obligatory and facultative components of ribbon synapses. Eur J Neurosci 11: 1335-1348. [DOI] [PubMed] [Google Scholar]
- Wang Y, Okamoto M, Schmitz F, Hofmann K, Sudhof TC (1997) Rim is a putative Rab3 effector in regulating synaptic-vesicle fusion. Nature 388: 593-598. [DOI] [PubMed] [Google Scholar]
- Westerfield M (1993) The zebrafish book. Eugene, OR: University of Oregon.
- Yazulla S, Studholme KM (2001) Neurochemical anatomy of the zebrafish retina as determined by immunocytochemistry. J Neurocytol 30: 551-592. [DOI] [PubMed] [Google Scholar]
- Zenisek D, Davila V, Wan L, Almers W (2003) Imaging calcium entry sites and ribbon structures in two presynaptic cells. J Neurosci 23: 2538-2548. [DOI] [PMC free article] [PubMed] [Google Scholar]


