

Abstract
Retinal ganglion cells adapt their responses to the amplitude of fluctuations around the mean light level, or the “contrast.” But, in mammalian retina, it is not known whether adaptation arises exclusively at the level of synaptic inputs or whether there is also adaptation in the process of ganglion cell spike generation. Here, we made intracellular recordings from guinea pig Y-type ganglion cells and quantified changes in contrast sensitivity (gain) using a linear-nonlinear analysis. This analysis allowed us to measure adaptation in the presence of nonlinearities, such as the spike threshold, and to compare adaptation in subthreshold and spiking responses. At high contrast (0.30), relative to low contrast (0.10), gain reduced to 0.82 ± 0.016 (mean ± SEM) for the subthreshold response and to 0.61 ± 0.011 for the spiking response. Thus, there was an apparent reduction in gain between the subthreshold and spiking response of 0.74 ± 0.013. Control experiments suggested that the above effects could not be explained by an artifact of the intracellular recording conditions: extracellular recordings showed a gain change of 0.58 ± 0.022. For intracellular recordings, negative current reduced the spike output but did not affect the gain change in the subthreshold response: 0.80 ± 0.051. Thus, adaptation in the subthreshold response did not require spike-dependent conductances. We conclude that the contrast-dependent gain change in the spiking response can be explained by both a synaptic mechanism, as reflected by responses in the subthreshold potential, and an intrinsic mechanism in the ganglion cell related to spike generation.
Keywords: gain control, membrane potential, action potential, intrinsic property, Y-cell, α-cell
Introduction
The visual system faces a fundamental problem: how to encode the wide range of light intensities in the environment with the intrinsically narrow range of spiking output in neuronal responses. Neuronal responses must therefore adapt [i.e., adjust their sensitivity (gain) to the distribution of intensities in the immediate environment]. Major adaptive mechanisms must occur early in the system, otherwise small signals would be lost from insufficient gain, and large signals would be distorted because of response saturation.
Adaptation requires several stages. The visual system adapts to the mean intensity over ∼8-10 log units (“light adaptation”) (Shapley and Enroth-Cugell, 1984; Walraven et al., 1990; Troy and Enroth-Cugell, 1993; Pugh et al., 1999). Furthermore, the visual system adapts to the range of deviations in intensity, or the “contrast” (Shapley and Victor, 1978; Victor, 1987; Smirnakis et al., 1997; Chander and Chichilnisky, 2001; Kim and Rieke, 2001). As either mean intensity or contrast increases, cells in the retina (and throughout the visual system) generally decrease their sensitivity and shorten their integration time. The decreased sensitivity keeps the response within the dynamic range of the cell; the shortened integration time filters out low temporal frequencies that are generally redundant and thus carry little information.
Retinal ganglion cells express both fast and slow forms of contrast adaptation. After a step to high contrast, there is a relatively rapid drop in sensitivity that persists for the duration of high contrast (“contrast gain control”) accompanied by a rise in spike rate that slowly declines over several seconds. At the switch back to low contrast, there is a relatively rapid rise in sensitivity that persists accompanied by a drop in spike rate that slowly recovers over several seconds (Victor, 1987; Chander and Chichilnisky, 2001; Kim and Rieke, 2001; Baccus and Meister, 2002; Demb, 2002; Solomon et al., 2004). The slow changes in spike rate seem to arise from slow shifts in the baseline membrane potential, which alter the ability of the cell to spike (i.e., by moving the membrane potential closer to or farther from spike threshold) but do not otherwise change contrast gain (Baccus and Meister, 2002; Solomon et al., 2004). In this study, we stimulated with relatively short periods at low and high contrast and focused on the fast form of adaptation.
In mammalian retina, fast contrast adaptation has been studied only by extracellular recording, and therefore cellular mechanisms for adaptation are not well understood (Shapley and Victor, 1978; Victor, 1987; Smirnakis et al., 1997; Benardete and Kaplan, 1999; Brown and Masland, 2001; Chander and Chichilnisky, 2001; Baccus and Meister, 2002). Computational models place an adaptive mechanism before spike generation (Shapley and Victor, 1978; Victor, 1987; Chander and Chichilnisky, 2001). However, in amphibian retina, a significant contribution to adaptation is intrinsic to spike generation (Kim and Rieke, 2001, 2003). Our goal was to make intracellular recordings in mammalian Y-type ganglion cells and determine to what extent adaptation of synaptic inputs, as reflected by responses in the subthreshold membrane potential, could explain adaptation in spiking output.
Materials and Methods
Intracellular recording
In some experiments, a guinea pig was anesthetized with ketamine (100 mg/kg-1), xylazine (20 mg/kg-1), and pentobarbital (150 mg/kg-1), and both eyes were removed, after which the animal was killed by anesthetic overdose [in accordance with University of Pennsylvania and National Institutes of Health (NIH) guidelines]. In other experiments, a guinea pig was anesthetized with ketamine (40 mg/kg-1) and xylazine (4 mg/kg-1) and decapitated, and both eyes were removed (in accordance with University of Michigan and NIH guidelines). The whole retina attached to the pigment epithelium, choroid, and sclera was mounted flat in a chamber on a microscope stage and superfused (∼4 ml/min) with oxygenated (95% O, 5% CO2) Ames medium (Sigma, St. Louis, MO) at 32-36°C (Demb et al., 1999). In some experiments, glucose was added to the medium (0.8 g/L).
In some experiments, Acridine orange (0.001%; Molecular Probes, Eugene, OR) was added to the superfusate, allowing ganglion cell somas to be identified by fluorescence during brief exposure to UV light. A glass electrode (tip resistance, 80-200 MΩ), filled with 1% pyranine (Molecular Probes) in 2 m potassium acetate, was used to penetrate large somas in the visual streak. Recordings were made using an intracellular amplifier (NeuroData, IR-283; NeuroData Instruments Corp., Delaware Water Gap, PA), and data were stored on a computer (AxoScope software; Axon Instruments, Foster City, CA). In other experiments, we identified large somas using differential interference contrast imaged with a cooled CCD camera (Retiga 1300C, QCapture software; Qimaging Corporation, Burnaby, British Columbia, Canada) (Hu et al., 2000). Positive pressure was applied through a patch electrode, filled with Ames medium, and this electrode was used to “burrow” through the inner limiting membrane and clean the area surrounding the targeted cell (Roska and Werblin, 2001). This electrode was withdrawn, and a second electrode (4-8 MΩ; fire polished) filled with intracellular solution was used to obtain a >1 GΩ seal. The patch was ruptured, and current-clamp recordings were made in the whole-cell configuration (access resistance, <30 MΩ) using a MultiClamp 700A amplifier and pClamp software (Axon Instruments). The intracellular solution contained (in mm) 140 K methylsulfate, 8 NaCl, 10 HEPES, 0.1 EGTA, 2 ATP-Mg, and 0.3 GTP-Na2, adjusted to pH 7.3. Extracellular recordings were made with patch electrodes filled with Ames medium. Loose-patch recordings were obtained with 30-100 MΩ seals.
The membrane potential was amplified, continuously sampled at 5-10 kHz, and stored on a computer as described previously (Demb et al., 1999, 2004). Programs were written in Matlab (Mathworks, Natick, MA) to analyze responses (down-sampled to 1 kHz) separately in the spike rate and subthreshold membrane potential, as described previously (Demb et al., 2001a, 2004; Zaghloul et al., 2003). Junction potential was corrected in all cases. In some recordings, current was injected through the pipette. In these cases, membrane potential was corrected for unbalanced electrode resistance off-line as described previously (intracellular electrodes) (Zaghloul et al., 2003) or on-line using MultiClamp 700A software (patch electrodes).
Visual stimulus
The stimulus was displayed on a miniature monochrome computer monitor (Lucivid MR1-103; Microbrightfield, Colchester, VT) projected through a microscope port and through a 2.5× or 4× objective focused on the photoreceptors (mean luminance, ∼104 isomerizations cone-1 s-1; resolution, 640 × 480 pixels; 60 Hz vertical refresh). The relationship between gun voltage and monitor intensity was linearized in software with a lookup table. Stimuli were programmed in Matlab as described previously (Brainard, 1997; Pelli, 1997; Demb et al., 1999). To confirm cell type, a series of spots, annuli, and gratings were presented to ensure that the cell had the expected properties: a “brisk-transient” center response to a spot (500 μm diameter), an antagonistic surround response to an annulus (inner diameter, 740 μm; outer diameter, 2000 μm), and a nonlinear (frequency-doubled) response to a contrast-reversing grating (spatial frequency, 4.3 cycles/mm) (Enroth-Cugell and Robson, 1966; Cleland and Levick, 1974; Hochstein and Shapley, 1976; Demb et al., 2001a,b).
The main contrast experiment used a dynamic modulation of a spot (diameter, 500 μm) centered on the cell body and therefore approximately centered on the dendritic tree. Y-type ganglion cells in the guinea pig retina have a receptive field center that is ∼500-800 μm in diameter (Demb et al., 2001a,b; Dhingra et al., 2003). The spot intensity was updated at 60 Hz with values drawn randomly from a Gaussian distribution with zero mean and an SD of 0.3 (high contrast) or 0.1 (low contrast). This stimulus approximates “white noise.” The stimulus lasted 240 s and included 12 20 s periods: 10 s of high contrast and 10 s of low contrast (see Fig. 1). In some cases, there was an additional low contrast half-period at the beginning of the stimulus that was not analyzed. The main analysis was performed on data collected during the last 8 s of each half-period. Thus, for each contrast, there was 8 × 12 = 96 s of data. This relatively short stimulus increased the probability of highly stable intracellular recordings and provided data with a sufficient signal/noise ratio for the main analysis. Because of the alternating contrast half-periods, any instabilities during the recording should be randomly distributed equally between high and low contrast.
Figure 1.
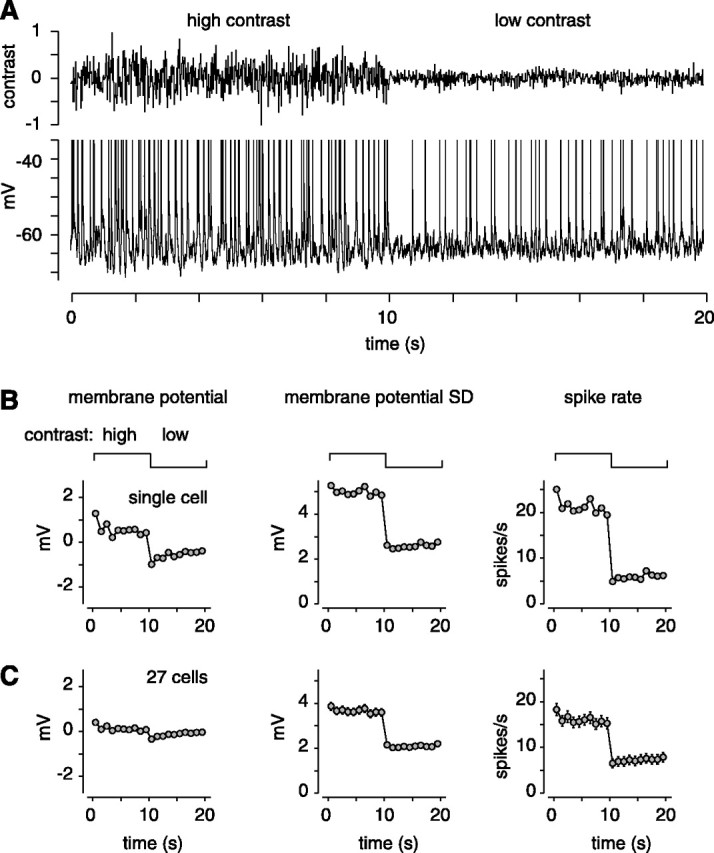
Switching contrast causes rapid changes in the membrane potential and the spike rate. A, Raw recording to a stimulus period of high contrast (10 s) and low contrast (10 s). In total, 12 periods were analyzed. Intracellular recording of an OFF cell is shown. B, Average responses across the 20 s period (in 1 s bins): average membrane potential (relative to the average across the 20 s period), SD of membrane potential, and average spike rate. At high contrast, the cell had a more depolarized membrane potential, a larger membrane potential SD, and a higher spike rate. These measures changed only modestly during the last 8 s of each contrast half-period. C, Average responses across the 20 s period (n = 27 cells). Error bars indicate ±1 SEM across cells.
Analyses
Linear-nonlinear model. We analyzed both subthreshold and spiking responses using a linear-nonlinear (L-N) model (Chichilnisky, 2001; Kim and Rieke, 2001; Baccus and Meister, 2002; Zaghloul et al., 2003). One goal of the L-N model was to create, at each contrast level, a relatively compact functional description of the response. A second goal was to describe the effect of contrast, if possible, as a change in only one stage of the model. As reported previously, we found it possible to describe the effect of contrast as a change in the L filter with a contrast-independent N stage (Chander and Chichilnisky, 2001; Kim and Rieke, 2001; Rieke, 2002).
To calculate the L-N model, we first computed the L filter [f(t)] by taking the cross-correlation between the stimulus and the response (Wiener, 1958; Lee and Schetzen, 1965; Sakai et al., 1995; Chichilnisky, 2001). To generate the L model of response (rL), we convolved (*) the stimulus [s(t)] and the L filter as follows: rL(t) = f(t)* s(t).
The L model emphasizes certain temporal properties of the stimulus (see Fig. 2 A). Next, the L model is passed through a nonlinear input-output function to generate an L-N model of the response (see Fig. 2 A). The N function accounts for rectification (e.g., the spike threshold) and saturation in the response (Victor, 1987; Sakai et al., 1995; Chichilnisky, 2001; Kim and Rieke, 2001; Baccus and Meister, 2002; Zaghloul et al., 2003).
Figure 2.

L-N model of subthreshold and spiking responses. A, The L-N model. For membrane potential (top row), the stimulus was convolved with an L filter to generate the L model. The L model is passed through the static N input-output function to generate the L-N model. The bottom row shows the same procedure for the spiking response (see Materials and Methods). B, L-N model fits to the membrane potential are shown for 1 s of data at high and low contrast (smooth, gray lines). Dashed line indicates resting potential. Model predictions of the spike rate are shown above the traces. The L and N components for this cell are shown in Figure 3, A and B.
To generate the N function, we plotted the L model versus the actual response (at 1 kHz) and binned the data (∼3400 samples/bin) (see Fig. 3). These binned points represent the average response output (e.g., in spikes per second) at various levels of the L model prediction (in arbitrary “input” units). For reasons mentioned below, it was useful to have a descriptive function fitted through the points of the N function. A Gaussian cumulative distribution function (cdf) provides a good fit to the spike N function (Chander and Chichilnisky, 2001; Zaghloul et al., 2003): f(x) = αC(βx + γ), where C() is the cumulative normal density and the parameters approximately correspond to the maximum response (α), the response gain (β), and the spike threshold (γ) (Chander and Chichilnisky, 2001; Chichilnisky, 2001). The fit was performed using standard routines in Matlab that minimize the mean-squared error (MSE) between the data and the fitted line. For the membrane N points, we fit the data with the following function: f(x) = αC(βx + γ) + δ, where the additional parameter δ allows for a vertical offset (because the membrane N function goes negative) (see Fig. 3). As we found previously, the Gaussian cdf provided a good fit for the membrane potential N function for ON cells but not for OFF cells (Zaghloul et al., 2003). Thus, for OFF cells we fit the positive and negative sides of the membrane N function separately (Zaghloul et al., 2003). Finally, to generate the L-N model output [rLN(t)], the L model was passed through the N function: rLN(t) = N(rL(t)).
Figure 3.

High contrast reduced the gain to a greater extent for the spiking response compared with the subthreshold response. A, The L-N model for an OFF cell (same cell as in Figs. 1 A, B, 2). The N functions for both membrane potential and spikes were fit (smooth lines) such that gain differed between contrast conditions. Then, the x-axis of the low-contrast N function could be stretched into alignment with the high-contrast N function; the y-axis of the low-contrast L filter was stretched by the same factor to keep the model output constant (see Materials and Methods). B, Same cell as in A after scaling. Here, for spikes, there were unique L filters at each contrast that passed through a common N function. For membrane potential, there were unique filters at each contrast that passed through a common N function, except for a small change in the y-offset (<0.1 mV). High contrast reduced the gain to 0.83 for the subthreshold response and to 0.62 for the spiking response. C, Same as in B for an ON cell, high contrast reduced the gain to 0.74 for the subthreshold response and to 0.54 for the spiking response. For the subthreshold response, high contrast reduced the y-offset of the N function by 0.5 mV.
We and others have found that the response (spikes or membrane potential) is predicted nearly as well by the L-N model as by the averaged response across repeated measurements (Chichilnisky, 2001; Kim and Rieke, 2001; Rieke, 2001; Zaghloul et al., 2003).
Simultaneous fit of low- and high-contrast spike responses. At this point, we have an L-N model that could be fit to low- and high-contrast conditions independently. However, it is useful, if possible, to describe the effect of contrast in only one stage of the model. This can be achieved by describing the N function as invariant with contrast; then the contrast-dependent effect could be represented solely in the L filters. There is a free scale factor in the L-N model, such that the y-axis of the L filter and the x-axis of the N function can be scaled by the same amount without changing the L-N model output (Chander and Chichilnisky, 2001; Kim and Rieke, 2001). Thus, the goal was to fit both low- and high-contrast N functions with Gaussian cdfs that differed only by a scale factor along the x-axis. Then, the x-axis of the low-contrast N function could be stretched until it aligned with the high-contrast N function, and the N function would be contrast invariant.
For spike responses, we performed a simultaneous fit of low- and high-contrast N functions in which the Gaussian cdf parameters α and γ were shared between contrasts but β was unique for each contrast (see Fig. 3A). For this fit, the x-axis of the low-contrast curve could be stretched by the factor βlow/βhigh so that the low-contrast function aligned with the high-contrast function. To keep the model output constant, the low-contrast L filter was scaled (y-axis stretched) by the same factor, βlow/βhigh (see Fig. 3B). The output of these models is identical; but in the second case, the effect of contrast is represented solely in the L filters (see Fig. 3B).
For the spike N functions, the fitting procedure used four parameters. Fitting the low- and high-contrast curves independently uses six parameters. The fits minimize MSE, and so increasing the number of parameters reduces MSE: from 3.21 ± 0.65 spikes/s (four parameters) to 1.74 ± 0.27 (six parameters) (n = 27 cells). However, the r2 between the fitted line and the data points (i.e., the amount of variance the fit explains in the binned data) was already ∼1.0 for the four-parameter fit: low contrast, r2 = 0.967 ± 0.005; high contrast, r2 = 0.996 ± 0.007. (The r2 was calculated for the positive values of the input axis, so there were not a large number of zero values in the calculation.)
We considered an alternative form of the L-N model for the spike response, in which both the gain and the threshold for spiking could change with contrast; this allowed the two N functions to be shifted horizontally relative to one another. This was similar to the four-parameter fit, except that the Gaussian cdf allowed both γ and β to vary independently between contrast conditions, for a total of five parameters. Using this form of the L-N model, the gain change at high contrast was within 10% of the change calculated using the simpler, four-parameter model. The five-parameter version of the model added a parameter without explaining significantly more variance in the data. Thus, we did not pursue this analysis further.
Simultaneous fit of low- and high-contrast subthreshold responses. For the subthreshold membrane potential response, we fit both low- and high-contrast N functions with the Gaussian cdf plus offset mentioned above. The low- and high-contrast functions were fit with the same α and γ parameters but unique β and δ parameters. Thus, the fitted N functions were similar to those for the spike N functions, except that membrane potential N functions were allowed to have unique offsets (i.e., unique y-intercepts because of the unique δ) (see Fig. 3). The unique offsets seemed necessary, because in some cases the y-intercept of the membrane N function differed between contrasts by up to 1 mV (see below) (Baccus and Meister, 2002). The MSE between the fits and the data were nearly the same for the simultaneous fits (six parameters) as for the independent fits (eight parameters) (MSE, in both cases, rounded to 0.007 ± 0.0012 mV). The r2 between the fitted line and the binned data was also similar for the simultaneous and independent fits with average values for the two fitting procedures at the two contrast levels of ∼0.99 and 1.0. (Similar to the spike analysis, r2 was calculated for positive values of the input axis, which correspond to the depolarizations that would drive spiking.)
For reasons mentioned above, we performed the simultaneous fit for OFF cells using just the positive values of the membrane N functions, but when fitting these positive values, the negative side of the function also aligned (see Fig. 3B). In general, the main result across cells was robust to fitting the membrane N function positive values alone (high-contrast gain reduced to 0.84 ± 0.016), negative values alone (0.80 ± 0.017), or all values (0.83 ± 0.012).
Measurement of contrast gain
We quantified the gain change between low and high contrast in two ways. First, we passed a common input through the low- and high-contrast L filters to create low- and high-contrast L models and took the ratio of the SD of these (dimensionless) units (high/low) (Baccus and Meister, 2002). Second, we measured the ratio of the absolute peak amplitudes of the initial response in the L filters (high/low) (Chander and Chichilnisky, 2001; Kim and Rieke, 2001). These two measures could yield different results, because the first measure alone is sensitive to the full shape of the filter. However, in practice, both measures gave similar results.
Data are reported as mean ± SEM. Statistical significance was assessed using one-tailed t tests.
Results
Basic cellular properties
We analyzed intracellular responses from 27 cells. Cells were Y-type (brisk-transient) ganglion cells, known to express contrast adaptation strongly (Shapley and Victor, 1978; Kaplan and Benardete, 2001). To record Y-cells, we targeted the largest somas in the ganglion cell layer (diameter, 20-25 μm) (Peichl et al., 1987). Cell type was confirmed by measuring the center/surround receptive field and nonlinear subunit responses, as described previously (Hochstein and Shapley, 1976; Demb et al., 1999, 2001a,b). We achieved stable recordings most commonly from OFF-center cells (n = 23), but results were consistent in a smaller number of ON-center cells (n = 4). At photopic mean luminance, cells had a resting potential of -62.0 ± 1.0 mV and a maintained discharge of 5.4 ± 1.0 spikes/s (mean ± SEM).
Effect of contrast on membrane potential and spike rate
A cell was stimulated with a contrast switching experiment, in which a 10 s low-contrast half-period alternated with a 10 s high-contrast half-period (12 periods total) (Fig. 1A). The stimulus was a dynamically modulated spot (diameter, 500 μm) over the dendritic tree (i.e., receptive field center) (Demb et al., 2001a). The spot intensity was updated at 60 Hz with intensities drawn from a Gaussian distribution with a constant zero mean but an alternating SD that changed by a factor of three (high contrast, 0.3 SD; low contrast, 0.1 SD).
In the example shown in Figure 1B, the transition from high to low contrast (at 10 s) caused a 1.4 mV hyperpolarization. Furthermore, within each contrast half-period, there were slow changes in membrane potential, especially in the first 1-2 s. At the transition to low contrast, the SD of the membrane potential and the average spike rate both showed a rapid drop, with only modest changes within each half-period.
On average, there was a rapid transition at the switch to low contrast that caused a hyperpolarization (0.42 ± 0.13 mV), a drop in membrane potential SD (1.5 ± 0.1 mV), and a drop in spike rate (8.7 ± 0.7 spikes/s) (Fig. 1C). Within a contrast half-period, the response was relatively stable between 2 and 10 s after the switch: there was, on average, a <0.2 mV change in membrane potential, a <0.2 mV change in membrane potential SD, and a <1.5 spikes/s change in spike rate. We therefore analyzed data collected during this period to examine changes in contrast gain.
Contrast adaptation is larger in the spiking response than in the subthreshold response
To quantify the contrast gain of a cell, we performed an L-N analysis separately for both membrane potential and spike rate (Chichilnisky, 2001; Zaghloul et al., 2003). In the first step, the response was modeled using a L filter, created by correlating the stimulus and the response (Fig. 2A) (see Materials and Methods). The L filter emphasizes certain temporal frequencies in the stimulus, and the N input-output function accounts for rectification and saturation in the response (Fig. 2) (see Materials and Methods). We modeled the response using unique L filters at each contrast with a contrast-independent N function (Fig. 3) (see Materials and Methods). Thus, the effect of contrast appears exclusively in the L filters (Chander and Chichilnisky, 2001; Kim and Rieke, 2001). We quantified the effect of contrast by measuring how the gain of the filter changed between conditions. To quantify the gain change, we measured, for a common input, how much the SD of the L model changed between low and high contrast (see Materials and Methods) (Baccus and Meister, 2002).
In each cell, we found that high contrast reduced the gain to a greater extent in the spiking response compared with the subthreshold response. For example, in one OFF cell, high contrast reduced the gain to 0.83 for the subthreshold response and to 0.62 for the spiking response (Fig. 3B). For one ON cell, high contrast reduced the gain to 0.74 for the subthreshold response and to 0.54 for the spiking response (Fig. 3C). Across the population of cells, high contrast reduced the gain of the subthreshold response to 0.82 ± 0.016 and reduced the gain of the spiking response to 0.61 ± 0.011 (n = 27) (Fig. 4A). We quantified the gain change at high contrast between the subthreshold and spiking responses by dividing their relative gains (spiking gain/subthreshold gain): 0.74 ± 0.013 (p < 0.001).
Figure 4.

Population analysis showed a relatively large effect of contrast on the spiking response for both gain and integration time. A, The effect of contrast on gain for membrane potential versus spikes. Here and for B, light circles represent ON cells and dark circles represent OFF cells. Points all lie below the diagonal, showing that the gain change was always larger in the spiking response. The gain measure was based on the SD of the L model (see Materials and Methods). B, The effect of contrast on the integration time, measured as the time to zero-crossing (see inset; arrow points to zero-crossing). Points all lie below the diagonal, showing that the shortening of the integration time was always larger in the spiking response.
We also quantified gain in a second way, by measuring the absolute value of the initial response peak in the L filter (Chander and Chichilnisky, 2001; Kim and Rieke, 2001; Rieke, 2001). By this measure, high contrast reduced the gain of the subthreshold response to 0.84 ± 0.016 and reduced the gain of the spiking response to 0.63 ± 0.015 (n = 27). The gain was reduced between the subthreshold and spiking responses to 0.75 ± 0.016 (p < 0.001). Thus, by both measures, there was both a gain change between the stimulus and subthreshold response (∼0.82-0.84) and a gain change between the subthreshold and spiking response (∼0.74-0.75).
In some cases, the gain change at high contrast was accompanied by a shift in the membrane potential. For example, in the ON cell in Figure 3C, we observed at high contrast a vertical shift in the membrane N function (shift in the y-intercept) of -0.50 mV. On average, there was very little vertical shift of the membrane potential N function at high contrast (-0.14 ± 0.05 mV; p < 0.01; n = 27). Individual cells showed a shift of up to 1 mV (range, -1.0 to 0.3 mV), but this was relatively small compared with the response range of 12.4 ± 0.6 mV (n = 27). For spike N functions, shifts in the y-intercept were very modest at -0.5 ± 0.3 spikes/s (p < 0.05; n = 27; range, -5.4 to 0.9 spikes/s), relative to the response range of 119.8 ± 8.2 spikes/s (n = 27).
Effect of contrast on integration time is larger in the spiking response than in the subthreshold response
We expected that, in addition to reducing gain, high contrast would also shorten the integration time (Shapley and Victor, 1978; Victor, 1987; Benardete et al., 1992; Chander and Chichilnisky, 2001; Kim and Rieke, 2001; Baccus and Meister, 2002). To quantify integration time, we measured the time for the L filter to cross zero after the first peak (Fig. 4B, inset), and we measured how much faster this occurred at high contrast relative to low contrast. For the membrane L filter, the zero-crossing was 88.5 ± 2.6 ms at high contrast and 91.9 ± 2.6 ms at low contrast. Thus, high contrast sped up integration time, relative to low contrast, to 0.96 ± 0.006 (3.4 ± 0.61 ms faster). For the spike L filter, the zero-crossing was 69.7 ± 2.2 ms at high contrast and 77.1 ± 2.3 ms at low contrast. Thus, high contrast sped up integration time, relative to low contrast, to 0.90 ± 0.009 (7.5 ± 0.68 ms faster; n = 27). The effect of contrast on integration time was larger for spikes (p < 0.001). Thus, shortened integration time in the spike L filter could be explained partially by an effect in the membrane L filter.
We examined how contrast reduced the gain of different frequencies by taking the Fourier transform of the L filters. We averaged across OFF cells, which we recorded most commonly (n = 23), the Fourier amplitudes at 1-30 Hz (Fig. 5). Over this frequency range, the stimulus power (squared Fourier amplitudes) was relatively flat (Fig. 5C). High contrast reduced the gain mostly for the lowest temporal frequencies, ∼1-10 Hz. At these frequencies, the effect of contrast was larger for the spiking response than for the subthreshold response. Furthermore, the shape of the transform was more bandpass for the spiking response compared with the subthreshold response (Lankheet et al., 1989; Demb et al., 2001b). To further investigate the effect of contrast on the temporal properties of the filter, we examined the phase shift at 8 Hz (n = 27). At high contrast, this phase (in π radians) advanced by 0.23 ± 0.028 for the membrane L filter and by 0.37 ± 0.024 for the spike L filter. This phase advance is consistent with the above analysis in the time domain showing that contrast reduced the time to zero-crossing of the L filters.
Figure 5.
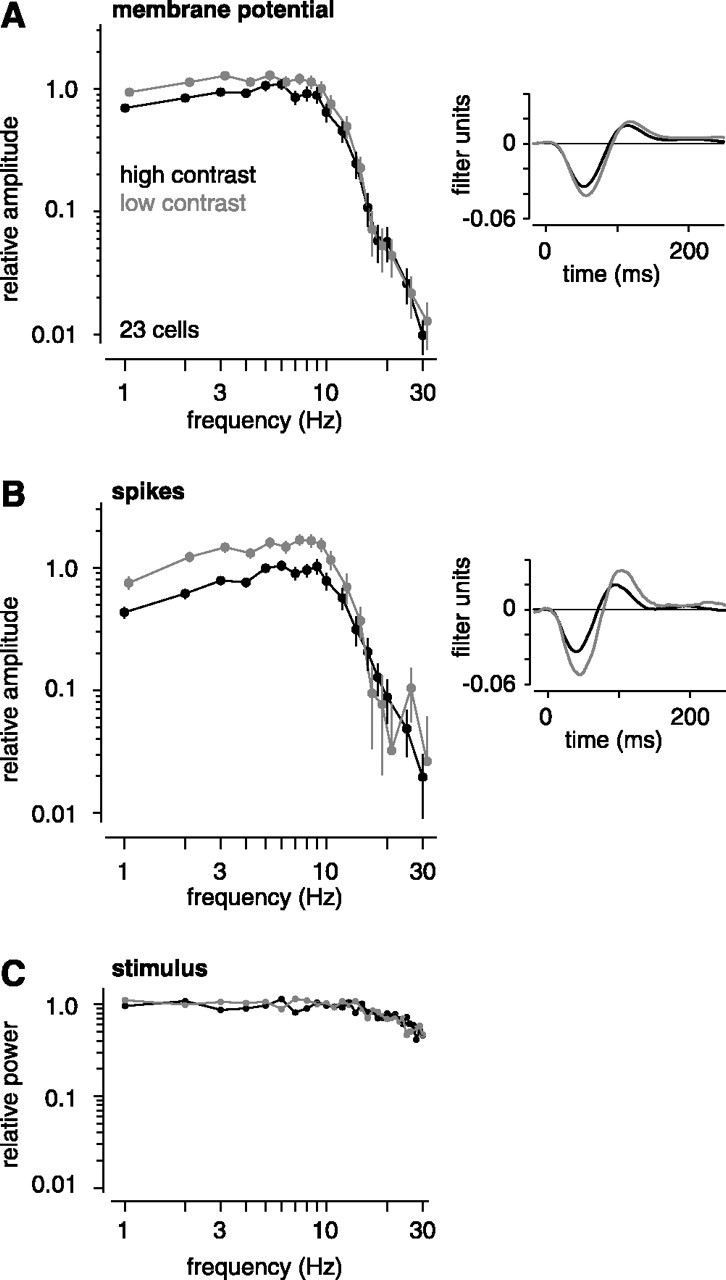
High contrast reduces the amplitude of low frequencies for both the subthreshold and spiking response. A, The Fourier transforms of OFF cell L filters (membrane potential) were averaged in the complex plane. The plot (left) shows the amplitudes (mean ± SEM across cells) at the following frequencies: 1-10, 12, 14, 16, 18, 20, 25, and 30 Hz (low-contrast curves are shifted slightly to the right). High-contrast selectively reduced the amplitude of low frequencies (∼1-10 Hz). On the right are the corresponding average L filters in the time domain. High contrast reduced the time for the filter to cross zero. B, Same as in A for the spike L filters. High contrast reduced the amplitude of low frequencies (∼1-10 Hz) in the Fourier transform and reduced the time for the filter to cross zero. C, Stimulus power (squared Fourier amplitudes) at 1-30 Hz. At both contrasts, power has been normalized to the amplitudes at 1-5 Hz. Power in the 1-30 Hz range was similar between contrasts and was relatively flat.
Control experiments confirm that gain reduction is larger in the spiking response than in the subthreshold response
One concern was that the process of intracellular recording might alter spiking properties of a cell and somehow affect the gain change at high contrast. We therefore measured the gain change in extracellular recordings (n = 8) (Fig. 6A). In these recordings, high contrast reduced gain to 0.58 ± 0.022 (L model SD measure; 0.61 ± 0.029 by the L filter peak measure). This gain change is similar to the values for intracellular recordings, and thus the process of intracellular recording did not seem to artificially elevate the effect on spiking.
Figure 6.
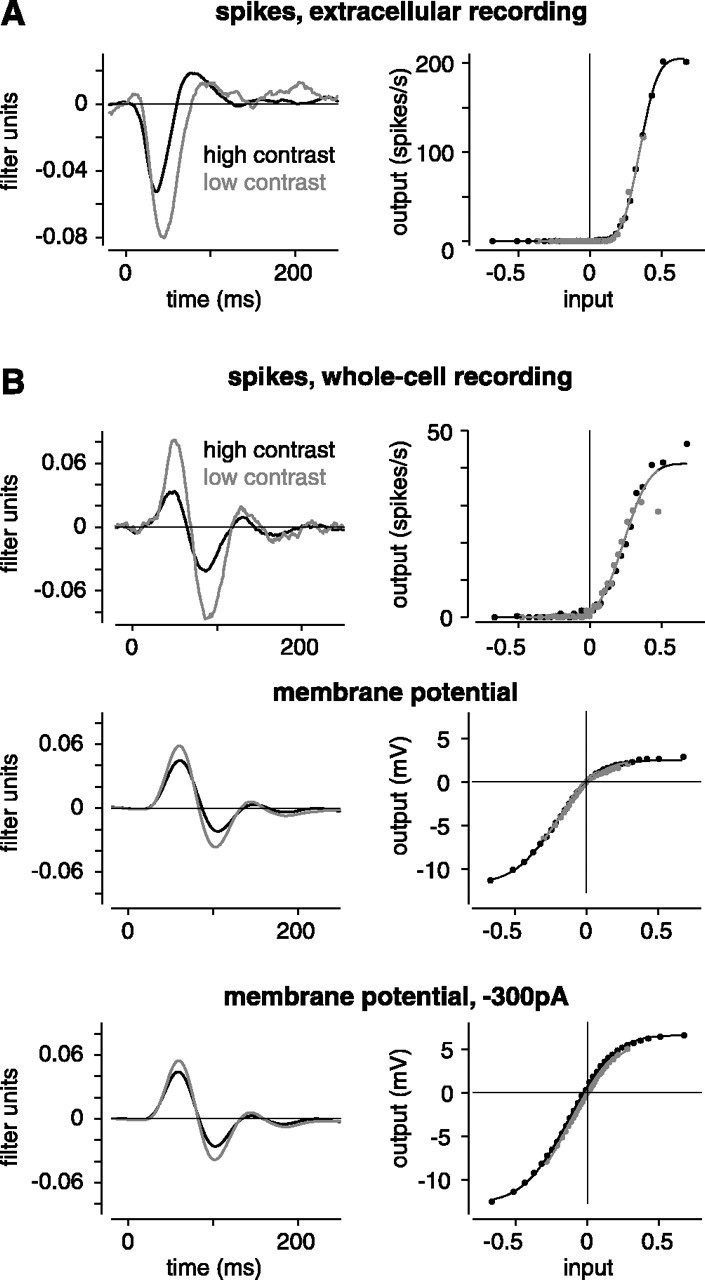
Control experiments confirm that contrast has a relatively large effect on gain of the spiking response. A, In an extracellular recording, high contrast reduced gain to 0.60 (same format as Fig. 3). B, In an intracellular recording, high contrast reduced gain to 0.46 for the spiking response and to 0.75 for the subthreshold response. The cell was hyperpolarized with current (-300 pA) to nearly eliminate spiking. Under these conditions, high contrast reduced gain to 0.77, similar to control conditions.
A second concern was that spiking responses might somehow obscure gain measurements in the subthreshold potential. We therefore injected hyperpolarizing current to reduce spiking partially or almost completely so that the membrane potential could be measured in the presence of lower spike rates (n = 5 cases in three cells; -100 to -500 pA). Figure 6B shows a striking example. In this case, the cell was recorded under control conditions (0 pA) and while injecting negative current (-300 pA). Under control conditions, the cell fired 2105 spikes during the stimulus, whereas during negative current injection, the cell fired only six spikes. However, the gain change in the membrane potential was nearly identical in the two cases: high contrast reduced gain to 0.75 under control conditions and to 0.77 with negative current. Across five recordings, the number of spikes reduced from 2266 ± 833 to 679 ± 373, but the gain reduction at high contrast remained constant (control, 0.80 ± 0.028; current, 0.80 ± 0.051; L model SD measure). We conclude that in the presence of spiking, the estimate of gain change in the membrane potential was not significantly underestimated. Furthermore, the gain change in the membrane potential apparently does not depend on conductances related to spiking.
Discussion
This study presents the first intracellular recordings of contrast adaptation in mammalian retinal ganglion cells. The main finding was that contrast adaptation was larger in the spiking response than in the subthreshold response (Figs. 3, 4, 5). This effect could not be explained by artifacts related to intracellular recording (Fig. 6). These results are summarized in Figure 7. At high contrast, the reduced gain in the spiking response (∼0.61) could be explained by both a reduced gain of the subthreshold response (∼0.82) and a reduced gain in the transformation from the subthreshold response to the spiking response (∼0.74). Under the present stimulus conditions, the latter gain change was larger. Future work will be required to determine how varying the stimulus conditions (e.g., relative contrast levels, spatial properties) would influence these two contributions to adaptation.
Figure 7.

Summary of adaptation effects in subthreshold and spiking responses. A, In measure 1, the same stimulus was convolved with low- and high-contrast L filters, and the gain was quantified as the SD of the L models (dashed lines on distributions at left). Values show a gain at high contrast relative to low contrast. The gain change between the stimulus and the subthreshold response (membrane) was 0.82, on average; the apparent gain change between subthreshold and spiking responses was 0.74, on average. This would cause again change in the spiking response of 0.61 (i.e., 0.82 × 0.74 = 0.61). The SEM for all values were between 0.01 and 0.02 (n = 27). B, Same as in A for measure 2: the absolute value of the first peak in the L filter (a) at high contrast relative to low contrast. Results were similar to those obtained using measure 1.
Mechanisms for contrast adaptation
Contrast adaptation is not present in recordings of photoreceptors or at least one of their postsynaptic targets (horizontal cells) (Sakai et al., 1995; Rieke, 2001; Baccus and Meister, 2002). Thus, mechanisms for adaptation seem to arise at a stage beyond photoreceptor glutamate release. Furthermore, contrast adaptation is present to differing degrees across ganglion cell types (Shapley and Victor, 1978; Benardete et al., 1992; Chander and Chichilnisky, 2001; Kaplan and Benardete, 2001; Kim and Rieke, 2001). Thus, mechanisms could possibly arise in the second synaptic layer of the retina, at which point different ganglion cell types collect inputs from unique collections of presynaptic bipolar and amacrine cell types (Masland, 2001; Sterling and Demb, 2004).
In the amphibian retina, intracellular studies of contrast adaptation suggest two classes of cellular mechanism. First, synaptic inputs to ganglion cells adapt, which could be explained, either completely or only partially, by a gain change in presynaptic bipolar cells (Kim and Rieke, 2001; Rieke, 2001; Baccus and Meister, 2002). Bipolar cells seem to adapt based on intrinsic properties related to calcium influx and mean voltage (Mao et al., 1998; Rieke, 2001). Second, experiments using currents injected directly into the ganglion cell soma suggest that the spiking mechanism can itself adapt (Kim and Rieke, 2001, 2003). Theoretical studies also suggest an adaptive effect in spike generation (Yu and Lee, 2003).
Our results suggest similar mechanisms for contrast adaptation in mammalian cells. Adaptation in the subthreshold response implies adaptation of synaptic inputs (Figs. 3, 4, 5). The relatively larger adaptation in the spiking response suggests a second adaptive mechanism intrinsic to the ganglion cell. One likely explanation is an increased proportion of inactivated sodium channels at high contrast, as observed in isolated salamander ganglion cell somas (Kim and Rieke, 2003).
Based on previous work, an adaptive mechanism intrinsic to ganglion cell spike generation might be unexpected. Several extracellular studies examined the effect of spike output on gain control by varying the spatial position of a grating (Shapley and Victor, 1978; Victor and Shapley, 1979; Benardete and Kaplan, 1999). The grating was positioned to elicit a large response (peak position) or a small response (near-null position). Relative to a low-contrast grating in the peak position, high-contrast gratings in either peak or near-null positions elicited bandpass tunings in the L filter. Thus, bandpass filtering at high contrast was independent of the level of spike output. However, these studies did not examine the low-contrast response in the near-null position (perhaps because the response was too small), and therefore the studies did not measure the effect of grating position on gain. Here, we measured directly the gain change in intracellular recordings and found a significant adaptive effect in the transformation from the subthreshold response to the spiking response.
Effect of contrast on integration time
Our study and previous ones suggest that high contrast decreases the integration time of the L filter (time to zero-crossing) (Fig. 4B) (Victor, 1987; Chander and Chichilnisky, 2001; Kaplan and Benardete, 2001; Kim and Rieke, 2001; Baccus and Meister, 2002). Under our conditions (spot stimulus, threefold change in contrast), the integration time of the membrane L filter sped up at high contrast, relative to low contrast, by a modest amount, ∼0.96. In membrane currents recorded in salamander, a similar measurement (time to peak) showed that the L filter sped up to ∼0.90 for ganglion cells and ∼0.95 for bipolar cells (Kim and Rieke, 2001; Rieke, 2001). Under different conditions (full-field stimulus, sevenfold change in contrast), the salamander ganglion cell membrane L filter sped to ∼0.80 (Baccus and Meister, 2002). Thus, our modest effect on membrane L filter integration time could be explained by our threefold change in contrast and possibly the small stimulus.
For the spike L filter, our results were consistent with previous measurements. At high contrast, relative to low contrast, the L filter integration time sped up to ∼0.90. This was similar to extracellular measurements in monkey parasol cells (Chander and Chichilnisky, 2001). Furthermore, we measured the phase advance in the 8 Hz component of the Fourier transform of the L filter, ∼0.37 π radians. This was similar to extracellular measurements in cat and monkey ganglion cells in vivo (Shapley and Victor, 1978; Benardete and Kaplan, 1999). Furthermore, high contrast mainly suppressed the output at low frequencies, ∼1-10 Hz, similar to findings in salamander (Kim and Rieke, 2001), monkey (Benardete and Kaplan, 1999), and cat (Shapley and Victor, 1978; Victor, 1987). However, the effect in cat was typically more dramatic than in our cells (Shapley and Victor, 1978).
Differences between ON and OFF cells
In monkey retina, ON and OFF parasol cells showed asymmetries in contrast adaptation. ON cells showed a relatively larger reduction in gain, whereas OFF cells showed a relatively larger shortening of integration time (Chander and Chichilnisky, 2001) (but see Benardete and Kaplan, 1999). In our Y-cells, we recorded from a limited number of ON cells, but still we found the same pattern of results. For spikes, ON cells showed a larger reduction in gain (0.54 ± 0.051) relative to OFF cells (0.65 ± 0.014; p < 0.01) (Fig. 7, measure 2). Furthermore, OFF cells showed a trend toward a larger reduction in integration time (0.90 ± 0.010) relative to ON cells (0.94 ± 0.018; p < 0.10). These results suggest consistent ON/OFF asymmetries across mammalian species.
Fast versus slow forms of adaptation
We observed relatively small slow shifts in the membrane potential and spike rate within each 10 s contrast half-period (Fig. 1). Although the magnitude of these shifts were relatively small, their pattern was consistent with a previous study (Baccus and Meister, 2002). However, during the period of the L-N analysis (last 8 s), our results did not seem to be explained by slow shifts in membrane potential or spike rate. Changes in mean and SD of membrane potential were small (<0.2 mV) compared with the range of light-driven responses, ∼12 mV. Similarly, changes in mean firing rate were small (<1.5 spikes/s) relative to the range of light-driven responses, ∼120 spikes/s. Previous studies observed larger slow shifts in the spike rate and the baseline membrane potential, but these studies used longer contrast periods (30-100 s half-periods) (Smirnakis et al., 1997; Brown and Masland, 2001; Baccus and Meister, 2002; Solomon et al., 2004). Indeed, when we have used longer half-periods, we also observed larger slow shifts in the firing rate (J. Demb, unpublished observations). Apparently longer periods at a given contrast emphasize the slow form of adaptation, whereas shorter periods emphasize the fast form of adaptation (Fairhall et al., 2001).
Theoretical implications
To avoid response saturation during periods of strong input, it seems advantageous to have adaptive mechanisms that act postsynaptically in the ganglion cell. Such a mechanism could read the overall level of synaptic activity, across the entire dendritic tree, and alter sensitivity accordingly. This mechanism could act either by altering synaptic efficacy, based on a global intracellular signal (e.g., calcium influx) (Akopian and Witkovsky, 2001), or by adapting the spiking output itself (Kim and Rieke, 2001, 2003). Our results suggest a significant contribution from a mechanism that is intrinsic to the ganglion cell. Intrinsic adaptive mechanisms also exist in cortical cells (Sanchez-Vives et al., 2000a,b; Azouz and Gray, 2003). In the retina, ganglion cells show diversity not just in their pattern of synaptic inputs but also in their expression of intrinsic membrane properties (Barres et al., 1988; Kaneda and Kaneko, 1991; Wang et al., 1998; O'Brien et al., 2002; Ishida, 2004). Such diversity may allow different cell types to express unique patterns of adaptation (Shapley and Victor, 1978; Chander and Chichilnisky, 2001; Kaplan and Benardete, 2001; Kim and Rieke, 2001).
Footnotes
This work was supported by National Institutes of Health Grants T32-EY07003, EY07035, and EY00828 and by the Packard Foundation. J.B.D. is the recipient of a Research to Prevent Blindness Career Development Award. We thank Daniel Green, Fred Rieke, and Peter Sterling for helpful comments and suggestions.
Correspondence should be addressed to Dr. Jonathan Demb, Kellogg Eye Center, University of Michigan, 1000 Wall Street, Ann Arbor, MI 48105. E-mail: jdemb@umich.edu.
Copyright © 2005 Society for Neuroscience 0270-6474/05/250860-09$15.00/0
References
- Akopian A, Witkovsky P (2001) Intracellular calcium reduces light-induced excitatory post-synaptic responses in salamander retinal ganglion cells. J Physiol (Lond) 532: 43-53. [DOI] [PMC free article] [PubMed] [Google Scholar]
- Azouz R, Gray CM (2003) Adaptive coincidence detection and dynamic gain control in visual cortical neurons in vivo Neuron 37: 513-523. [DOI] [PubMed] [Google Scholar]
- Baccus SA, Meister M (2002) Fast and slow contrast adaptation in retinal circuitry. Neuron 36: 909-919. [DOI] [PubMed] [Google Scholar]
- Barres BA, Silverstein BE, Corey DP, Chun LL (1988) Immunological, morphological, and electrophysiological variation among retinal ganglion cells purified by panning. Neuron 1: 791-803. [DOI] [PubMed] [Google Scholar]
- Benardete EA, Kaplan E (1999) The dynamics of primate M retinal ganglion cells. Vis Neurosci 16: 355-368. [DOI] [PubMed] [Google Scholar]
- Benardete EA, Kaplan E, Knight BW (1992) Contrast gain control in the primate retina: P cells are not X-like, some M cells are. Vis Neurosci 8: 483-486. [DOI] [PubMed] [Google Scholar]
- Brainard DH (1997) The Psychophysics Toolbox. Spat Vis 10: 433-436. [PubMed] [Google Scholar]
- Brown SP, Masland RH (2001) Spatial scale and cellular substrate of contrast adaptation by retinal ganglion cells. Nat Neurosci 4: 44-51. [DOI] [PubMed] [Google Scholar]
- Chander D, Chichilnisky EJ (2001) Adaptation to temporal contrast in primate and salamander retina. J Neurosci 21: 9904-9916. [DOI] [PMC free article] [PubMed] [Google Scholar]
- Chichilnisky EJ (2001) A simple white noise analysis of neuronal light responses. Network 12: 199-213. [PubMed] [Google Scholar]
- Cleland BG, Levick WR (1974) Brisk and sluggish concentrically organized ganglion cells in the cat's retina. J Physiol (Lond) 240: 421-456. [DOI] [PMC free article] [PubMed] [Google Scholar]
- Demb JB (2002) Multiple mechanisms for contrast adaptation in the retina. Neuron 36: 781-783. [DOI] [PubMed] [Google Scholar]
- Demb JB, Haarsma L, Freed MA, Sterling P (1999) Functional circuitry of the retinal ganglion cell's nonlinear receptive field. J Neurosci 19: 9756-9767. [DOI] [PMC free article] [PubMed] [Google Scholar]
- Demb JB, Zaghloul K, Haarsma L, Sterling P (2001a) Bipolar cells contribute to nonlinear spatial summation in the brisk-transient (Y) ganglion cell in mammalian retina. J Neurosci 21: 7447-7454. [DOI] [PMC free article] [PubMed] [Google Scholar]
- Demb JB, Zaghloul K, Sterling P (2001b) Cellular basis for the response to second-order motion cues in y retinal ganglion cells. Neuron 32: 711-721. [DOI] [PubMed] [Google Scholar]
- Demb JB, Sterling P, Freed MA (2004) How retinal ganglion cells prevent synaptic noise from reaching the spike output. J Neurophysiol 92: 2510-2519. [DOI] [PubMed] [Google Scholar]
- Dhingra NK, Kao Y-H, Sterling P, Smith RG (2003) Contrast threshold of a brisk-transient ganglion cell in vitro J Neurophysiol 89: 2360-2369. [DOI] [PubMed] [Google Scholar]
- Enroth-Cugell C, Robson JG (1966) The contrast sensitivity of retinal ganglion cells of the cat. J Physiol (Lond) 187: 517-552. [DOI] [PMC free article] [PubMed] [Google Scholar]
- Fairhall AL, Lewen GD, Bialek W, de Ruyter Van Steveninck RR (2001) Efficiency and ambiguity in an adaptive neural code. Nature 412: 787-792. [DOI] [PubMed] [Google Scholar]
- Hochstein S, Shapley RM (1976) Linear and nonlinear spatial subunits in Y cat retinal ganglion cells. J Physiol (Lond) 262: 265-284. [DOI] [PMC free article] [PubMed] [Google Scholar]
- Hu EH, Dacheux RF, Bloomfield SA (2000) A flattened retina-eyecup preparation suitable for electrophysiological studies of neurons visualized with trans-scleral infrared illumination. J Neurosci Methods 103: 209-216. [DOI] [PubMed] [Google Scholar]
- Ishida AT (2004) Retinal ganglion cell excitability. In: The visual neurosciences (Chalupa LM, Werner JS, eds), pp 422-450. Cambridge, MA: MIT.
- Kaneda M, Kaneko A (1991) Voltage-gated sodium currents in isolated retinal ganglion cells of the cat: relation between the inactivation kinetics and the cell type. Neurosci Res 11: 261-275. [DOI] [PubMed] [Google Scholar]
- Kaplan E, Benardete E (2001) The dynamics of primate retinal ganglion cells. Prog Brain Res 134: 17-34. [DOI] [PubMed] [Google Scholar]
- Kim KJ, Rieke F (2001) Temporal contrast adaptation in the input and output signals of salamander retinal ganglion cells. J Neurosci 21: 287-299. [DOI] [PMC free article] [PubMed] [Google Scholar]
- Kim KJ, Rieke F (2003) Slow Na+ inactivation and variance adaptation in salamander retinal ganglion cells. J Neurosci 23: 1506-1516. [DOI] [PMC free article] [PubMed] [Google Scholar]
- Lankheet MJ, Molenaar J, van de Grind WA (1989) The spike generating mechanism of cat retinal ganglion cells. Vision Res 29: 505-517. [DOI] [PubMed] [Google Scholar]
- Lee YW, Schetzen M (1965) Measurement of the Wiener kernels of a nonlinear system by cross-correlation. Int J Control 2: 237-254. [Google Scholar]
- Mao B, Macleish PR, Victor JD (1998) The intrinsic dynamics of retinal bipolar cells isolated from tiger salamander. Vis Neurosci 15: 425-438. [DOI] [PubMed] [Google Scholar]
- Masland RH (2001) The fundamental plan of the retina. Nat Neurosci 4: 877-886. [DOI] [PubMed] [Google Scholar]
- O'Brien BJ, Isayama T, Richardson R, Berson DM (2002) Intrinsic physiological properties of cat retinal ganglion cells. J Physiol (Lond) 538: 787-802. [DOI] [PMC free article] [PubMed] [Google Scholar]
- Peichl L, Ott H, Boycott BB (1987) Alpha ganglion cells in mammalian retinae. Proc R Soc Lond B Biol Sci 231: 169-197. [DOI] [PubMed] [Google Scholar]
- Pelli DG (1997) The VideoToolbox software for visual psychophysics, transforming numbers into movies. Spat Vis 10: 437-442. [PubMed] [Google Scholar]
- Pugh Jr EN, Nikonov S, Lamb TD (1999) Molecular mechanisms of vertebrate photoreceptor light adaptation. Curr Opin Neurobiol 9: 410-418. [DOI] [PubMed] [Google Scholar]
- Rieke F (2001) Temporal contrast adaptation in salamander bipolar cells. J Neurosci 21: 9445-9954. [DOI] [PMC free article] [PubMed] [Google Scholar]
- Roska B, Werblin F (2001) Vertical interactions across ten parallel, stacked representations in the mammalian retina. Nature 410: 583-587. [DOI] [PubMed] [Google Scholar]
- Sakai HM, Wang JL, Naka K (1995) Contrast gain control in the lower vertebrate retinas. J Gen Physiol 105: 815-835. [DOI] [PMC free article] [PubMed] [Google Scholar]
- Sanchez-Vives MV, Nowak LG, McCormick DA (2000a) Membrane mechanisms underlying contrast adaptation in cat area 17 in vivo J Neurosci 20: 4267-4285. [DOI] [PMC free article] [PubMed] [Google Scholar]
- Sanchez-Vives MV, Nowak LG, McCormick DA (2000b) Cellular mechanisms of long-lasting adaptation in visual cortical neurons in vitro J Neurosci 20: 4286-4299. [DOI] [PMC free article] [PubMed] [Google Scholar]
- Shapley RM, Enroth-Cugell C (1984) Visual adaptation and retinal gain controls. Prog Retinal Res 3: 263-346. [Google Scholar]
- Shapley RM, Victor JD (1978) The effect of contrast on the transfer properties of cat retinal ganglion cells. J Physiol (Lond) 285: 275-298. [DOI] [PMC free article] [PubMed] [Google Scholar]
- Smirnakis SM, Berry MJ, Warland DK, Bialek W, Meister M (1997) Adaptation of retinal processing to image contrast and spatial scale. Nature 386: 69-73. [DOI] [PubMed] [Google Scholar]
- Solomon SG, Peirce JW, Dhruv NT, Lennie P (2004) Profound contrast adaptation early in the visual pathway. Neuron 42: 155-162. [DOI] [PubMed] [Google Scholar]
- Sterling P, Demb JB (2004) Retina. In: Synaptic organization of the brain, Ed 5 (Shephard G, ed), pp 217-269. New York: Oxford UP.
- Troy JB, Enroth-Cugell C (1993) X and Y ganglion cells inform the cat's brain about contrast in the retinal image. Exp Brain Res 93: 383-390. [DOI] [PubMed] [Google Scholar]
- Victor JD (1987) The dynamics of the cat retinal X cell centre. J Physiol (Lond) 386: 219-246. [DOI] [PMC free article] [PubMed] [Google Scholar]
- Victor JD, Shapley RM (1979) Receptive field mechanisms of cat X and Y retinal ganglion cells. J Gen Physiol 74: 275-298. [DOI] [PMC free article] [PubMed] [Google Scholar]
- Walraven J, Enroth-Cugell C, Hood DC, MacLeod DIA, Schnapf JL (1990) The control of visual sensitivity: receptoral and postreceptoral processes. In: The neurophysiological foundations of visual perception (Spillman L, Werner J, eds), pp 53-101. New York: Academic.
- Wang GY, Robinson DW, Chalupa LM (1998) Calcium-activated potassium conductances in retinal ganglion cells of the ferret. J Neurophysiol 79: 151-158. [DOI] [PubMed] [Google Scholar]
- Wiener N (1958) Nonlinear problems in random theory. Cambridge, MA: MIT.
- Yu Y, Lee TS (2003) Dynamical mechanisms underlying contrast gain control in single neurons. Phys Rev E Stat Nonlin Soft Matter Phys 68: 011901. [DOI] [PubMed] [Google Scholar]
- Zaghloul KA, Boahen K, Demb JB (2003) Different circuits for ON and OFF retinal ganglion cells cause different contrast sensitivities. J Neurosci 23: 2645-2654. [DOI] [PMC free article] [PubMed] [Google Scholar]