

Abstract
Many developing neural circuits generate synchronized bursting activity among neighboring neurons, a pattern thought to be important for sculpting precise neural connectivity. Network output remains relatively constant as the cellular and synaptic components of these immature circuits change during development, suggesting the presence of homeostatic mechanisms. In the retina, spontaneous waves of activity are present even before chemical synapse formation, needing gap junctions to propagate. However, as synaptogenesis proceeds, retinal waves become dependent on cholinergic neurotransmission, no longer requiring gap junctions. Later still in development, waves are driven by glutamatergic rather than cholinergic synapses. Here, we asked how retinal activity evolves in the absence of cholinergic transmission by using a conditional mutant in which the gene encoding choline acetyltransferase (ChAT), the sole synthetic enzyme for acetylcholine (ACh), was deleted from large retinal regions. ChAT-negative regions lacked retinal waves for the first few days after birth, but by postnatal day 5 (P5), ACh-independent waves propagated across these regions. Pharmacological analysis of the waves in ChAT knock-out regions revealed a requirement for gap junctions but not glutamate, suggesting that patterned activity may have emerged via restoration of previous gap-junctional networks. Similarly, in P5 wild-type retinas, spontaneous activity recovered after a few hours in nicotinic receptor antagonists, often as local patches of coactive cells but not waves. The rapid recovery of rhythmic spontaneous activity in the presence of cholinergic antagonists and the eventual emergence of waves in ChAT knock-out regions suggest that homeostatic mechanisms regulate retinal output during development.
Keywords: retina, wave, homeostasis, acetylcholine, gap junction, development
Introduction
Circuits in diverse parts of the developing nervous system exhibit periodic bursts of activity that are correlated among neighboring neurons and that often propagate in a wave-like manner (Garaschuk et al., 1998, 2000; Feller, 1999; O'Donovan, 1999; Peinado, 2000). Because these activity patterns appear to guide synaptic refinement, numerous studies have focused on the mechanisms responsible for their generation (Feller, 1999; Wong, 1999; Sernagor et al., 2001). Pharmacological studies show that the circuitry underlying synchronized activity alters systematically with development. Before synaptogenesis, gap junctions are responsible (Peinado et al., 1993; Catsicas et al., 1998; Wong et al., 1998; Roerig and Feller, 2000; Syed et al., 2004b), but after synapse formation, chemical neurotransmission drives correlated activity (Leinekugel et al., 1997; O'Donovan et al., 1998; O'Donovan, 1999; Bansal et al., 2000; Wong et al., 2000; Zhou and Zhao, 2000;
Syed et al., 2004b). In the spinal cord and retina, synchronized activity is first dependent on cholinergic transmission and there-after on glutamatergic transmission. Transmission mediated by GABA, glycine, and adenosine do not initiate the early activity patterns but help shape its detailed spatiotemporal characteristics (Sernagor et al., 2001). Thus, complex and changing networks of connections act coordinately to generate stereotypic patterns of synchronized activity across developing neural systems.
Several previous studies have asked how early synaptic circuits respond to perturbations in ongoing neurotransmission in vitro (Chub and O'Donovan, 1998). How network activity is affected when specific forms of neurotransmission are blocked in vivo is more difficult to address because it requires selective and complete blockade throughout development, an approach that has not been possible in the past (Bansal et al., 2000; Reese et al., 2001; Rossi et al., 2001; Huberman et al., 2003). Here, we asked whether patterned retinal activity emerges when cholinergic neurotransmission never occurs. To this end, we used mice that lack choline acetyltransferase (ChAT), the sole synthetic enzyme for acetylcholine (ACh) (Misgeld et al., 2002). These mice die at birth, but because the mutation is a conditional allele (Buffelli et al., 2003), in which activation depends on expression of cre recombinase, we were able to use an appropriate cre transgenic line (Marquardt et al., 2001) to restrict ChAT excision to the eye. We were therefore able to assess retinal development in the absence of all cholinergic transmission. We discovered that gap-junctionally dependent waves emerge in the absence of ACh, suggesting that networks of gap junctions can substitute for chemical synaptic connectivity.
Materials and Methods
Mutant mice. To selectively abolish ChAT expression in the mouse retina, we crossed a conditional ChAT knock-out (KO) line (ChATflox/flox) (Misgeld et al., 2002; Buffelli et al., 2003) with a line that expresses cre-recombinase under control of the retina-specific regulatory element from the murine Pax6 gene (Marquardt et al., 2001). We will refer to the offsprings of this cross with ChAT excision restricted to the eye as ChATr-/r- mice. In the ChATflox/flox mouse, exons 3 and 4 of the ChAT gene are flanked by loxP sites. All mutants were maintained on a C57BL/6 background. A mouse reporter line, Z/EG (Novak et al., 2000), was used to visualize the regions of gene excision in live tissue. Cells in the Z/EG mouse express β-galactosidase (lacZ) under the control of a ubiquitous promoter, unless cre-mediated recombination occurs, after which lacZ is deleted and green fluorescent protein (GFP) expression begins. The loxP-flanked region of the ChAT gene is 1.6 kb, comparable in size to lacZ; thus, we anticipate a similar efficiency of deletion for the reporter and ChAT.
Retinal dissection and tissue preparation. For all ages, animals were killed by inhalation of 5% halothane, followed by rapid decapitation. The eyes were enucleated, the cornea was punctured with a 30 gauge needle, and the retina removed in cooled, oxygenated artificial CSF (ACSF) containing the following (in mm): 119 NaCl, 2.5 KCl, 1.3 MgCl2, 2.5 CaCl2, 1.0 NaH2PO4, 11 glucose, and 20 HEPES. For anatomical analysis, whole mounts of the retina were prepared as described previously (Stacy and Wong, 2003). For multielectrode recordings, the retinas were cut into 2-10 mm2 rectangles. In some experiments, the orientation of the retina was determined by placing a small crystal of the carbocyanine dye DiD (1,1′-dioctadecyl-3,3,3′,3′-tetramethyl-indodicarbocyanine perchlorate) (Molecular Probes, Eugene, OR) into the dorsal eyecup before enucleation.
Calcium imaging. Dissected retinas were incubated in 10 μm fura-2 AM (Molecular Probes) in ACSF for 30 min at room temperature followed by 30 min at 30°C (Wong et al., 1995). After fura-2 loading, retinas were mounted on nitrocellulose filters, ganglion cell side up, and superfused continuously with oxygenated ACSF in a recording chamber. Intracellular calcium levels were monitored using an epifluorescence microscope, a 4× objective, and a cooled CCD (Sensicam; Cook, Auburn Hills, MI). Time-lapse images were acquired at a frequency of 0.5-1 Hz with exposure times ranging from 0.5 to 1 s at 380 nm excitation wavelength.
Multielectrode array recordings and analysis. Retinal pieces were placed ganglion cell side down on a multielectrode array, as described previously (Demas et al., 2003). We determined which electrodes were centered on KO or wild-type (wt) regions of the retina based on GFP expression. All retinas were dark-adapted for a minimum of 0.5 h before recording of spontaneous activity commenced in complete darkness. Retinal preparations were superfused continuously with bicarbonate-buffered ACSF bubbled with carbogen and maintained at 30-32°C. The amplitudes of spikes recorded from P3-P5 retinas were often small (<100 μV), mostly because Na+ channel density is relatively low in neonates (Rothe et al., 1999), resulting in only a handful of well separated single-unit waveforms in each recording. Multiunit activity, however, was reliably detected on most electrodes and thus was used instead of single-unit activity to evaluate spontaneous activity patterns.
To determine how frequently cells at each recording site participated in correlated bursting activity (i.e., waves), we defined wave occurrence quantitatively using a modified Poisson surprise method (Legendy and Salcman, 1985). Using a 5 s bin, the time-varying spike count, C, and mean spike count, λ, were computed for each multiunit spike train. The probability, PCi that a Poisson spike train with mean spike count λ would have Ci spikes in the ith time bin is
 |
When the probability that a Poisson spike train would generate the spike count in a particular 5 s bin was <10-6, cells recorded at that electrode site were considered to be bursting. A wave was defined as coincident bursting on six or more electrode sites. Waves detected by this algorithm were in excellent agreement with those that were identified visually.
The degree of correlation in the multiunit activity detected on a given pair of electrodes was assayed with both cross-correlograms and correlation index, as described previously (Demas et al., 2003). Cross-correlograms were generated by calculating the correlation coefficient between the time-varying firing rates (50 ms bins) of a target and reference multiunit spike train at time lags ranging from -5 to 5 s. For a given time lag, the correlation coefficient was computed by normalizing the covariance in the time-shifted firing rates of the pair normalized by the square root of the product of the variance of each train. The correlation coefficient can range from 1 (correlated) to -1 (anticorrelated), and a correlation coefficient of 0 indicates that the spike trains are uncorrelated at the given time lag. To calculate the correlation index of a pair of multiunit spike trains, we counted the number of spikes in the first train that fell within a time window, Δt, of each spike in the other train and then normalized by the number of spikes predicted by a Poisson distribution parameterized by the mean firing rate of the first train.
Pharmacological agents. The following pharmacological agents were used: dihydro-β-erythroidine (DHβE), 1(S), 9(R)-(-) bicuculline methobromide, strychnine, 2,3-dihydroxy-6-nitro-7-sulfonyl-benzo[f] quinoxaline (NBQX), d-APV, carbenoxolone, nifedipine, atropine (all from Sigma, St. Louis, MO), 6-imino-3-(4-methoxyphenyl)-1(6H)-pyridazinebutanoic hydrobromide (SR95531) (Tocris, Ellisville, MO), and α-bungarotoxin (Molecular Probes).
Immunohistochemistry. Whole-mount retinas were mounted onto nitrocellulose filters and fixed in 4% paraformaldehyde in ACSF for 45 min. To visualize ChAT or vesicular acetylcholine transporter (VAChT) expression, the retinas were incubated with goat anti-ChAT (1:200; Chemicon, Temecula, CA) or anti-VAChT (1:1000; Promega, Madison, WI) in 5% normal donkey serum and 0.5% Triton X-100 in 0.01 m PBS at 4°C for 72 h. Because GFP fluorescence is diminished by fixation, rabbit anti-GFP (1:1000; Chemicon) was added for the final 24 h of primary antibody incubation to immunolabel for GFP. ChAT/VAChT and GFP immunostaining were visualized with Alexa-568 donkey anti-goat and Alexa-488 donkey anti-rabbit secondary antibodies, respectively (Molecular Probes).
Neuronal morphology. Retinal ganglion cells (RGCs) and amacrine cells were labeled by ballistic delivery of a dextran conjugated fluorophore (Alexa 568; 10,000 molecular weight dextran; Molecular Probes) as described previously (Kettunen et al., 2002). Briefly, dye-coated particles were made by dissolving 1.5-2 mg of the dextran conjugate in double-distilled H2O and pipetting the solution onto tungsten particles (20 mg; diameter, 1.7 μm; Bio-Rad, Hercules, CA). The slurry of dye-coated particles was spread in a thin layer across a glass slide and allowed to dry completely. The dry, dye-coated particles were then loaded into tubing for ballistic delivery. Particles were fired into live retinal whole mounts through a filter inset (Falcon; 3 μm holes; high density). The assigned location of labeled cells to either the KO or wild-type region of the retina was based on either the presence or absence of expression of GFP in the ChATr-/r-;Z/EG mice or after ChAT immunolabeling of the tissue. Cells at the border between ChAT (or GFP)-positive and -negative regions were not used for quantitative analyses because they were rarely labeled. A total of 28 wild-type and 26 ChATr-/r- retinas were assessed (at P7-P8). Of 200-300 cells that were labeled, ∼50% were adequately filled and could be analyzed further.
Confocal images and reconstructions of amacrine and ganglion cells were obtained, and digital rotations of the image stacks were performed (MetaMorph; Universal Imaging Corporation, West Chester, PA) to determine the stratification patterns of the cells (Stacy and Wong, 2003). Ganglion cell dendritic arbor areas were measured from a maximum projection of the image stack of each arbor. The tips of the dendrites were connected by a polygon, and the enclosed area was measured using MetaMorph.
Results
Pattern of ChAT excision in the ChATr-/r- mouse retina
In α-cre mice, cre recombinase is expressed throughout the retina except for a wedge-shaped region extending across the optic nerve head, from dorsal to ventral retina (Kammandel et al., 1999) (Fig. 1A). By crossing α-cre mice with ChATflox/flox mice, we generated animals in which most of the retina was devoid of ChAT. In wild-type animals, ChAT-expressing cells are distributed across the entire retina (Rockhill et al., 2000) (Fig. 1B). In contrast, in the ChATflox/flox; α-cre (called ChATr-/r-) mice, ChAT-positive cells were confined to the wedge-shaped region, in which cre recombinase failed to act (Fig. 1C). Higher-magnification images of ChAT immunostaining in ChATr-/r- retinas reveal a relatively sharp transition from the high density of ChAT-positive somata within the wedge-shaped wild-type region to flanking nasal and temporal KO regions devoid of ChAT-positive cells (Fig. 1C1-C3).
Figure 1.

ChAT excision pattern is stereotypic in the ChATr-/r- retina. Retinas from adult reporter mice crossed with α-cre mice revealed a stereotypical cre-expression pattern in ChATr-/r- mice. A, In α-cre; Z/EG retinas, GFP is absent in a dorsal-ventral wedge where lacZ expression is confined. B, ChAT immunoreactivity in an adult wt retina. C, Schematic of the ChAT gene, including exons R, N, M, 3, 4, and 2 (with the start ATG), and the VAChT gene. Exons 3 and 4 are flanked by loxP sites. ChAT immunoreactivity in an adult ChATr-/r- mouse retina is shown. C1-C3, Higher-magnification images of ChAT immunolabeling of retina in C. D, GFP is anticorrelated with ChAT in the ChATr-/r-;Z/EG retina. The red line indicates the limit of ChAT immunolabeling in this P17 retina. E, Higher magnification of the boxed region from D. Cells immunoreactive for ChAT (red) extend to the boundaries of GFP expression (green). F, Cross section through the GFP-positive region of a P8 ChATr-/r-;Z/EG retina, showing that all retinal layers are present. d, Dorsal; ONL, outer nuclear layer; OPL, outer plexiform layer; INL, inner nuclear layer; GCL, ganglion cell layer.
ChAT expression in the ChATr-/r- retina could be visualized only after immunostaining. We therefore crossed the ChATr-/r- line to the Z/EG reporter line so that we could view ChAT-positive and -negative regions in live retinas. This was particularly important for our studies of spontaneous activity because it was necessary to determine whether the cells studied were located in wt (ChAT-positive) or KO (ChAT-negative) regions of the mutant retina. In ChATr-/r-;Z/EG retinas, ChAT-positive somata were found occasionally within the flanking GFP-negative region but were completely absent more peripherally (Fig. 1D,E). GFP expression thus adequately reports the absence of ChAT expression in the ChATr-/r-;Z/EG retina.
Neuronal morphology within ChAT KO regions appears essentially normal
We first assessed how loss of retinal cholinergic signaling impacts the overall size and morphological development of the retina. We found that retinal area from mature wt and ChATr-/r- mice did not differ significantly (13.3 ± 1.2 and 13.8 ± 1mm2, for wt and KO retinas, respectively; n = 6 animals each; p = 0.5; Mann-Whitney U rank-sum test). We also observed that the general laminar organization of the retina was normal in the KO regions of ChATr-/r- retinas (Fig. 1F). In addition, standard markers for subpopulations of retinal interneurons did not reveal any gross change in the anatomical organization of the KO regions. For example, the distribution of GABAergic cells in the ganglion cell layer of the KO region was similar to that of wt retinas as was stratification of rod bipolar cell terminals seen with PKC immunostaining (data not shown).
Next, we asked whether the morphology of the amacrine cells that normally express ChAT was altered. In particular, because these ChAT-positive amacrine cells normally form cholinergic synaptic connections with each other (Millar and Morgan, 1987; Zheng et al., 2004), their processes are both presynaptic and post-synaptic to cholinergic synapses and may have been affected by the absence of ACh during development. Cholinergic amacrine cells have a stereotyped, “starburst” morphology, and their processes overlap to form two discrete plexuses in the inner plexiform layer (IPL) (Vaney, 1990; Stacy and Wong, 2003). Amacrine cells with the characteristic starburst morphology were found in the ChAT KO region (Fig. 2A). In addition, immunolabeling for the VAChT revealed two plexuses of starburst processes in the IPL spanning, undisrupted, across the KO and wt regions (Fig. 2B). Thus, the basic morphology and laminar targeting of starburst amacrine cell neurites were unaffected by the absence of their own cholinergic transmission during development.
Figure 2.

Cellular morphology in ChAT KO regions is normal. A, Examples of P7 starburst amacrine cells from a wt retina and from the KO region of a mutant retina. B, Confocal reconstructions of VAChT immunolabeling of starburst cell plexuses in the ON sublamina of the inner plexiform layer from a wt and a KO region of a ChATr-/r-;Z/EG retina. Panels below each image are the orthogonal rotations of the optical stack, showing both ON and OFF plexuses. C, D, Examples of LMC and LBC ganglion cells in P7-P8 retinas labeled with Alexa-568. Shown here are maximum projections of confocal image stacks. Orthogonal rotations of the regions enclosed within the boxes are provided below each maximum projection to reveal whether the dendritic arbors of the cells were stratified. E, Summary of dendritic field size for LMCs and LBCs in wt retina and KO regions. Error bars represent SEM. Statistical significance between wt and KO: LMC, p = 0.076; LBCON, p = 0.026; LBCOFF, p = 0.224; Mann-Whitney U test. Each circle indicates one cell.
Because starburst amacrine cells and RGCs form an early, spontaneously active retinal network (Wong, 1995; Feller et al., 1996; Zhou, 1998), and because ACh regulates the dynamics of RGC dendrites (Lohmann et al., 2002), it is plausible that cholinergic transmission is important for shaping RGC dendritic arbor sizes in mouse, as it is in turtles (Sernagor and Grzywacz, 1996). Furthermore, the stratification of RGC dendrites is delayed in the β2 nicotinic receptor subunit KO (Bansal et al., 2000). In fact, we expected that the morphological development of RGCs in the KO region would be severely perturbed because, in contrast to previous genetic and pharmacological studies, all forms of cholinergic transmission between starburst amacrines and RGCs were ablated for the entire duration of retinal development. To our surprise, however, the dendritic morphology of two major classes of large-field RGCs appeared essentially normal within the KO region. Both large-field monostratified ganglion cells (LMCs; A-type) (Sun et al., 2002; Stacy and Wong, 2003), which ramify outside of the cholinergic plexuses in wt retina, and large-field bistratified ganglion cells (LBCs; D2-type), which normally stratify within the cholinergic plexuses, were present in the KO region with apparently normal dendritic lamination (Fig. 2C,D). Quantitative comparison of dendritic field areas did not reveal a significant difference between the LMC RGC arbors from wt retinas and from ChAT KO regions of the mutant (Mann-Whitney U rank-sum test; p = 0.076) (Fig. 2E). For LBCs, the dendritic field areas of the ON arbors (p = 0.026), but not the OFF arbors (p = 0.224), were modestly different between wt retinas and ChAT KO regions.
Disruption and recovery of waves in the absence of ChAT
We next asked how ChAT deletion affected the development of functional networks in the inner retina. Previous pharmacological studies have demonstrated that ACh is required for propagation of spontaneous activity in the mouse retina during the first 10 d after birth (Bansal et al., 2000). We thus expected that waves would be present in the wt region but not in the KO regions of the ChATr-/r-;Z/EG retina. Indeed, calcium imaging of P0-P1 retinas (n = 3) revealed that waves initiated in the wt region rapidly dissipated after reaching the KO region (Fig. 3A, arrow 1; supplemental movie P0CaKO, available at www.jneurosci.org as supplemental material). At 29-30°C, waves in the wt region of the ChATr-/r-;Z/EG retina occurred every 93.3 ± 18.7 s at average speeds of 85 ± 8.5 μm/s (n = 13 waves; 3 retinas). These properties are similar to those found in wt developing mouse retina (Singer et al., 2001). Small patches of elevated Ca2+ levels were sometimes seen in the KO region, but these local changes never resulted in widespread propagating waves (Fig. 3A, arrow 2; see supplemental movie P0CaKO, available at www.jneurosci.org as supplemental material). These patches of activity occurred at various frequencies, 0.1-11 per min, within 2.0 mm2 of KO region and varied in the extent of their spread (diameter, 150-500 μm) and location (40 events; n = 3 retinas) (supplemental Fig. S1, available at www.jneurosci.org as supplemental material). These results provide additional evidence that ACh mediates wave propagation in the neonatal mouse retina, although it may not be required to initiate waves (Bansal et al., 2000).
Figure 3.

Calcium waves initially fail to propagate in ChAT KO region. A, Time series showing a wave originating and propagating from the wt region (arrow 1) and disappearing after passing into the KO region. P0 retinal activity imaged using fura-2 AM. Top left, GFP fluorescence of a ChATr-/r-;Z/EG retina. Approximate boundary of the wt region (within which GFP fluorescence was minimal) is outlined by the solid line. Increase in intracellular calcium levels is demonstrated in these difference images by dark regions. A local “puff” of activity (arrow 2, at 7 s) originating in the KO region failed to propagate. ONH, Optic nerve head. B, Multielectrode recordings reveal spread of spiking activity correlates with extent of ChAT excision. Fluorescence image showing the multielectrode array and a piece of retina from P3 ChATr-/r-;Z/EG mouse containing both a wt (GFP-negative) region and a ChAT-negative (GFP-positive) region. Electrode spacing is 200 μm. C, Representative spike trains from the wt (1), border (2), and KO (3) regions in B. D, Cross-correlograms of cell pairs with spikes from the electrode marked with an asterisk in B as the reference spike train. E, The percentage of correlated bursts that each electrode in B participates over the duration of the recording (30 min) is represented by the gray scale. Electrodes closer to the ChAT-positive (GFP-negative) region participate more often in correlated bursting activity.
To ascertain whether the restricted propagation of calcium waves correlated with changes in the spatiotemporal patterns of action potential activity, we recorded spikes from the ChATr-/r- retina using a multielectrode array. At P3, spontaneous activity patterns consistent with Ca2+ imaging observations at P0-P1 were detected with the multielectrode array (n = 3 retinas). Figure 3B-E shows an example of a recording with electrodes in both KO and wt regions of a P3 ChATr-/r-;Z/EG retina. Spiking recorded on electrodes within the wt region was organized into correlated bursts occurring approximately every minute (Fig. 3C,D), a pattern typical of immature wt retinas (Demas et al., 2003; McLaughlin et al., 2003). Electrodes located along the border between the wt and KO regions detected bursts similar to those in the wt region, but these bursts were not as well correlated as those in the wt region (Fig. 3C,D). Electrodes located within the KO (i.e., GFP-positive, ChAT-negative) regions often detected spikes; however, the spiking was mostly uncorrelated with activity in the wt region and even that of nearby electrodes. Occasionally, however, clusters of two or three electrodes in the KO region showed correlated bursting activity (Fig. 3C, bottom two rasters from region 3). Waves were observed in the wt region but failed to propagate far into the KO region, as was seen in the P0-P1 calcium imaging. The percentage of waves that an electrode site participated in (see Materials and Methods) depended on its distance from the wt region (Fig. 3E).
Surprisingly, the absence of waves in the KO regions was transient. By P5, waves propagated across the entire retina, including the KO regions that lacked ACh synthesis. Importantly, recordings from pieces of retina containing only the KO region of ChATr-/r-;Z/EG mice revealed the ability of the KO region to generate retinal waves independent of the wt region by P5 (Fig. 4A,B; supplemental movies P5wt and P5KO, available at www.jneurosci.org as supplemental material). This independence indicates that the circuitry of the KO region can initiate, as well as propagate, waves. Cells distributed across the entire KO region participated approximately equally in this correlated bursting, unlike at P3. These results suggest that between P3 and P5, the KO region of ChATr-/r-;Z/EG retinas compensates for the loss of ACh and gains the ability to propagate locally generated bursts of activity.
Figure 4.

Waves emerge in the KO region by P5. A, Rasters from 10 simultaneously recorded multiunit spike trains. Correlated bursting is present in both littermate controls and in pieces of retina containing only the ChAT-negative region of ChATr-/r-;Z/EG retinas. B, Examples of waves recorded by the multielectrode array from a wt littermate and from a KO region in the ChATr-/r-;Z/EG retina. Each dot represents an electrode site and the multiunit firing rate (averaged over 0.5 s) recorded at that site is proportional to the radius of the dot. Electrode spacing is 100 μm. C, Distributions of interwave intervals, calculated using the surprise algorithm (see Materials and Methods). D, Distributions showing the number of coactive electrodes. E, Plots of correlation index versus interelectrode distance for pairs of multiunit spike trains. Plotted are median values, and bars extend from the 25th to the 75th percentile.
Despite its clear wave-like nature, activity in the KO region differed from that in age-matched wt animals and wt littermate controls. First, even within a single recording, waves occurred irregularly, at times lacking the strict periodicity that typifies wt waves. This is apparent from the spike raster plots of activity at each electrode site, which demonstrate that the quiescence between bursts seen in wt retinas was less complete in the KO regions of the mutant at P5 (Fig. 4A). Second, plots of the distribution of interwave intervals of wt and KO region waves differ significantly (Fig. 4C). In wt retinas, the distribution of interwave intervals peaks around 60 s. In contrast, in the KO, the interwave interval is distributed broadly (p < 0.01; variance bootstrap test) (Fig. 4C) (Efron, 1979). Third, waves propagated more rapidly in the KO regions. Mean wave speed from P5 KO regions was 196.4 ± 16.0 μm/s (10 waves each from three KO region-only recordings) compared with 98.9 ± 3.2 μm/s for age-matched wt and littermate controls (10 waves each from two littermate controls and two wt recordings; p < 0.01; bootstrap of means test). Fourth, the KO wave fronts were generally broader compared with their wt counterparts. The width of the wave front was estimated by summing the number of coactive electrodes within a fixed time interval during each wave. During KO waves, > 50 electrodes routinely participated in a burst that occurred within a 1 s time bin, whereas this count in the wt never exceeded 30 electrodes and rarely exceeded 20 (Fig. 4D).
Finally, although the correlation between spikes from pairs of electrodes decreased as a function of interelectrode distance in both wt and KO retinas, the degree of correlation is far more variable for cell activity in the KO regions (Fig. 4E). The unique spatiotemporal properties of the KO waves suggest that the cellular mechanisms responsible for their initiation, regulation, and/or propagation may be distinct from those of age-matched wt and wt littermate retinas.
Mechanisms underlying KO and wt waves are distinct
To assess what wave-generating mechanisms compensate for the loss in cholinergic neurotransmission, we performed a series of pharmacological studies using the multielectrode array on P5 animals, when waves emerged in the KO regions. Because the wt region is relatively small compared with the KO regions, our pharmacological analyses compared the effect on the KO regions from ChATr-/r- retinas to the effect on retinas from either wt littermates or age-matched wt C57BLk6/J mice. We first determined whether the contribution of cholinergic transmission in mediating retinal waves was truly abolished in the KO regions, given that ChAT expression was still present in the wt strip of retina and that immunolabeling for ChAT may not be sensitive enough to detect small amounts of this enzyme possibly still present in the KO regions. We found that bath application of DHβE (100 μm), a nicotinic receptor antagonist, did not block the occurrence of waves in the KO region (n = 3) but reversibly eliminated almost all spontaneous activity, including waves, from wt retinas (n = 4) (Fig. 5A,B). These results confirm that cholinergic transmission had been abolished in the GFP-positive regions of the ChATr-/r-;Z/EG retina and that waves propagated in the absence of cholinergic transmission.
Figure 5.
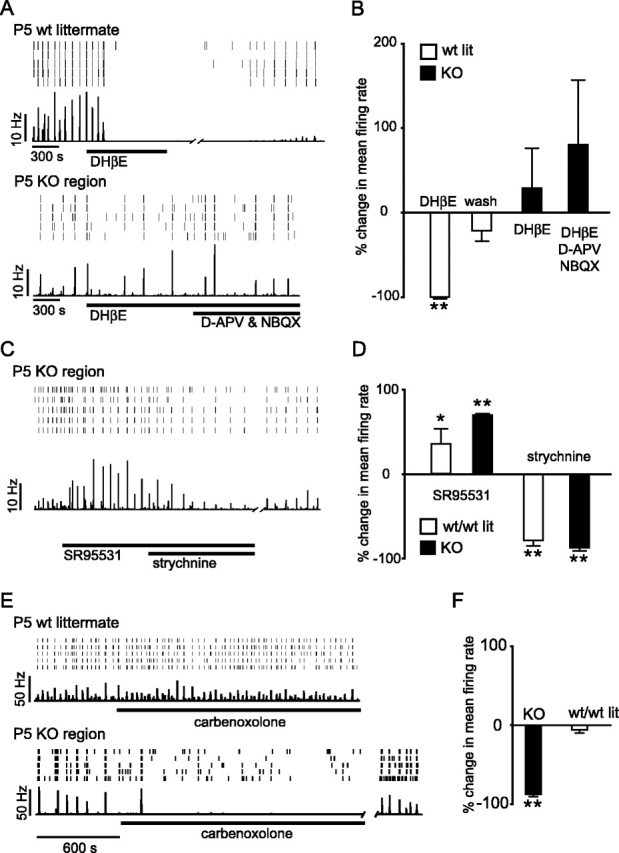
KO region waves and wt waves depend on different signaling mechanisms. A, Rasters of multiunit activity (top) and mean firing rate (bottom) averaged over all electrodes from a wt littermate retina and a KO region of a ChATr-/r-;Z/EG retina. Recordings performed at P5 when waves reemerge in the KO region. B, Summary of the effect of cholinergic and glutamatergic antagonists on population mean firing rate. Histograms show the percentage change from baseline mean firing rate, 10 min after antagonists were applied. Firing in the KO region of the ChATr-/r-;Z/EG retina was not inhibited by either DHβE alone (100 μm; n = 3) or DHβE, d-APV (100 μm), and NBQX (20 μm) together (n = 3). DHβE reversibly eliminates firing in the wt retina (blockade, n = 4; wash, n = 3). C, Wave amplitude increases after application of the GABAA antagonist SR95531 (25 μm) and decreases after the addition of the glycine antagonist strychnine (5 μm); however, waves remain in the presence of both drugs. D, Summary of the contribution of GABAergic and glycinergic transmission to population mean firing rate. Histograms show the percentage change from baseline mean firing rate, 10 min after drugs were applied. Application of GABAA antagonists increases activity in both the KO region (SR95531; n = 2) and in w/w littermate retinas (SR95531; n = 2). Strychnine reduces activity in both KO (n = 4) and w/w littermate (n = 2). E, Rasters of multiunit activity and population mean firing rate from a P5 wt littermate retina (top) and a P5 knock-out region (bottom). The gap junction blocker carbenoxolone (50 μm) rapidly eliminates waves in the KO retina but not in the wt littermate. Activity in the KO recovers after washout. F, Histograms show the percentage change from baseline mean firing rate from 5-20 min after carbenoxolone was applied in w/w littermate (n = 3) and KO retinas (n = 3). *p < 0.05; **p < 0.01; bootstrap of means test. Statistical differences are between firing rates during application of the drug versus baseline activity before addition of the drug. Error bars represent SEM. lit, Littermate.
Because waves in more mature retinas rely on glutamate and not ACh (Wong et al., 1998, 2000; Bansal et al., 2000; Sernagor et al., 2000; Zhou and Zhao, 2000), one possibility is that glutamatergic transmission prematurely drives waves in the KO regions, as happens in the ACh receptor β2 subunit (AChRβ2) KO mouse (Bansal et al., 2000). However, bath application of the AMPA receptor antagonist NBQX (20 μm) plus the NMDA receptor antagonist d-APV (100 μm) did not block wave propagation in the KO region at either P5 (n = 3) (Fig. 5A,B) or P8 (n = 4; data not shown). The insensitivity to glutamatergic blockade at P5 rules out early bipolar cell terminal maturation, compensatory RGC axon sprouting (Sernagor et al., 2001), and hyperinnervation of the IPL by photoreceptor terminals (Johnson et al., 1999) as candidate mechanisms for propagating waves in the KO region, because bipolar cells, RGCs, and photoreceptors all use glutamate as their primary neurotransmitter.
A third possibility is that GABAergic and glycinergic drive, which are depolarizing in the neonatal retina and modulate waves, could have increased to enable wave propagation in the KO region (Fischer et al., 1998; Wong et al., 1998, 2000; Myhr et al., 2001; Zhou, 2001). Such GABAergic and glycinergic synaptic upregulation is seen in the developing spinal cord in response to cholinergic and glutamatergic blockade (Chub and O'Donovan, 1998). In contrast, strychnine (5 μm), in combination with either bicuculline (200 μm) or SR95531 (25 μm), did not prevent waves in the KO region (n = 3) (Fig. 5C). Furthermore, preliminary observations suggest that in both wt retinas and in the KO region of ChATr-/r- retinas, glycinergic blockade reduces wave amplitude (i.e., multiunit spike rates) (n = 2 wt; n = 4 KO), whereas GABAergic blockade increases wave amplitude (n = 4 wt; n = 2 KO) (Fig. 5C,D), as has been reported in the rabbit (Zhou, 2001). These results suggest that GABAergic and glycinergic circuits are likely to play similar modulatory roles in wt retinas and in the KO region but are not, in either case, required for wave propagation.
Because antagonists against the primary retinal neurotransmitters did not prevent wave propagation in the KO regions, it is plausible that the spread of excitation may be independent of chemical synapses. Waves propagate in the neuroblastic layer before synapse formation, mediated in large part by gap junctions (Catsicas et al., 1998; Syed et al., 2004a). To determine whether gap junctions propagate activity in ChATr-/r- KO regions, we recorded spontaneous activity in the presence of carbenoxolone, a gap junction blocker. We found that high concentrations (100 μm; n = 4 retinas) rapidly eliminated waves in the KO region but only reduced wave frequency in littermate control retinas after longer (> 20 min) applications (n = 3) (see supplemental Fig. S2, available at www.jneurosci.org as supplemental material). Lower concentrations (50 μm) (see supplemental movie P5Kocarb, available at www.jneurosci.org as supplemental material) dramatically decreased the frequency, amplitude, and spatial extent of KO waves (n = 3) compared with waves from wt retinas (n = 3) (Fig. 5E,F). Because L-type voltage-gated Ca2+ channels may also be blocked by high concentrations of carbenoxolone (Vessey et al., 2004), we directly assessed the impact L-type calcium channel blockade on KO waves by bath applying nifedipine. Nifedipine (50 μm) rapidly eliminated activity in P4-P6 wt retinas (n = 3), as has been shown previously (Singer et al., 2001). Preliminary observations suggest that nifedipine did not, however, eliminate waves in the KO region, but rather it transiently augmented wave amplitude (n = 2) (supplemental Fig. S3, available at www.jneurosci.org as supplemental material). The different sensitivities of wt and KO waves to carbenoxolone and nifedipine reveal gap junctions as a likely target for homeostatic regulation of spontaneous retinal activity.
Spontaneous activity recovers during long-term blockade in wild-type retina
We observed waves in the ChAT KO regions by P5, many days after synaptic networks are established. To explore how synaptic networks in wt retina adjust to acute nicotinic receptor blockade, we applied DHβE to wt retinas in vitro (n = 6 retinas) for several hours and recorded their spiking activity. As in previous studies (Feller et al., 1996; Wong et al., 1998, 2000; Bansal et al., 2000; Sernagor et al., 2000; Zhou and Zhao, 2000), synchronous bursting activity was abolished and most recording sites were silent within minutes of DHβE application (Fig. 6A). However, after 1-2 h in the continued presence of the antagonist, spontaneous activity began to recover (Fig. 6A,B). After 5-10 h of blockade, correlated, rhythmic bursting was detected on small patches of neighboring electrodes (Fig. 6C). Contrasting with activity before blockade, cross-correlation analysis shows that spiking is correlated in a subset of neighboring cell pairs during long-term blockade (Fig. 6D). The periodicity of this rhythmic bursting varied from retina to retina and even from patch to patch within the same retina, ranging from a few seconds to tens of seconds. Importantly, however, retinal waves remained absent even after > 10 h of nicotinic cholinergic blockade. The recovery of activity is not caused by a loss of effectiveness of the antagonist. When the DHβE solution used for long-term blockade was applied to a newly dissected wt retina, activity was rapidly suppressed (n = 2). Furthermore, during long term blockade, the addition of a freshly prepared DHβE solution to the recording bath did not alter the pattern of recovered spontaneous activity (n = 4; data not shown).
Figure 6.
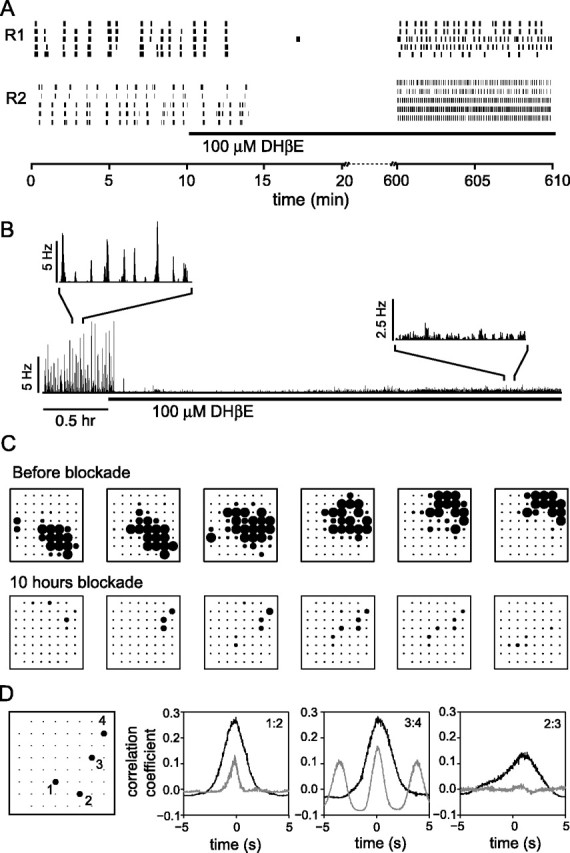
Activity, but not waves, recovers in wt retinas within hours during chronic nicotinic blockade. A, Rasters of multiunit activity from two (R1 and R2) P5 wt retinas before and after blockade of nAChRs show the rapid elimination of spontaneous activity in the absence of nicotinic transmission. However, by 10 h, spontaneous activity returns, often as rhythmic bursting. B, The population mean firing rate averaged over 21 sorted single units shows the time course of the recovery of spontaneous activity after nAChR blockade. At least some RGCs resumed spontaneous spiking within a few hours of chronic DHβE application. C, Comparison of the spatiotemporal patterning of spontaneous activity in a single wt retina before DHβE application (top row) and > 10 h after the onset of DHβE application (bottom row). Each row shows 3 s of activity (from left to right) with each frame depicting the activity averaged over 0.5 s. Each dot represents an electrode site, and its radius is proportional to the multiunit firing rate recorded at that site, subject to an upper limit of 20 Hz. Electrodes are spaced at 100 μm intervals. D, Cross-correlograms of single units before (black) and 10 h after (gray) the onset of DHβE application. Single units recorded at electrodes 1, 2, 3, and 4 are well correlated before blockade. As expected from waves, the correlograms from pairs that are closer together (1:2 and 3:4) show a stronger, narrower central peak than that from the pair that is farther apart (2:3). The correlograms from single units recorded at the same four electrodes sites after blockade (not necessarily the same units) are more variable. Some correlation remains between the nearby cells (1:2 and 3:4), but there is no correlation in the single units recorded at sites 2 and 3.
It is plausible that the mechanisms for propagating activity are intact during long-term in vitro blockade but insufficient to overcome inhibition, as is the case shortly after waves first disappear in development (Sernagor et al., 2003). To test this possibility, we bath applied SR95531 to wt retinas that had been blocked with DHβE for > 8 h. In all retinas (n = 3), we found an increase in multiunit spike rates in the presence of SR95531. Additionally, in one retina, waves that propagated across much of the array occurred sporadically in SR95531 (supplemental Fig. S4, available at www.jneurosci.org as supplemental material).
The recovery of waves in the KO region may be in response to a complete absence of cholinergic transmission in the KO. Because DHβE does not block either muscarinic receptors or α7-containing (bungarotoxin-sensitive) nicotinic receptors, and to more accurately mimic the KO region, we examined the pattern of spiking activity in wt retinas after 8-10 h of incubation in a mixture of cholinergic and muscarinic antagonists (n = 4). This more comprehensive blockade of cholinergic neurotransmission did not, however, facilitate the recovery of waves. Rather, recovery of spontaneous activity was less robust, and there was no evidence of retinal waves (supplemental Fig. S5, available at www.jneurosci.org as supplemental material). Together, these results suggest that ganglion cells resume spiking within several hours of continuous blockade of nicotinic cholinergic transmission, and although circuitry for wave propagation may remain intact, waves do not immediately propagate as spiking returns.
Discussion
The roles of ACh in retinal development have been challenging to study for several reasons. First, verifiable, long-term blockade of cholinergic transmission in vivo is difficult. Studies using chronic pharmacological blockade of cholinergic transmission have not directly assayed the long-term efficacy of the blockade by monitoring RGC spontaneous activity in the continued presence of blockers (Sernagor and Grzywacz, 1996; Penn et al., 1998). Second, AChR KOs analyzed to date lack only some receptors, leaving other pathways for cholinergic transmission intact (Bansal et al., 2000; Rossi et al., 2001). Third, attempts to ablate retinal cholinergic neurons (i.e., starburst amacrine cells) were unable to completely eliminate these cells before synapse formation in the inner retina (Johnson et al., 2001; Reese et al., 2001; Yoshida et al., 2001; Huberman et al., 2003). Here, we used an alternate method that circumvents these limitations. Our results differ in some respects from those obtained by previous methods and reveal the presence of homeostatic mechanisms that establish correlated spontaneous activity in the absence of cholinergic transmission.
Retinal structure develops normally in the absence of local ACh release
Functional cholinergic pathways are present in the developing retina even before synaptic circuits are established (Yamashita et al., 1994; Wong, 1995; Zhou and Zhao, 2000; Feller, 2002; Pearson et al., 2002). ACh has been implicated in regulating local and global changes in the structural maturation of the retina. In the chick, intraocular injections of atropine result in smaller eyes (Pearson et al., 2002), and in vitro application affects retinal curvature (Yamashita and Fukuda, 1993). Moreover, in mice lacking acetylcholinesterase, gross perturbations in retinal organization were observed (Bytyqi et al., 2004). In contrast, we found that retinal area of the ChATr-/r- mice is not significantly different from those of wt retinas. This may be because ACh production in the wt region of the ChATr-/r- animals is sufficient to globally regulate eye growth or that ACh required for this process comes from a source outside the retina. An additional possibility is that there are species differences in the dependence of ACh for controlling eye size.
Previous studies in which starburst amacrine cells were ablated postnatally, either pharmacologically (Reese et al., 2001) or genetically (Yoshida et al., 2001), did not reveal significant abnormalities in overall retinal organization. In the ferret, however, the transient targeting of photoreceptors axons to the inner plexiform layer is prevented when starburst cells are ablated (Johnson et al., 2001). Studies in which cholinergic transmission is perturbed earlier in development have also raised the possibility that ACh, presumably secreted from starburst cells, is important for retinal maturation at the cellular level. In mice lacking AChRβ2, RGC dendritic stratification appears to be delayed (Bansal et al., 2000), and in embryonic turtles, chronic treatment with curare reduces the dendritic arborization of the RGCs (Sernagor and Mehta, 2001). It was thus surprising that structural development of retinal neurons in the ChAT KO region was primarily unchanged. Starburst amacrine cells are present in the ChAT KO regions, and their processes still form two distinct plexuses in the inner plexiform layer, as in the wt animal. Thus, although starburst amacrine cells transiently form cholinergic synaptic connections with each other during development (Zheng et al., 2004), such communication is not essential for the maturation of their overall radial morphology and lamination patterns. Moreover, RGCs that stratify within the plexuses of starburst amacrine cells (Sun et al., 2002; Stacy and Wong, 2003) develop their characteristic bistratified arbors. It appears that the size of the ON arbor, but not the OFF arbor, of LBCs is modestly reduced in the KO region. This disparity in the effects of ACh loss on ON versus OFF arbors of the LBCs would be curious, but previous studies have demonstrated that ON and OFF cholinergic amacrine cells that contact the LBCs themselves are not equivalent. For example, OFF cholinergic amacrine cells have P2X2 purinoceptors, whereas their ON counterparts do not (Kaneda et al., 2004). Future studies comparing the development of ON and OFF arbors of LBCs would help determine whether these two arbors are indeed regulated differentially by their inputs.
Although cholinergic transmission is not essential for the overall structural maturation of the retina, we cannot conclude that neurotransmission per se is unnecessary. This is because spontaneous activity persists in the ChAT KO regions, and patterned activity emerges by P5, before RGCs dendrites are well stratified (Stacy and Wong, 2003). Finally, starburst amacrine cells that also contain GABA and adenosine might use these other neurotransmitters to instruct retinal development.
A gap-junctional network compensates for the absence of ACh in the mutant
Patterned spontaneous activity in the developing nervous system is maintained with remarkable constancy despite perpetual rearrangements in the circuits that generate it. Changes to the network during the period of synchronized activity in the retina, cortex, or spinal cord include differentiation of novel cell types, formation and elimination of synapses, and maturation of distinct neurotransmitter pathways. The intrinsic biophysical properties of neurons also change with maturation, reducing excitability in some cells and increasing it in others (Zhou and Fain, 1996; Wang et al., 1997; Rothe et al., 1999; Myhr et al., 2001). Homeostatic mechanisms must exist to ensure maintenance of patterned spontaneous activity during development, yet little is known about such mechanisms in the CNS.
In our study, the region-specific excision of ChAT within the retina provided a unique opportunity to compare spontaneous activity patterns in neighboring regions with and without cholinergic transmission. We found that from P0 to P3, waves only propagated in regions where ACh is synthesized, confirming previous observations (Feller et al., 1996; Sernagor and Grzywacz, 1996; Sernagor et al., 2000; Zhou and Zhao, 2000). Patches of spontaneous activity still occurred within the KO regions, as observed previously in the α3 nicotinic receptor subunit KO (Bansal et al., 2000). Waves decayed as they enter the ChAT KO region (Fig. 3A), indicating that the circuitry of the KO region is incapable of propagating activity. Thus, our observations corroborate those of the AChRα3 KO that suggest ACh is unnecessary for initiating spontaneous activity but is involved in its propagation across the retina.
However, in contrast to results reported for α3 and β2 KOs, activity propagated across the ChAT KO region by P5, before the stage when glutamatergic networks normally become essential for generating waves (around P10). Waves in the ChAT KO do not require cholinergic or glutamatergic neurotransmission and are modulated by GABAergic and glycinergic neurotransmission, like their wt counterparts. However, unlike wt waves at this age, waves in the ChAT KO region depend on gap junctions. Indeed, the ChAT KO waves share spatiotemporal characteristics with gap-junctionally mediated waves of the wt retina before synaptogenesis (Catsicas et al., 1998; Syed et al., 2004b). During the period when cholinergic transmission underlies wave propagation, L-type voltage-gated Ca2+ channel agonists increase cellular coupling and induce waves propagated via gap junctions, even when cholinergic transmission is blocked (Singer et al., 2001). Waves in the ChAT KO resemble these agonist-induced waves, suggesting that the circuitry for nonsynaptic wave propagation remains after synaptogenesis. Our observations of the P5 ChAT KO regions suggest that gap junctions are capable of wave propagation in more mature retinas when the synaptic drive normally provided by cholinergic neurotransmission is unavailable.
In order for locally generated activity to propagate across large areas of the retina, sufficient network excitability must exist to overcome inhibitory and refractory barriers to propagation. During the first postnatal week, ACh provides the major source of excitation, although gap junctions contribute as well. A modest reduction in excitation (e.g., by blocking gap junctions) merely reduces wave frequency, whereas more extreme reductions in excitation (blocking nAChRs) eliminate waves altogether (Feller, 2002). In the absence of nicotinic cholinergic transmission, waves can propagate if either excitation via gap junctions is increased (Singer et al., 2001) or inhibition is reduced (e.g., GABAergic blockade in long-term DHβE experiments).
We propose that between P3 and P5, excitation via gap junctions in the KO region of the ChATr-/r- retina exceeds the threshold for propagation set by network refractoriness and inhibition. The ability of gap junctions to propagate waves may reflect an increase in functional coupling either by opening existing gap junctions or the formation of new gap junctions. Alternatively or in addition, the threshold for propagation by gap junctions may have been lowered by increasing neuronal excitability, decreasing neuronal refractoriness, or decreasing inhibition.
In both cortex and retina, dye coupling is significantly reduced as synaptic networks mature (for review, see Roerig and Feller, 2000). This raises an intriguing possibility that, in the wt retina, cholinergic signaling acts as a trigger to suppress neuronal coupling as chemical synaptic connectivity matures. However, the emergence of transmitter-mediated waves does not depend on the presence of gap junctions, because ACh-dependent retinal waves are present after birth in connexin-36 KO animals (Torborg et al., 2005). In summary, our current findings suggest that the developing retina is able to recruit electrical synapses to ensure that its patterned output is maintained when the primary chemical synaptic drive is unavailable.
Footnotes
This work was supported by the National Eye Institute (R.C.S., R.O.L.W.), the National Science Foundation (J.D.), and the National Institute of Neurological Disorders and Stroke (R.O.L.W., J.R.S.). We thank P. Gruss for generously providing the α-cre line and C. Lobe for the Z/EG line.
Correspondence should be addressed to Rachel O. L. Wong, Department of Anatomy and Neurobiology, Box 8108, Washington University School of Medicine, 660 South Euclid Avenue, St. Louis, MO 63110. E-mail: wongr@pcg.wustl.edu.
Copyright © 2005 Society for Neuroscience 0270-6474/05/259347-11$15.00/0
R.C.S. and J.D. contributed equally to this work.
References
- Bansal A, Singer JH, Hwang BJ, Xu W, Beaudet A, Feller MB (2000) Mice lacking specific nicotinic acetylcholine receptor subunits exhibit dramatically altered spontaneous activity patterns and reveal a limited role for retinal waves in forming ON and OFF circuits in the inner retina. J Neurosci 20: 7672-7681. [DOI] [PMC free article] [PubMed] [Google Scholar]
- Buffelli M, Burgess RW, Feng G, Lobe CG, Lichtman JW, Sanes JR (2003) Genetic evidence that relative synaptic efficacy biases the outcome of synaptic competition. Nature 424: 430-434. [DOI] [PubMed] [Google Scholar]
- Bytyqi AH, Lockridge O, Duysen E, Wang Y, Wolfrum U, Layer PG (2004) Impaired formation of the inner retina in an AChE knockout mouse results in degeneration of all photoreceptors. Eur J Neurosci 20: 2953-2962. [DOI] [PubMed] [Google Scholar]
- Catsicas M, Bonness V, Becker D, Mobbs P (1998) Spontaneous Ca2+ transients and their transmission in the developing chick retina. Curr Biol 8: 283-286. [DOI] [PubMed] [Google Scholar]
- Chub N, O'Donovan MJ (1998) Blockade and recovery of spontaneous rhythmic activity after application of neurotransmitter antagonists to spinal networks of the chick embryo. J Neurosci 18: 294-306. [DOI] [PMC free article] [PubMed] [Google Scholar]
- Demas J, Eglen SJ, Wong RO (2003) Developmental loss of synchronous spontaneous activity in the mouse retina is independent of visual experience. J Neurosci 23: 2851-2860. [DOI] [PMC free article] [PubMed] [Google Scholar]
- Efron B (1979) Bootstrap methods: another look at the jackknife. Ann Stat 7: 1-26. [Google Scholar]
- Feller MB (1999) Spontaneous correlated activity in developing neural circuits. Neuron 22: 653-656. [DOI] [PubMed] [Google Scholar]
- Feller MB (2002) The role of nAChR-mediated spontaneous retinal activity in visual system development. J Neurobiol 53: 556-567. [DOI] [PubMed] [Google Scholar]
- Feller MB, Wellis DP, Stellwagen D, Werblin FS, Shatz CJ (1996) Requirement for cholinergic synaptic transmission in the propagation of spontaneous retinal waves. Science 272: 1182-1187. [DOI] [PubMed] [Google Scholar]
- Fischer KF, Lukasiewicz PD, Wong RO (1998) Age-dependent and cell class-specific modulation of retinal ganglion cell bursting activity by GABA. J Neurosci 18: 3767-3778. [DOI] [PMC free article] [PubMed] [Google Scholar]
- Garaschuk O, Hanse E, Konnerth A (1998) Developmental profile and synaptic origin of early network oscillations in the CA1 region of rat neonatal hippocampus. J Physiol (Lond) 507: 219-236. [DOI] [PMC free article] [PubMed] [Google Scholar]
- Garaschuk O, Linn J, Eilers J, Konnerth A (2000) Large-scale oscillatory calcium waves in the immature cortex. Nat Neurosci 3: 452-459. [DOI] [PubMed] [Google Scholar]
- Huberman AD, Wang GY, Liets LC, Collins OA, Chapman B, Chalupa LM (2003) Eye-specific retinogeniculate segregation independent of normal neuronal activity. Science 300: 994-998. [DOI] [PMC free article] [PubMed] [Google Scholar]
- Johnson PT, Williams RR, Cusato K, Reese BE (1999) Rods and cones project to the inner plexiform layer during development. J Comp Neurol 414: 1-12. [PubMed] [Google Scholar]
- Johnson PT, Raven MA, Reese BE (2001) Disruption of transient photoreceptor targeting within the inner plexiform layer following early ablation of cholinergic amacrine cells in the ferret. Vis Neurosci 18: 741-751. [DOI] [PubMed] [Google Scholar]
- Kammandel B, Chowdhury K, Stoykova A, Aparicio S, Brenner S, Gruss P (1999) Distinct cis-essential modules direct the time-space pattern of the Pax6 gene activity. Dev Biol 205: 79-97. [DOI] [PubMed] [Google Scholar]
- Kaneda M, Ishii K, Morishima Y, Akagi T, Yamazaki Y, Nakanishi S, Hashikawa T (2004) OFF-cholinergic-pathway-selective localization of P2X2 purinoceptors in the mouse retina. J Comp Neurol 476: 103-111. [DOI] [PubMed] [Google Scholar]
- Kettunen P, Demas J, Lohmann C, Kasthuri N, Gong Y, Wong RO, Gan WB (2002) Imaging calcium dynamics in the nervous system by means of ballistic delivery of indicators. J Neurosci Methods 119: 37-43. [DOI] [PubMed] [Google Scholar]
- Legendy CR, Salcman M (1985) Bursts and recurrences of bursts in the spike trains of spontaneously active striate cortex neurons. J Neurophysiol 53: 926-939. [DOI] [PubMed] [Google Scholar]
- Leinekugel X, Medina I, Khalilov I, Ben-Ari Y, Khazipov R (1997) Ca2+ oscillations mediated by the synergistic excitatory actions of GABA(A) and NMDA receptors in the neonatal hippocampus. Neuron 18: 243-255. [DOI] [PubMed] [Google Scholar]
- Lohmann C, Myhr KL, Wong RO (2002) Transmitter-evoked local calcium release stabilizes developing dendrites. Nature 418: 177-181. [DOI] [PubMed] [Google Scholar]
- Marquardt T, Ashery-Padan R, Andrejewski N, Scardigli R, Guillemot F, Gruss P (2001) Pax6 is required for the multipotent state of retinal progenitor cells. Cell 105: 43-55. [DOI] [PubMed] [Google Scholar]
- McLaughlin T, Torborg CL, Feller MB, O'Leary DD (2003) Retinotopic map refinement requires spontaneous retinal waves during a brief critical period of development. Neuron 40: 1147-1160. [DOI] [PubMed] [Google Scholar]
- Millar TJ, Morgan IG (1987) Cholinergic amacrine cells in the rabbit retina synapse onto other cholinergic amacrine cells. Neurosci Lett 74: 281-285. [DOI] [PubMed] [Google Scholar]
- Misgeld T, Burgess RW, Lewis RM, Cunningham JM, Lichtman JW, Sanes JR (2002) Roles of neurotransmitter in synapse formation: development of neuromuscular junctions lacking choline acetyltransferase. Neuron 36: 635-648. [DOI] [PubMed] [Google Scholar]
- Myhr KL, Lukasiewicz PD, Wong RO (2001) Mechanisms underlying developmental changes in the firing patterns of ON and OFF retinal ganglion cells during refinement of their central projections. J Neurosci 21: 8664-8671. [DOI] [PMC free article] [PubMed] [Google Scholar]
- Novak A, Guo C, Yang W, Nagy A, Lobe CG (2000) Z/EG, a double reporter mouse line that expresses enhanced green fluorescent protein upon Cre-mediated excision. Genesis 28: 147-155. [PubMed] [Google Scholar]
- O'Donovan MJ (1999) The origin of spontaneous activity in developing networks of the vertebrate nervous system. Curr Opin Neurobiol 9: 94-104. [DOI] [PubMed] [Google Scholar]
- O'Donovan MJ, Wenner P, Chub N, Tabak J, Rinzel J (1998) Mechanisms of spontaneous activity in the developing spinal cord and their relevance to locomotion. Ann NY Acad Sci 860: 130-141. [DOI] [PubMed] [Google Scholar]
- Pearson R, Catsicas M, Becker D, Mobbs P (2002) Purinergic and muscarinic modulation of the cell cycle and calcium signaling in the chick retinal ventricular zone. J Neurosci 22: 7569-7579. [DOI] [PMC free article] [PubMed] [Google Scholar]
- Peinado A (2000) Traveling slow waves of neural activity: a novel form of network activity in developing neocortex. J Neurosci 20: RC54(1-6). [DOI] [PMC free article] [PubMed] [Google Scholar]
- Peinado A, Yuste R, Katz LC (1993) Gap junctional communication and the development of local circuits in neocortex. Cereb Cortex 3: 488-498. [DOI] [PubMed] [Google Scholar]
- Penn AA, Riquelme PA, Feller MB, Shatz CJ (1998) Competition in retinogeniculate patterning driven by spontaneous activity. Science 279: 2108-2112. [DOI] [PubMed] [Google Scholar]
- Reese BE, Raven MA, Giannotti KA, Johnson PT (2001) Development of cholinergic amacrine cell stratification in the ferret retina and the effects of early excitotoxic ablation. Vis Neurosci 18: 559-570. [DOI] [PubMed] [Google Scholar]
- Rockhill RL, Euler T, Masland RH (2000) Spatial order within but not between types of retinal neurons. Proc Natl Acad Sci USA 97: 2303-2307. [DOI] [PMC free article] [PubMed] [Google Scholar]
- Roerig B, Feller MB (2000) Neurotransmitters and gap junctions in developing neural circuits. Brain Res Brain Res Rev 32: 86-114. [DOI] [PubMed] [Google Scholar]
- Rossi FM, Pizzorusso T, Porciatti V, Marubio LM, Maffei L, Changeux JP (2001) Requirement of the nicotinic acetylcholine receptor beta 2 subunit for the anatomical and functional development of the visual system. Proc Natl Acad Sci USA 98: 6453-6458. [DOI] [PMC free article] [PubMed] [Google Scholar]
- Rothe T, Juttner R, Bahring R, Grantyn R (1999) Ion conductances related to development of repetitive firing in mouse retinal ganglion neurons in situ. J Neurobiol 38: 191-206. [PubMed] [Google Scholar]
- Sernagor E, Grzywacz NM (1996) Influence of spontaneous activity and visual experience on developing retinal receptive fields. Curr Biol 6: 1503-1508. [DOI] [PubMed] [Google Scholar]
- Sernagor E, Mehta V (2001) The role of early neural activity in the maturation of turtle retinal function. J Anat 199: 375-383. [DOI] [PMC free article] [PubMed] [Google Scholar]
- Sernagor E, Eglen SJ, O'Donovan MJ (2000) Differential effects of acetylcholine and glutamate blockade on the spatiotemporal dynamics of retinal waves. J Neurosci 20: RC56(1-6). [DOI] [PMC free article] [PubMed] [Google Scholar]
- Sernagor E, Eglen SJ, Wong RO (2001) Development of retinal ganglion cell structure and function. Prog Retin Eye Res 20: 139-174. [DOI] [PubMed] [Google Scholar]
- Sernagor E, Young C, Eglen SJ (2003) Developmental modulation of retinal wave dynamics: shedding light on the GABA saga. J Neurosci 23: 7621-7629. [DOI] [PMC free article] [PubMed] [Google Scholar]
- Singer JH, Mirotznik RR, Feller MB (2001) Potentiation of L-type calcium channels reveals nonsynaptic mechanisms that correlate spontaneous activity in the developing mammalian retina. J Neurosci 21: 8514-8522. [DOI] [PMC free article] [PubMed] [Google Scholar]
- Stacy RC, Wong RO (2003) Developmental relationship between cholinergic amacrine cell processes and ganglion cell dendrites of the mouse retina. J Comp Neurol 456: 154-166. [DOI] [PubMed] [Google Scholar]
- Sun W, Li N, He S (2002) Large-scale morphological survey of mouse retinal ganglion cells. J Comp Neurol 451: 115-126. [DOI] [PubMed] [Google Scholar]
- Syed MM, Lee S, He S, Zhou ZJ (2004a) Spontaneous waves in the ventricular zone of developing mammalian retina. J Neurophysiol 91: 1999-2009. [DOI] [PubMed] [Google Scholar]
- Syed MM, Lee S, Zheng J, Zhou ZJ (2004b) Stage-dependent dynamics and modulation of spontaneous waves in the developing rabbit retina. J Physiol (Lond) 560: 533-549. [DOI] [PMC free article] [PubMed] [Google Scholar]
- Torborg CL, Hansen KA, Feller MB (2005) High frequency, synchronized bursting drives eye-specific segregation of retinogeniculate projections. Nat Neurosci 8: 72-78. [DOI] [PMC free article] [PubMed] [Google Scholar]
- Vaney DI (1990) The mosaic of amacrine cells in the mammalian retina. Prog Ret Res 9: 49-100. [Google Scholar]
- Vessey JP, Lalonde MR, Mizan HA, Welch NC, Kelly ME, Barnes S (2004) Carbenoxolone inhibition of voltage-gated Ca channels and synaptic transmission in the retina. J Neurophysiol 92: 1252-1256. [DOI] [PubMed] [Google Scholar]
- Wang GY, Ratto G, Bisti S, Chalupa LM (1997) Functional development of intrinsic properties in ganglion cells of the mammalian retina. J Neurophysiol 78: 2895-2903. [DOI] [PubMed] [Google Scholar]
- Wong RO (1995) Cholinergic regulation of [Ca2+]i during cell division and differentiation in the mammalian retina. J Neurosci 15: 2696-2706. [DOI] [PMC free article] [PubMed] [Google Scholar]
- Wong RO (1999) Retinal waves and visual system development. Annu Rev Neurosci 22: 29-47. [DOI] [PubMed] [Google Scholar]
- Wong RO, Chernjavsky A, Smith SJ, Shatz CJ (1995) Early functional neural networks in the developing retina. Nature 374: 716-718. [DOI] [PubMed] [Google Scholar]
- Wong WT, Sanes JR, Wong RO (1998) Developmentally regulated spontaneous activity in the embryonic chick retina. J Neurosci 18: 8839-8852. [DOI] [PMC free article] [PubMed] [Google Scholar]
- Wong WT, Myhr KL, Miller ED, Wong RO (2000) Developmental changes in the neurotransmitter regulation of correlated spontaneous retinal activity. J Neurosci 20: 351-360. [DOI] [PMC free article] [PubMed] [Google Scholar]
- Yamashita M, Fukuda Y (1993) Incurvation of early embryonic neural retina by acetylcholine through muscarinic receptors. Neurosci Lett 163: 215-218. [DOI] [PubMed] [Google Scholar]
- Yamashita M, Yoshimoto Y, Fukuda Y (1994) Muscarinic acetylcholine responses in the early embryonic chick retina. J Neurobiol 25: 1144-1153. [DOI] [PubMed] [Google Scholar]
- Yoshida K, Watanabe D, Ishikane H, Tachibana M, Pastan I, Nakanishi S (2001) A key role of starburst amacrine cells in originating retinal directional selectivity and optokinetic eye movement. Neuron 30: 771-780. [DOI] [PubMed] [Google Scholar]
- Zheng JJ, Lee S, Zhou ZJ (2004) A developmental switch in the excitability and function of the starburst network in the mammalian retina. Neuron 44: 851-864. [DOI] [PubMed] [Google Scholar]
- Zhou ZJ (1998) Direct participation of starburst amacrine cells in spontaneous rhythmic activities in the developing mammalian retina. J Neurosci 18: 4155-4165. [DOI] [PMC free article] [PubMed] [Google Scholar]
- Zhou ZJ (2001) A critical role of the strychnine-sensitive glycinergic system in spontaneous retinal waves of the developing rabbit. J Neurosci 21: 5158-5168. [DOI] [PMC free article] [PubMed] [Google Scholar]
- Zhou ZJ, Fain GL (1996) Starburst amacrine cells change from spiking to nonspiking neurons during retinal development. Proc Natl Acad Sci USA 93: 8057-8062. [DOI] [PMC free article] [PubMed] [Google Scholar]
- Zhou ZJ, Zhao D (2000) Coordinated transitions in neurotransmitter systems for the initiation and propagation of spontaneous retinal waves. J Neurosci 20: 6570-6577. [DOI] [PMC free article] [PubMed] [Google Scholar]