

Abstract
Neuroimaging has revealed robust large-scale patterns of high neuronal activity in the human brain in the classical eyes-closed wakeful rest condition, pointing to the presence of a baseline of sustained endogenous processing in the absence of stimulus-driven neuronal activity. This baseline state has been shown to differ in major depressive disorder. More recently, several studies have documented that despite having a complex temporal structure, baseline oscillatory activity is characterized by persistent autocorrelations for tens of seconds that are highly replicable within and across subjects. The functional significance of these long-range temporal correlations has remained unknown.
We recorded neuromagnetic activity in patients with a major depressive disorder and in healthy control subjects during eyes-closed wakeful rest and quantified the long-range temporal correlations in the amplitude fluctuations of different frequency bands. We found that temporal correlations in the theta-frequency band (3-7 Hz) were almost absent in the 5-100 s time range in the patients but prominent in the control subjects. The magnitude of temporal correlations over the left temporocentral region predicted the severity of depression in the patients.
These data indicate that long-range temporal correlations in theta oscillations are a salient characteristic of the healthy human brain and may have diagnostic potential in psychiatric disorders. We propose a link between the abnormal temporal structure of theta oscillations in the depressive patients and the systems-level impairments of limbic-cortical networks that have been identified in recent anatomical and functional studies of patients with major depressive disorder.
Keywords: major depressive disorder, ongoing oscillations, long-range temporal correlations, magnetoencephalography, theta oscillations, fractal physiology
Introduction
Cognitive abilities are increasingly being linked to the dynamics of neuronal oscillations at various frequencies and on many spatial scales (Varela et al., 2001; Buzsáki and Draguhn, 2004). Whereas oscillations have traditionally been characterized in terms of their frequency content and amplitude, much of the current interest in oscillations is based on their proposed role in coordinating neuronal activities as reflected in their phase-locking (Lachaux et al., 1999; Singer, 1999; Simôes et al., 2003) or amplitude comodulation (Bruns et al., 2000; Nikouline et al., 2001). Correlations over time, however, may be equally important to brain function as are instantaneous correlations between activities in anatomically distributed networks, because successful performance of higher cognitive functions typically involves a series of operations that require temporal coordination of neuronal activity across many time scales. Notable examples are the short-term memory processes and sustained attention on time scales of tens of seconds that are keys to the production or comprehension of sentences in everyday life. Quantification of temporal autocorrelations on long time scales has greatly improved with the introduction of algorithms that do not require stationarity of the underlying physiological processes (Peng et al., 1995; Hu et al., 2001).
The analysis of long-range temporal (auto-) correlations (LRTC) provides a quantitative index of statistical dependencies in fluctuations on different time scales (as opposed to cross-correlation analysis, which provides an index of statistical dependencies between different channels). In physiology, LRTC analysis has been spearheaded by the field of science aiming to understand the complex dynamics of heartbeat intervals and its changes in disease (Goldberger et al., 2002). Promising results have pointed to diagnostic and prognostic potentials of this approach and provided valuable targets for evaluating and modeling the influence of physiological control mechanisms (Kantelhardt et al., 2003). Interestingly, a “fractal” dynamics with fluctuations on many time scales has emerged as a hallmark of the healthy heart: most cardiac pathologies are associated with either too stable or too disorganized heartbeat fluctuations (Havlin et al., 1999; Goldberger et al., 2002).
These ideas are now gaining ground in neuroscience: temporal correlations that persist for tens of seconds are a salient feature of ongoing neuronal oscillations in healthy humans (Linkenkaer-Hansen et al., 2001, 2004; Nikulin and Brismar, 2004, 2005) and monkeys (Leopold et al., 2003). In epileptogenic hippocampus, however, temporal correlations in ongoing activity were reported to be abnormally strong even during seizure-free periods (Parish et al., 2004). These results encourage additional investigations of the temporal structure of ongoing neuronal activity in neurological or psychiatric diseases to reveal novel indices of neuronal dysregulation in disease.
We recorded ongoing magnetoencephalographic (MEG) activity in patients with major depressive disorder and healthy control subjects. We explored the temporal dynamics of ongoing oscillations by analyzing for LRTC. The results indicate that temporal autocorrelations in the amplitude modulation of theta oscillations are almost absent in the 5-100 s range in the patients, despite their robust presence in the age-matched control subjects.
Materials and Methods
Patients. Twelve right-handed unmedicated and unipolar depressed out-patients, according to Diagnostic and Statistical Manual of the American Psychiatric Association IV (DSM-IV) (First et al., 1994), 44 ± 14 years of age (five females), participated in the study. At the time of participation in the study, the patients had been free from antidepressant medication for at least 2 weeks. Patients underwent the Structured Clinical Interview for DSM-IV (SCID) and met the DSM-IV criteria for current major depressive disorder and had a score of ≥18 on the 17-item Hamilton Depression Rating Scale (Hamilton, 1960) at the time of the study procedure. In addition, they had to be in good physical health as determined by a physical examination and laboratory evaluation. Subjects with schizophrenia or bipolar disorder, alcohol or drug dependence within 5 years, or significant suicidal ideation were excluded.
Control subjects. Ten age-matched right-handed healthy comparison subjects (42 ± 12 years of age; five females) were recruited. The comparison subjects had no DSM-IV axis I diagnosis in the SCID evaluation, were free from psychotropic medication, and had no medical illness and no history of CNS disease.
Recordings and experimental conditions. Ongoing electrical brain activity was measured with magnetoencephalography during eyes-closed wakeful rest for 16 min. The sensor array contained 204 planar gradiometers and 102 magnetometers covering the entire scalp (Neuromag; Elekta, Helsinki, Finland). Only the signals from the gradiometers were analyzed for this study, because the gradiometers detect less of the ambient noise and give the largest signal right above the current source. The sampling frequency was 300 Hz with a bandpass filter of 0.10-90 Hz. The study was approved by an ethical committee of Helsinki University Central Hospital. All subjects gave their written informed consent before enrolling in the study.
Data analysis and statistics. We analyzed the amplitude fluctuations of ongoing activity in three frequency ranges: 3-7, 7-13, and 15-29 Hz. Neuronal activity in these frequency bands are henceforth referred to as theta, alpha, and beta oscillations, respectively (Steriade et al., 1990).
We furthermore restricted the analysis of ongoing activity to occipitoparietal and left and right temporocentral regions (see Fig. 1 A) using spatial filtering, which enable the construction of an integrated time-series signal based on a weighted sum of the signals in several MEG sensors (Tesche et al., 1995). We selected the channels based on previous MEG studies in our laboratory that had identified a good signal-to-noise ratio of ongoing oscillations in these regions and frequency bands during the eyes-closed wakeful rest condition [Linkenkaer-Hansen et al. (2004), their Fig. 2]. A good signal-to-noise ratio is important because, unlike in the study of stimulus evoked activities, it is not possible to average the neuronal responses of several trials in the analysis of long-range temporal autocorrelations and thereby improve the signal-to-noise ratio.
Figure 1.
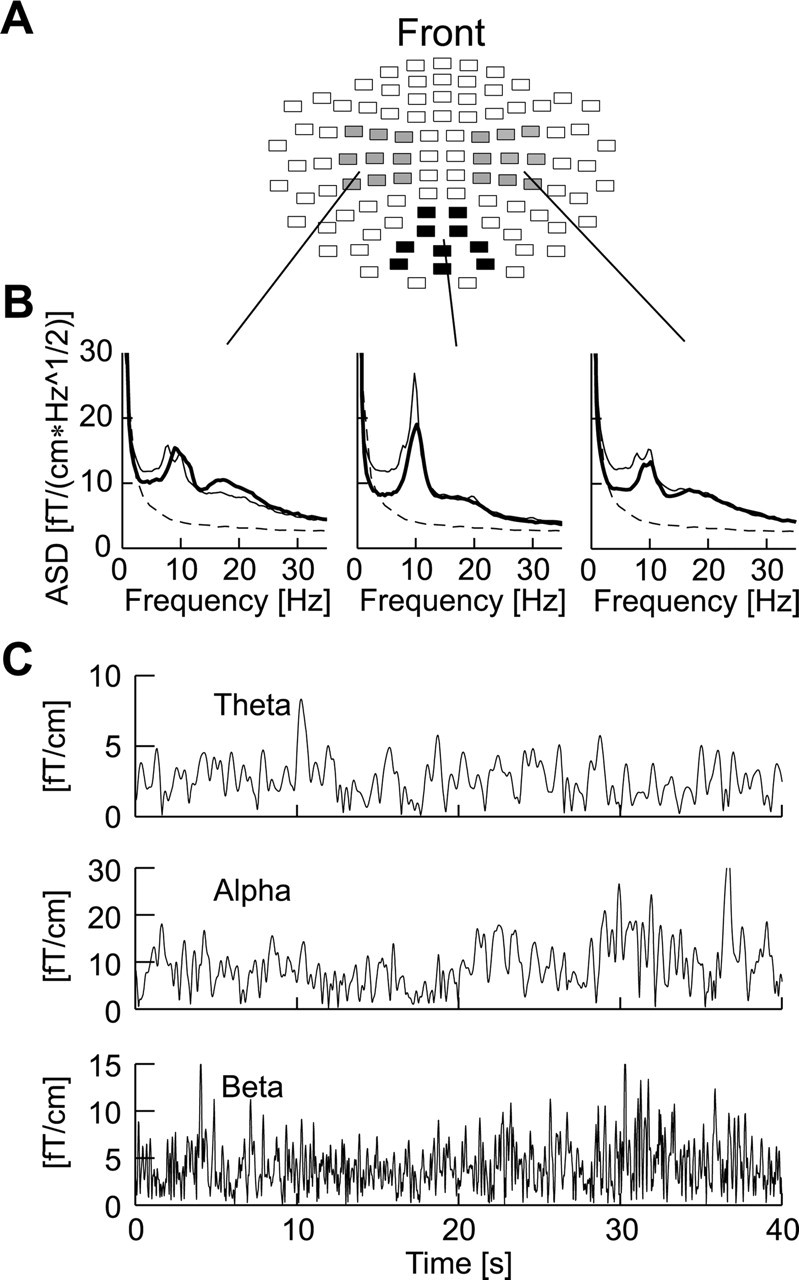
Channel selections and ongoing oscillations. A, The position of channels that covered the left and right temporocentral (gray) and occipitoparietal (black) regions are shown on a flattened view of the helmet-shaped sensor array. Each rectangle represents two joint planar gradiometers. B, The grand averaged amplitude spectral density (ASD) of the signal-space projections in the three regions indicate a considerable level of ongoing activity in the theta-(3-7 Hz), alpha-(7-13 Hz), and beta-frequency bands (15-29 Hz) in both patients (thick lines) and control subjects (thin lines) compared with the noise level in the MEG system (thin dashed lines). C, The oscillations in the theta-, alpha-, and beta-frequency bands exhibit large-amplitude variability on time scales of hundreds of milliseconds to tens of seconds.
Figure 2.

Intersubject variability of amplitudes and DFA exponents. For each oscillation, averaged across locations (occipitoparietal and left and right temporocentral regions), the individual mean amplitudes (A) and exponents (B) are shown for patients (squares) and controls (circles). The mean ± SEM is plotted next to the individual values.
The spatial filtering for characterizing the temporal evolution of ongoing activity in the three regions of interest was performed as follows. We selected 20 gradiometer channels over medial occipitoparietal and 18 channels over both left and right temporocentral regions of the helmet-shaped sensor array (see Fig. 1 A), excluding bad channels by visual inspection of the power spectra of the broadband signals. For each subject and frequency band, we assigned a weight, wi, to each recording channel from the relevant Fourier transform component of the broadband signal, ci(n). To extract a spatial pattern corresponding to an oscillatory source (at 5, 10, or 22 Hz), we used the same phase (φ = π/2) for each weight factor wi. The signal S(n), integrated across channels, and thus describing the network activity in the region of the sensor subset at each time point, n, was obtained by taking the inner product between the signal vector C(n) and the weight vector W: S(n) = WTC(n). Here, W is the projection vector given by the weights (w1, w2,..., wk)T, C(n) is the signal vector at time n: C(n) = [c1(n), c2(n),..., ck(n)]T, where k is the number of channels in the region of interest (i.e., 18 or 20), and superscript T signifies the transpose operation. The technique for spatial filtering of distributed oscillatory sources is called frequency-domain signal-space projection (Tesche et al., 1995). The spatial filters of the three regions were well separated, as implied by the mean angle of 91 ± 8° (mean ± SD) of the projection vectors.
The spatially integrated time series was subsequently filtered with Morlet wavelets to extract the amplitude envelope of the oscillations at center frequencies, f, of 5, 10, and 22 Hz. The time- and frequency-domain widths of the wavelets are given by t2σ = 2m/(πf) and f2σ = 4f/m, respectively. Here, the width of the Gaussian-shaped wavelet is defined as two SDs, σ, to both sides (i.e., 95% of the integrated amplitude of the wavelet falls within this window). The m parameter determines the compromise between time and frequency resolution (here, m = 6). Thus, for the 5 Hz wavelet filter, the signal is integrated 764 ms in the time domain and 3.33 Hz in the frequency domain; for the 10 Hz wavelet, the widths were 382 ms and 6.7 Hz; and for the 22 Hz wavelet, the widths were 164 ms and 14.6 Hz. The temporal correlations of the amplitude fluctuations in the time range from 5 to 100 s were quantified using the detrended fluctuation analysis (DFA) (Peng et al., 1995). The DFA measures the scaling of the root-mean-square fluctuation of the integrated and linearly detrended signals, F(τ), as a function of time window size, τ. For signals that are uncorrelated or have persistent power-law correlations, the average fluctuation <F(τ)> is of the form <F(τ)>= τ H; the DFA scaling exponent, H, attains the value of 0.5 in the ideal case of an uncorrelated signal, whereas 0.5 < H ≤ 1.0 indicate power-law scaling behavior and the presence of temporal correlations. We computed the fluctuation function of the DFA for 10 windows per decade, distributed evenly on a logarithmic scale. The fluctuation function is very smooth (see Fig. 3), and the value of the DFA scaling exponent therefore does not change if the number of windows is increased (data not shown). Details on the temporal correlation analysis of the amplitude modulation of ongoing oscillations have been published previously (Linkenkaer-Hansen et al., 2001, 2004).
Figure 3.
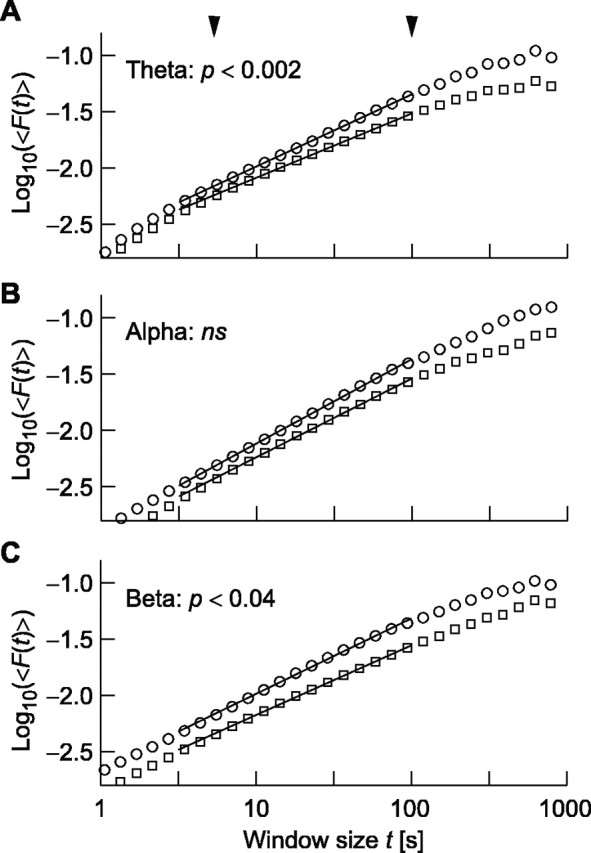
The detrended fluctuation analysis reveals an abnormal temporal correlation structure in theta and beta oscillations in depressive patients. B, The grand averages of the DFA in occipitoparietal and left and right temporocentral cortices show that patients (squares) and controls (circles) have nearly identical scaling and autocorrelation properties for the alpha-band oscillations. A, C, Theta and beta oscillations, however, have a faster decay of correlations as indicated by smaller slopes of the DFA function versus time window in the double-logarithmic coordinates. The curves have been vertically offset for the purpose of visualization. The arrow-heads mark the interval used for determining the DFA exponents.
Three two-way ANOVA tests were performed for each oscillation with the between-factor group (controls, patients) and within-factor location (occipitoparietal and left and right temporocentral regions). The statistical significance of temporal correlations in individual subjects was determined by performing Monte Carlo simulations using 500 surrogate data sets per subject. They were generated by first computing the Fourier transforms of the original signals, randomizing the Fourier phases while preserving the moduli, and then performing inverse Fourier transforms (Ivanov et al., 1996). Surrogate signals have amplitude spectra identical to the original signals, but possible temporal correlations are destroyed. A time series was considered long-range temporally correlated if the DFA exponent of the original signal fell into the upper 5% tail of the distribution of DFA exponents computed from its 500 surrogate data sets.
Results
Amplitudes of ongoing oscillations in theta-, alpha-, and beta-frequency bands
The energy of the MEG signals in the theta, alpha, and beta bands from occipitoparietal and left and right temporocentral regions were well above the background noise level from the laboratory and sensors (Fig. 1A,B).
The ANOVA of the theta-oscillation amplitudes did not yield a main effect of group nor of location. Nevertheless, post hoc comparisons showed that the control group had larger mean amplitude of theta than the patients in occipitoparietal and right temporocentral regions (F(1,20) = 5.74, p < 0.03 and F(1,20) = 4.69, p < 0.04, respectively) (Table 1). Post hoc comparisons did not reveal an effect of location for theta amplitude. There was also no main effect of group for alpha oscillation amplitude but a main effect of location (F(2,40) = 11.64; p < 0.0001; Green-house-Geisser corrected). Post hoc comparisons showed that the main effect of location was caused by the larger amplitudes of alpha oscillations in the occipitoparietal region compared with left (F(1,20) = 10.83; p < 0.004) and right temporocentral regions (F(1,20) = 22.93; p < 0.0001). The effect of group remained insignificant in the post hoc comparisons. The beta oscillation amplitude did not yield a main effect of group or location. Post hoc comparisons also showed no effect of group in any of the locations or differences in amplitude between locations (Table 1).
Table 1.
Group differences in DFA exponents and oscillation amplitudes
|
|
|
Theta |
Alpha |
Beta |
||||||
|---|---|---|---|---|---|---|---|---|---|---|
|
|
|
Patient |
Control |
Patient |
Control |
Patient |
Control |
|||
| LSM | 0.56 ± 0.01** | 0.62 ± 0.02 | 0.70 ± 0.03 | 0.71 ± 0.04 | 0.60 ± 0.02 | 0.67 ± 0.03 | ||||
| DFA | RSM | 0.55 ± 0.01** | 0.61 ± 0.02 | 0.67 ± 0.03 | 0.70 ± 0.04 | 0.62 ± 0.02 | 0.68 ± 0.03 | |||
| OP | 0.61 ± 0.02* | 0.68 ± 0.03 | 0.72 ± 0.02 | 0.80 ± 0.05 | 0.61 ± 0.02 | 0.64 ± 0.03 | ||||
| LSM | 2.20 ± 0.23 | 2.44 ± 0.30 | 5.18 ± 0.94 | 4.08 ± 0.80 | 3.67 ± 0.39 | 3.28 ± 0.43 | ||||
| Amp | RSM | 1.96 ± 0.14* | 2.56 ± 0.25 | 4.45 ± 0.54 | 3.87 ± 0.85 | 3.53 ± 0.42 | 3.04 ± 0.33 | |||
|
|
OP |
1.77 ± 0.14*
|
2.48 ± 0.28 |
5.65 ± 0.71 |
6.83 ± 1.31 |
3.18 ± 0.37 |
2.87 ± 0.36 |
|||
The significance levels from the ANOVA are indicated as follows: *p < 0.05; **p < 0.01. Amp, Amplitude; LSM, left temporocentral; OP, occipitoparietal; RSM, right temporocentral.
In summary, we did not observe a main effect of group in the mean amplitude of theta-, alpha-, or beta-frequency bands (Fig. 2A). Nevertheless, theta oscillations were significantly smaller in amplitude in the occipitoparietal and right temporocentral regions in patients with a major depressive disorder compared with the healthy control subjects.
Long-range temporal correlations in ongoing oscillations
The amplitude envelope of the theta, alpha, and beta oscillations exhibited large amplitude variability over time (Fig. 1C). We quantified the LRTC of these amplitude fluctuations on time scales of 5-100 s using the DFA (see Materials and Methods).
The ANOVA of LRTC in the theta oscillations yielded a main effect of group (F(1,20) = 12.7; p < 0.002) and a main effect of location (F(2,40) = 10.3; p < 0.002; Greenhouse-Geisser corrected). The main effect of group was caused by larger DFA exponents in the control subjects, and thus a slower decay of temporal correlations, than in the patients (Figs. 2B, 3A). Post hoc comparisons showed that this was the case at all three locations (Table 1). The main effect of location was caused by the larger DFA exponents of theta oscillations in the occipitoparietal region compared with left (F(1,20) = 8.69; p < 0.008) and right temporocentral regions (F(1,20) = 13.98; p < 0.001).
The alpha oscillations were characterized by strong LRTC both in depressive patients and control subjects (Figs. 2B, 3B) with DFA power-law exponents similar to previously reported values (Table 1) (Linkenkaer-Hansen et al., 2001, 2004). The ANOVA did not yield any effects of group but a main effect of location (F(2,40) = 5.04; p < 0.01; Greenhouse-Geisser corrected). The main effect of location was caused by the larger DFA exponents of alpha oscillations in the occipitoparietal region compared with left (F(1,20) = 4.53; p < 0.05) and right temporocentral regions (F(1,20) = 9.78; p < 0.005).
The LRTC of beta oscillations yielded a main effect of group (Fig. 2B) (F(1,20) = 5.12; p < 0.04) but not location. The main effect of group indicated that the control subjects had larger DFA exponents than the patients (Figs. 2B, 3C). Post hoc comparisons showed, however, that this effect only approached significance in left and right temporocentral regions (F(1,20) = 4.03, p < 0.06 and F(1,20) = 3.27, p < 0.09, respectively) (Table 1) and was not significant in the occipitoparietal region.
In summary, by analyzing the time structure of oscillation amplitudes, we revealed a robust decrease of long-range temporal correlations in theta oscillations of the depressive patients in comparison with the healthy controls (Fig. 2B).
Significance of theta LRTC in individual subjects
Long-range temporal correlations in ongoing theta oscillations in humans have not been reported previously, and their sensitivity to major depressive disorder warranted additional analysis. The DFA exponents of the theta oscillations in the depressive patients were very close to the theoretical value of 0.50 for uncorrelated data and to that of the similarly preprocessed empty-room MEG recording (H 5 Hz, empty-room = 0.53), which we used to control for possible correlations in background noise in sensors or the laboratory. To determine whether the numerical deviation from 0.50 in the DFA exponents of the 5 Hz oscillations could be explained by statistical uncertainties such as the finite size of the data sets, we performed Monte Carlo simulations on surrogate data (see Materials and Methods). In five of the patients, the LRTC were not distinguishable from those of the random surrogate data, and the remaining patients only had marginally larger correlations than the surrogate data (Fig. 4A). In contrast, 9 of 10 control subjects had significantly larger DFA exponents than surrogate data, and eight subjects clearly fell outside of the distribution of DFA exponents from the surrogate-data simulations (Fig. 4B), suggesting that LRTC are a characteristic feature of theta oscillations in the normal human brain.
Figure 4.

Surrogate data analysis indicates an almost complete lack of long-range temporal correlations in the theta oscillations of depressive patients. A, B, The scaling exponents (averaged across locations) of the original theta oscillation time series (indicated with vertical lines) are mostly indistinguishable from the probability distribution of DFA exponents from 500 surrogate data sets from each subject in depressive patients (A), whereas normal control subjects fall clearly outside the central part of the distributions (B).
Magnitude of LRTC predicts the severity of depression
Finally, we tested whether the LRTC was related to the severity of depression in the patients. A strong linear correlation was observed between the DFA exponents of theta oscillations detected over the left temporocentral region and the score in the Hamilton Depression Rating Scale (R = -0.73; p < 0.01). Thus, the more depressed the patient, the less autocorrelated are the amplitude fluctuations in the theta-frequency band (Fig. 5A). This correlation was not significant in occipitoparietal and right temporocentral cortices despite the significant group effect of DFA exponents (compare Table 1). Importantly, however, the correlation of DFA exponents and Hamilton scores was contrasted by a lack of correlation between DFA exponents and the theta amplitudes (Fig. 5B) or between amplitudes and the Hamilton score (Fig. 5C). Thus, it is the temporal dynamics of these oscillations rather than the ability to generate them that is adversely affected by the major depressive disorder (Fig. 2A). Correlation values with the severity of depression for amplitudes and scaling exponents are listed in Table 2. For alpha oscillations detected over the occipitoparietal region, there was a small, albeit significant, positive correlation between exponents and the Hamilton score.
Figure 5.

The severity of depression is reflected in DFA power-law scaling exponents of theta oscillations. A, B, The DFA exponents of left temporocentral theta oscillations are correlated with the Hamilton score of depression (A) but not with the amplitude of these oscillations (B). C, Moreover, the amplitude of the theta oscillations does not predict the severity of the depression.
Table 2.
Correlation values (R) between the score in the Hamilton Depression Rating Scale and exponents (DFA) or mean oscillation amplitudes for the patients
|
|
|
Theta |
Alpha |
Beta |
|---|---|---|---|---|
| LSM | −0.73** | −0.02 | −0.19 | |
| DFA | RSM | −0.26 | 0.41 | −0.46 |
| OP | 0.18 | 0.59* | 0.40 | |
| LSM | −0.52 | −0.29 | −0.05 | |
| Amp | RSM | −0.57 | 0.05 | 0.09 |
|
|
OP |
−0.24 |
−0.13 |
−0.19 |
The significance levels are indicated as follows: *p < 0.05; **p < 0.01. Amp, Amplitude; LSM, left temporocentral; OP, occipitoparietal; RSM, right temporocentral.
The DFA is often said to detect hidden patterns in complex data (Havlin and Stanley, 1999). Figure 6 displays the amplitude envelope of theta oscillations in the left temporocentral region for epochs of 100 s in three representative depressive patients and three control subjects. The exact fluctuation patterns are distinct from subject to subject, but it is not possible to discriminate the patients from the control subjects after visual inspection. In this sense, the DFA has indeed revealed a “hidden” difference in the complex structure of the amplitude fluctuations of ongoing oscillations.
Figure 6.

Control subjects have “hidden” fractal patterns that are essentially absent in depressive patients. The amplitude fluctuations of the theta oscillations in the left temporocentral region over the course of 100 s are displayed for three representative patients (left column) and control subjects (right column). Despite the quantitative difference between subjects, it is not possible to identify a qualitative difference between the two groups by visual inspection. The DFA exponents (H) of the chosen individuals are indicated above the time series. The empty-room reference recording is shown to indicate the noise level at ∼5 Hz.
Discussion
We investigated LRTC in the amplitude fluctuations of ongoing neuronal oscillations in patients with a major depressive disorder and in normal subjects during eyes-closed wakeful rest. The patients displayed abnormally small autocorrelations on long time scales (5-100 s) in the theta-frequency band and, to a lesser extent, in the beta-frequency band. Moreover, we observed an inverse relationship between LRTC in the theta oscillations detected over the left temporocentral region and the severity of the depression. Our findings of abnormal dynamics of theta oscillations point to a previously unknown pathophysiology in depression. In a wider perspective, however, the results are in line with the growing evidence that physiologic systems in a healthy state generate activity fluctuations on many time scales and that disease states are associated with a breakdown of this rich temporal structure (Goldberger, 1996; Havlin et al., 1999; Goldberger et al., 2002).
Altered oscillation dynamics as a marker of pathophysiology Observing and controlling physiological oscillations may yield progress in diagnosis and remedy in different fields of medicine (Glass, 2001; Le Van Quyen, 2003). Ongoing oscillations of unmedicated acutely depressed unipolar patients have not been studied previously with magnetoencephalography, and studies of the ongoing EEG have used power-spectrum analysis or coherence (Knott et al., 2001; for review, see Heller and Nitschke, 1998), which lack information about the temporal structure of amplitude fluctuations. In the healthy control subjects, we replicated previous findings of robust LRTC in oscillations in the alpha, beta (Linkenkaer-Hansen et al., 2001, 2004; Nikulin and Brismar, 2004, 2005), and theta bands (K. Linkenkaer-Hansen, unpublished observations). In the depressive patients, however, LRTC were almost absent in the theta oscillations and weakened in beta oscillations, indicating that psychiatric disorders may be reflected in the temporal structure of electric neuronal activity. In the following, we focus on the effect in the theta-frequency band, because it was more pronounced and statistically more robust compared with the beta oscillations group effect (Fig. 3).
The baseline brain function in the eyes-closed wakeful rest condition
It is natural to relate our findings to the extensive knowledge on neuronal activity patterns in the classical eyes-closed wakeful rest condition used here. Ample evidence from recent years of neuroimaging points to a robust large-scale pattern of neuronal activity in the eyes-closed wakeful rest condition, reflecting the presence of sustained information processing in a consistent set of brain areas and considered a baseline mode of brain function (Gusnard and Raichle, 2001; Laufs et al., 2003). In magnetoencephalographic studies of the resting state, high levels of synchronized electrophysiological activity are detected from anatomical regions similar to those showing high levels of blood flow (Gusnard and Raichle, 2001; Linkenkaer-Hansen et al., 2004), except for the medial prefrontal regions, the activity of which is not sensed well by whole-scalp MEG systems. One might suspect that in the “unconstrained” resting state condition, brain activity would vary unpredictably. The evidence indicates, however, that neuronal activity patterns, including their long-range temporal correlations (Linkenkaer-Hansen et al., 2001; Nikulin and Brismar, 2004), are highly replicable within and across subjects (Gusnard and Raichle, 2001). This is incompatible with the frequently expressed concern that the state of the brain is not well controlled in this condition. The baseline functionality of the brain in the absence of interactions with the environment is characterized by stimulus-independent cognitive processes, such as monitoring of one's own mental state or recollection of episodic memories (Gusnard and Raichle, 2001; Laufs et al., 2003).
Depression is an enduring disorder of the internal state of the subject (more so than of processing sensory information), and it is therefore not surprising that metabolic studies have identified notable differences between depressive patients and healthy control subjects in the passive resting state condition (Drevets et al., 1997; Drevets, 2000). Our results indicate that important differences exist between the dynamics of the state of depressive patients compared with normal control subjects as reflected in ongoing oscillations.
Recent reports suggest that many but not all functional abnormalities found during a depressive episode recover after pharmacological or psychotherapeutic treatment (Austin et al., 2001; Castren, 2005). Thus, future studies should seek to establish whether the long-range temporal autocorrelations in theta (and beta) oscillations increase with the recovery from a depressive episode, or whether the absence of LRTC represents trait abnormalities.
Theta oscillations and the limbic-cortical impairments in major depressive disorder
Large-scale network oscillations in humans depend on neuronal interactions both at synaptic and network levels. The abnormal amplitude modulation of theta oscillations on time scales of tens of seconds in the patients may therefore depend on a complex set of regulatory mechanisms. From our findings alone, it is thus not possible to argue for a specific mechanism behind the effect of decreased LRTC in (theta and beta) oscillations. We may, nevertheless, consider some of the known physiological changes in depression that could contribute to the observed effects.
Based on an extensive literature on blood flow, metabolism, and histological findings, a malfunction of limbic-cortical networks is currently the leading systems-level candidate for mediating major depression (Drevets, 2000; Mayberg, 2003). The depressive disorder has been implicated with neuronal atrophy in the hippocampus (Manji et al., 2001; MacQueen et al., 2003; Campbell et al., 2004), of which the theta oscillation is a major operational mode (Buzsáki, 2002). In humans, theta oscillations have been recorded both neocortically and in the hippocampus (Kahana et al., 2001). In the present study, theta oscillations were recorded noninvasively and, thus, were most likely generated in the neocortex. Nevertheless, in view of the adverse effect of the major depressive disorder on the hippocampus and the prominence of theta oscillations in hippocampus, we suggest that the observed abnormal dynamics in the theta-frequency band in all cortical regions investigated are related to the changes in limbiccortical pathways that have been identified with other neuroimaging techniques in patients with major depressive disorder (Goldapple et al., 2004).
Possible functional consequences of decreased temporal correlations
Memory impairments are a characteristic symptom of major depressive disorder and have been linked to the associated dysfunction of the hippocampus (Pelosi et al., 2000; Austin et al., 2001). The stimulus-independent thoughts taking place during eyes-closed wakeful rest are characterized by a large degree of functional integrity over time, in the sense that information at various stages is associated with each other and thus requires short-term memory. We therefore propose that the observed breakdown of temporal correlations in theta oscillations may reflect impaired mnemonic functions that previous studies in humans have linked to theta oscillations (Sarnthein et al., 1998; Stam, 2000; Tesche and Karhu, 2000; Kahana et al., 2001; Kirk and Mackay, 2003).
Footnotes
This work was supported by the Danish Research Agency.
Correspondence should be addressed to Dr. Klaus Linkenkaer-Hansen, Center for Neurogenomics and Cognitive Research, Department of Experimental Neurophysiology, Vrije Universiteit Amsterdam, De Boelelaan 1085, 1081 HV Amsterdam, The Netherlands. E-mail: klaus.linkenkaer@cncr.vu.nl.
Copyright © 2005 Society for Neuroscience 0270-6474/05/2510131-07$15.00/0
References
- Austin M-P, Mitchell P, Goodwin GM (2001) Cognitive deficits in depression: possible implications for functional neuropathology. Br J Psychiatry 178: 200-206. [DOI] [PubMed] [Google Scholar]
- Bruns A, Eckhorn R, Jokeit H, Ebner A (2000) Amplitude envelope correlation detects coupling among incoherent brain signals. NeuroReport 11: 1509-1514. [PubMed] [Google Scholar]
- Buzsáki G (2002) Theta oscillations in the hippocampus. Neuron 33: 325-340. [DOI] [PubMed] [Google Scholar]
- Buzsáki G, Draguhn A (2004) Neuronal oscillations in cortical networks. Science 304: 1926-1929. [DOI] [PubMed] [Google Scholar]
- Campbell S, Marriott M, Nahmias C, MacQueen GM (2004) Lower hippocampal volume in patients suffering from depression: a meta-analysis. Am J Psychiatry 161: 598-607. [DOI] [PubMed] [Google Scholar]
- Castren E (2005) Is mood chemistry? Nat Rev Neurosci 6: 241-246. [DOI] [PubMed] [Google Scholar]
- Drevets WC (2000) Neuroimaging studies of mood disorders. Biol Psychiatry 48: 813-829. [DOI] [PubMed] [Google Scholar]
- Drevets WC, Price JL, Simpson Jr JR, Todd RD, Reich T, Vannier M, Raichle ME (1997) Subgenual prefrontal cortex abnormalities in mood disorders. Nature 386: 824-827. [DOI] [PubMed] [Google Scholar]
- First MB, Spitzer RL, Williams JBW, Gibbon M (1994) Structured clinical interview for DSM-IV-patient edition (SCID-P). Washington, DC: American Psychiatric Press.
- Glass L (2001) Synchronization and rhythmic processes in physiology. Nature 410: 277-284. [DOI] [PubMed] [Google Scholar]
- Goldapple K, Segal Z, Garson C, Lau M, Bieling P, Kennedy S, Mayberg H (2004) Modulation of cortical-limbic pathways in major depression. Arch Gen Psychiatry 61: 34-41. [DOI] [PubMed] [Google Scholar]
- Goldberger AL (1996) Non-linear dynamics for clinicians: chaos theory, fractals, and complexity by the bedside. Lancet 347: 1312-1314. [DOI] [PubMed] [Google Scholar]
- Goldberger AL, Amaral LAN, Hausdorff JM, Ivanov PC, Peng C-K, Stanley HE (2002) Fractal dynamics in physiology: alterations with disease and aging. Proc Natl Acad Sci USA 99: 2466-2472. [DOI] [PMC free article] [PubMed] [Google Scholar]
- Gusnard DA, Raichle ME (2001) Searching for a baseline: functional imaging and the resting human brain. Nat Rev Neurosci 2: 685-694. [DOI] [PubMed] [Google Scholar]
- Hamilton M (1960) A rating scale for depression. J Neurol Neurosurg Psychiatry 23: 56-62. [DOI] [PMC free article] [PubMed] [Google Scholar]
- Havlin S, Amaral LAN, Ashkenazy Y, Goldberger AL, Ivanov PC, Peng C-K, Stanley HE (1999) Application of statistical physics to heartbeat diagnosis. Physica A 274: 99-110. [DOI] [PubMed] [Google Scholar]
- Heller W, Nitschke JB (1998) The puzzle of regional brain activity in depression and anxiety: the importance of subtypes and comorbidity. Cogn Emotion 12: 421-447. [Google Scholar]
- Hu K, Ivanov PC, Chen Z, Carpena P, Stanley HE (2001) Effect of trends on detrended fluctuation analysis. Phys Rev E 64: 1-19. [DOI] [PubMed] [Google Scholar]
- Ivanov PC, Rosenblum MG, Peng C-K, Mietus J, Havlin S, Stanley HE, Goldberger AL (1996) Scaling behaviour of heartbeat intervals obtained by wavelet-based time-series analysis. Nature 383: 323-327. [DOI] [PubMed] [Google Scholar]
- Kahana MJ, Seeling D, Madsen JR (2001) Theta returns. Curr Opin Neurobiol 11: 739-744. [DOI] [PubMed] [Google Scholar]
- Kantelhardt JW, Havlin S, Ivanov PC (2003) Modeling transient correlations in heartbeat dynamics during sleep. Europhys Lett 62: 147-153. [Google Scholar]
- Kirk IJ, Mackay JC (2003) The role of theta range oscillations in synchronizing and integrating activity in distributed mnemonic networks. Cortex 39: 993-1008. [DOI] [PubMed] [Google Scholar]
- Knott V, Mahoney C, Kennedy S, Evans K (2001) EEG power, frequency, asymmetry and coherence in male depression. Psychiatry Res 106: 123-140. [DOI] [PubMed] [Google Scholar]
- Lachaux J-P, Rodriguez E, Martinerie J, Varela F (1999) Measuring phase synchrony in brain signals. Hum Brain Mapp 8: 194-208. [DOI] [PMC free article] [PubMed] [Google Scholar]
- Laufs H, Krakow K, Sterzer P, Eger E, Beyerle A, Salek-Haddadi A, Kleinschmidt A (2003) Electroencephalographic signatures of attentional and cognitive default modes in spontaneous brain activity fluctuations at rest. Proc Natl Acad Sci USA 100: 11053-11058. [DOI] [PMC free article] [PubMed] [Google Scholar]
- Leopold DA, Murayama Y, Logothetis NK (2003) Very slow activity fluctuations in monkey visual cortex: implications for functional brain imaging. Cereb Cortex 13: 422-433. [DOI] [PubMed] [Google Scholar]
- Le Van Quyen M (2003) Disentangling the dynamic core: a research program for a neurodynamics at the large scale. Biol Res 36: 67-88. [DOI] [PubMed] [Google Scholar]
- Linkenkaer-Hansen K, Nikouline VV, Palva JM, Ilmoniemi RJ (2001) Long-range temporal correlations and scaling behavior in human brain oscillations. J Neurosci 21: 1370-1377. [DOI] [PMC free article] [PubMed] [Google Scholar]
- Linkenkaer-Hansen K, Nikulin VV, Palva JM, Kaila K, Ilmoniemi RJ (2004) Stimulus-induced change in long-range temporal correlations and scaling behaviour of temporo-central oscillations. Eur J Neurosci 19: 203-211. [DOI] [PubMed] [Google Scholar]
- MacQueen GM, Campbell S, McEwen BS, Macdonald K, Amano S, Joffe RT, Nahmias C, Young LT (2003) Course of illness, hippocampal function, and hippocampal volume in major depression. Proc Natl Acad Sci USA 100: 1387-1392. [DOI] [PMC free article] [PubMed] [Google Scholar]
- Manji HK, Drevets WC, Charney DS (2001) The cellular neurobiology of depression. Nat Med 7: 541-547. [DOI] [PubMed] [Google Scholar]
- Mayberg HS (2003) Modulating dysfunctional limbic-cortical circuits in depression: towards development of brain-based algorithms for diagnosis and optimized treatment. Br Med Bull 65: 193-207. [DOI] [PubMed] [Google Scholar]
- Nikouline VV, Linkenkaer-Hansen K, Huttunen J, Ilmoniemi RJ (2001) Interhemispheric phase synchrony and amplitude correlation of spontaneous beta oscillations in human subjects: a magnetoencephalographic study. NeuroReport 12: 2487-2491. [DOI] [PubMed] [Google Scholar]
- Nikulin VV, Brismar T (2004) Long-range temporal correlations in alpha and beta oscillations: effect of arousal level and test-retest reliability. Clin Neurophys 115: 1896-1908. [DOI] [PubMed] [Google Scholar]
- Nikulin VV, Brismar T (2005) Long-range temporal correlations in electroencephalographic oscillations: relation to topography, frequency band, age and gender. Neuroscience 130: 547-556. [DOI] [PubMed] [Google Scholar]
- Parish LM, Worrell GA, Cranstoun SD, Stead SM, Pennell P, Litt B (2004) Long-range temporal correlations in epileptogenic and non-epileptogenic human hippocampus. Neuroscience 125: 1069-1076. [DOI] [PubMed] [Google Scholar]
- Pelosi L, Slade T, Blumhardt LD, Sharma VK (2000) Working memory dysfunction in major depression: an event-related potential study. Clin Neurophys 111: 1531-1543. [DOI] [PubMed] [Google Scholar]
- Peng C-K, Havlin S, Stanley HE, Goldberger AL (1995) Quantification of scaling exponents and crossover phenomena in nonstationary heartbeat time series. Chaos 5: 82-87. [DOI] [PubMed] [Google Scholar]
- Sarnthein J, Petsche H, Rappelsberger P, Shaw GL, von Stein A (1998) Synchronization between prefrontal and posterior association cortex during human working memory. Proc Natl Acad Sci USA 95: 7092-7096. [DOI] [PMC free article] [PubMed] [Google Scholar]
- Simôes C, Jensen O, Parkkonen L, Hari R (2003) Phase locking between human primary and secondary somatosensory cortices. Proc Natl Acad Sci USA 100: 2691-2694. [DOI] [PMC free article] [PubMed] [Google Scholar]
- Singer W (1999) Neuronal synchrony: a versatile code for the definition of relations? Neuron 24: 49-65. [DOI] [PubMed] [Google Scholar]
- Stam CJ (2000) Brain dynamics in theta and alpha frequency bands and working memory performance in humans. Neurosci Lett 286: 115-118. [DOI] [PubMed] [Google Scholar]
- Steriade M, Gloor P, Llinas RR, Lopes de Silva FH, Mesulam MM (1990) Report of IFCN committee on basic mechanisms. Basic mechanisms of cerebral rhythmic activities. Electroencephalogr Clin Neurophysiol 76: 481-508. [DOI] [PubMed] [Google Scholar]
- Tesche CD, Karhu J (2000) Theta oscillations index human hippocampal activation during a working memory task. Proc Natl Acad Sci USA 97: 919-924. [DOI] [PMC free article] [PubMed] [Google Scholar]
- Tesche CD, Uusitalo MA, Ilmoniemi RJ, Huotilainen M, Kajola M, Salonen O (1995) Signal-space projections of MEG data characterize both distributed and well-localized neuronal sources. Electroencephalogr Clin Neurophysiol 95: 189-200. [DOI] [PubMed] [Google Scholar]
- Varela F, Lachaux JP, Rodriguez E, Martinerie J (2001) The brainweb: phase synchronization and large-scale integration. Nat Rev Neurosci 2: 229-239. [DOI] [PubMed] [Google Scholar]