

Abstract
Previously, we showed that the ventral premotor cortex (PMv) underwent neurophysiological remodeling after injury to the primary motor cortex (M1). In the present study, we examined cortical connections of PMv after such lesions. The neuroanatomical tract tracer biotinylated dextran amine was injected into the PMv hand area at least 5 months after ischemic injury to the M1 hand area. Comparison of labeling patterns between experimental and control animals demonstrated extensive proliferation of novel PMv terminal fields and the appearance of retrogradely labeled cell bodies within area 1/2 of the primary somatosensory cortex after M1 injury. Furthermore, evidence was found for alterations in the trajectory of PMv intracortical axons near the site of the lesion. The results suggest that M1 injury results in axonal sprouting near the ischemic injury and the establishment of novel connections within a distant target. These results support the hypothesis that, after a cortical injury, such as occurs after stroke, cortical areas distant from the injury undergo major neuroanatomical reorganization. Our results reveal an extraordinary anatomical rewiring capacity in the adult CNS after injury that may potentially play a role in recovery.
Keywords: cortex, neuroanatomy, plasticity, squirrel monkey, stroke, PMv
Introduction
A disturbance in blood supply to the brain, as occurs in stroke, results in death of neuronal tissue in the affected region. Consequent to a stroke in the cerebral cortex, survivors often have numerous motor impairments, including loss of fine motor skills in the upper limb (Bucy, 1944; Passingham et al., 1983; Hoffman and Strick, 1995). This impairment leads to a decrease of function and, consequently, of the individual's overall autonomy, quality of life, and productivity (Olsen, 1990). Although some spontaneous recovery occurs in the weeks and months after injury (Duncan and Lai, 1997), between 15 and 30% of stroke survivors are permanently disabled, making stroke a leading cause of long-term disability (Muntner et al., 2002). Recent results from human and animal studies suggest that, after a stroke, the cerebral cortex is capable of significant reorganization (Nudo, 1999). To the extent that neuroplasticity may contribute to restitution of function, it is important to understand its underlying mechanisms.
A proposed mechanism to support recovery after a cortical infarct in the primary motor cortex (M1) is the remodeling of other intact, more distant regions of the brain, such as premotor areas. This possibility is supported by various changes known to occur in distant areas after a central lesion (Chollet et al., 1991; Lee and van Donkelaar, 1995; Witte and Stoll, 1997; Nudo, 1999). Particularly, the premotor cortex has been suggested to play an active role in motor recovery after stroke in nonhuman primates (Liu and Rouiller, 1999; Frost et al., 2003) and humans (Miyai et al., 1999, 2002).
One mode by which functional remodeling of premotor cortex could occur is through rewiring of its anatomical connections. Large-scale corticocortical sprouting of axons in the adult CNS after damage is still a matter of debate (Pearson et al., 2001). Only a few studies, all involving peripheral injury, support this mechanism. For example, in studies in visual cortex of adult cats after retinal lesions and in somatosensory cortex of adult monkeys after peripheral nerve injury, anatomical rewiring was limited to a few millimeters (Darian-Smith and Gilbert, 1994; Florence et al., 1998). However, it appears that a cortical injury creates a particularly favorable environment for sprouting to occur in the remaining, intact cortex (Napieralski et al., 1996; Carmichael et al., 2005). Although anatomical reorganization also occurs in the cortex immediately adjacent to a stroke-induced injury (Carmichael et al., 2001), the extension of this phenomenon to distant but interconnected areas has not been demonstrated in adult mammals. Because the ventral premotor cortex (PMv) shares extensive connections with M1 (Dum and Strick, 2005), after M1 injury, targets of PMv intracortical axons degenerate. It is reasonable to hypothesize that these PMv neurons would seek novel targets during the postinfarct period.
To determine whether anatomical reorganization parallels neurophysiological reorganization in PMv, we induced a cortical infarct destroying the M1 hand representation in adult squirrel monkeys and examined the cortical connections of PMv several months later. These data were compared with the pattern of connections in uninjured animals.
Materials and Methods
Experiments were performed in eight adult squirrel monkeys (genus Saimiri). All animal use was in accordance with a protocol approved by the Institutional Animal Care and Use Committee of the University of Kansas Medical Center. Briefly, after determination of each animal's dominant hand, neurophysiological mapping experiments were conducted to delineate motor and somatosensory representations in the contralateral frontal and parietal cortex. Animals in an experimental group (n = 4) then received an ischemic infarct to the contralateral M1 hand area. Several months later, a neuroanatomical tract tracer was injected into the PMv hand representation. Subsequent postmortem histologic analysis revealed retrograde and anterograde labeling patterns within the cerebral cortex. The results were compared with a group of control animals (n = 4) that underwent similar procedures, except for the cortical infarct.
Behavioral assessments
Using a modified “Klüver board” to assess manual performance on a reach and retrieval task (Glees, 1961; Nudo et al., 1992), a “preference score” was calculated as the average of the percentage of left- or right-hand initial reaches and percentage of left- or right-hand pellet retrievals for all wells. If the percentage score was higher than 50% for the left-hand, the monkey was considered left-handed (i.e., dominant hand is left-hand). The extent and time course of motor recovery using this infarct model has been described in detail in previous studies (Frost et al., 2003). They are briefly summarized in Results.
Derivation of motor maps
Microelectrode stimulation mapping in anesthetized animals was used to delineate the M1 and PMv forelimb and adjacent motor representations. This information was used to direct the location of the tracer injection site (see below) and to identify the areas sharing connections with PMv in the frontal cortex. Surgeries were performed using aseptic techniques and halothane-nitrous oxide anesthesia on the hemisphere contralateral to the dominant hand (Nudo et al., 1992). A craniotomy exposed the M1, PMv, and primary somatosensory cortex (S1) hand areas. A plastic cylinder was fitted over the opening and used to contain warm, sterile silicone oil. A digital photograph of the exposed cortex was taken and subsequently used to create a two-dimensional map of motor representations superimposed on the vascular landmarks. Then the halothane was withdrawn, ketamine-acepromazine or ketamine-valium (diazepam) was administered intravenously, and vital signs were monitored throughout the remainder of the experiment. A microelectrode, made from a glass micropipette tapered to a fine tip and filled with 3.5 m NaCl, was used for electrical stimulation applied at a depth of ∼1750 μm (layer V). Typical intracortical microstimulation (ICMS) parameters were used (Nudo et al., 1992, 1996), pulse trains were repeated at 1 Hz intervals, and current was limited to 30 μA or less. After appropriate positioning of the microelectrode, the intensity of the current was gradually increased until the elicited movement could be unambiguously identified by one experimenter and confirmed by another. Movements were described using conventional terminology (Gould et al., 1986). Joint movements consequent to the electrical stimuli were indicated on the digital photograph at the precise locations of the electrode penetrations. ICMS was delivered to sequential sites, and evoked motor responses were defined until the distal forelimb area was surrounded either by sites evoking proximal movements or no visible response. For the experimental animals, M1 was mapped at relatively low resolution (500 μm interpenetration distances) and PMv at relatively high resolution (250 μm interpenetration distances) before and 3 months after the M1 lesion. The lower resolution in M1 was sufficient for defining the borders of the hand representation and thus the intended lesion area. The higher resolution was used to define more precisely the changes in neurophysiological organization of PMv (Frost et al., 2003).
M1 and PMv hand representations were defined by these responses and their borders specified on the photograph (Fig. 1). To be consistent with our previous publications, the term “hand representation” is used instead of “distal forelimb representation.” We defined and included in the hand representation all sites at which electrical stimulation elicited movements of the digits, wrist, or forearm. We included sites evoking forearm and wrist movements in the hand representation for two reasons. First, in our experience using ICMS mapping procedures in squirrel monkeys, we have generally found that digits, wrist, and forearm representations are intermingled and circumscribed by representations of elbow and shoulder. In that respect, the forearm appears to be more related functionally to distal representations than proximal. Second, in a reaching movement, the positioning of the shoulder and elbow are more remote to the target and thus associated with a more general or global positioning of the limb. Conversely, the forearm allows more refined and precise orientation of digits in relation to the target. Thus, sites at which the stimulation elicited movement of the elbow, shoulder, orofacial area, or no response determined the physiological border of the hand representation. For additional details of these procedures and a discussion of the possible sources of variation in ICMS-defined motor maps, see Strick and Preston (1982), Donoghue et al. (1992), and Nudo et al. (1992, 1996). Details of hand representation areas for each animal are summarized in Table 1.
Figure 1.

BDA injection location. A, Left, Diagram illustrating the location of the M1 and PMv hand representations in cerebral cortex of a squirrel monkey. Movement representations as defined by microelectrode stimulation techniques are shown 3 months after an ischemic lesion in the M1 hand area. Sites whose stimulation evoked movements of the digits (red), wrist, and forearm (green) comprised the hand representation. Stimulation of surrounding sites evoked proximal (elbow, shoulder, and trunk; blue) or orofacial (yellow) movements or no response (gray hatching). Lesion location is shown in gray. Right, Demonstration of alignment of anatomical and physiological data. A1 shows the injection core in case 9406. Asterisks indicate locations of selected blood vessels, and cross indicates location of injection site. A2 shows the location of the PMv hand representation (outlined in red) in relation to the surface blood vessel pattern. Asterisks indicate locations of selected blood vessels at which they penetrate radially into the cortical gray matter. These reference markers provided a means to coregister the anatomical and physiological data. Because of shrinkage in the histological processing of the tissue, scaling was required to achieve optimal coregistration. A3 shows these two sets of data superimposed with an outline of the injection core. Finally, A4 shows the complete map of movement representations in PMv with respect to the dense core of the BDA injection. Scale bar, 1 mm. B, Location of injection core in each of the animals in the study (4 control cases on the left, 4 experimental cases on the right). BDA injections were well confined within the PMv hand representation in cases 9406, 21B, and 1662. In case 367E, the injection extended somewhat into nonresponsive and unmapped territory. However, because this case showed a similar pattern of connections when compared with other experimental cases, it was retained for additional analysis. Color code for movement representations is identical to A. Scale bar, 1 mm.
Table 1.
Evaluation of injection size and location
|
|
|
|
|
|
|
Movements evoked within the injection core |
||||||||
|---|---|---|---|---|---|---|---|---|---|---|---|---|---|---|
| Hand (%) |
||||||||||||||
| Group |
Case |
M1 hand area (mm2) |
PMv hand area (mm2)a
|
Injection area (mm2) |
Injection size category |
No response (%) |
Proximal (%) |
Wrist/forearm |
Digits |
Total |
||||
| Control | 1934 | 14.97 | 5.15 | 3.33 | Largeb | 1.2 | 13.5 | 68.5 | 16.8 | 85.3 | ||||
| Control | 1892 | 12.87 | 3.98 | 1.93c | Large | 0 | 32.1 | 5.7 | 62.2 | 67.9 | ||||
| Control | 9409 | 8.51 | 3.77 | 0.87 | Small | 0 | 16.2 | 13.7 | 70.1 | 83.8 | ||||
| Control | 3024 | 14.04 | 3.54 | 0.84 | Small | 11.9 | 0 | 54.8 | 33.3 | 88.1 | ||||
| Experimental | 21B | 0.75 | 5.08 | 1.06 | Small | 0 | 3.8 | 47.2 | 49.0 | 96.2 | ||||
| Experimental | 367E | 4.12 | 2.90 | 4.31 | Large | 36.5 | 30.1 | 22.7 | 10.7 | 33.4 | ||||
| Experimental | 1662 | 1.15 | 3.86 | 0.34 | Small | 0 | 0 | 84.2 | 15.8 | 100 | ||||
| Experimental |
9406 |
0.46 |
3.71 |
1.74 |
Large |
0 |
8.0 |
2.9 |
89.1 |
92.0 |
||||
Note the high individual variability in the absolute size of PMv (and other motor) maps. Thus, it is not readily apparent that the size of the PMv differs between groups. However, when the PMv hand area of each animal was compared before and after the lesion (paired comparisons), there was a significant difference between the groups in the amount of increase in total hand area (Frost, et al., 2003). On average, the increase in hand representation of PMv for the experimental group in the present study was 35.3 ± 22.6%.
The injections are large compared with others in the current study. However, they are relatively small compared with most other cortical connectivity studies.
Number is approximate because a portion of the injection core was absent (see Materials and Methods).
Identification of supplementary motor cortex (SMA) and dorsal premotor cortex (PMd) was based on previous neurophysiological data from our laboratory. The identification of remaining frontal areas was based on general landmarks and reports from other investigators (Preuss and Goldman-Rakic, 1989; Guldin et al., 1992).
Derivation of somatosensory maps
Additional mapping of the S1 was achieved in three cases (367E, 9406, and 21B). This information was used to help identify parietal areas sharing connections with PMv. To derive somatosensory maps in S1, techniques for microelectrode recording of multiunit neuronal activity were used to define cutaneous and muscle/joint fields in areas 3a, 3b, and 1/2 (Snow et al., 1988; Nudo, 1997; Barbay et al., 1999). Briefly, a glass micropipette similar to that used for ICMS procedures was used for somatosensory recording (impedance, 1-1.5 MΩ). The microelectrode was lowered perpendicular to the cortical surface, and the depth was adjusted to optimize the sensory signal (depth range of 400-1000 μm). Signals were filtered, amplified, and played over a loudspeaker for monitoring. Minimal cutaneous receptive fields were defined by determining the skin field over which cortical neurons were driven by just visible indentation of the skin with a fine glass probe. Adequate thresholds for cutaneous responses were then determined by modified von Frey hairs (Semmes-Weinstein monofilaments, i.e., using a filament smaller than 3.61). Deep receptive fields were defined by high-threshold stimulation and joint manipulation. Because area 3b was originally the focus for our studies, fewer penetrations were made in area 1/2. Whereas cutaneous and muscle-joint responses can also be recorded in M1 (area 4), the ICMS-derived motor maps, using the techniques and parameters described above, reliably determine the boundary between area 4 and area 3a. That is, the caudal boundary of the motor hand area closely corresponds to the cytoarchitectonic boundary between area 4 and area 3a as determined in parasagittal sections stained for Nissl substance (Nudo et al., 1992). An additional two rostrocaudal rows of microelectrode penetrations were made at a similar resolution to identify the area 3b/area 1/2 border (Kaas, 1993). Although this method did not provide great details on the internal organization of these areas, it allowed precise identification of borders, particularly between area 3a and 3b, between area 3b and 1/2, and the medial and lateral limits of the area 3b hand representation.
Identification of other somatosensory areas in the parietal cortex was based on topographic location and myeloarchitecture as described in previous reports in nonhuman primates (Krubitzer and Kaas, 1990b, 1992). We grouped areas 7b/anterior intraparietal area, secondary somatosensory area (S2), and parietal ventral area (PV) into a collective “posterior operculum/inferior parietal cortex” area. Although this conservative definition provided a reasonable level of confidence, the evaluation of any potential differences in connections of PMv with these areas will await additional studies. For details of classification of anatomical areas, see Dancause et al. (2005).
Cortical infarct methods
Electrocoagulation techniques were used to permanently occlude the blood vessels supplying the delimited M1 hand area (i.e., the cortical territory in which electrical stimulation resulted in movements of the hand) by passing electrical current between the tips of microforceps connected to a bipolar electrocoagulator. The resulting lesions using this technique are quite reliable and specific. They consistently correspond to the intended infarct zone and extend through all six layers of cortical gray matter without directly affecting the underlying white matter. The extent of electrocoagulation lesions was verified by three different techniques at three time points: (1) the ischemic borders of the lesion using laser Doppler blood flow imaging (Moor Instruments, Wilmington, DE) at 1 h after infarct, (2) the boundaries of ICMS-evoked motor responses elicited at the time of tracer injection several months later, and (3) the histologically defined necrosis in the postmortem tissue. All three techniques showed close correspondence of the limits of the infarcted zone. For more details regarding the electrocoagulation infarct technique and discussion of its limitations, see Nudo et al. (2003).
Neuronal tracer injections
After completion of all neurophysiological procedures (motor and sensory mapping), the neuronal tracer biotinylated dextran amine (BDA) [5% BDA in saline solution; 10,000 molecular weight (MW) conjugated to lysine; Molecular Probes, Eugene, OR] was injected into the center of the PMv hand area to visualize anterograde and retrograde connectivity. The most important variable for evaluation of the relative efficacy of the injection across cases is the size of the tracer injection site as derived from examination of the histological sections after processing. BDA injection locations with respect to the forelimb representation of PMv are shown in Figure 1. Injections in 9406 and 1662 were performed using a pneumatic picopump (PV830; World Precision Instruments, Sarasota, FL) and delivered through a tapered, graduated micropipette (5 μl capacity, 1 μl gradations, Fisherbrand; Fisher Scientific, Houston, TX) (for 9406, 30 μm outer diameter, 250 nl; for 1662, 40 μm outer diameter, 200 nl). These injections were performed ∼ 8 and ∼ 31 months after the M1 lesion for 9406 and 1662, respectively. Injections in 367E and 21B were made via pressure injection with a microsyringe pump controller ∼5 months after the M1 lesion (UPP2-1; World Precision Instruments) with a 1 μl Hamilton syringe (200 and 150 nl, respectively). Injections were made at multiple depths to label a column of PMv cortex through all layers of the gray matter. In general, we produced two very small injections in 21B and 1662 and two relatively larger injections in 367E and 9406, although conservative in relation to injections reported in most contemporary studies of intracortical tract tracing (Stepniewska et al., 1993; Ghosh and Gattera, 1995).
Histological procedures
After the injection of BDA, 12 d of incubation were allowed for transport of the label. The animal was then killed with a lethal dose of Euthasol (Delmarva Laboratories, Midlothian, VA) injected intra-abdominally and then perfused with a solution of 0.2% heparin/lidocaine with 0.9% saline, followed by 3% paraformaldehyde in phosphate buffer, pH 7.4. Then the brain was removed, and the cerebral cortex was separated from the rest of the brain. The cortex was then trimmed to remove and discard the temporal and occipital lobes. The remaining parietal and frontal cortex was carefully “unfolded” and gently flattened between two glass slides (Gould and Kaas, 1981). It was then postfixed in a solution of 20% glycerol/4% paraformaldehyde in 0.1 m phosphate buffer for 2 h, 20% glycerol/2% DMSO in 0.1 m phosphate buffer for ∼12 h, and 20% glycerol in 0.1 m phosphate buffer for ∼24 h. The cortex was then sectioned tangential to the cortical surface (thickness of 50 μm) using a freezing microtome. Tangential sections were used to allow the visualization of projection patterns within single histological sections and the coregistration of myeloarchitectonic and neurophysiologic data with reconstructions of tracer distribution (see below). The accuracy of these techniques was aided by the choice of species, because the frontal and parietal cortex of the squirrel monkey brain is relatively smooth, except for a shallow central sulcus roughly separating M1 from S1.
BDA processing. Every third section was used for histological processing to examine the presence of BDA, allowing us to document the patterns of axonal projections from and to PMv at steps of ∼150 μm (approximate, because some compression probably occurred during flattening) through the depths of the cortical gray matter.
Processing was performed using a Vectastain ABC kit (Elite; Vector Laboratories, Burlingame, CA). After sectioning, the tissue was passed through two 10 min rinses in cold 0.05 m potassium phosphate buffer in saline solution (KPBS), followed by two 30 min washes in 0.4% Triton X-100. Sections were rinsed three times (10 min each) in 0.05 m KPBS and then incubated overnight in the Vectastain “AB” solution (two drops of “A” and “B” per 5 ml of 0.05 KPBS; Elite; Vector Laboratories).
The following day, the tissue was rinsed (10 min) four times in 0.1 m KPBS and then incubated in a DAB solution [10 mg of DAB in 20 ml of 0.1 m KPBS and 6.7 μl of 30% H2O2 (formula modified from Dolleman-Van der Weel et al., 1994)] for 5-10 min. After three rinses in 0.1 m KPBS, the sections were mounted on subbed slides and dried overnight. The next day, a DAB intensification process was begun. First, sections were dehydrated and transferred to xylene for 4 d. They were then rehydrated, placed in H2O for 5 min, and then incubated in a 1.42% AgNO3 solution for 1 h at 56°C. Sections were subsequently passed through H2O (15 min), 0.2% HAuCl4 (10 min), H2O (15 min), 5% Na2S2O3 (5 min), and H2O (15 min). Sections were finally dehydrated again, followed by 5 min in xylene before being coverslipped the same day.
Myelin staining. Every third section was used for myelin staining to further delineate somatosensory areas of the parietal cortex. Particularly, myelin was useful in identifying the area 3b hand and orofacial representations (Qi and Kaas, 2004), S2 and PV (Krubitzer and Kaas, 1990a, 1992). Briefly, mounted sections were reacted with pyridine/acetic anhydride solution and then hydrated and reacted with increasing acetic acid solution. Sections were then incubated in silver nitrate solution for 1 h and then returned to the acetic acid solution. Finally, a solution of anhydrous sodium carbonate, ammonium nitrate, silver nitrate, silicotungstic acid, and formaldehyde was used as the developer. Sections were repetitively passed through the developer and potassium ferricyanide to increase contrast between areas. Several functional areas, such as area 3b of S1 or orofacial representations, became more darkly stained with this process. Particularly, this procedure allowed identification of the caudal border of 3b, as well as the hand/face septum corresponding to the lateral border of the 3b hand representation. In some sections, specific digit zones in 3b were clearly delineated.
Neuroanatomical analysis
Reconstruction of BDA-reacted sections. To document the distribution of BDA-labeled cell bodies, varicosities (terminal boutons), and fibers within the hemisphere ipsilateral to the injection in PMv, a neuroanatomical reconstruction system was used consisting of a computer-interfaced microscope and associated software (Neurolucida; MicroBrightField, Colchester, VT). The reconstruction system recorded the x and y coordinates of each of the BDA-labeled objects relative to the section outline (Figs. 2, 3). In addition, the locations of selected large blood vessels were documented using the same reconstruction system for use as fiducial markers.
Figure 2.

Pattern of terminal labeling from PMv in control animals. Reconstruction of the typical distribution of terminals observed in flattened, tangential sections through the frontoparietal cortex in a control case (1934; large injection, 2 sections). Because this animal received the largest BDA injection of any in the study and displayed the most extensive and densest distribution of terminals, it provides a reasonable estimate of the limits of normal PMv connectivity. Contours delineate physiologically or histologically defined areas. A gray arrowhead indicates the location of the hand/face septum. A black downward arrow indicates the location of area 1/2 of S1. Terminal labeling in the frontal cortex was found in areas rostral to PMv, the anterior operculum, the rostrolateral portion of M1, the PMd, and the SMA. Terminal labeling in the parietal cortex was confined primarily to the posterior operculum/inferior parietal cortex (PO/IP; area 7b, S2, and PV; black arrowheads) and the posterior parietal cortex. Very sparse labeling can be seen in the primary somatosensory cortex. CS, Central sulcus; CMA, cingulated motor area. Scale bar, 5 mm.
Figure 3.
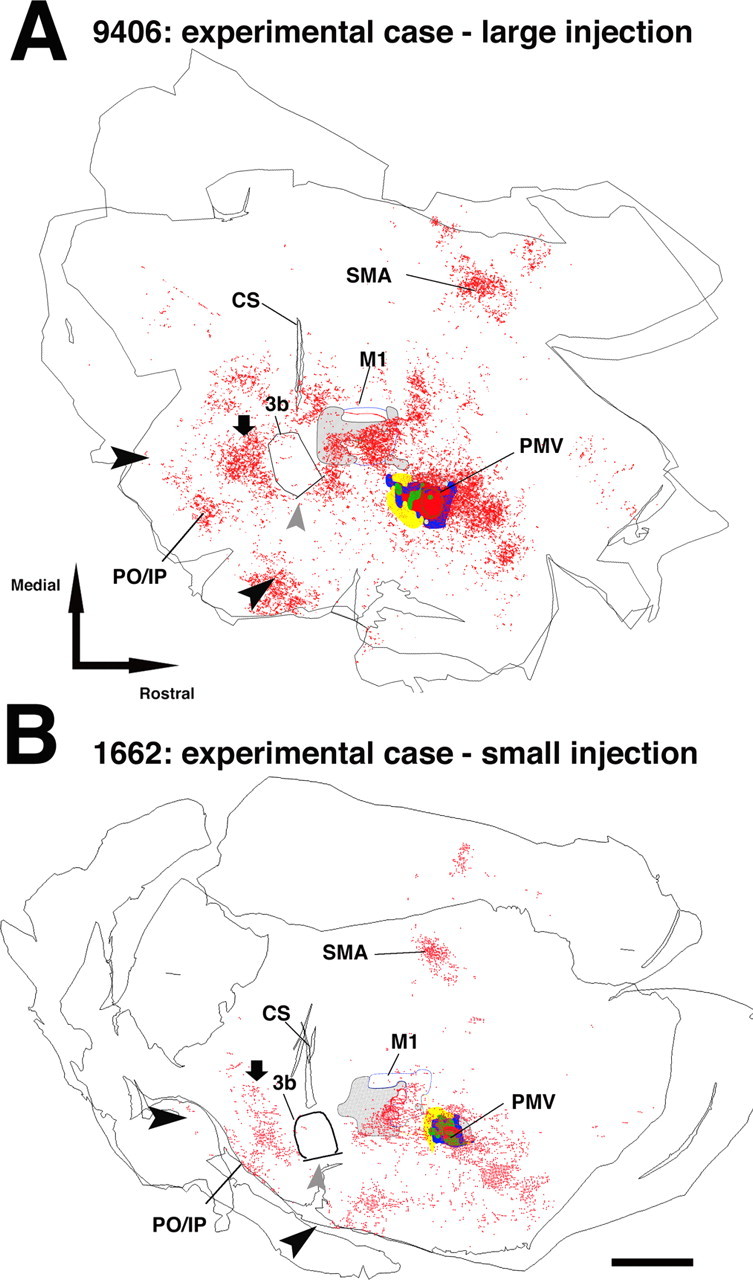
Pattern of terminal labeling from PMv in experimental animals (>5 months after injury). A, Distribution of PMv terminal labeling in experimental case 9406 (large injection; 2 sections). Terminal labeling was found in each of the regions noted in the control cases. Additionally, atypical labeling was observed caudal to the area 3b hand representation, i.e., in the area 1/2 hand representation (black downward arrow). This same result was replicated in each of the other experimental cases. Note that the atypical terminals were located rostral to the typical labeling found in posterior operculum/inferior parietal cortex (PO/IP; delimited by large black arrowheads). Gray arrowhead indicates the location of the hand/face septum. B, Distribution of PMv terminal labeling in experimental case 1662 (small injection; 2 sections). Scale bar, 5 mm. CS, Central sulcus.
Cell bodies or somata were approximately round in shape (because of tangential sectioning) containing dense black granules of BDA label. We required the labeled cell body to have at least two thin projections, considered to be dendrites or axons. Occasionally, cell bodies were so intensely labeled that they appeared solid dark brown.
Varicosities were considered to be terminals or boutons if they appeared as small, darkly labeled spheres contacting a small fiber. Because the time required to fully analyze all labeled terminals in every section was prohibitively long, we sampled two slides per animal at depths approximately corresponding to middle and deep layers (situated at depths of ∼300-600 and ∼1600-1800 μm, respectively). We sampled the selected sections using a grid pattern overlaid on the section image. If at least two terminals were located within a square of the grid (100 × 100 μm), a marker was placed in the center of the square. Because each section had a finite depth (50 μm), the volumetric unit “voxel” is used in the present description. The voxel method is particularly useful for the precise documentation of the terminal locations in a reasonable time. However, the resulting resolution of 0.01 mm2 per 50-μm-thick grid (or 0.0005 mm3) provided limited information on absolute synapse density and thus on total synapse numbers (one voxel can have between two and hundreds of synapses). The resulting numbers of labeled voxels are more directly correlated with the total cortical volume occupied by terminals from PMv. This should be considered in the interpretation of quantitative results. High-resolution photographs of the remaining BDA-processed sections were scanned visually (but not entered into the computerized neuroanatomical system) to ensure representative sampling. This tissue was not found to differ in any substantial way from the reconstructed data.
Large fibers consisting of darkly stained strands with large diameter and relatively straight trajectories were considered to be projection axons. These axons contained no synaptic boutons and were longer than 200 μm. Large fibers coursing in tangential sections were presumed to reflect pathways between PMv and other cortical areas. Axonal patterns were specifically documented and selected for quantitative analysis of fiber trajectories at the rostrolateral border of M1 (polar histograms; see below). Small fibers consisting of darkly stained strands of small diameter with meandering trajectories and attached synaptic boutons were considered to be axonal arbors. Because these fibers represent end arbors of PMv cortical projections and thus provide redundant information to terminal plotting, they were specifically not used for quantitative analysis.
Finally, we documented the distribution of blood vessels in the three main areas of interest: PMv, M1, and S1. In tangential sections, blood vessels appeared as small holes, with distribution patterns nearly identical from section to section through the different depths of the cortex (Xiao and Felleman, 2004). In neuroanatomical reconstructions, the locations of selected blood vessels were indicated with a specific marker that was placed in the middle of the hole (Neurolucida; MicroBrightField). The blood vessels thus served as fiducial markers for alignment of reconstructed data from multiple sections and of the photograph of cortical surface blood vessels used for the coregistration of the physiological maps (see below).
Verification of injection core size. A critical factor to allow comparison of the pattern of PMv connections between cases was the precise identification of the size of the effective injection core. The effective size was estimated in each case using the section with the largest dense core, as identified using a dissecting microscope. Then, under higher magnification using a light microscope, the dense core was defined as the area around the center of the injection in which labeled cell bodies and terminals could not be easily differentiated. The dense core boundary was drawn on the slide reconstruction in Neurolucida (MicroBrightField) at the area of transition at which individual terminals, cell bodies, and fibers began to be identifiable (Fig. 1). Finally, the Neurolucida program was used to calculate the total area (Table 1).
Coregistration of section reconstructions and neurophysiological maps. In PMv, a coregistration technique was used to determine the BDA injection location with respect to the neurophysiological maps of distal forelimb movements. First, because the surface vasculature penetrates the cortical tissue in a radial manner (i.e., perpendicular to the surface), the penetration locations of large blood vessels could be used to align multiple sections through the entire depth of the cortical gray matter.
The coregistration of the neurophysiological map with the aligned sections was done in a second step by identifying the penetration locations of large vessels that were identifiable on the digital photograph of the cortex. These penetration locations could then be precisely matched with the locations of large blood vessels identified in tangential sections. To coregister the injection core location with the neurophysiological data, reconstruction of the BDA-stained section with the injection core outline and surrounding blood vessel pattern was superimposed on the pattern of large blood vessel penetrations indicated on the digital photographs of the brain surface used in the physiological mapping procedure. Once the pattern match was maximized, the precise location of the core in relation to the physiologically identified PMv hand representation was achieved (Fig. 1). This alignment procedure was performed separately for each local area (e.g., M1, PMv, S1, etc.), because alignment errors increase with increasing distance from the selected fiducial markers.
A similar approach was used for the localization of cell bodies, terminals, and fibers near the infarcted M1 hand representation and in S1. However, in S1, to further ensure the precision of the localization, myelin-stained sections were coregistered with the BDA reconstructions and neurophysiological maps (Gallyas, 1979; Krubitzer and Kaas, 1990a). Using the same strategy, large blood vessels were readily visible in sections stained for myelin and thus could be easily coregistered with the sections stained for BDA.
Quantification of BDA-labeled terminals and cell bodies. To quantify the difference in PMv corticocortical connections between experimental and control groups, for each functional area of the ipsilesional hemisphere, (1) the total number of voxels containing labeled terminals (or terminal voxels) and (2) the total number of cell bodies was tallied with the aid of a neuroanatomical analysis program (Neuroexplorer; MicroBrightField). To account for differences attributable to injection size, numbers of terminal voxels and cell bodies were transformed to percentages according to the following equation: Total L in area X/(Total L in hemisphere - Total L in PMv - Total L in M1 hand), where L is the number of terminal voxels or cell bodies, and X is the cortical area of interest. Note that total L in M1 hand in experimental cases equals 0. Thus, the numbers of terminal voxels and cell bodies were subtracted from the hemisphere totals in control animals for comparable comparisons between groups. Because the tissue near the injection core in PMv contained the greatest proportion of labeled terminal voxels and cell bodies, numbers in PMv were subtracted from the total to avoid minimizing the percentage label in other areas. The percentages of terminals and cell bodies in control and experimental cases were then compared for each cortical area using unpaired, two-tailed t tests.
Analysis of fiber orientation. To quantify evidence for rerouting of axons (i.e., large fibers) along the rostrolateral border of the M1 lesion, we examined fiber orientation in five to eight sections per case. For each section, we first aligned the center of the injection core and the middle of the cluster of BDA-labeled terminals in SMA along the vertical axis (SMA, 270°; injection core, 90°). SMA was chosen for reference because, in all cases, it consisted of a small, concise, and easily identifiable cluster of labeled cell bodies and terminals that were coextensive with the SMA hand representation. We then defined a 6.0 mm2 rectangular analysis window (1.2 × 5 mm) that was large enough to include the rostral boundaries of the lesion in the M1 hand area and the immediately adjacent intact tissue, a region in which injury-induced atypical trajectories were observed. The total size of the analysis window was selected so that it was substantially smaller than the terminal field of PMv axons within M1, as defined in control cases, i.e., approximately one-fourth of the rostrolateral M1 size). In control animals, to provide an equivalent location to that of the experimental cases, the analysis window was placed within the cluster of labeled terminals in the rostrolateral portion of M1, in the area corresponding to the edge of the hand representation.
Using a neuroanatomical analysis program (Neuroexplorer; MicroBrightField), each large BDA-labeled fiber within the analysis window was subdivided into a series of straight line segments (minimum length of ∼30 μm). Line segments were then separated into 10° bins according to directional orientation and then tallied and displayed in a polar histogram. For each case, the total fiber length within a given orientation bin was divided by the total number of sections examined. Finally, the average orientation vector for each group (control or experimental) was calculated from the composite histograms using trigonometric functions (extraction of θ from the sum of X and Y components of each vector of the 10° blocks of the histogram). A statistical analysis to test the difference in vector distribution between experimental and control groups was performed using a Watson-Williams F test (α = 0.05). This is a standard test to determine whether the mean angles of two independent circular observations differ significantly from each other (Batschelet, 1981).
Results
To briefly reiterate the experimental design, the ipsilateral corticocortical connections of PMv were analyzed in four adult squirrel monkeys at least 5 months after injury to the M1 forelimb area and compared with the connections in four control monkeys. PMv and M1 forelimb representations were defined using ICMS techniques. Then an ischemic infarct destroyed the M1 hand representation. After several months, BDA was placed in the center of the PMv hand representation. Postmortem analysis of BDA-labeled terminals, cell bodies, and large fibers was performed to compare labeling patterns in the two groups. Results consist of (1) neurophysiological mapping data delineating the hand representations of M1 and PMv, (2) neurophysiological and histochemical data delineating the hand representation of S1, (3) anatomical and physiological characterization of the BDA injection site, (4) analysis of BDA-labeled terminals and cell bodies, and (5) analysis of BDA-labeled fiber trajectories.
Neurophysiological mapping results
M1 and PMv forelimb representations were found in their typical locations (Frost et al., 2003). The M1 forelimb representation was located immediately rostral to the central sulcus (Donoghue et al., 1992; Nudo et al., 1992), whereas the PMv hand area was located ventral and rostral to M1.
Recordings of neural activity in S1 evoked by cutaneous stimulation of the hand verified that area 3b was arranged in a somatotopic manner, with receptive fields on digit 5 and the ulnar aspect of the hand located medially and those on digit 1 and the radial aspect of the hand located laterally. Progressing in a rostrocaudal direction, receptive fields were ordered from the distal to proximal phalanges, respectively. Caudal to the digit area, receptive fields were found on the palmar surface. In particular, the border between area 3b and 1/2 could be precisely identified by the reversal of somatotopic gradients (Kaas, 1993). The area 1/2 hand representation was also characterized by markedly larger receptive fields, as well as a higher percentage of multi-digit receptive fields compared with area 3b. In sections stained for myelin (Gallyas, 1979), area 3b appeared darker. Additionally, within 3b, the border between the hand and facial representation (hand/face septum) was clearly identifiable. As reported by other investigators (Jain et al., 1998), we found close correspondence between physiologically and histochemically identified borders (Fig. 4A). No statistical difference was observed for the size of the 3b hand representation between the control and experimental groups (defined by physiological mapping: meanexp = 8.9 ± 1.2 mm2; meancont = 10.2 ± 1.0 mm2; t = 1.414; p = 0.230, unpaired two-tailed t test; defined by myelin staining: meanexp = 11.1 ± 2.5 mm2; meancont = 11.6 ± 1.2 mm2 after correction for histological shrinkage; t = 0.367; p = 0.727).
Figure 4.

Relationship of atypical labeling in the parietal cortex with anatomical and physiological boundaries. Example of alignment of myelin-stained section with a somatosensory map. A, Myelin-stained section in experimental case 21B. The hand/face septum is indicated by a thick black line. The boundary between area 3b and area 1/2 is demarcated by a sharp transition from dense to light myelin staining (thin black line). Caudal border of the ischemic lesion in M1 is indicated by a white triangle. As in Figure 1, asterisks represent fiducial markers indicating the locations of selected large blood vessels observable in the same location throughout the depths of the cortical gray matter. CS, Central sulcus. Scale bar, 1 mm. B, Photograph of cortical surface vasculature in the same case (21B). Somatosensory mapping data are superimposed on the vascular pattern. In the collection of physiological data, microelectrode penetration sites (red, white, and yellow dots) are located with reference to the surface vasculature. Asterisks indicate the location of surface blood vessels at which they penetrate radially into the cortex. Locations correspond to those of large blood vessels identified in the myelin-stained sections. C, Alignment of blood vessel pattern in both anatomical and physiological datasets allowed confirmation of the border between areas 3b and 1/2. These data were then superimposed on the reconstructions of BDA labeling using the same approach. Gray rectangle indicates the location of higher-power photomicrographs shown in D. D, Left, Photomicrograph from area 1/2 in same experimental case (21B). Numerous BDA-labeled terminal arbors and fibers can be observed. Asterisk corresponds to largest asterisk in A. Gray box shows location of higher-magnification photomicrograph on the right. Scale bar, 100 μm. Right, Small fiber with varicosities (arrowheads). Scale bar, 1 μm. E, Photomicrograph of area 1/2 in a control case with a large injection (1934). Area 1/2 is virtually devoid of BDA labeling. Scale bar, 100 μm. F, Photomicrograph of the area 1/2 of an experimental case with a large injection (9406). Here, in addition to the numerous terminal arbors and fibers, a labeled somata can be seen. Scale bar, 10 μm.
As reported previously, after the ischemic lesion destroying the M1 hand representation, recovery of motor deficits occurred gradually during the postinfarct period, especially during the first month. However, at the time of the anatomical experiments (at least 5 months after infarct), residual deficits in fine motor skill remained. Enlargement of the PMv hand representation was observed after 3 months of recovery (Frost et al., 2003).
Location and size of BDA injection
The location and extent of the BDA injection core was determined in each case with respect to the PMv hand representation. Then, the neurophysiological map of PMv was coregistered with the BDA dense core using vascular landmarks as registration markers. In general, we produced two experimental cases with small injections (21B and 1662) and two with relatively larger injections (367E and 9406). Injection sizes in experimental and control cases were comparable (meancont = 4.11 mm2; meanexp = 3.89 mm2; t = 0.12; p = 0.91). Also, injections classified as “large” used injection volumes comparable with those used in other contemporary studies of cortical connectivity in New World primates (Boyd et al., 2000). Most importantly, the location of the injection core in relation to the PMv hand representation was precisely identified. Locations and sizes of the injection cores are documented in Figure 1 and Table 1. Overall, 1662 contained the smallest injection and was smaller than any of the injections performed in control cases. In three of four experimental cases and four of four control cases, the core was smaller than, and fully located within, the defined PMv forelimb area, primarily within the hand area. In the case containing the largest injection (367E), the dense core spread somewhat beyond the physiologically defined area. However, this case displayed a pattern of connections that was similar to the other experimental cases and thus was retained for additional analysis.
Quantitative comparison of BDA labeling in control versus experimental animals
In general, the cortical distribution of BDA-labeled terminals and cell bodies in experimental cases was similar to that reported previously in naive, or control, squirrel monkeys (Fig. 2). In both frontal and parietal areas, intensely labeled cell bodies typically were distributed among labeled dendrites, axons, and terminal boutons, supporting the reciprocity of intracortical connections.
In each of the experimental cases, but none of the control cases, a very large number of labeled terminals was observed in S1 (Fig. 3). Labeled cell bodies were also observed in S1 in three of four experimental cases (all except case 1662, the case with the smallest BDA injection). On the basis of coregistration of BDA labeling with myelin stains, the labeled terminals and cell bodies were located immediately caudal to area 3b in regions corresponding to the area 1/2 hand representation. The unusual localization of the terminals and cell bodies in area 1/2 was reconfirmed in three cases in which somatosensory representations were determined using neurophysiological recording techniques in S1 (367E, 9406, and 21B) (Figs. 4, 5).
Figure 5.

Coregistration of terminal labeling with neurophysiological maps of hand representations in S1. Left, Typical pattern of terminal labeling observed in parietal areas of control cases (case 1934; large injection). Middle and Right, Pattern of terminal labeling in two experimental cases (21B and 367E, respectively). Outlines of area 3b functional representations of digits and palm are shown. Arrowheads indicate the caudal border of the posterior operculum/inferior parietal cortex (black) and hand/face septum (gray), respectively. Black downward arrows point to the area 1/2 hand representation. Dotted line indicates the approximate location of the lateral fissure. Scale bar, 1 mm.
Each of the regions with labeled terminals and/or cell bodies was examined for quantitative differences between experimental and control groups. To normalize differences in total labeling across cases, the numbers of terminal voxels and cell bodies were expressed as a percentage of total terminal voxels or cell bodies in each case, exclusive of labeling in PMv and M1 hand representations. No area outside of S1 showed a statistically significant difference between groups (Fig. 6). Details of the distribution of S1 labeling are shown in Figure 7. In experimental cases, labeled terminals and cell bodies were many times greater in area 1/2 compared with control cases (terminals: meanexp = 6.3 ± 1.8%; meancont = 0.5 ± 0.8%; t = 6.53; p = 0.0006; cell bodies: meanexp = 12.0 ± 6.8%; meancont = 0.71 ± 0.63%; t = 4.49; p = 0.0042; unpaired two-tailed t tests; n = 4 per group).
Figure 6.
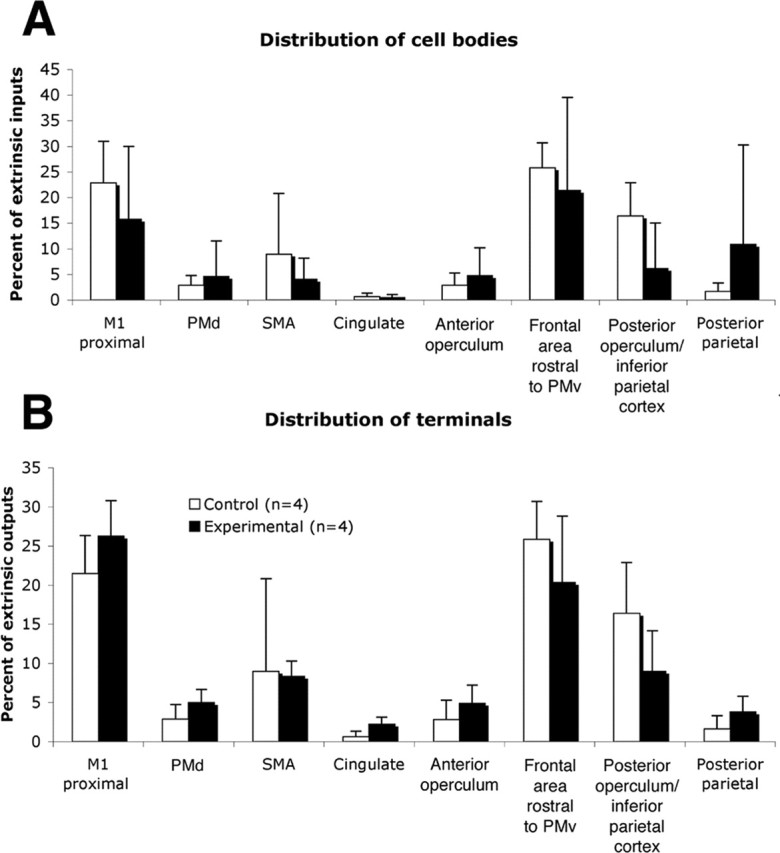
Distribution of labeling in the ipsilateral hemisphere. A, Cell body distribution (excluding S1) in experimental group compared with control group. B, Distribution of terminal labeling (excluding S1) in experimental group compared with control group. Proportions of extrinsic PMv inputs and outputs are shown.
Figure 7.
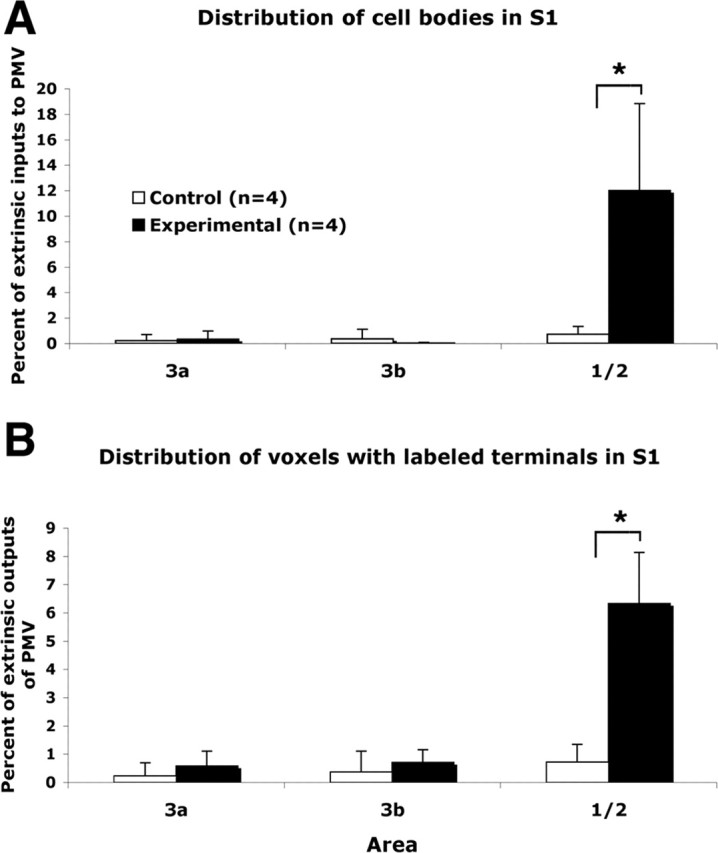
Distribution of labeled cell bodies and terminals in S1. Distribution of labeled cell bodies and (voxels with labeled) terminals in areas 3a, 3b, and 1/2 of control and experimental cases. Proportions of extrinsic PMv inputs and outputs are shown. *p < 0.05, statistically significant differences.
Fiber orientation at the site of M1 lesion
Because histological sections were cut tangential to the cortical surface, in every case, large, BDA-labeled fibers, presumed to be intracortical axons, continued for several hundreds of micrometers, and sometimes a few millimeters, in the same section, allowing qualitative and quantitative examination of their orientations and trajectories. In experimental cases, axonal orientations were atypical at the rostral border of the M1 lesion, revealing abrupt changes in trajectory and altered orientation patterns compared with control animals (Fig. 8). In some instances, axons initially coursed toward the injured M1 cortex, altered course by ∼90° near the border of the injury (Fig. 8B), and then followed the lateral border of the injury, often for >1 mm. The majority of these axons assumed a caudolateral orientation, i.e., in the direction of the somatosensory hand representations in parietal cortex. In control cases, axons with this particular caudal and lateral orientation were rarely seen (Fig. 8B). An example of a more complete reconstruction of fiber trajectories (9406) shows axons that appear to course along the border of the M1 lesion, turn more ventral, and subsequently more caudomedial (Fig. 8C).
Figure 8.

Abrupt changes in fiber trajectory at the site of lesion. In each of the four experimental cases, abrupt changes in fiber trajectory were observed at the rostral border of the lesion in M1. A, Diagram indicating the locations of the photomicrographs and reconstructions. B, Photomicrographs of BDA-labeled fibers at the rostral border of the M1 lesion in experimental cases 1662 (top) and 9406 (middle) showing fibers that abruptly changed trajectory by 90° or more (black arrowheads). A photomicrograph taken at a corresponding location in a control case 9409 (bottom) is shown for comparison. Note that the large-diameter fibers coursing over long distances are less abundant in the control case and most of the labeling consisted of small terminal arbors. Also note that the orientation of fibers is more variable. Scale bar, 500 μm. C, Reconstruction of small BDA-labeled fibers in experimental case (9406; 1 section). Fibers appear to loop around area 3b to terminate in area 1/2 of S1. Scale bar, 1 mm. CS, Central sulcus.
To quantify differences in fiber trajectories between experimental and control groups, polar histograms describing the orientation of axons at the rostral border of the lesion (Fig. 9) were compared with those from a homotopic location in control cases. This analysis revealed a substantial change in orientation of PMv axons (Fig. 10). In control cases, the orientation of fibers was rather unfocused, with a mean vector reflecting the position of M1 relative to PMv (mean, 202° or caudomedial; n = 3). In the experimental cases, this relatively diffuse orientation became much more focused with a mean vector that did not reflect the position of M1 relative to PMv (mean, 173° or caudolateral; n = 4). A Watson-Williams F test confirmed that the fiber orientations were significantly different between groups (F = 15.65; p < 0.0001).
Figure 9.

Quantitative analysis of fiber trajectories. A, Reconstruction of sections in control case 9409 (small injection). Hand representations of M1 and PMv are outlined. Locations of labeled terminals are shown as blue dots. For quantitative analysis, each section was aligned vertically, using a line drawn between the middle of the injection site and the cluster of BDA labeling found in SMA. A rectangular analysis window of constant dimensions and orientation was then positioned at the rostral border of the M1 hand representation, within the zone of termination. Orientations of every axonal segment within the analysis window were plotted and analyzed for each section of each case. Scale bar, 5 mm. B, Top, Reconstruction of large fibers in control case 9409 (4 sections superposed). In general, axons were relatively short and had scattered orientations. Rectangle indicates 1.2 × 5.0 mm analysis window. Bottom, Reconstruction of large fibers at the border of the lesion in experimental case 9406 (2 sections superposed). In each case in the experimental group, many axons coursed along the rostral border of the M1 lesion for several millimeters. Small gray rectangle indicates the location of a sample axonal segment that is enlarged and displayed on a polar plot in the inner panel. The beginning of the segment is indicated by 1 and the end by 2. This particular axon segment had an orientation of 163°. In the quantitative analysis, orientations were grouped into 10° bins. Thus, this axon segment was tallied in the 160-170° bin (also see Fig. 10 and Materials and Methods). Scale bar, 1 mm.
Figure 10.

Alteration of axonal orientation at the border of M1 lesion. A, Polar histogram illustrating the distribution of large fiber (axonal) orientations at the rostral border of the M1 lesion. For additional details regarding methodology, see Figure 9 and Materials and Methods. Note that control group excludes case 3024 for this analysis (n = 3) because the M1 hand representation was somewhat distorted in this case. After the M1 injury, fiber orientation was more focused and was directed in a more caudolateral direction. B, Diagram illustrating the presumed alterations in PMv intracortical connections after M1 injury. After PMv targets in M1 are destroyed, PMv intracortical fibers are thought to seek new targets; axons abruptly change orientation near the lesion border and begin to course more caudolaterally, sweep around area 3b, and finally terminate in area 1/2.
Discussion
These results provide evidence for proliferation of novel, injury-induced corticocortical connections between PMv and area 1/2 of S1 after an infarct in M1. These morphological alterations are accompanied by functional recovery and expansion of the PMv hand representation (Frost et al., 2003). Furthermore, we provide evidence for altered trajectories of axons originating in PMv. Thus, we hypothesize that, when a principal cortical target of PMv axons is destroyed, intracortical axons seek new targets in surviving, intact tissue.
Although the alteration in terminal labeling is clear, the validity of increased cell body labeling in S1 might be questioned. Because BDA (10,000 MW) is a reliable anterograde but less reliable retrograde tracing agent, the intensity of labeled cells varied considerably across animals. Nevertheless, the close correspondence of the location of labeled terminals and cell bodies provided assurance of the validity of the results. Comparisons with control animals showed significant increases in the number of cell bodies labeled after M1 infarct, paralleling the results described for terminal boutons.
The drastic change in labeled terminals and cell bodies we found in area 1/2 of S1 cannot easily be attributed to differences in injection size, injection location, efficacy of absorption or transport of the label, size of the animal, or histological processing differences. The reproducibility of the novel connections in all experimental animals, the similarity in the pattern of connections at all other ipsilateral locations in both experimental and control animals, and the similarity to the projection pattern reported in other tract-tracing studies (Barbas and Pandya, 1987; Ghosh and Gattera, 1995) are strong arguments against the possibility that these differences merely reflect normal intersubject variability.
Implications of novel connections with S1 in recovery after M1 injury
The present data implicate a potential role of S1 in the recovery from an infarct in M1. The M1 hand area is known to receive projections from parietal cortex, primarily from areas 1, 2, 5, and 7 (Stepniewska et al., 1993). Not surprisingly, somatosensory impairments after damage to M1 in nonhuman primates have been reported, and sensory recovery seems to parallel motor recovery (Friel et al., 2005). Furthermore, field potential recordings from S1 have revealed an enhancement of its premovement activity after temporary local cooling of M1 during repeated execution of visually initiated hand movements (Sasaki and Gemba, 1984). Finally, results from functional magnetic resonance imaging studies have suggested a role for S1 in motor recovery from stroke (Pineiro et al., 2001; Jang et al., 2002). In the case of a large infarct of the M1 hand area, because corticocortical targets for neurons in both the premotor and somatosensory cortex are damaged, it is reasonable to expect that neurons in both locations would undergo adaptive changes.
These are not the first results of widespread reorganization involving S1. Pons et al. (1991) found that, 12 years after experimental injury to peripheral nerves innervating the upper extremity in macaque monkeys, the face representation in areas 3b and 1 had expanded over a distance of 10-14 mm. Because the arborization of thalamocortical fibers in area 3b is ∼1-2 mm (Garraghty et al., 1989), unmasking of inputs from diverging thalamocortical axons may explain the limited topographic changes that occur within the first several minutes after deafferentation (Cusick, 1996; Barbay et al., 2002) but not the more widespread changes in long-standing peripheral injuries. Growth of primary afferents into deafferented regions at the level of the spinal cord and brainstem might account for additional but not all expansion (Pons et al., 1991; Florence et al., 1998). However, after long-term deafferentation, Florence et al. (1998) found that, although thalamocortical connectivity remained relatively unchanged, corticocortical connections in areas 3b and 1 extended 4-5 mm beyond that seen in control animals. It would appear that, at least in long-standing peripheral nerve injuries, anatomical reorganization occurs at multiple levels of the neuraxis. The present results provide strong evidence that widespread corticocortical sprouting is a significant phenomenon accompanying functional reorganization after cortical injury as well.
Stability of corticocortical connections of PMv with other motor areas after M1 injury
The absence of significant changes in connectivity of PMv with various other cortical areas, especially other motor areas such as SMA, PMd, cingulated motor area, and the surviving M1 tissue adjacent to the infarct, is also of considerable interest. Each of these areas has corticospinal projections at least to lower cervical levels (Martino and Strick, 1987; Dum and Strick, 1991; He et al., 1993; Galea and Darian-Smith, 1994), and electrical stimulation of each of these areas results in movement of musculature of the upper extremity. In particular, contrary to our original hypothesis, there was no difference between experimental and control groups in the proportion of terminals or cell bodies in the proximal representations adjacent to the injury in M1. Previous studies in rodent models have demonstrated synaptogenesis in the peri-infarct tissue (Stroemer et al., 1995).
Because PMv shares prominent cortical connections with M1 and because PMv is known to exert powerful facilitation of M1 output (Shimazu et al., 2004), it is possible that this phenomenon might be unique to PMv. However, the validity of negative results in other areas must be considered in light of limitations in the quantitative methods used here. The difference in labeling between experimental and control groups in area 1/2 was so large that statistical analysis was somewhat superfluous. Few, if any, connections existed in uninjured animals. However, more subtle differences may require more sensitive approaches to uncover. Quantitative changes may have occurred in areas of particularly dense termination but were undetected because of the sampling method (voxel counts). A more accurate estimate of terminals might be obtained using unbiased stereological approaches and an alternative scheme for sampling sections than that used here. In addition, because cell body labeling is not optimal using BDA (10,000 MW), it is possible that these numbers are not reliable enough to demonstrate statistical differences.
Alteration of axonal trajectory at the lesion border
Our data reveal significant alterations in the orientation of PMv axons at the rostral border of the infarct. Physiological (Nudo et al., 1996) and anatomical (Carmichael et al., 2001) reorganization of the cortex surrounding a cortical lesion has been documented previously. More recently, it has been shown that stroke induces sequential waves of neuronal growth-promoting genes (Carmichael et al., 2005) that could support anatomical reorganization. Our results suggest that this favorable environment can also be exploited by distant areas. Considering that any cortical and/or subcortical areas sharing connections with the site of a neuronal injury might undergo similar reorganization, these results reveal an unanticipated extraordinary anatomical rewiring capacity in the adult CNS after injury.
The precise location in which PMv axons branch to form novel S1 connections can only be inferred indirectly from the present set of data. Based on changes in axonal trajectories documented here, it seems logical to suggest that axons originating in PMv that normally terminate in the destroyed M1 hand area sprout new processes near the borders of the infarct. This would potentially implicate axonal sprouting over distances of 6-12 mm, from frontal to parietal cortex, a distance that is substantially longer than observed in any other studies of intracortical axonal sprouting in adult cortex (Darian-Smith and Gilbert, 1994; Florence et al., 1998). This is an especially long distance when considered in proportion to the relatively small size of the squirrel monkey brain (squirrel monkey, brain weight, 20 g; body weight, 750 g) (Emmersand and Akert, 1963) compared with macaque brains in previous studies (e.g., rhesus macaque, brain weight, 54 g; body weight, 3300 g) (Nudo and Masterton, 1990).
However, we cannot rule out that novel terminals may originate from a different subset of corticocortical fibers. For example, it is possible that the existing intracortical pathway from PMv to the posterior operculum/inferior parietal area may provide a source of new terminals in S1, although no evidence for branching from these fibers was found. Alternatively, and perhaps least likely because of the distances involved, new axonal processes may originate in close proximity to the PMv cell bodies. Finally, the few preexisting terminals that normally exist in S1 may sprout to form multiple terminals locally. This process would only involve local increases in synaptic proliferation and axonal sprouting limited to very short distances. In light of our results, none of these possibilities can be ruled out, and this specific aspect of the rewiring process should await subsequent studies.
Although any hypothesis regarding the causative role of these phenomena in functional recovery is preliminary, this novel finding of significant increase of PMv connections with area 1/2 of S1 should be considered as a potential compensatory mechanism through which the CNS accomplishes functional recovery after a central injury. The support for major neuroanatomical plasticity associated with recovery from a cerebral vascular infarct enlarges the spectrum of known mechanisms of reorganization after a stroke. Understanding of the phenomena implicated in the reorganization of the CNS after a central lesion are essential to development of post-stroke interventions that seek to maximize functional recovery.
Footnotes
N.D. is supported by a fellowship from the Canadian Institutes of Health Research. R.J.N. is supported by National Institutes of Health (NIH)-National Institute of Neurological Disorders and Stroke Grant NS30853, NIH-National Institute on Deafness and Other Communication Disorders Grant HD02528, and a Bugher Award from the American Heart Association. We thank Dr. Jon Kaas for commenting on myelin-stained sections for case 1662 and Katherine A. Brennan and Kelsey D. Needham for help in the production of anatomical data.
Correspondence should be addressed to Dr. Numa Dancause, Department of Molecular and Integrative Physiology, University of Kansas Medical Center, 3901 Rainbow Boulevard, Kansas City, KS 66160. E-mail: ndancause@kumc.edu.
Copyright © 2005 Society for Neuroscience 0270-6474/05/2510167-13$15.00/0
References
- Barbas H, Pandya DN (1987) Architecture and frontal cortical connections of the premotor cortex (area 6) in the rhesus monkey. J Comp Neurol 256: 211-228. [DOI] [PubMed] [Google Scholar]
- Barbay S, Peden EK, Falchook G, Nudo RJ (1999) Sensitivity of neurons in somatosensory cortex (S1) to cutaneous stimulation of the hindlimb immediately following a sciatic nerve crush. Somatosens Mot Res 16: 103-114. [DOI] [PubMed] [Google Scholar]
- Barbay S, Peden EK, Falchook G, Nudo RJ (2002) An index of topographic normality in rat somatosensory cortex: application to a sciatic nerve crush model. J Neurophysiol 88: 1339-1351. [DOI] [PubMed] [Google Scholar]
- Batschelet E (1981) Circular statistics in biology. London: Academic.
- Boyd JD, Mavity-Hudson JA, Casagrande VA (2000) The connections of layer 4 subdivisions in the primary visual cortex (V1) of the owl monkey. Cereb Cortex 10: 644-662. [DOI] [PubMed] [Google Scholar]
- Bucy PC (1944) The precentral motor cortex. Urbana, IL: Bucy.
- Carmichael ST, Wei L, Rovainen CM, Woolsey TA (2001) New patterns of intracortical projections after focal cortical stroke. Neurobiol Dis 8: 910-922. [DOI] [PubMed] [Google Scholar]
- Carmichael ST, Archibeque I, Luke L, Nolan T, Momiy J, Li S (2005) Growth-associated gene expression after stroke: evidence for a growth-promoting region in peri-infarct cortex. Exp Neurol 193: 291-311. [DOI] [PubMed] [Google Scholar]
- Chollet F, DiPiero V, Wise RJ, Brooks DJ, Dolan RJ, Frackowiak RS (1991) The functional anatomy of motor recovery after stroke in humans: a study with positron emission tomography. Ann Neurol 29: 63-71. [DOI] [PubMed] [Google Scholar]
- Cusick CG (1996) Extensive cortical reorganization following sciatic nerve injury in adult rats versus restricted reorganization after neonatal injury: implications for spatial and temporal limits on somatosensory plasticity. Prog Brain Res 108: 379-390. [DOI] [PubMed] [Google Scholar]
- Dancause N, Barbay S, Frost SB, Plautz EJ, Stowe AM, Friel KM, Nudo RJ (2005) Ipsilateral connections of the ventral premotor cortex in a New World primate. J Comp Neurol, in press. [DOI] [PMC free article] [PubMed]
- Darian-Smith C, Gilbert CD (1994) Axonal sprouting accompanies functional reorganization in adult cat striate cortex. Nature 368: 737-740. [DOI] [PubMed] [Google Scholar]
- Dolleman-Van der Weel MJ, Wouterlood FG, Witter MP (1994) Multiple anterograde tracing, combining Phaseolus vulgaris leucoagglutinin with rhodamine- and biotin-conjugated dextran amine. J Neurosci Methods 51: 9-21. [DOI] [PubMed] [Google Scholar]
- Donoghue JP, Leibovic S, Sanes JN (1992) Organization of the forelimb area in squirrel monkey motor cortex: representation of digit, wrist, and elbow muscles. Exp Brain Res 89: 1-19. [DOI] [PubMed] [Google Scholar]
- Dum RP, Strick PL (1991) The origin of corticospinal projections from the premotor areas in the frontal lobe. J Neurosci 11: 667-689. [DOI] [PMC free article] [PubMed] [Google Scholar]
- Dum RP, Strick PL (2005) Frontal lobe inputs to the digit representations of the motor areas on the lateral surface of the hemisphere. J Neurosci 25: 1375-1386. [DOI] [PMC free article] [PubMed] [Google Scholar]
- Duncan PW, Lai SM (1997) Stroke recovery. Top Stroke Rehabil 4: 51-58. [Google Scholar]
- Emmersand R, Akert K (1963) A stereotaxic atlas of the brain of the squirrel monkey (Saimir Sciureus). Madison, WI: University of Wisconsin.
- Florence SL, Taub HB, Kaas JH (1998) Large-scale sprouting of cortical connections after peripheral injury in adult macaque monkeys. Science 282: 1117-1121. [DOI] [PubMed] [Google Scholar]
- Friel KM, Barbay S, Frost SB, Plautz EJ, Hutchinson DM, Stowe AM, Dancause N, Zoubina EV, Quaney BM, Nudo RJ (2005) Dissociation of the sensorimotor deficits after rostral vs. caudal lesions in the primary motor cortex hand representation. J Neurophysiol 94: 1312-1324. [DOI] [PubMed] [Google Scholar]
- Frost SB, Barbay S, Friel KM, Plautz EJ, Nudo RJ (2003) Reorganization of remote cortical regions after ischemic brain injury: a potential substrate for stroke recovery. J Neurophysiol 89: 3205-3214. [DOI] [PubMed] [Google Scholar]
- Galea MP, Darian-Smith I (1994) Multiple corticospinal neuron populations in the macaque monkey are specified by their unique cortical origins, spinal terminations, and connections. Cereb Cortex 4: 166-194. [DOI] [PubMed] [Google Scholar]
- Gallyas F (1979) Silver staining of myelin by means of physical development. Neurol Res 1: 203-209. [DOI] [PubMed] [Google Scholar]
- Garraghty PE, Pons TP, Sur M, Kaas JH (1989) The arbors of axons terminating in middle cortical layers of somatosensory area 3b in owl monkeys. Somatosens Mot Res 6: 401-411. [DOI] [PubMed] [Google Scholar]
- Ghosh S, Gattera R (1995) A comparison of the ipsilateral cortical projections to the dorsal and ventral subdivisions of the macaque premotor cortex. Somatosens Mot Res 12: 359-378. [DOI] [PubMed] [Google Scholar]
- Glees P (1961) Experimental neurology. Oxford: Clarendon.
- Gould III HJ, Kaas JH (1981) The distribution of commissural terminations in somatosensory areas I and II of the grey squirrel. J Comp Neurol 196: 489-504. [DOI] [PubMed] [Google Scholar]
- Gould III HJ, Cusick CG, Pons TP, Kaas JH (1986) The relationship of corpus callosum connections to electrical stimulation maps of motor, supplementary motor, and the frontal eye fields in owl monkeys. J Comp Neurol 247: 297-325. [DOI] [PubMed] [Google Scholar]
- Guldin WO, Akbarian S, Grusser OJ (1992) Cortico-cortical connections and cytoarchitectonics of the primate vestibular cortex: a study in squirrel monkeys (Saimiri sciureus). J Comp Neurol 326: 375-401. [DOI] [PubMed] [Google Scholar]
- He SQ, Dum RP, Strick PL (1993) Topographic organization of corticospinal projections from the frontal lobe: motor areas on the lateral surface of the hemisphere. J Neurosci 13: 952-980. [DOI] [PMC free article] [PubMed] [Google Scholar]
- Hoffman DS, Strick PL (1995) Effects of a primary motor cortex lesion on step-tracking movements of the wrist. J Neurophysiol 73: 891-895. [DOI] [PubMed] [Google Scholar]
- Jain N, Catania KC, Kaas JH (1998) A histologically visible representation of the fingers and palm in primate area 3b and its immutability following long-term deafferentations. Cereb Cortex 8: 227-236. [DOI] [PubMed] [Google Scholar]
- Jang SH, Han BS, Chang Y, Byun WM, Lee J, Ahn SH (2002) Functional MRI evidence for motor cortex reorganization adjacent to a lesion in a primary motor cortex. Am J Phys Med Rehabil 81: 844-847. [DOI] [PubMed] [Google Scholar]
- Kaas JH (1993) The functional organization of somatosensory cortex in primates. Anat Anz 175: 509-518. [DOI] [PubMed] [Google Scholar]
- Krubitzer LA, Kaas JH (1990a) The organization and connections of somatosensory cortex in marmosets. J Neurosci 10: 952-974. [DOI] [PMC free article] [PubMed] [Google Scholar]
- Krubitzer LA, Kaas JH (1990b) Cortical connections of MT in four species of primates: areal, modular, and retinotopic patterns. Vis Neurosci 5: 165-204. [DOI] [PubMed] [Google Scholar]
- Krubitzer LA, Kaas JH (1992) The somatosensory thalamus of monkeys: cortical connections and a redefinition of nuclei in marmosets. J Comp Neurol 319: 123-140. [DOI] [PubMed] [Google Scholar]
- Lee RG, van Donkelaar P (1995) Mechanisms underlying functional recovery following stroke. Can J Neurol Sci 22: 257-263. [DOI] [PubMed] [Google Scholar]
- Liu Y, Rouiller EM (1999) Mechanisms of recovery of dexterity following unilateral lesion of the sensorimotor cortex in adult monkeys. Exp Brain Res 128: 149-159. [DOI] [PubMed] [Google Scholar]
- Martino AM, Strick PL (1987) Corticospinal projections originate from the arcuate premotor area. Brain Res 404: 307-312. [DOI] [PubMed] [Google Scholar]
- Miyai I, Suzuki T, Kang J, Kubota K, Volpe BT (1999) Middle cerebral artery stroke that includes the premotor cortex reduces mobility outcome. Stroke 30: 1380-1383. [DOI] [PubMed] [Google Scholar]
- Miyai I, Yagura H, Oda I, Konishi I, Eda H, Suzuki T, Kubota K (2002) Premotor cortex is involved in restoration of gait in stroke. Ann Neurol 52: 188-194. [DOI] [PubMed] [Google Scholar]
- Muntner P, Garrett E, Klag MJ, Coresh J (2002) Trends in stroke prevalence between 1973 and 1991 in the US population 25 to 74 years of age. Stroke 33: 1209-1213. [DOI] [PubMed] [Google Scholar]
- Napieralski JA, Butler AK, Chesselet MF (1996) Anatomical and functional evidence for lesion-specific sprouting of corticostriatal input in the adult rat. J Comp Neurol 373: 484-497. [DOI] [PubMed] [Google Scholar]
- Nudo RJ (1997) Remodeling of cortical motor representations after stroke: implications for recovery from brain damage. Mol Psychiatry 2: 188-191. [DOI] [PubMed] [Google Scholar]
- Nudo RJ (1999) Recovery after damage to motor cortical areas. Curr Opin Neurobiol 9: 740-747. [DOI] [PubMed] [Google Scholar]
- Nudo RJ, Masterton RB (1990) Descending pathways to the spinal cord. III. Sites of origin of the corticospinal tract. J Comp Neurol 296: 559-583. [DOI] [PubMed] [Google Scholar]
- Nudo RJ, Jenkins WM, Merzenich MM, Prejean T, Grenda R (1992) Neurophysiological correlates of hand preference in primary motor cortex of adult squirrel monkeys. J Neurosci 12: 2918-2947. [DOI] [PMC free article] [PubMed] [Google Scholar]
- Nudo RJ, Wise BM, SiFuentes F, Milliken GW (1996) Neural substrates for the effects of rehabilitative training on motor recovery after ischemic infarct. Science 272: 1791-1794. [DOI] [PubMed] [Google Scholar]
- Nudo RJ, Larson D, Plautz EJ, Friel KM, Barbay S, Frost SB (2003) A squirrel monkey model of poststroke motor recovery. ILAR J 44: 161-174. [DOI] [PubMed] [Google Scholar]
- Olsen TS (1990) Arm and leg paresis as outcome predictors in stroke rehabilitation. Stroke 21: 247-251. [DOI] [PubMed] [Google Scholar]
- Passingham RE, Perry VH, Wilkinson F (1983) The long-term effects of removal of sensorimotor cortex in infant and adult rhesus monkeys. Brain 106: 675-705. [DOI] [PubMed] [Google Scholar]
- Pearson PP, Arnold PB, Oladehin A, Li CX, Waters RS (2001) Large-scale cortical reorganization following forelimb deafferentation in rat does not involve plasticity of intracortical connections. Exp Brain Res 138: 8-25. [DOI] [PubMed] [Google Scholar]
- Pineiro R, Pendlebury S, Johansen-Berg H, Matthews PM (2001) Functional MRI detects posterior shifts in primary sensorimotor cortex activation after stroke: evidence of local adaptive reorganization? Stroke 32: 1134-1139. [DOI] [PubMed] [Google Scholar]
- Pons TP, Garraghty PE, Ommaya AK, Kaas JH, Taub E, Mishkin M (1991) Massive cortical reorganization after sensory deafferentation in adult macaques. Science 252: 1857-1860. [DOI] [PubMed] [Google Scholar]
- Preuss TM, Goldman-Rakic PS (1989) Connections of the ventral granular frontal cortex of macaques with perisylvian premotor and somatosensory areas: anatomical evidence for somatic representation in primate frontal association cortex. J Comp Neurol 282: 293-316. [DOI] [PubMed] [Google Scholar]
- Qi HX, Kaas JH (2004) Myelin stains reveal an anatomical framework for the representation of the digits in somatosensory area 3b of macaque monkeys. J Comp Neurol 477: 172-187. [DOI] [PubMed] [Google Scholar]
- Sasaki K, Gemba H (1984) Compensatory motor function of the somatosensory cortex for the motor cortex temporarily impaired by cooling in the monkey. Exp Brain Res 55: 60-68. [DOI] [PubMed] [Google Scholar]
- Shimazu H, Maier MA, Cerri G, Kirkwood PA, Lemon RN (2004) Macaque ventral premotor cortex exerts powerful facilitation of motor cortex outputs to upper limb motoneurons. J Neurosci 24: 1200-1211. [DOI] [PMC free article] [PubMed] [Google Scholar]
- Snow PJ, Nudo RJ, Rivers W, Jenkins WM, Merzenich MM (1988) Somatotopically inappropriate projections from thalamocortical neurons to the SI cortex of the cat demonstrated by the use of intracortical microstimulation. Somatosens Res 5: 349-372. [DOI] [PubMed] [Google Scholar]
- Stepniewska I, Preuss TM, Kaas JH (1993) Architectonics, somatotopic organization, and ipsilateral cortical connections of the primary motor area (M1) of owl monkeys. J Comp Neurol 330: 238-271. [DOI] [PubMed] [Google Scholar]
- Strick PL, Preston JB (1982) Two representations of the hand in area 4 of a primate. I. Motor output organization. J Neurophysiol 48: 139-149. [DOI] [PubMed] [Google Scholar]
- Stroemer RP, Kent TA, Hulsebosch CE (1995) Neocortical neural sprouting, synaptogenesis, and behavioral recovery after neocortical infarction in rats. Stroke 26: 2135-2144. [DOI] [PubMed] [Google Scholar]
- Witte OW, Stoll G (1997) Delayed and remote effects of focal cortical infarctions: secondary damage and reactive plasticity. Adv Neurol 73: 207-227. [PubMed] [Google Scholar]
- Xiao Y, Felleman DJ (2004) Projections from primary visual cortex to cytochrome oxidase thin stripes and interstripes of macaque visual area 2. Proc Natl Acad Sci USA 101: 7147-7151. [DOI] [PMC free article] [PubMed] [Google Scholar]