

Abstract
Multiple system atrophy (MSA) is a progressive, neurodegenerative disease characterized by parkinsonism, ataxia, autonomic dysfunction, and accumulation of α-synuclein (α-syn) in oligodendrocytes. To better understand the mechanisms of neurodegeneration and the role of α-syn accumulation in oligodendrocytes in the pathogenesis of MSA, we generated transgenic mouse lines expressing human (h) α-syn under the control of the murine myelin basic protein promoter. Transgenic mice expressing high levels of hα-syn displayed severe neurological alterations and died prematurely at 6 months of age. Furthermore, mice developed progressive accumulation of hα-syn-immunoreactive inclusions in oligodendrocytes along the axonal tracts in the brainstem, basal ganglia, cerebellum, corpus callosum, and neocortex. The inclusions also reacted with antibodies against phospho-serine (129) hα-syn and ubiquitin, and hα-syn was found in the detergent-insoluble fraction. In high-expresser lines, the white matter tracts displayed intense astrogliosis, myelin pallor, and decreased neurofilament immunostaining. Accumulation of hα-syn in oligodendrocytes also leads to prominent neurodegenerative changes in the neocortex with decreased dendritic density and to loss of dopaminergic fibers in the basal ganglia. The oligodendrocytic inclusions were composed of fibrils and accompanied by mitochondrial alterations and disruption of the myelin lamina in the axons. Together, these studies support the contention that accumulation of α-syn in oligodendrocytes promotes neurodegeneration and recapitulates several of the key functional and neuropathological features of MSA.
Keywords: α-synuclein, Lewy body disease, multiple system atrophy (MSA), transgenic, myelin basic protein (MBP) promoter, oxidative stress
Introduction
α-Synuclein (α-syn), a 140 amino acid synaptic molecule, was identified originally in human brain as the precursor of the nonamyloid β-protein component of Alzheimer's disease (AD) amyloid (Ueda et al., 1993; Trojanowski et al., 1998; Hashimoto and Masliah, 1999; Iwai, 2000), which might be involved in the pathogenesis of diverse neurodegenerative disorders with parkinsonism. α-syn is capable of self-aggregating to form both potentially neurotoxic oligomers and fibrillar polymers with amyloid-like characteristics (Hashimoto et al., 1998; Lansbury, 1999). In Lewy body disease, a common cause of dementia and parkinsonism in the elderly, neuronal accumulation of α-syn has been proposed to be involved, because this molecule is the most abundant component of Lewy bodies (Spillantini et al., 1997; Wakabayashi et al., 1997; Takeda et al., 1998), and mutations in the α-syn gene (A30P, A53T, and E46K) and α-syn gene multiplication, which are associated with rare familial forms of parkinsonism (Polymeropoulos et al., 1997; Kruger et al., 1998; Singleton et al., 2003; Zarranz et al., 2004), and expression in transgenic (tg) mice (Masliah et al., 2000; van der Putten et al., 2000; Giasson et al., 2002; Lee et al., 2002) and Drosophila (Feany and Bender, 2000) mimic several aspects of this disorder.
α-syn might also be involved in the pathogenesis of other neurodegenerative disorders including AD (Ueda et al., 1993; Masliah et al., 1996), neurodegeneration with brain iron accumulation type 1 (Galvin et al., 2000), and multiple system atrophy (MSA) (Spillantini et al., 1998; Wakabayashi et al., 1998a). MSA is a sporadic, progressive neurological disorder characterized by parkinsonism, cerebellar dysfunction, autonomic impairment and pyramidal signs (Graham and Oppenheimer, 1969; Gilman et al., 1999; Shults and Gilman, 2003), and α-syn-immunoreactive glial cytoplasmic inclusions (GCIs) in oligodendrocytes (Lantos and Papp, 1994; Lantos, 1998; Wakabayashi et al., 1998a; Dickson et al., 1999; Gai et al., 1999; Duda et al., 2000; Dickson, 2001; Goedert, 2001) in several brain regions (Wenning and Jellinger, 2005). These inclusions are accompanied by neuronal loss, astrogliosis, and demyelination (Probst-Cousin et al., 1998; Wenning and Jellinger, 2005).
The factors triggering progressive α-syn accumulation in oligodendrocytes and neurons in patients with MSA are not well understood. It is also unclear how accumulation of α-syn in oligodendrocytes leads to cellular dysfunction and neurodegeneration (Trojanowski et al., 1998; Goldberg and Lansbury, 2000). Recent studies have begun to address this issue by generating tg mice that express α-syn under the regulatory control of oligodendroglial promoters such as the proteolipid promoter (PLP) (Kahle et al., 2002) and 2′,3′-cyclic nucleotide 3′-phosphodiesterase (CNP) promoter (Yazawa et al., 2005). These models have reported accumulation of α-syn in oligodendrocytes with demyelination and degeneration, especially in the spinal cord. However, the effects of hα-syn accumulation in neurodegeneration in other cortical and subcortical brain regions deserve further consideration, because patients with MSA also develop behavioral alterations that suggest frontal lobe involvement (Robbins et al., 1992), including attention deficits (Robbins et al., 1992; Meco et al., 1996). To this end, we generated new lines of tg mice overexpressing hα-syn under the control of the myelin basic protein (MBP) promoter. By 6 months of age, these mice developed abundant hα-syn-immunoreactive inclusions in oligodendrocytes in the neocortex, basal ganglia, cerebellum, and brainstem, accompanied by myelin and neuronal damage and motor deficits, supporting a more general role of α-syn accumulation in the pathogenesis of MSA.
Materials and Methods
Generation of MBP hα-syn tg mice. For the present study, we generated tg mice expressing hα-syn under the murine MBP promoter (kindly provided by Dr. de la Torre with permission from Dr. Lazzarini). This promoter was used because it has been shown previously to specifically target oligodendrocytes (Gow et al., 1992), the primary cell population affected in MSA. The wild-type (wt) hα-syn cDNA fragment (nucleotides 53-475; GenBank accession number L08850) was generated by reverse transcriptase-PCR from human brain mRNA, ligated into pCRII (Invitrogen, La Jolla, CA), and sequenced for accuracy. The hα-syn cDNA fragments were released from the pCRII vector and ligated with the 5′ upstream region of the MBP cassette; the splice and the polyadenylation signals were supplied by portions of the PLP gene (exon 6, intron 6, exon 7). The purified construct was microinjected into one-cell embryos (C57BL/6 × DBA/2 F1) according to standard procedures, and the highest-expresser lines from each of these mouse groups obtained were selected for subsequent analysis. Genomic DNA was extracted from tail biopsies and analyzed by PCR amplification (Rockenstein et al., 1995; Masliah et al., 2000). For all experiments, heterozygous hα-syn tg mice were crossed with wt (DBA) mice to generate tg and nontransgenic (nontg) littermates.
Behavioral analysis. In the rotarod test (San Diego Instruments, San Diego, CA), mice were blind-coded and tested for 2 d, as described previously (Masliah et al., 2001b). On the first day, mice were trained for five trials at the following speeds: first at 10 rpm, second at 20 rpm, and third through fifth at 40 rpm. On the second day, mice were tested for seven trials at 40 rpm each. Mice were placed individually on the cylinder, and the speed of rotation increased from 0 to 40 rpm over a period of 240 s. The length of time mice remained on the rod (fall latency) was recorded and used as a measure of motor function. The non-tg and tg animals were also evaluated in the pole test because this assay has been used previously to assess basal ganglia-related movement disorders in mice (Ogawa et al., 1985, 1987; Matsuura et al., 1997; Sedelis et al., 2001; Fernagut et al., 2003). It has been shown that 1-methyl-4-phenyl-1,2,3,6-tetrahydropyridine (MPTP)-treated mice display slower times in both parameters compared with controls, and the impairments can be reversed by l-3,4-dihydroxyphenylalanine (Ogawa et al., 1985, 1987; Matsuura et al., 1997). Briefly, as described previously (Fleming et al., 2004), animals (4 months of age) were placed head upwards on top of a vertical wooden pole 50 cm long (diameter, 1 cm). The base of the pole was placed in the home cage. When placed on the pole, animals orient themselves downward and descend the length of the pole back into their home cage. Groups of MBP hα-syn tg mice (from all four lines; n = 8 per line) and nontg littermates (n = 8; proportionately distributed across the lines) received 2 d of training that consisted of five trials for each session. On the test day, animals received five trials, and time to orient downward and total time to descend were measured. The best performance over the five trials was used for both nontg and MBP hα-syn tg mice. To further investigate the time course of the motoric deficits in the mice, an additional set of MBP hα-syn transgenic mice from line 1 were tested in the pole test at 3, 6, and 12 months of age (n = 6 per age group).
Tissue processing and preparation. For analysis of the various lines generated, mice were killed following National Institutes of Health guide-lines for the humane treatment of animals. After transcardiac saline perfusion under anesthesia with chloral hydrate, brains were removed and divided sagitally. For RNA and protein analysis (Masliah et al., 2000), the right hemibrain was snap-frozen in cooled isopentane and stored at -70°C. The left hemibrain was immersion-fixed in 4% paraformaldehyde at 4°C for 72 h and serially sectioned sagitally at 40 μm with the Vibratome 2000 (Leica, Deerfield, IL) for neuropathological and immunocytochemical analysis and electron microscopy (Masliah et al., 2000). For comparisons of the morphological characteristics and patterns of immunoreactivity, vibratome sections from the frontal cortex and basal ganglia of an autopsy case from a patient confirmed to have MSA were used (58-year-old male). Additional paraformaldehyde-fixed hemibrains, spinal cord, muscle, nerves, and dorsal root ganglia were paraffin-embedded and sectioned serially at 7 μm for neuropathological and in situ hybridization (ISH).
RNA analysis. Levels of hα-syn expression were analyzed by RNase protection assay (RPA) and ISH, as described previously (Masliah et al., 2000; Rockenstein et al., 2002). Briefly, for RPA, total RNA was isolated from snap-frozen tissues using the Tri reagent (Molecular Research Center, Cincinnati, OH) and added to 32P-labeled antisense riboprobes, and for ISH, h-, and mα-syn, 35S-labeled sense and antisense riboprobes were used essentially as described previously (Toggas et al., 1994). For ISH, paraffin sections were treated with proteinase K, incubated in prehybridization solution, and hybridized with riboprobes at 60°C. For colocalization studies, sections were immunolabeled with an antibody against the oligodendroglial marker galactocerebroside (GC; 1:50; Chemicon, Temecula, CA) or with an antibody against hα-syn (72-10; 1:1000) (Masliah et al., 2000). Sections were exposed to film and developed 3-14 d later. These sections were then dipped in Kodak (Rochester, NY) NTB-2 emulsion and developed 10 d later. The following 32P-labeled antisense riboprobes were used to identify specific mRNAs [protected nucleotides (GenBank accession number)]: hα-syn [nucleotides 210-475 (L08850)]; mα-syn [nucleotides 235-459 (S69965)]; and murine actin [nucleotides 488-565 (X03672)]. RNase was then inactivated with proteinase K/N-laurylsarkosine and precipitated with 4 m guanidine thiocyanate/0.5% N-laurylsarkosine and isopropanol. Samples were separated on 5% acrylamide/8 m urea Tris borate-EDTA gels. Dried gels were exposed to Biomax film (Kodak), and signals were quantitated with a PhosphorImager SF (Molecular Dynamics, Sunnyvale, CA) using the ImageQuant software and expressed as integrated pixel intensities over defined volumes. Final values were expressed as ratios of specific signal background/actin signal background to correct for differences in RNA content/loading across samples.
Western blot analysis. Levels of hα-syn immunoreactivity were analyzed in cytosolic and particulate fractions of brain homogenates, as described previously (Masliah et al., 2000). Twenty micrograms of cytosolic fraction per mouse were loaded onto 10% Bis-Tris (Invitrogen) SDS-PAGE gels, transferred onto Immobilon membranes, incubated with a rabbit polyclonal anti-hα-syn antibody (72-10; 1:1000) (Masliah et al., 2000) followed by an anti-rabbit secondary antibody, reacted with ECL, and developed on a VersaDoc gel imaging machine (Bio-Rad, Hercules, CA). Further analysis of hα-syn accumulation in the detergent-insoluble fractions was performed as described previously (Kahle et al., 2001, 2002). Briefly, hemibrains from each line were sonicated in TBS+ (plus protease inhibitor mixture; Sigma, St. Louis, MO). The brains from each line were pooled and centrifuged for 5 min at 1000 × g, and the resulting supernatants were ultracentrifuged for 1 h at 130,000 × g. The supernatants from this step represented the TBS-soluble fractions. Pellets were then rinsed twice with TBS+ and extracted with 500 μl of 5% SDS in TBS+ and ultracentrifuged for 30 min at 130,000 × g, and the pellets were re-extracted twice, collecting the detergent-soluble supernatants (SDS-soluble fraction). The detergent-insoluble pellets were squashed in 100 μl of 8 m urea/5% SDS in TBS+ and incubated for 10 min at room temperature. Eighty microliters of the resulting suspension were mixed with 20 μl of trichloroacetic acid and allowed to precipitate overnight at 4°C, and precipitates were collected in protein gel-loading buffer containing 5.3 m urea. For TBS-soluble and SDS-soluble fractions, 15 μg of protein was loaded for each lane. For urea extract, all protein precipitates in each sample were loaded. Immunoblots were probed with the LB509 antibody (mouse monoclonal; 1:1000; Zymed Laboratories, San Francisco, CA) against hα-syn. Anti-β-actin (Sigma) was used to confirm equal loading.
Immunocytochemical and neuropathological analysis of MBP hα-syn tg mice. Analysis was performed in serially sectioned, free-floating, blind-coded vibratome sections from tg and nontg mice, as described previously (Masliah et al., 2000) and in sections from the brains (basal ganglia) of human MSA cases for comparison of neuropathological features. For neuropathological analysis, sections were stained with hematoxylin/eosin, cresyl violet, and luxol fast blue (LFB). Additional sections were immunostained with antibodies against hα-syn (72-10; mouse monoclonal; 1:500) (Masliah et al., 2000) or LB509 (1:1000; Zymed) or phospho-serine129 hα-syn (1:250) (Fujiwara et al., 2002), ubiquitin (rabbit polyclonal; 1:50; Dako-Cytomation, Carpinteria, CA), phospho-neurofilament (NF; SMI312; mouse monoclonal; 1:1000; Sternberger Monoclonals, Baltimore, MD), and neuronal-specific nuclear protein (NeuN; mouse monoclonal; 1:1000; Chemicon), the astroglial marker glial fibrillary acidic protein (GFAP; mouse monoclonal; 1:500; Chemicon), or the microglial marker ionized calcium-binding adapter molecule-1 (Iba1; rabbit polyclonal; 1:2500; Wako Pure Chemical Industries, Osaka, Japan). To analyze alterations in the dopaminergic system, series of sections were immunostained with a mouse monoclonal antibody against tyrosine hydroxylase (TH; 1:200; Chemicon). After overnight incubation with the primary antibodies, sections were incubated with biotinylated anti-rabbit or anti-mouse IgG (1:100; Vector Laboratories, Burlingame, CA), avidin D-horseradish peroxidase (1:200; ABC Elite; Vector Laboratories), and reacted with diaminobenzidine tetrahydrochloride (DAB) containing 0.001% H2O2. Immunostained sections were analyzed as described previously (Hashimoto et al., 2004) with the Quantimet 570C microdensitometer system (Leica, Deerfield, IL) to obtain semiquantitative assessment of levels of immunostaining. Additional analysis of neuronal and dendritic integrity was performed with vibratome sections immunostained with an antibody against microtubule associated protein-2 (MAP2; 1:100; Chemicon), followed by a secondary FITC-tagged anti-mouse IgG and analysis with the laser scanning confocal microscope (LSCM) (Bio-Rad, Wattford, UK). Digitized images were then analyzed with the NIH Image program 1.63 to determine the percentage of the area of the neuropil occupied by MAP2-immunoreactive dendrites.
Double-immunocytochemical analysis was performed, as described previously (Masliah et al., 2000), to determine the relationship between hα-syn-immunolabeled inclusions and oligodendroglial (GC), astroglial (GFAP), microglial (Iba1), and neuronal (NeuN) markers. Forty-micrometer-thick vibratome sections were double-immunolabeled with polyclonal anti-hα-syn (1:10,000), detected with the Tyramide Signal Amplification-Direct (Red) system (1:100; DuPont NEN, Boston, MA) and GFAP (1:500; Chemicon), Iba1 (1:100; Wako Pure Chemical Industries), GC (1:40; Chemicon), or NF (1:1000; Sternberger Monoclonals), detected with FITC-conjugated secondary antibodies (1:75; Vector Laboratories) (Masliah et al., 2000). All sections were processed simultaneously under the same conditions, and experiments were performed twice to assess reproducibility. Sections were imaged with a Zeiss (Oberkochen, Germany) 63× objective (numerical aperture, 1.4) on an Axiovert 35 microscope (Zeiss) with an attached MRC1024 LSCM system (Bio-Rad) (Masliah et al., 2000). To confirm the specificity of primary antibodies, control experiments were performed in which sections were incubated overnight in the absence of primary antibody (deleted), preimmune serum, and primary antibody preadsorbed for 48 h with 20-fold excess of the corresponding peptide.
Electron microscopic studies. For ultrastructural analysis of MBP hα-syn tg mice, vibratome sections were postfixed in 1% glutaraldehyde and 0.1% osmium tetroxide in 0.1 m sodium cacodylate buffer and embedded in Ep-oxy. Blocks were sectioned with an Ultracut E ultramicrotome (Leica, Nussloch, Germany) and analyzed with a Zeiss EM10 electron microscope (Rockenstein et al., 2001). Further characterization of the presence of hα-syn in the glial inclusions was performed by immunoelectron microscopic analysis. Briefly, as described previously (Masliah et al., 2001a), vibratome sections were embedded in LR-White (Electron Microscopy Sciences, Fort Washington, PA), followed by ultra-thin sectioning and immunolabeling with an antibody against hα-syn and detection with a goat anti-rabbit antibody tagged with 10 nm colloidal Aurion ImmunoGold particles (1:50; Electron Microscopy Sciences, Fort Washington, PA).
Statistical analysis. All experiments were performed blind-coded and repeated at least once to assess reproducibility. Analyses were performed with the StatView 5.0 program (SAS Institute, Cary, NC). Differences among means were assessed by one-way ANOVA followed by Dunnett's or Tukey-Kramer post hoc tests, as indicated. The null hypothesis was rejected at the 0.05 level.
Results
The MBP promoter induced high levels of hα-syn expression in oligodendrocytes in cortical and subcortical regions in the brains of MBP hα-syn tg mice
A total of four lines (1, 2, 29, and 31) of tg mice expressing hα-syn under the MBP promoter were generated. RNA analysis by RPA showed that line 29 was the highest expresser, followed by lines 1, 2, and 31 (Fig. 1A,B). Consistent with the RPA results, ISH analysis with an antisense probe showed that line 29 was the highest expresser (Fig. 1C) followed by lines 1, 2, and 31 (data not shown). In contrast, no hybridization was observed with an hα-syn sense probe in MBP hα-syn tg mice from line 29 (Fig. 1D). Similarly, very low or negligible levels of hybridization were observed in nontg controls with the antisense or sense hα-syn riboprobes (data not shown). The highest levels of hybridization were observed in the corpus callosum, followed by the white matter tracts in the brainstem, spinal cord, basal ganglia, and cerebellum (Fig. 1C,E). The lowest levels of hybridization were observed in the hippocampus, neocortex, and cortical layers in the cerebellum (Fig. 1C,E). In the various brain regions where hybridization was detected with the antisense probe, the hα-syn message was associated with glial cells (Fig. 1F) that coexpressed the oligodendroglial marker GC (Fig. 1F) and that contained hα-syn-immunoreactive inclusions (Fig. 1G). No hybridization was observed associated with neurons, astrocytes, microglia, or ependymal cells (data not shown). Western blot analysis showed that mice expressing the highest mRNA levels had the highest levels of hα-syn immunoreactivity (Fig. 1H,I). Further immunoblot analysis of the distribution of hα-syn in the tg mice showed that hα-syn was found both in the detergent-insoluble and detergent-soluble fractions (Fig. 1J), and the insoluble hα-syn was recovered by urea extraction (Fig. 1J). To better understand the differences in regional distribution of hα-syn, immunocytochemical analysis with antibodies against hα-syn was performed. This study showed that by 4 months of age, in all four lines, intense hα-syn immunoreactivity was present in glial but not neuronal cells in the neocortex, basal ganglia, corpus callosum, and cerebellum (Fig. 2). hα-synuclein-immunoreactive cells were more abundant in the deeper layers of the neocortex (Fig. 2A,B,F,G,K,L,P,Q), internal capsule, subcortical structures (Fig. 2C,H,M,R), and along white matter tracts in the corpus callosum (Fig. 2D,I,N,S) and in the cerebellum (Fig. 2E,J,O,T). Immunostaining was concentrated in the glial cell bodies and to a lesser extent in the processes, mimicking inclusions (Fig. 2B,G,L,Q). Consistent with the RPA and Western blot analysis, the most abundant inclusion-like structures were observed in the highest-expresser line 29 (Fig. 2P-T); however, lines 1 (Fig. 2K-O), 2 (Fig. 2F-J), and 31 (Fig. 2A-E) also showed abundant hα-syn immunoreactivity. Furthermore, when compared with sections from the basal ganglia of patients with MSA (Fig. 3A-D), the glial cell inclusions in the tg mice (Fig. 3E-H) were remarkably similar in that cytoplasmic aggregates displayed an oval or conical shape and were intensely immunostained with polyclonal and monoclonal antibodies against hα-syn (Fig. 3E,F) and phosphorylated hα-syn (Fig. 3G). In both MSA brains and the brains of MBP hα-syn tg mice, these inclusions showed mild labeling with an antibody against ubiquitin (Fig. 3D,H). Double-labeling studies confirmed that the hα-syn-immunoreactive cells were of oligodendroglial origin because most of them were colabeled with the GC antibody (Fig. 4) but were not labeled with markers for astroglial (GFAP; data not shown), microglial (Iba1; data not shown), or neuronal (NF; data not shown) cells.
Figure 1.

Characterization of hα-syn expression under the MBP promoter in tg mice. A, RNase protection assay. Representative autoradiograph of hα-syn mRNA showing that levels were highest in line 29 mice, followed by lines 1, 2, and 31. The left lane shows signals of undigested (U) radiolabeled riboprobes (identified on left); the other lanes contain the same riboprobes plus brain RNA samples digested with RNases. Protected mRNAs are indicated on the right. B, Semiquantitative analysis of levels of hα-syn mRNA expression in tg mice; results are expressed as a ratio of hα-syn to actin. Bars are mean ± SEM. C, In situ hybridization with an antisense probe shows intense hybridization in the white matter tracts (wm), cerebellum (ce), and brainstem (bs), and to a lesser extent in the frontal cortex (fc) of an MBP hα-syn tg mouse from line 29. D, No hybridization is observed with a sense probe in an MBP hα-syn tg mouse from line 29. E, Image analysis of the levels of hybridization in various brain regions in an MBP hα-syn tg mouse from line 29. F, G, Higher-magnification view of the hybridization signal in glial cells in the corpus callosum, in which hα-syn mRNA (black grains) was colocalized with the oligodendroglial marker GC (brown; F), and hα-syn mRNA (black grains) was colocalized with hα-syn immunoreactivity (brown) in oligodendroglial cells (G). Scale bar: (in G)20 μm. H, Western blot analysis with the hα-syn antibody that identifies monomeric hα-syn as a single band at ∼14 kDa. I, Semiquantitative analysis of levels of hα-syn immunoreactivity in tg lines; results are expressed as integrated pixel intensity. J, Immunoblot analysis of the detergent-soluble and -insoluble distribution of hα-syn. Error bars are mean ± SEM.
Figure 2.

Patterns of hα-syn immunoreactivity in the brains of MBP hα-syn tg mice. All panels are images of the specified brain regions of vibratome sections of 4-month-old tg mice from line 31 (A-E), line 2 (F-J), line 1 (K-O), or line 29 (P-T) immunostained with an antibody against hα-syn, developed with DAB, and analyzed by bright-field microscopy. A, B, F, G, K, L, P, Q, Oligodendroglial cells in the neocortex of tg mice from line 31 (A, B), line 2 (F, G), and line 1 (K, L) at low (200×; A, F, K) and high (400×; B, G, L) magnification (mag) show abundant hα-syn immunoreactivity. C-E, H-J, M-O, The basal ganglia (C, H, M), corpus callosum (D, I, N), and cerebellum (E, J, O) of line 31, line 2, and line 1 tg mice also display abundant oligodendroglial cells with hα-syn immunoreactivity. P, Q, Oligodendroglial cells in the neocortex of tg mice of the higher-expresser line 29 at low (P) and high (Q) magnification show a higher density of hα-syn-immunoreactive inclusions and vacuolization and expansion of the cytoplasm (arrow). R-T, The basal ganglia (R), corpus callosum (S), and cerebellum (T) of line 29 tg mice also show a higher density of hα-syn-immunoreactive oligodendroglial cells. Scale bars: (in T) A, C-E, F, H-J, K, M-O, P, R-T, 100 μm; (in Q) B, G, L, Q, 10 μm.
Figure 3.

Comparison of the glial cell inclusions between MSA and MBP hα-syn tg animals. Images are from the white matter tracts in the basal ganglia of a human case with typical MSA and MBP hα-syn tg mice from line 1 (4 months of age). A, Conical and ovoid GCIs in an MSA case were positively immunostained with a polyclonal antibody against hα-syn (72-10). B, GCIs immunostained with a monoclonal antibody against hα-syn (LB509). C, GCIs immunostained with a monoclonal antibody against phospho-serine129 hα-syn (pser129). D, GCIs immunostained with an antibody against ubiquitin. E, Conical and ovoid glial inclusions in an MBP hα-syn tg mouse were positively immunostained with a polyclonal antibody against hα-syn (72-10). F, Glial inclusions immunostained with a monoclonal antibody against hα-syn (LB509). G, Glial inclusions immunostained with a monoclonal antibody against phospho-serine129 hα-syn (pser129). H, Glial inclusions in the tg mice were mildly immunostained with an antibody against ubiquitin. Scale bar, 20 μm.
Figure 4.

Colocalization of hα-syn with oligodendrocytic markers in the brains of MBP hα-syn tg mice. All images are from brain sections of 4-month-old tg mice from line 29 immunostained with antibodies against hα-syn and the oligodendroglial cell marker GC and imaged with the LSCM. A-C are images from the neocortex, and D-F are from the corpus callosum. In both the neocortex and corpus callosum, hα-syn-immunoreactive cells (red) also display galactocerebroside immunolabeling (green), as indicated by arrows, and colocalization is indicated by the yellow in the merged images. Scale bar, 40 μm.
Neurological deficits in MBP hα-syn tg mice
Under basal conditions, mice from all lines showed no developmental alterations and displayed normal behavior after birth. However, mice expressing high levels of hα-syn (line 29) bred at a slower rate and at ∼2-4 months of age developed severe neurological alterations including tremors, ataxia, and seizure activity, resulting in premature death of all mice from this line at 6 months of age (Fig. 5A). Mice from the other intermediate- and lower-expresser lines bred normally, did not develop any of these severe neurological alterations except mild tremors that initiated at 12 months of age, and 95% of the animals survived for up to 18 months (Fig. 5A). Analysis of young (4 months of age) animals in the rotarod test revealed that mice from lines 29, 1, and 2 were significantly impaired compared with mice from line 31 and nontg littermates (Fig. 5B). Similarly, in the pole test, mice from the higher-expresser lines (29 and 1) displayed significant deficits compared with lower-expresser mice (lines 2 and 31) and nontg control littermates (Fig. 5C). To investigate the time course of the deficits, a sub-group of nontg and MBP hα-syn tg mice from line 1 were longitudinally tested in the pole apparatus at 3, 6, and 12 months of age. This study showed that at 3 months of age, only minimal deficits were detected, whereas at 6 months, more significant alterations in performing these tests developed that were similar to those observed at 12 months of age (Fig. 5D). This is consistent with the onset of the neuropathological alterations in the tg mice, in which the highest concentration of hα-syn-immunoreactive inclusions in oligodendrocytes was observed at 6 months of age. Similar to the basal ganglia, brainstem, and cerebellum (Fig. 1C,E), the spinal cord displayed high levels of hα-syn expression in the tg mice. In the peripheral nerves and muscle, very low or no hα-syn mRNA was detected (data not shown). Similar to the nontg controls (Fig. 5E-H), in the MBP hα-syn tg mice (Fig. 5I-L), muscle fibers (Fig. 5I), neurons in the dorsal root ganglia (Fig. 5J), nerve roots (Fig. 5K), and motor neurons in the spinal cord (Fig. 5L) were preserved. However, there was moderate demyelination of the pyramidal tracts in the spinal cord. Together, these results suggest that although alterations in the pyramidal tracts might contribute to the deficits in the MBP hα-syn tg mice, neurodegenerative alterations in other brain regions might play an important role.
Figure 5.

Characterization of survival and neurological deficits in MBP hα-syn tg mice. A, Survival curves for the MBP hα-syn tg mice showing that, although mice from the lower-expresser lines (1, 2, and 31) were viable for long periods of time, mice from high-expresser line 29 died prematurely by 6 months of age. B, Motor assessment in the rotarod showed that compared with nontg mice (n = 6), tg mice from line 31 (n = 6) had a mild impairment of motor function, whereas tg mice from lines 2 (n = 6), 1 (n = 6), and 29 (n = 6) had more significant motor deficits in this test. Mice were tested at 4 months of age. C, Motor assessment in the pole test showed that compared with nontg mice (n = 6), tg mice from lines 31 (n = 6) and 2 (n = 6) demonstrated motor abilities comparable with control mice, whereas tg mice from higher-expresser lines 1 (n = 6) and 29 (n = 6) displayed significant motor impairment. Mice were tested at 4 months of age. D, Motor assessment in the pole test showed that, at 3 months of age, only mild deficits were observed; however, at 6 months of age, these deficits were accentuated and remained similar at 12 months of age. Error bars are mean ± SEM. *Significant difference compared with nontg controls (p < 0.05; one-way ANOVA with post hoc Dunnett's). E-L, For histological analysis, paraffin sections from 4-month-old mice were stained with hematoxylin/eosin and imaged by bright-field microscopy. E-H, Histological analysis of the hindlimb muscle (E), dorsal root ganglion (F), spinal nerve roots (G), and motor neurons (H) in the thoracic segments of the spinal cord in nontg mice. I-L, No significant alterations were observed in muscle (I), dorsal root ganglion (J), spinal nerve roots (K), and motor neurons (L) in the thoracic segments of the spinal cord in MBP hα-syn tg mice. Scale bar, 20 μm.
High levels of hα-syn expression in oligodendrocytes in the brains of MBP hα-syn tg mice result in neurodegeneration and myelin alterations
To investigate the contribution of the neurodegenerative alterations associated with hα-syn accumulation in oligodendrocytes to the behavioral deficits, further immunocytochemical and neuropathological analysis in the corpus callosum, dopaminergic system, and neocortex was performed. At 4 months of age, compared with nontg controls (Fig. 6A), the MBP hα-syn tg animals displayed astrogliosis in the corpus callosum (Fig. 6B-F) and other white matter tracts and to a lesser extent in the neocortex and brainstem (data not shown). Consistent with the increased astrogliosis in the white matter, analysis of sections stained with LFB showed that compared with nontg controls (Fig. 6G), in MBP hα-syn tg mice there was an attenuation of the myelin staining in the corpus callosum (Fig. 6H-L). In addition, double immunocytochemical analysis with antibodies against NF and hα-syn revealed that compared with nontg controls (Fig. 6M), in areas in the brains of tg mice where abundant hα-syn-immunoreactive oligodendrocytes were found, there were extensive axonal alterations, including decreased fiber density in the corpus callosum and formation of irregular and enlarged axons (Fig. 6N-R). The astroglial reaction (Fig. 6F), the loss of myelin staining (Fig. 6L), and alterations in corpus callosum axons (Fig. 6R) were more intense in mice from higher-expresser lines (1 and 29) compared with the lower-expresser lines (31 and 2). To investigate whether increased accumulation of hα-syn in oligodendrocytes also resulted in neurodegeneration in the neocortex, immunocytochemical analysis with antibodies against NF (Fig. 7A-C) and MAP2 (Fig. 7D-F) was performed. These studies showed that in the MBP hα-syn tg mice, there was reduced complexity of the axonal (Fig. 7B) and dendritic (Fig. 7E) structures that was more severe in mice from line 29 (Fig. 7C,F). Analysis of neurons in other brain regions, including the basal ganglia, brainstem, and cerebellum (areas where abundant hα-syn-immunoreactive oligodendroglial inclusions were found), showed simplification of the dendritic processes as well as formation of enlarged and irregular axons with increased accumulation of NF immunoreactivity (data not shown). Consistent with the time course and distribution of hα-syn accumulation in oligodendrocytes, the neurodegenerative alterations in the white matter tracts and dendritic arbor of the neurons became more apparent at 4 months of age.
Figure 6.

Neuropathological alterations in the corpus callosum of MBP hα-syn tg mice. All panels are from vibratome sections from the brains of 4-month-old mice immunostained with an antibody against GFAP (A-F) or the histochemical stain LFB (G-L) and imaged by bright-field microscopy or with antibodies against hα-syn and NF and imaged with the LSCM (M-R). A-E, Immunocytochemical analysis with an antibody against GFAP shows that compared with a nontg control (A), tg mice from all four lines (B-E) displayed astrogliosis in the corpus callosum. F, Semiquantitative analysis of levels of astrogliosis, as measured by GFAP immunoreactivity. Lines 2, 1, and 29 display more intense astrogliosis compared with nontg controls and lower-expresser line 31. G-K, Staining with LFB demonstrates that compared with a nontg control (G), in MBP hα-syn tg mice (H-K), myelin staining of this region was reduced. L, Semiquantitative analysis of levels of myelin staining, as measured by LFB reactivity. High-expresser lines 1 and 29 show decreased myelin staining compared with nontg controls and low-expresser lines 31 and 2. M-Q, Double immunocytochemical analysis shows that compared with a nontg control (M), hα-syn immunoreactivity (red) was accompanied by extensive axonal (NF; green) alterations, including decreased neurite density and formation of irregular and enlarged axons (arrows) (N-Q). R, Semiquantitative analysis of levels of axonal integrity, as measured by NF immunoreactivity. Lines 2, 1, and 29 display more significant decreases in levels of NF immunoreactivity compared with nontg controls and low-expresser line 31. Scale bars: (in E) A-E, 50 μm; (in K) G-K, 100 μm; (in Q) M-Q, 20 μm. Error bars are mean ± SEM. The asterisks indicate significant difference compared with nontg controls (p < 0.05; one-way ANOVA with post hoc Dunnett's).
Figure 7.
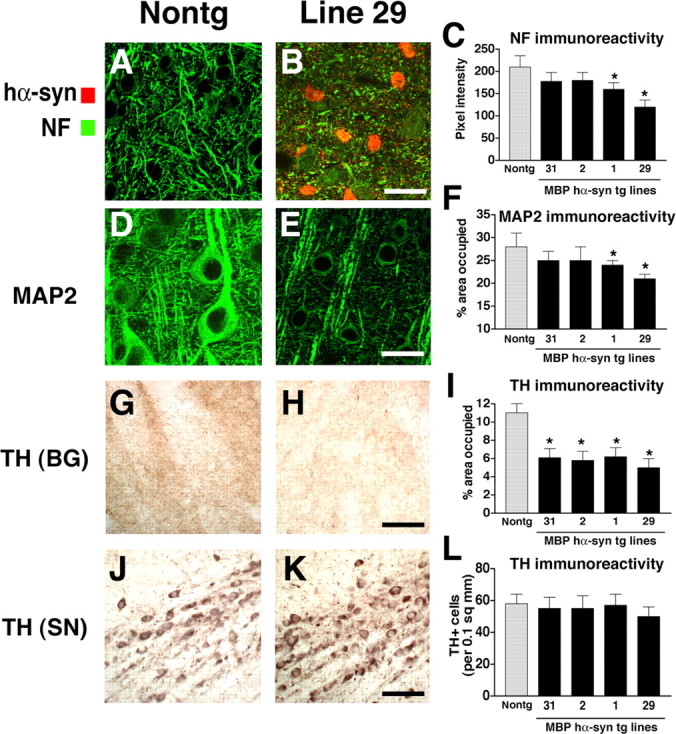
Patterns of neurodegeneration in the neocortex and dopaminergic system of MBP hα-syn tg mice. All panels are from the neocortex of 4-month-old mice. Sections were labeled with antibodies against hα-syn and NF or MAP2 and imaged with the LSCM or with an antibody against TH and imaged by bright-field microscopy. A, B, NF immunoreactivity demonstrates that compared with a nontg control (A), hα-syn immunoreactivity in oligodendrocytes (arrows) in the neocortex of tg mice (B) is accompanied by axonal atrophy and a decrease in the density of neuritic processes, particularly in the high-expresser line 29 (B). C, Levels of axonal integrity, as measured by NF immunoreactivity. Lines 2, 1, and 29 display more significant decreases in levels of NF immunoreactivity compared with nontg controls and low-expresser line 31. D-E, MAP2 immunoreactivity shows that compared with a nontg control (D), MBP hα-syn tg mice (E) had extensive damage to dendrites and decreased density of dendritic structures in the neocortex, particularly in the higher-expresser line 29 (E). F, Confocal analysis of the percentage of the area of the neuropil occupied by MAP2-immunoreactivite dendrites. High-expresser lines 1 and 29 demonstrate a significant decrease in MAP2 immunoreactivity compared with nontg controls and lower-expresser lines 31 and 2. G, H, Compared with a nontg control (G), MBP hα-syn tg mice (H) showed decreased TH-immunoreactive fibers in the basal ganglia (BG). I, Computer-aided image analysis of percentage of area occupied by TH-immunolabeled fibers. All tg lines demonstrate decreased levels of TH-immunoreactive fibers. J, K, TH immunoreactivity in neurons in the SN in nontg (J) and MBP hα-syn tg (K) mice. L, Image analysis of the numbers of TH-positive neurons shows no differences among the groups. sq, Square. Scale bars: (in B, E) A-E, 20 μm; (in H) G, H, 30 μm; (in K) J, K, 40 μm. Error bars are mean ± SEM. The asterisks indicate significant difference compared with nontg controls (p < 0.05; one-way ANOVA with post hoc Dunnett's).
To investigate potential alterations in the striatonigral system, analysis of the levels of TH immunoreactivity in the basal ganglia region (Fig. 7G-I) and the substantia nigra (SN) (Fig. 7J-L) was performed in 4-month-old tg mice. These studies showed that compared with age-matched nontg controls (Fig. 7G), mice from lines 31, 2, and 1 display a 45% reduction in the density of TH-immunoreactive fibers in the basal ganglia, whereas mice from line 29 showed an approximate 55% loss (Fig. 7H,I). The levels of immunoreactivity and density of TH neurons in the SN was comparable between the nontg mice (Fig. 7J) and the MBP hα-syn tg animals (Fig. 7K,L).
The expression of hα-syn in oligodendrocytes results in the formation of fibrillar aggregates and mitochondrial alterations
To further characterize the ultrastructural features of the oligodendroglial inclusions in the MBP hα-syn tg mice, electron microscopy studies were performed in sections stained with uranyl acetate as well as in sections labeled with an antibody against hα-syn (Fig. 8). Ultrastructurally, the inclusions in oligodendroglial cells in the white matter tracts were distributed primarily in the perinuclear region and were composed of fibrillar aggregates surrounded by electrodense granular material (Fig. 8A). At higher magnification, the fibrillar aggregates in the MBP hα-syn tg mice were composed of filamentous structures ranging in diameter from 9 to 11 nm that were accompanied by some electrodense material (Fig. 8B). Furthermore, some oligodendroglial cells showed accumulation of granular electrodense material without fibrils (data not shown). Immunoelectron microscopic analysis with a secondary antibody tagged with colloidal gold particles confirmed that the filaments in the oligodendroglial inclusions displayed hα-syn immunoreactivity (Fig. 8C), because gold particles were detected primarily in association with the filaments and to a lesser extent with the electrodense granular material (Fig. 8C).
Figure 8.
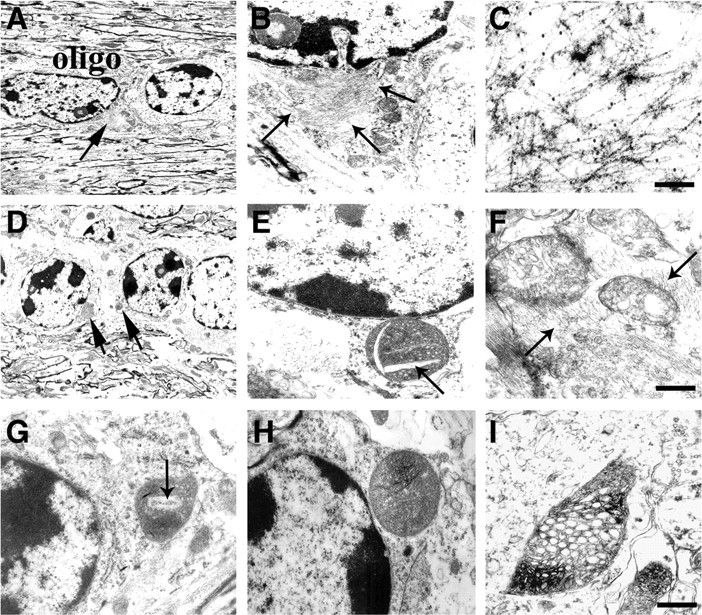
Ultrastructural analysis of the neuropathological alterations in MBP hα-syn tg mice. All panels are from the neocortex of 4-month-old tg mice from line 29 imaged by electron microscopy. A, B, Oligodendroglial cells (oligo) within the white matter tracts in the corpus callosum contain fibrillary perinuclear inclusions (arrows), which are surrounded by electrodense material. C, Immunoelectron microscopic analysis of the oligodendroglial cells with an antibody against hα-syn shows abundant gold particles labeling the filaments in the inclusions. D-F, The mitochondria within oligodendroglial cells display abnormal characteristics, including increased size (D), crystalline-like inclusions (arrows; E), irregular crista, and the accumulation of filaments (arrows) around the mitochondria (F). G-I, Mitochondrial alterations in neuronal cells, including formation of crystalline-like inclusions (arrow; G), increased size (H), and irregular crista with electrodense material (I). Scale bars: (in C) A-E, G, H, 10 μm; F, I, 1 μm.
In addition to the filamentous and electrodense granular aggregates, ultrastructural analysis showed that the mitochondria in the oligodendrocytes of the MBP hα-syn tg mice displayed a wide range of abnormalities including increased size and irregular shapes (Fig. 8D,E) in association with filamentous aggregates (Fig. 8F). Some of them contained crystalline-like inclusions (Fig. 8E), decreased crista, and accumulation of electrodense material (data not shown). Similarly, neuronal populations in the neocortex and cerebellum displayed evidence of mitochondrial pathology including formation of crystalline-like inclusions (Fig. 8G), increased size (Fig. 8H), and irregular crista (Fig. 8I).
Discussion
Two major subtypes of MSA are recognized, one with predominant parkinsonian features (MSA-P) and the other with cerebellar manifestations (MSA-C). The similar distribution of the oligodendroglial pathology and the patterns of neurodegeneration suggest a fundamental alteration in the functional unit between oligodendroglia, axon, and neurons (Wenning and Jellinger, 2005). Neuropathological studies in autopsy series (Wakabayashi et al., 1998b; Dickson et al., 1999) as well as in rare cases with early MSA (Wakabayashi et al., 2005) suggest that the progressive accumulation of hα-syn in oligodendrocytes leads to the neurodegenerative process and myelin loss that results in the classical clinical presentation of MSA-P and MSA-C. Consistent with this possibility, the present study showed that overexpression of hα-syn under the regulatory control of the MBP promoter resulted in extensive and abnormal accumulation of this protein in oligodendrocytes in areas often affected in MSA (Wenning and Jellinger, 2005), including the basal ganglia, cerebellum, brainstem, and neocortex. Accumulation of hα-syn in these areas was accompanied by neurodegeneration, myelin loss, and performance deficits. A similar model has been developed recently by overexpressing hα-syn under the regulatory control of the oligodendroglial CNP promoter (Yazawa et al., 2005). In this tg mouse model, as well as in the one in which hα-syn expression is driven by the PLP, there is extensive formation of GCIs and accumulation of detergent insoluble, hyperphosphorylated hα-syn (Kahle et al., 2002). In addition, in the model in which hα-syn expression is driven by the CNP promoter, there is significant neuronal pathology accompanied by the formation of dystrophic neurites, myelin loss, and motor deficits, supporting the notion that accumulation of hα-syn in oligodendrocytes plays an important role in the degeneration of neurons in MSA (Yazawa et al., 2004, 2005). Compared with the tg models in which expression is driven by the CNP or the PLP promoters, targeting oligodendrocytes with the MBP promoter appears to result in more extensive hα-syn accumulation and severe and widespread neurodegenerative and neurological deficits. The severity of the neurological deficits, the age of onset, and neuropathological alterations were associated with the levels of expression of the transgene. Thus, mice expressing the highest levels of hα-syn died prematurely at ∼6 months of age, with profound motor dysfunction, seizure activity, and neurodegeneration in cortical and subcortical areas. Furthermore, whereas in the model in which expression is driven by the CNP promoter, there is more extensive degeneration of the spinal cord motor neurons and pyramidal tracts, in our model, there was more extensive alterations in the neocortex, basal ganglia, and cerebellum. This is of interest, because some patients with MSA present with pyramidal signs and motor features that are associated with a more significant involvement of the spinal cord (Tsuchiya et al., 2000), whereas others present with more cortical and subcortical pathology (Wenning and Jellinger, 2005), suggesting that the various models might mimic the heterogenous presentation of MSA. The more widespread neurodegenerative alterations associated with hα-syn accumulation in oligodendrocytes in the present model in which expression is driven by the MBP promoter might be related to differences in the efficiency of the promoters to express high levels of hα-syn in oligodendroglial cells, integration sites in the genome of the transgene, and genetic background of the mice. Similarly, it is also possible that different promoters may not target all subtypes of oligodendrocytes and may drive α-syn overexpression only in a sub-set of oligodendroglial cells, resulting in varied levels of α-syn expression in different models.
α-Synuclein is known to be a primarily neuronal protein that is concentrated in the presynaptic terminals (Iwai et al., 1994), where it might play an important role in modulating vesicle release of neurotransmitters (Clayton and George, 1998; Murphy et al., 2000). However, recent studies have shown that other neural cells such as oligodendrocytes might also express members of the synuclein family of proteins (Richter-Landsberg et al., 2000; Culvenor et al., 2002). The physiological role of this molecule in oligodendrocytes and other glial cells is unclear, and studies in hα-syn-deficient mice were focused on analyzing its effects in neurotransmission and dopaminergic plasticity (Lucking and Brice, 2000). However, recent studies in oligodendroglial cell lines have suggested that hα-syn might interact with members of the integrin family that are necessary to regulate the cell adhesion properties (Tsuboi et al., 2004, 2005). Similarly, overexpression of hα-syn in neuronal cell lines results in reduced neurite out-growth via decreased cell adhesion (Takenouchi et al., 2001). Thus, increased accumulation of hα-syn in oligodendrocytes might reduce the oligodendrocyte adhesion capabilities and disrupt interactions and signaling with neighboring neurons. The factors promoting the more extensive accumulation of hα-syn in oligodendrocytes than in neurons in MSA are unknown. Possible mechanisms include increased constitutive expression mediated via specific polymorphisms or mutations. However, genetic studies have turned up negative in this respect, and no familial forms of this disorder have been yet identified (Burn and Jaros, 2001), thus emphasizing a potential role for environmental factors and neurotoxins leading to mitochondrial dysfunction and oxidative stress (Beal, 2003). In other disorders with parkinsonism, previous studies have shown that mitochondrial toxins that induce oxidative damage, such as MPTP (Ogawa et al., 1987; Song et al., 2004), paraquat (Manning-Bog et al., 2002), and rotenone (Betarbet et al., 2000), promote accumulation of hα-syn and neuronal dysfunction (Betarbet et al., 2002; Speciale, 2002). Furthermore, radical oxygen species promote hα-syn aggregation (Hashimoto et al., 1999; Ischiropoulos and Beckman, 2003), and oxidized forms of this molecule have been identified in oligodendrocytes in the brains of patients with MSA (Gomez-Tortosa et al., 2002). Consistent with this possibility, a recent study using tg mice systemically overexpressing the α1B-adrenergic receptor that resembled the parkinsonian-like features of MSA showed increased expression of α-syn and markers of oxidative stress (Papay et al., 2002). Additionally, glial cells overexpressing hα-syn display increased vulnerability to oxidative stress, particularly in the presence of cytoplasmic inclusions (Stefanova et al., 2001). In agreement with this possibility, the present study showed that the neurodegenerative process in the MBP hα-syn tg mice was accompanied by mitochondrial alterations. Consistent with this possibility, recent studies have shown that oxidative stress induced by treatment of α-syn tg mice with 3-nitropropionic acid, a mitochondrial inhibitor, induced or enhanced the motor deficits and degeneration of the striatal-nigral system associated with the MSA-like pathology (Stefanova et al., 2005). Together, these studies suggest that increased hα-syn accumulation in oligodendrocytes might result in mitochondrial dysfunction and oxidative injury, leading to neurodegeneration. However, additional studies are necessary to elucidate the specificity of these alterations to the pathogenesis of MSA.
In conclusion, these studies support the contention that accumulation of α-syn in oligodendrocytes under control of the MBP promoter recapitulates several of the key functional and neuropathological features of MSA including neurodegeneration and suggests that this model might be suitable for subsequent in vivo studies to investigate factors that might promote or prevent the progression of this disorder.
Footnotes
This work was funded by National Institutes of Health Grants AG5131, AG022074, AG18440, and P01 NS044233, by the Michael J. Fox Foundation, and by the William M. Spencer Jr Research Fund. We thank Drs. de la Torre and Lazzarini for kindly providing the murine MBP promoter.
Correspondence should be addressed to Dr. Eliezer Masliah, Department of Neurosciences, University of California, San Diego, La Jolla, CA 92093-0624. E-mail: emasliah@ucsd.edu.
Copyright © 2005 Society for Neuroscience 0270-6474/05/2510689-11$15.00/0
References
- Beal MF (2003) Mitochondria, oxidative damage, and inflammation in Parkinson's disease. Ann NY Acad Sci 991: 120-131. [DOI] [PubMed] [Google Scholar]
- Betarbet R, Sherer TB, MacKenzie G, Garcia-Osuna M, Panov AV, Greenamyre JT (2000) Chronic systemic pesticide exposure reproduces features of Parkinson's disease. Nat Neurosci 3: 1301-1306. [DOI] [PubMed] [Google Scholar]
- Betarbet R, Sherer TB, Greenamyre JT (2002) Animal models of Parkinson's disease. Bio-Essays 24: 308-318. [DOI] [PubMed] [Google Scholar]
- Burn DJ, Jaros E (2001) Multiple system atrophy: cellular and molecular pathology. Mol Pathol 54: 419-426. [PMC free article] [PubMed] [Google Scholar]
- Clayton D, George J (1998) The synucleins: a family of proteins involved in synaptic function, plasticity, neurodegeneration and disease. Trends Neurosci 21: 249-254. [DOI] [PubMed] [Google Scholar]
- Culvenor JG, Rietze RL, Bartlett PF, Masters CL, Li QX (2002) Oligodendrocytes from neural stem cells express alpha-synuclein: increased numbers from presenilin 1 deficient mice. NeuroReport 13: 1305-1308. [DOI] [PubMed] [Google Scholar]
- Dickson D, Lin W-L, Liu W-K, Yen S-H (1999) Multiple system atrophy: a sporadic synucleinopathy. Brain Pathol 9: 721-732. [DOI] [PMC free article] [PubMed] [Google Scholar]
- Dickson DW (2001) Alpha-synuclein and the Lewy body disorders. Curr Opin Neurol 14: 423-432. [DOI] [PubMed] [Google Scholar]
- Duda J, Giasson B, Gur T, Montine T, Robertson D, Biaggioni I, Hurtig H, Stern M, Gollomp S, Grossman M, Lee V, Trojanowski J (2000) Immunohistochemical and biochemical studies demonstrate a distinct profile of alpha-synuclein permutations in multiple system atrophy. J Neuropathol Exp Neurol 59: 830-841. [DOI] [PubMed] [Google Scholar]
- Feany M, Bender W (2000) A Drosophila model of Parkinson's disease. Nature 404: 394-398. [DOI] [PubMed] [Google Scholar]
- Fernagut PO, Chalon S, Diguet E, Guilloteau D, Tison F, Jaber M (2003) Motor behaviour deficits and their histopathological and functional correlates in the nigrostriatal system of dopamine transporter knockout mice. Neuroscience 116: 1123-1130. [DOI] [PubMed] [Google Scholar]
- Fleming SM, Salcedo J, Fernagut PO, Rockenstein E, Masliah E, Levine MS, Chesselet MF (2004) Early and progressive sensorimotor anomalies in mice overexpressing wild-type human α-synuclein. J Neurosci 24: 9434-9440. [DOI] [PMC free article] [PubMed] [Google Scholar]
- Fujiwara H, Hasegawa M, Dohmae N, Kawashima A, Masliah E, Goldberg MS, Shen J, Takio K, Iwatsubo T (2002) Alpha-synuclein is phosphorylated in synucleinopathy lesions. Nat Cell Biol 4: 160-164. [DOI] [PubMed] [Google Scholar]
- Gai W, Power J, Blumbergs P, Culvenor J, Jensen P (1999) Alpha-synuclein immunoisolation of glial inclusions from multiple system atrophy brain tissue reveals multiprotein components. J Neurochem 73: 2093-2100. [PubMed] [Google Scholar]
- Galvin J, Giasson B, Hurtig H, Lee V, Trojanowski J (2000) Neurodegeneration with brain iron accumulation, type 1 is characterized by alpha-, beta-, and gamma-synuclein neuropathology. Am J Pathol 157: 361-368. [DOI] [PMC free article] [PubMed] [Google Scholar]
- Giasson BI, Duda JE, Quinn SM, Zhang B, Trojanowski JQ, Lee VM (2002) Neuronal alpha-synucleinopathy with severe movement disorder in mice expressing A53T human alpha-synuclein. Neuron 34: 521-533. [DOI] [PubMed] [Google Scholar]
- Gilman S, Low P, Quinn N, Albanese A, Ben-Shlomo Y, Fowler C, Kaufmann H, Klockgether T, Lang A, Lantos P, Litvan I, Mathias C, Oliver E, Robertson D, Schatz I, Wenning G (1999) Consensus statement on the diagnosis of multiple system atrophy. J Neurol Sci 163: 94-98. [DOI] [PubMed] [Google Scholar]
- Goedert M (2001) Alpha-synuclein and neurodegenerative diseases. Nat Rev Neurosci 2: 492-501. [DOI] [PubMed] [Google Scholar]
- Goldberg MS, Lansbury Jr PT (2000) Is there a cause-and-effect relationship between alpha-synuclein fibrillization and Parkinson's disease? Nat Cell Biol 2: E115-E119. [DOI] [PubMed] [Google Scholar]
- Gomez-Tortosa E, Gonzalo I, Newell K, Garcia Yebenes J, Vonsattel P, Hyman BT (2002) Patterns of protein nitration in dementia with Lewy bodies and striatonigral degeneration. Acta Neuropathol (Berl) 103: 495-500. [DOI] [PubMed] [Google Scholar]
- Gow A, Friedrich Jr VL, Lazzarini RA (1992) Myelin basic protein gene contains separate enhancers for oligodendrocyte and Schwann cell expression. J Cell Biol 119: 605-616. [DOI] [PMC free article] [PubMed] [Google Scholar]
- Graham JG, Oppenheimer DR (1969) Orthostatic hypotension and nicotine sensitivity in a case of multiple system atrophy. J Neurol Neurosurg Psychiatry 32: 28-34. [DOI] [PMC free article] [PubMed] [Google Scholar]
- Hashimoto M, Masliah E (1999) Alpha-synuclein in Lewy body disease and Alzheimer's disease. Brain Pathol 9: 707-720. [DOI] [PMC free article] [PubMed] [Google Scholar]
- Hashimoto M, Hernandez-Ruiz S, Hsu L, Sisk A, Xia Y, Takeda A, Sundsmo M, Masliah E (1998) Human recombinant NACP/a-synuclein is aggregated and fibrillated in vitro: relevance for Lewy body disease. Brain Res 799: 301-306. [DOI] [PubMed] [Google Scholar]
- Hashimoto M, Hsu L, Xia Y, Takeda A, Sundsmo M, Masliah E (1999) Oxidative stress induces amyloid-like aggregate formation of NACP/a-synuclein in vitro. NeuroReport 10: 717-721. [DOI] [PubMed] [Google Scholar]
- Hashimoto M, Rockenstein E, Mante M, Crews L, Bar-On P, Gage FH, Marr R, Masliah E (2004) An antiaggregation gene therapy strategy for Lewy body disease utilizing beta-synuclein lentivirus in a transgenic model. Gene Ther 11: 1713-1723. [DOI] [PubMed] [Google Scholar]
- Ischiropoulos H, Beckman JS (2003) Oxidative stress and nitration in neurodegeneration: cause, effect, or association? J Clin Invest 111: 163-169. [DOI] [PMC free article] [PubMed] [Google Scholar]
- Iwai A (2000) Properties of NACP/alpha-synuclein and its role in Alzheimer's disease. Biochim Biophys Acta 1502: 95-109. [DOI] [PubMed] [Google Scholar]
- Iwai A, Masliah E, Yoshimoto M, De Silva R, Ge N, Kittel A, Saitoh T (1994) The precursor protein of non-Ab component of Alzheimer's disease amyloid (NACP) is a presynaptic protein of the central nervous system. Neuron 14: 467-475. [DOI] [PubMed] [Google Scholar]
- Kahle PJ, Neumann M, Ozmen L, Muller V, Odoy S, Okamoto N, Jacobsen H, Iwatsubo T, Trojanowski JQ, Takahashi H, Wakabayashi K, Bogdanovic N, Riederer P, Kretzschmar HA, Haass C (2001) Selective insolubility of alpha-synuclein in human Lewy body diseases is recapitulated in a transgenic mouse model. Am J Pathol 159: 2215-2225. [DOI] [PMC free article] [PubMed] [Google Scholar]
- Kahle PJ, Neumann M, Ozmen L, Muller V, Jacobsen H, Spooren W, Fuss B, Mallon B, Macklin WB, Fujiwara H, Hasegawa M, Iwatsubo T, Kretzschmar HA, Haass C (2002) Hyperphosphorylation and insolubility of alpha-synuclein in transgenic mouse oligodendrocytes. EMBO Rep 3: 583-588. [DOI] [PMC free article] [PubMed] [Google Scholar]
- Kruger R, Kuhn W, Muller T, Woitalla D, Graeber M, Kosel S, Przuntek H, Epplen J, Schols L, Reiss O (1998) Ala30Pro mutation in the gene encoding alpha-synuclein in Parkinsons's disease. Nat Genet 18: 106-108. [DOI] [PubMed] [Google Scholar]
- Lansbury PTJ (1999) Evolution of amyloid: what normal protein folding may tell us about fibrillogenesis and disease. Proc Natl Acad Sci USA 96: 3342-3344. [DOI] [PMC free article] [PubMed] [Google Scholar]
- Lantos P (1998) The definition of multiple system atrophy: a review of recent developments. J Neuropathol Exp Neurol 57: 1099-1111. [DOI] [PubMed] [Google Scholar]
- Lantos PL, Papp MI (1994) Cellular pathology of multiple system atrophy: a review. J Neurol Neurosurg Psychiatry 57: 129-133. [DOI] [PMC free article] [PubMed] [Google Scholar]
- Lee MK, Stirling W, Xu Y, Xu X, Qui D, Mandir AS, Dawson TM, Copeland NG, Jenkins NA, Price DL (2002) Human alpha-synuclein-harboring familial Parkinson's disease-linked Ala-53→Thr mutation causes neurodegenerative disease with alpha-synuclein aggregation in transgenic mice. Proc Natl Acad Sci USA 99: 8968-8973. [DOI] [PMC free article] [PubMed] [Google Scholar]
- Lucking CB, Brice A (2000) Alpha-synuclein and Parkinson's disease. Cell Mol Life Sci 57: 1894-1908. [DOI] [PMC free article] [PubMed] [Google Scholar]
- Manning-Bog AB, McCormack AL, Li J, Uversky VN, Fink AL, Di Monte DA (2002) The herbicide paraquat causes up-regulation and aggregation of alpha-synuclein in mice: paraquat and alpha-synuclein. J Biol Chem 277: 1641-1644. [DOI] [PubMed] [Google Scholar]
- Masliah E, Iwai A, Mallory M, Ueda K, Saitoh T (1996) Altered presynaptic protein NACP is associated with plaque formation and neurodegeneration in Alzheimer's disease. Am J Pathol 148: 201-210. [PMC free article] [PubMed] [Google Scholar]
- Masliah E, Rockenstein E, Veinbergs I, Mallory M, Hashimoto M, Takeda A, Sagara, Sisk A, Mucke L (2000) Dopaminergic loss and inclusion body formation in alpha-synuclein mice: implications for neurodegenerative disorders. Science 287: 1265-1269. [DOI] [PubMed] [Google Scholar]
- Masliah E, Sisk A, Mallory M, Games D (2001a) Neurofibrillary pathology in transgenic mice overexpressing V717F beta-amyloid precursor protein. J Neuropathol Exp Neurol 60: 357-368. [DOI] [PubMed] [Google Scholar]
- Masliah E, Rockenstein E, Veinbergs I, Sagara Y, Mallory M, Hashimoto M, Mucke L (2001b) Beta amyloid peptides enhance alpha-synuclein accumulation and neuronal deficits in a transgenic mouse model linking Alzheimer's and Parkinson's disease. Proc Natl Acad Sci USA 98: 12245-12250. [DOI] [PMC free article] [PubMed] [Google Scholar]
- Matsuura K, Kabuto H, Makino H, Ogawa N (1997) Pole test is a useful method for evaluating the mouse movement disorder caused by striatal dopamine depletion. J Neurosci Methods 73: 45-48. [DOI] [PubMed] [Google Scholar]
- Meco G, Gasparini M, Doricchi F (1996) Attentional functions in multiple system atrophy and Parkinson's disease. J Neurol Neurosurg Psychiatry 60: 393-398. [DOI] [PMC free article] [PubMed] [Google Scholar]
- Murphy D, Reuter S, Trojanowski J, Lee V-Y (2000) Synucleins are developmentally expressed, and α-synuclein regulates the size of the presynaptic vesicular pool in primary hippocampal neurons. J Neurosci 20: 3214-3220. [DOI] [PMC free article] [PubMed] [Google Scholar]
- Ogawa N, Hirose Y, Ohara S, Ono T, Watanabe Y (1985) A simple quantitative bradykinesia test in MPTP-treated mice. Res Commun Chem Pathol Pharmacol 50: 435-441. [PubMed] [Google Scholar]
- Ogawa N, Mizukawa K, Hirose Y, Kajita S, Ohara S, Watanabe Y (1987) MPTP-induced parkinsonian model in mice: biochemistry, pharmacology and behavior. Eur Neurol 1 [Suppl 26]: 16-23. [DOI] [PubMed] [Google Scholar]
- Papay R, Zuscik MJ, Ross SA, Yun J, McCune DF, Gonzalez-Cabrera P, Gaivin R, Drazba J, Perez DM (2002) Mice expressing the alpha(1B)-adrenergic receptor induces a synucleinopathy with excessive tyrosine nitration but decreased phosphorylation. J Neurochem 83: 623-634. [DOI] [PubMed] [Google Scholar]
- Polymeropoulos M, Lavedan C, Leroy E, Ide S, Dehejia A, Dutra A, Pike B, Root H, Rubenstein J, Boyer R, Stenroos E, Chandrasekharappa S, Atha-nassiadou A, Papapetropulos T, Johnson W, Lazzarini A, Duvoisin R, Di Iorio G, Golbe L, Nussbaum R (1997) Mutation in the alpha-synuclein gene identified in families with Parkinson's disease. Science 276: 2045-2047. [DOI] [PubMed] [Google Scholar]
- Probst-Cousin S, Rickert CH, Schmid KW, Gullotta F (1998) Cell death mechanisms in multiple system atrophy. J Neuropathol Exp Neurol 57: 814-821. [DOI] [PubMed] [Google Scholar]
- Richter-Landsberg C, Gorath M, Trojanowski J, Lee V (2000) Alpha-synuclein is developmentally expressed in cultured rat brain oligodendrocytes. J Neurosci Res 62: 9-14. [DOI] [PubMed] [Google Scholar]
- Robbins TW, James M, Lange KW, Owen AM, Quinn NP, Marsden CD (1992) Cognitive performance in multiple system atrophy. Brain 115: 271-291. [DOI] [PubMed] [Google Scholar]
- Rockenstein E, McConlogue L, Tan H, Power M, Masliah E, Mucke L (1995) Levels and alternative splicing of amyloid beta protein precursor (APP) transcripts in brains of APP transgenic mice and humans with Alzheimer's disease. J Biol Chem 270: 28257-28267. [DOI] [PubMed] [Google Scholar]
- Rockenstein E, Mallory M, Mante M, Sisk A, Masliah E (2001) Early formation of mature amyloid-beta proteins deposits in a mutant APP transgenic model depends on levels of Ab1-42. J Neurosci Res 66: 573-582. [DOI] [PubMed] [Google Scholar]
- Rockenstein E, Mallory M, Hashimoto M, Song D, Shults CW, Lang I, Masliah E (2002) Differential neuropathological alterations in transgenic mice expressing alpha-synuclein from the platelet-derived growth factor and Thy-1 promoters. J Neurosci Res 68: 568-578. [DOI] [PubMed] [Google Scholar]
- Sedelis M, Schwarting RK, Huston JP (2001) Behavioral phenotyping of the MPTP mouse model of Parkinson's disease. Behav Brain Res 125: 109-125. [DOI] [PubMed] [Google Scholar]
- Shults C, Gilman S (2003) Multiple system atrophy. In: Genetics of movement disorders (Pulst S, ed), pp 213-229. San Diego: Academic.
- Singleton AB, Farrer M, Johnson J, Singleton A, Hague S, Kachergus J, Hulihan M, Peuralinna T, Dutra A, Nussbaum R, Lincoln S, Crawley A, Hanson M, Maraganore D, Adler C, Cookson MR, Muenter M, Baptista M, Miller D, Blancato J, et al. (2003) Alpha-synuclein locus triplication causes Parkinson's disease. Science 302: 841. [DOI] [PubMed] [Google Scholar]
- Song DD, Shults CW, Sisk A, Rockenstein E, Masliah E (2004) Enhanced substantia nigra mitochondrial pathology in human alpha-synuclein transgenic mice after treatment with MPTP. Exp Neurol 186: 158-172. [DOI] [PubMed] [Google Scholar]
- Speciale SG (2002) MPTP: insights into parkinsonian neurodegeneration. Neurotoxicol Teratol 24: 607-620. [DOI] [PubMed] [Google Scholar]
- Spillantini M, Schmidt M, Lee V-Y, Trojanowski J, Jakes R, Goedert M (1997) Alpha-synuclein in Lewy bodies. Nature 388: 839-840. [DOI] [PubMed] [Google Scholar]
- Spillantini M, Crowther R, Jakes R, Cairns N, Lantos P, Goedert M (1998) Filamentous alpha-synuclein inclusions link multiple system atrophy with Parkinson's disease and dementia with Lewy bodies. Neurosci Lett 251: 205-208. [DOI] [PubMed] [Google Scholar]
- Stefanova N, Klimaschewski L, Poewe W, Wenning GK, Reindl M (2001) Glial cell death induced by overexpression of alpha-synuclein. J Neurosci Res 65: 432-438. [DOI] [PubMed] [Google Scholar]
- Stefanova N, Reindl M, Neumann M, Haass C, Poewe W, Kahle PJ, Wenning GK (2005) Oxidative stress in transgenic mice with oligodendroglial alpha-synuclein overexpression replicates the characteristic neuropathology of multiple system atrophy. Am J Pathol 166: 869-876. [DOI] [PMC free article] [PubMed] [Google Scholar]
- Takeda A, Mallory M, Sundsmo M, Honer W, Hansen L, Masliah E (1998) Abnormal accumulation of NACP/alpha-synuclein in neurodegenerative disorders. Am J Pathol 152: 367-372. [PMC free article] [PubMed] [Google Scholar]
- Takenouchi T, Hashimoto M, Hsu L, Mackowski B, Rockenstein E, Mallory M, Masliah E (2001) Reduced neuritic outgrowth and cell adhesion in neuronal cells transfected with human alpha-synuclein. Mol Cell Neurosci 17: 141-150. [DOI] [PubMed] [Google Scholar]
- Toggas S, Masliah E, Rockenstein E, Mucke L (1994) Central nervous system damage produced by expression of the HIV-1 coat protein gp120 in transgenic mice. Nature 367: 188-193. [DOI] [PubMed] [Google Scholar]
- Trojanowski J, Goedert M, Iwatsubo T, Lee V (1998) Fatal attractions: abnormal protein aggregation and neuron death in Parkinson's disease and Lewy body dementia. Cell Death Differ 5: 832-837. [DOI] [PubMed] [Google Scholar]
- Tsuboi K, Grzesiak J, Bouvet M, Hashimoto M, Masliah E, Shults CW (2004) α-Synuclein overexpression resulted in impaired adhesion to fibronectin. Soc Neurosci Abstr 30: 559.6. [DOI] [PubMed] [Google Scholar]
- Tsuboi K, Grzesiak JJ, Bouvet M, Hashimoto M, Masliah E, Shults CW (2005) Alpha-synuclein overexpression in oligodendrocytic cells results in impaired adhesion to fibronectin and cell death. Mol Cell Neurosci 29: 259-268. [DOI] [PubMed] [Google Scholar]
- Tsuchiya K, Ozawa E, Haga C, Watabiki S, Ikeda M, Sano M, Ooe K, Taki K, Ikeda K (2000) Constant involvement of the Betz cells and pyramidal tract in multiple system atrophy: a clinicopathological study of seven autopsy cases. Acta Neuropathol (Berl) 99: 628-636. [DOI] [PubMed] [Google Scholar]
- Ueda K, Fukushima H, Masliah E, Xia Y, Iwai A, Otero D, Kondo J, Ihara Y, Saitoh T (1993) Molecular cloning of cDNA encoding an unrecognized component of amyloid in Alzheimer's disease. Proc Natl Acad Sci USA 90: 11282-11286. [DOI] [PMC free article] [PubMed] [Google Scholar]
- van der Putten H, Wiederhold KH, Probst A, Barbieri S, Mistl C, Danner S, Kauffmann S, Hofele K, Spooren WP, Ruegg MA, Lin S, Caroni P, Sommer B, Tolnay M, Bilbe G (2000) Neuropathology in mice expressing human α-synuclein. J Neurosci 20: 6021-6029. [DOI] [PMC free article] [PubMed] [Google Scholar]
- Wakabayashi K, Matsumoto K, Takayama K, Yoshimoto M, Takahashi H (1997) NACP, a presynaptic protein, immunoreactivity in Lewy bodies in Parkinson's disease. Neurosci Lett 239: 45-48. [DOI] [PubMed] [Google Scholar]
- Wakabayashi K, Yoshimoto M, Tsuji S, Takahashi H (1998a) Alpha-synuclein immunoreactivity in glial cytoplasmic inclusions in multiple system atrophy. Neurosci Lett 249: 180-182. [DOI] [PubMed] [Google Scholar]
- Wakabayashi K, Hayashi S, Kakita A, Yamada M, Toyoshima Y, Yoshimoto M, Takahashi H (1998b) Accumulation of a-synuclein/NACP is a cytopathological feature common to Lewy body disease and multiple system atrophy. Acta Neuropathol 96: 445-452. [DOI] [PubMed] [Google Scholar]
- Wakabayashi K, Mori F, Nishie M, Oyama Y, Kurihara A, Yoshimoto M, Kuroda N (2005) An autopsy case of early (“minimal change”) olivopontocerebellar atrophy (multiple system atrophy-cerebellar). Acta Neuropathol (Berl) 110: 185-190. [DOI] [PubMed] [Google Scholar]
- Wenning GK, Jellinger KA (2005) The role of alpha-synuclein in the pathogenesis of multiple system atrophy. Acta Neuropathol (Berl) 109: 129-140. [DOI] [PubMed] [Google Scholar]
- Yazawa I, Giasson B, Sasaki R, Zhang B, Joyce S, Uryu K, Trojanowsk JQ, Lee V-M (2004) Neurodegeneration in a transgenic mouse model of multiple system atrophy over-expressing α-synuclein in oligodendrocytes. Soc Neurosci Abstr 30: 561.2. [Google Scholar]
- Yazawa I, Giasson BI, Sasaki R, Zhang B, Joyce S, Uryu K, Trojanowski JQ, Lee VM (2005) Mouse model of multiple system atrophy alpha-synuclein expression in oligodendrocytes causes glial and neuronal degeneration. Neuron 45: 847-859. [DOI] [PubMed] [Google Scholar]
- Zarranz JJ, Alegre J, Gomez-Esteban JC, Lezcano E, Ros R, Ampuero I, Vidal L, Hoenicka J, Rodriguez O, Atares B, Llorens V, Gomez Tortosa E, del Ser T, Munoz DG, de Yebenes JG (2004) The new mutation, E46K, of alpha-synuclein causes Parkinson and Lewy body dementia. Ann Neurol 55: 164-173. [DOI] [PubMed] [Google Scholar]