

Abstract
Sensory encoding in spiking neurons depends on both the integration of sensory inputs and the intrinsic dynamics and variability of spike generation. We show that the stimulus selectivity, reliability, and timing precision of primate retinal ganglion cell (RGC) light responses can be reproduced accurately with a simple model consisting of a leaky integrate-and-fire spike generator driven by a linearly filtered stimulus, a postspike current, and a Gaussian noise current. We fit model parameters for individual RGCs by maximizing the likelihood of observed spike responses to a stochastic visual stimulus. Although compact, the fitted model predicts the detailed time structure of responses to novel stimuli, accurately capturing the interaction between the spiking history and sensory stimulus selectivity. The model also accounts for the variability in responses to repeated stimuli, even when fit to data from a single (nonrepeating) stimulus sequence. Finally, the model can be used to derive an explicit, maximum-likelihood decoding rule for neural spike trains, thus providing a tool for assessing the limitations that spiking variability imposes on sensory performance.
Keywords: retinal ganglion cell, spike trains, computational model, neural coding, spike timing, precision, decoding, variability, integrate and fire
Introduction
Sensory experience depends on the encoding of external events in the spiking activity of neurons. Understanding this encoding process and its effects on sensory experience requires quantitative models that can capture the relationship between stimuli and neural spike responses. To provide clear insight into neural function, such a model should be simple, approximating or leaving out many biophysical details. However, to be useful, the model must accurately describe the mapping from stimuli to spikes. Specifically, the elements of the model should capture the spatiotemporal integration of sensory inputs and should provide insight into the statistical features governing the fidelity of neural signals. Finally, the model should be “invertible,” providing an optimal rule for decoding the information contained in spike trains.
The most common approach to describing neural stimulus selectivity is the “receptive field,” which captures the stimulus features that best drive spiking responses (Kuffler, 1953; Hubel and Wiesel, 1968). The receptive field is often interpreted as a quasilinear model that maps stimuli to firing rates, with an implicit assumption that spikes are then generated from a Poisson process. However, recent studies have shown that this model fails to account for key statistical features of neural spike responses (Troy and Lee, 1994; Berry et al., 1997; Reich et al., 1997; Fellous et al., 2004). In particular, neurons in the early visual pathway are capable of spiking with high temporal precision, which can be important for conveying visual information (Mainen and Sejnowski, 1995; Berry et al., 1997; Liu et al., 2001). It is therefore important to develop models that can account for both the stimulus selectivity and the statistical features of neural spike trains.
Integrate-and-fire (IF) models provide a well known and more realistic alternative to Poisson models of spike generation. Recent studies have suggested that IF models are capable of exhibiting some of the important statistical behaviors of real neurons (Troyer and Miller, 1997; Reich et al., 1998; Shadlen and Newsome, 1998; Keat et al., 2001; Jolivet et al., 2003). However, spike dynamics can cause significant distortions in the receptive field properties estimated using standard methods such as reverse correlation (Aguera y Arcas and Fairhall, 2003; Pillow and Simoncelli, 2003) and, thus, the estimation of such models is an important open problem.
In this paper, we show that a generalized IF model provides a detailed functional description of the light responses of retinal ganglion cells (RGCs) in the macaque monkey. We use a recently developed technique (Paninski et al., 2004; Pillow et al., 2004a) to fit the model to spike responses elicited by a white noise stimulus. The fitting procedure simultaneously estimates parameters that govern stimulus selectivity, history dependence, and stochasticity (noisiness). We show that the fitted model accurately predicts spike responses to novel stimuli, accounting for both the stimulus dependence and detailed statistical structure of spike trains. Surprisingly, the model also predicts the variability and precision of responses to repeated stimuli, even when fit with a single (nonrepeating) stimulus. The model also supports a simple explanation for the origins of spike timing precision, in terms of voltage slope at threshold.
Finally, the model provides a novel tool for assessing the information content of RGC spike responses. The computed probability of spike responses can be used to derive an optimal (maximum-likelihood) decoding rule for extracting stimulus information from spike trains. Our results demonstrate that this method is capable of extracting information from spike trains more faithfully than a generic linear-nonlinear encoding model.
Parts of this paper have been published previously (Pillow et al., 2004b).
Materials and Methods
Experimental measurements and stimuli. The data presented in this paper are a subset of the data of Uzzell and Chichilnisky (2004); experimental methods are described in detail there. Briefly, multielectrode extracellular recordings were obtained in vitro from small pieces of retina from four macaque monkeys, with retinal pigment epithelium attached, maintained at 32-36°C, pH 7.4. Analysis was restricted to two physiologically defined classes of cells that very likely correspond to ON and OFF parasol cells based on several lines of evidence (Chichilnisky and Kalmar, 2002).
The retina was stimulated with a photopic, achromatic, spatially uniform, optically reduced image of a cathode ray tube display refreshing at 120 Hz. The stimulus was a temporal sequence consisting of two intensity values pseudorandomly selected on every refresh. In the first three experiments (24 cells), the contrast (SD/mean) of this stimulus was 96%, and model validation was performed on a novel stimulus sequence (7-30 s) repeated 37-176 times. In the fourth experiment (nine cells), binary white noise stimuli of 12 and 48% contrast were used for fitting the model parameters. Validation was then performed using responses to brief (25 ms) positive and negative flashes with contrasts of 12, 24, 48, and 96% (flash amplitude divided by background luminance).
Generalized IF model. We fit neural responses using a generalized integrate-and-fire (IF) model. This model, which is closely related to the “spike response model” (Gerstner, 2001; Jolivet et al., 2003), consists a standard leaky integrate-and-fire compartment driven by three time-varying input currents: (1) a stimulus-dependent current, Istim; (2) a spike history-dependent current, Isp; and (3) a noise current, Inse. A schematic diagram of the model is shown in Figure 1a.
Figure 1.

Schematic diagrams of the generalized IF model (left) and the standard LNP model (right).
The model dynamics are specified by a differential equation governing voltage of the integrator:
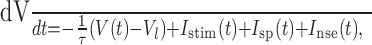 |
(1) |
and whenever V(t) = 1, a spike occurs, and V(t) is reset instantaneously to zero. The input current Istim is the linear convolution of the stimulus with input filter  , which represents the spatiotemporal receptive field of the neuron. We can therefore write the stimulus-dependent current as follows:
 |
(2) |
where  is a vector consisting of the (discretized) space-time stimulus vector just preceding time t. For a full-field stimulus (as considered here),
  is an n vector of the monitor intensities for the n frames preceding time t, and
  is simply the temporal receptive field of the neuron.
The spike history-dependent current Isp results from the injection of a fixed current waveform  following each spike and accounts for spike history effects such as refractoriness, burstiness and adaptation (Paninski et al., 2004). Mathematically, this is equivalent to considering
  as a linear filter that is convolved with the recent spike train history:
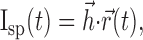 |
(3) |
where  is a vector of (discretized) spiking activity preceding time t, matched to the size of
  .
.
Finally, the noise current Inse consists of Gaussian white noise with SD σ and represents the net contribution of all noise sources to the membrane potential:
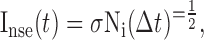 |
(4) |
where Δt is the time step of the simulation, and Ni is a standard Gaussian random variable. The last two parameters of the model are τ, the membrane time constant, and Vl, the reversal potential of the leak current.
IF model fitting. The generalized IF model is specified by the parameters { ,
,  , σ, τ, Vl}, where
  and
and  are both multidimensional vectors. Characterizing the response of a neuron requires the estimation of these parameters from a sequence of stimuli and the (extracellularly recorded) times of elicited spikes. In previous work (Paninski et al., 2004; Pillow et al., 2004a), we developed an efficient and computationally tractable algorithm for computing the IF model likelihood function, P(spikes|stim, {
 ,
,  , σ, τ, Vl}), which is the probability of observing a set of spike times given a set of stimuli and a fixed setting of the model parameters. The likelihood function, described in detail by Paninski et al. (2004), can be computed by numerically solving the Fokker-Plank equation for subthreshold voltage probability during each interspike interval. This amounts to finding the probability (under the Gaussian noise model) that voltage crossed the threshold at precisely the observed spike times.
We fit model parameters { ,
,  , σ, τ, Vl} by maximizing the likelihood of the observed responses. This involved searching for the model parameters (in the high-dimensional parameter space) that maximized the probability of the observed spike times for the given stimulus. In performing this search, we relied on a result from Paninski et al. (2004): that the likelihood function for the IF model is log-concave, meaning that the likelihood is mathematically guaranteed to be free from local maxima, for any stimulus and spike train data. This result ensures that gradient ascent of the likelihood function will converge to its global maximum and guarantees that the IF model (unlike more complicated nonlinear models such as Hodgkin-Huxley) can be fit reliably and tractably using simple gradient ascent techniques. We performed parameter optimization for the IF model using 50 s of data: a nonrepeating binary white noise stimulus and the associated spike times for each neuron. The stimulus selectivity (receptive field) parameter
  and spike history parameters
  were taken to be 15 and 10 dimensional vectors, respectively. These were fit in a vector space spanned by a basis of raised cosines with log scaling of the time axis. Basis vectors were given by the following:
 |
(5) |
for t such that log(t + ψ) ∈ [φi - π, φi + π] and 0 elsewhere (so each basis vector looks like a single raised “bump”). The bump positions φi were selected so that the basis vectors “tile,” or sum to 1, allowing for phase-invariant (on a log-time axis) representation of  and
and  . The resulting basis [similar to that used by Keat et al. (2001)] has the ability to represent fine temporal structure near the time of a spike but is constrained to be smooth at longer time scales. This allows
  and
and  to be represented with relatively few parameters.
The basis for  had a temporal extent of 40 stimulus frames (333 ms), meaning that
  effectively operates on a 40-dimensional stimulus space. The 15-dimensional space used for fitting
  (i.e., the space spanned by the basis vectors {Bi}) allowed for faster fitting of
  but did not qualitatively affect the results; sample comparisons with
  fit in the full 40-dimensional space achieved similar performance. The basis was also observed to accurately represent the spike-triggered average. The basis for
  had a temporal extent of 200 ms, although (as shown in Fig. 2a,b) the actual fits of
  were essentially zero outside the first 25-40 ms after a spike).
Figure 2.

Parameters obtained from fits to RGC data for the IF model (a-c) and the LNP model (d, e). a, Filters  and spike-response currents
  obtained for five ON cells in one retina. b, Corresponding filters for four OFF cells. c, Histograms of model scalar parameters and for all 24 cells in three retinas. d, Comparison of linear filters for the IF model (gray) and LNP model (black) for one ON cell (top) and one OFF cell (bottom). e, Measured LNP point nonlinearities for converting filter output to instantaneous spike rate.
Finally, a robust version of maximum likelihood was used to obtain parameter estimates that were less sensitive to statistical outliers. The lowest-likelihood 5% of the interspike intervals were treated as statistical outliers and were ignored when optimizing the parameters. Empirically, this resulted in reduced estimates of the noise parameter σ, in keeping with the intuition that the model compensates for exceedingly low-probability spikes by artificially increasing the noise parameter (see Discussion). The robust estimate of σ provided an improved match to the first-spike time precision of spike trains.
Linear-nonlinear-Poisson model. To provide a baseline for comparison with the IF model performance, we also fit data with the simplest and most widely used model of visual responses: a linear-nonlinear-Poisson (LNP) model, which is illustrated schematically in Figure 1b. This model consists of a single linear filter (i.e., a linear receptive field), followed by an instantaneous nonlinear function, which accounts for response nonlinearities such as rectification and saturation, followed by Poisson spike generation. This model is widely used because of its computational simplicity and the ease with which its parameters can be estimated (Chichilnisky, 2001). LNP is the implicit model underlying most reverse correlation style methods for estimating receptive fields.
The LNP model is specified by the parameters  and
and  , where
  denotes the linear stimulus filter (as in the IF model), and
  is a parametric description of the nonlinear function converting filter output to instantaneous spike rate. In this case,
  was taken to be a 15-dimensional vector (as used above for the IF model), and
  was taken to be a linear spline with 15 knots (hence 15 fitted parameters). We initialized our estimate of these parameters using reverse correlation to compute the spike-triggered average, as described by Chichilnisky (2001). However, reverse correlation can provide biased estimates of
  if the stimulus distribution is nonspherical (Simoncelli et al., 2004), as it is here (i.e., binary). We therefore performed gradient ascent of the LNP model likelihood function to find the maximum likelihood estimate of
  and
and  . Although not necessarily guaranteed to converge to the global maximum, this procedure can correct biases in the estimates of the
  and
and  arising from the use of nonspherical stimuli and performs quite well in simulations.
A robust fitting procedure similar to that used for the IF model (i.e., ignoring the likelihood of the lowest 5% of interspike intervals) was used to put likelihood comparisons with the IF model on equal footing. Nearly identical performance was obtained when the LNP model was fit using reverse correlation (i.e., without additional ascent of the likelihood function) and the result was robust to the number of parameters used in the representation of the nonlinearity  over a wide range (8-25).
Quantifying model performance. To compare IF and LNP model performance at predicting responses to novel stimuli, we calculated the percentage error in the peristimulus time history (PSTH) and peristimulus time variance (PSTV) predicted for responses to repeated stimuli, as well as a single-trial measure of distance between spike trains. Figure 5b shows the percentage of the variance in the PSTH accounted for by each model:
 |
(6) |
Figure 5.

Performance comparison across cells. Open and filled circles represent ON and OFF cells, respectively. a, Likelihood per spike of novel RGC responses under the fitted IF model and LNP model. The value plotted is the geometric mean of the likelihood of over all spikes under each model. Gray dashed lines represent a factor of 2 above and below identity. Data from 24 cells (3 retinas) are shown. b, Percentage variance (var) in the PSTH accounted for by both models for each cell. Points above the diagonal represent superior performance by the IF model. c, Percentage error (err) in the peristimulus time variance for the IF and LNP models across cells. d, Average pair-wise distance between spike trains as a function of time scale of analysis (see Results). Black trace, Median distance between responses of an ON RGC to repeated presentations of the same stimulus; dashed trace, median distance between IF model response and data; gray trace, median distance between LNP model response and data. e, Same as d for an OFF RGC. f, Fractional increase in spike-time distance for the IF and LNP models averaged over all cells. Dashed curve, Ratio of IF model distance to the average pair-wise distance between RGC responses, normalized by the number of spikes from each cell and averaged across cells; gray curve, same for LNP model.
where 〈· 〉 indicates an average over time. PSTHs were computed by binning each response, summing, and filtering with a Gaussian with an SD of 1 ms. Figure 5c shows the percentage error in the PSTV for each model, which is given by the following:
 |
(7) |
PSTV was computed by sliding a 10 ms window across the response raster and calculating the variance (across trials) of the number of spikes in that window.
Figure 5d-f examines the similarity between pairs of spike trains to repeated presentations of a single stimulus, using a specific spike train distance measure (Victor and Purpura, 1997). The measure relies on a time scale parameter λ and is defined as the minimum cost for bringing one spike train into alignment with another by shifting and adding or deleting spikes, in which adding or deleting has a cost of 1, and shifting a spike by t ms entails a cost of t/λ. For any two spike trains, this distance measure is bounded above by the sum of the number spikes in both spike trains (λ = 0) and bounded below by their spike count difference (λ = ∞). Software for computing the spike time distance measure was obtained from Victor and Purpura (1997).
Calculation of likelihoods for the discrimination task. We examined the decoding performance of the two models by using them to perform discrimination in a simple ideal observer task. We suppose that an observer is given spike trains {sA, sB} in response to presentation of stimulus sequences {A, B} and must decide which of the two stimuli is associated with which spike train. The optimal decision rule comes from comparing the likelihood of each stimulus under each observed spike train (Green and Swets, 1966):
 |
(8) |
If R(A, B) is greater than unity, the correct choice is made; otherwise, the stimuli are paired with the wrong spike trains. The conditional probabilities in this expression may be determined directly from any stochastic model of neural response, such as the IF and LNP models.
Results
Figure 1a illustrates the components of the generalized IF model, which consists of a leaky integrate-and-fire model driven by a stimulus-dependent current, a spike history-dependent current, and a Gaussian noise current. The stimulus-dependent current arises from the linear receptive field of the neuron, whereas the spike history current arises from the injection of a “postspike current”  after every spike (for details, see Materials and Methods). Note that
  can assume an arbitrary shape, which allows the model to generate a diverse array of behaviors observed in real neurons, including refractoriness, spike rate adaptation, spike rate facilitation, bursting, and bistability (Jolivet et al., 2004; Paninski et al., 2004). This flexibility endows the model with the ability to mimic a wider array of biologically realistic dynamical behaviors than the classic integrate-and-fire model or Poisson spiking models.
We fit the model using responses of parasol (magnocellular-projecting) RGCs to a spatially uniform, achromatic binary temporal white noise sequences (random flicker; see Materials and Methods). For these stimuli,  represents the temporal receptive field, although in general
  can represent the spatiotemporal-chromatic receptive field of the neuron. The IF model parameters were fit to spike responses from a single (nonrepeating) stimulus train. Subsequently, RGC responses to multiple repeats of a novel stimulus were recorded, and predictions generated by the IF model were assessed using several quantitative measures.
Figure 2a-c shows model parameters fit to data from a collection of ON and OFF RGCs recorded simultaneously. Note that the filters,  , are consistent in waveform and time scale within each cell type. The same is true of the spike current waveforms,
  , which operate on a faster timescale. The biphasic shape of the
  currents allows the model to reproduce burstiness in RGC responses; the initial positive component drives voltage up close to threshold after voltage reset, and the later negative component (possibly accumulated over several spikes) exerts a hyperpolarizing effect to end a burst. The larger amplitude
  in ON cells matches the burstier responses observed in ON compared with OFF cells (Figs. 3, 4). Figure 2c also shows histograms of the three scalar parameters {σ, τ, Vl} for all cells.
Figure 3.

Responses of an ON cell to a repeated stimulus. a, Recorded responses to repeated stimulus (top), simulated LNP model (middle), and IF model (bottom) spike trains. Each row corresponds to the response during a single stimulus repeat; 167 repeats are shown. b, PSTH, or mean spike rate, for the RGC, LNP model, and IF model. For this cell, the IF model accounts for 91% of the variance of the PSTH, where as the LNP model accounts for 75%. c, Spike count variance computed in a sliding 10 ms window. d, Magnified sections of rasters, with rows sorted in order of first spike time within the window. The four sections shown are indicated by blue brackets in a.
Figure 4.

Responses of an OFF cell to a repeated stimulus. Details are identical to those of Figure 3.
To provide a baseline for comparison, the same data were fit using the simplest and most widely used model of visual responses: an LNP model, shown schematically in Figure 1. The model consists of a cascade of linear and nonlinear stages, followed by Poisson spike generation (for details, see Materials and Methods). Although Poisson processes cannot exhibit refractoriness, bursting, or other known statistical features of spike trains, the LNP model is widely used because of its computational simplicity and the ease with which its parameters can be estimated using reverse correlation (Chichilnisky, 2001).
Figure 2d shows linear filters obtained for both the LNP model and the IF model for one ON cell and one OFF cell. Note that the linear filter recovered for the LNP model (i.e., the spike-triggered average) is noticeably different from that obtained for the IF model (Fig. 2d). Given that the IF model incorporates more realistic spike generation and provides more accurate predictions of real spike trains (see below), this suggests that the LNP model provides an inaccurate description of how neurons integrate visual inputs over time (Berry and Meister, 1998; Aguera y Arcas and Fairhall, 2003; Pillow and Simoncelli, 2003). Also, note that the nonlinear function of the LNP model (Fig. 2e) has no direct counterpart in the IF model, whose firing rate is determined implicitly by the dynamics of the leaky integrator and spike thresholding.
Predicting responses to novel stimuli
Once both models were fit using a set of training data (a 50 s white noise stimulus sequence), we sought to compare their performance at predicting responses to novel stimuli. For a first comparison, we examined RGC responses to repeated presentations of a binary white noise stimulus. This allowed us to assess model accuracy in predicting not only the average response but response variability over repeated trials.
Note that this type of analysis, commonly known as “cross-validation,” provides a much more stringent test of the capabilities of a model than a simple goodness-of-fit evaluation. Rather than examining how well the model fits the training data, we evaluate its ability to generalize and predict responses to novel, randomly generated patterns that were not presented during training. An important implication of this procedure is that we can ignore the fact that the models differ slightly in their number of parameters; fitting a model with too many parameters leads necessarily to a decrease in generalization performance (a problem known as “overfitting”). For example, using too many parameters to represent the postspike current  in the IF model (or the nonlinearity
  in the LNP model) yields an irregular (non-smooth) function that overfits detailed random fluctuations in the training data and therefore performs poorly at predicting novel responses.
Figures 3 and 4 show recorded responses and predictions of the IF model and the LNP model for an ON and an OFF cell, respectively. Rasters of RGC responses and corresponding simulated responses from both models illustrate that the IF model (bottom rows) captures the structure of the RGC spike trains (top rows) more faithfully than the LNP model (middle rows).
The PSTH (Figs. 3b, 4b) summarizes the time-varying firing rate exhibited by the data and both models. The IF model (black trace) matches the sharp peaks in the PSTH more accurately than the LNP model (red trace). Trial-to-trial variability of the responses is reflected by the PSTV (Figs. 3c,4c), computed by sliding a 10 ms window along the response raster and computing the variance across trials of the number of spikes in that window. Because RGC spike trains have history dependence, which makes them much less variable than a Poisson process (Uzzell and Chichilnisky, 2004), it is unsurprising that the LNP model fails to match the PSTV of the data. The IF model provides a more accurate prediction. Although integrate-and-fire models have been shown previously to be capable of reproducing realistic spike count statistics in simulation (Reich et al., 1998), it is notable that the generalized IF model does so despite the fact that the objective function (likelihood of the spike train) does not include a measure of variability and does not require (or use) repeated stimuli.
A more detailed view of spike train structure and model performance was obtained by sorting the rows of a response raster in order of the first spike time in a given window (Figs. 3d,4d). Sorting reveals considerable structure in RGC interspike intervals, which is mostly captured in the sorted responses of the IF model (bottom) but is completely absent in the sorted responses of the LNP model (middle).
Summary statistics of IF model performance and comparison with the LNP model are shown in Figure 5 for all RGCs examined. Figure 5a shows a comparison of the likelihood of responses to novel stimuli for the IF and LNP models obtained by using the fitted parameters for each model to compute the probability of the observed responses. Using this metric, the IF model provided a significantly higher likelihood per spike for all cells, in many cases nearly twofold. Figure 5, b and c, shows comparisons of the similarity of PSTH and PSTV obtained from RGC spike trains and model simulations. In both cases, the IF model outperforms the LNP model for all cells.
To compare the accuracy of model predictions with the intrinsic variability in RGC spike trains, we also applied a previously used summary measure of distances between spike trains (Victor and Purpura, 1997). This distance is the minimum cost of transforming one spike train into another using the elementary operations of adding, deleting, and shifting spikes. A time scale parameter expresses the cost of shifting per unit time relative to that of adding or deleting. Although this is an imperfect measure of model performance because it neglects any effect of stimulus or spike train history on the probabilistic cost of shifting spikes (e.g., it would not penalize a model for ignoring the refractory period), it is easy to compute and provides a direct benchmark for comparing the performance of present and future models.
Figure 5d-f, solid curves, shows the average distance between pairs of RGC responses to repeated presentations of the same stimulus. This provides a measure of intrinsic variability in spike trains. The distance falls monotonically as a function of time scale of analysis (Fig. 5d,e). Dashed and gray curves indicate distances between simulated IF and LNP model spike trains and recorded RGC spike trains. This provides a measure of the discrepancy between model predictions and data. The IF model distances were systematically higher than the intrinsic variability, indicating that IF model responses differ noticeably from RGC spike trains. However, across a wide range of time scales (1-100 ms) and in all cells, IF model distances were smaller than LNP model distances. Figure 5f shows a summary of the IF and LNP model distances expressed as a fraction of the intrinsic variability averaged over all cells. IF model error exceeds intrinsic variability by up to ∼20%; LNP model error is approximately threefold higher for most time scales.
We also sought to examine IF model performance at predicting responses to stimuli not drawn from the class of fixed-contrast white noise stimuli. Figure 6 shows repeated responses of an ON and an OFF retinal ganglion cell to brief flashes of differing contrast. In this case, the IF model parameters were fit using 1 min of response to binary white noise stimuli of two different contrasts (12 and 48%). Despite the fact that the flash stimuli are nonstationary and span a wide range of contrasts (12-96%, positive and negative), the rasters of the simulated IF model resemble those of the ON and OFF RGCs and provide an accurate prediction of both mean and variance of the RGC responses. Across nine cells (five OFF and four ON), the IF model accounts for between 73 and 96% (mean, 84%) of the variance in the PSTH of RGC responses. This compares with a range of 36-81% (mean, 68%) for the predictions of the LNP model (data not shown).
Figure 6.

IF model prediction of responses to brief flashes. a, b, ON cell responses and IF model predictions. c, d, OFF cell responses and IF model predictions. The flash stimuli (shown above each raster) consisted of a gray screen followed by a brief (25 ms) flash. Flash contrasts were +12, +24, +48, and +96% (pos. flashes; a, c) and -12, -24, -48, and -96% (neg. flashes; b, d). Below each stimulus is a raster showing 25 responses of the RGC (black), below which is a raster showing 25 simulated responses of the IF model (red). Below each pair of rasters is a plot of the PSTH of the RGC and IF model on the same axes. For these two cells, the IF model accounted for 76 and 90% of the PSTH variance for the ON and OFF cells, respectively.
Spike timing precision
The accurate descriptions of RGC spike trains provided by the IF model present an opportunity to examine the origins of spike timing precision, which has been widely discussed in recent studies. RGCs are capable of firing spikes precisely time-locked to the onset of a stimulus (Berry and Meister, 1998; Reich et al., 1998; Keat et al., 2001; van Rossum et al., 2003; Uzzell and Chichilnisky, 2004). In some cases, the variation in the onset time of spiking across repeated stimulus presentations is as low as ∼1 ms. Although precise timing during periods of rapid firing may be explained by action potential refractoriness (Berry and Meister, 1998; Liu et al., 2001; Uzzell and Chichilnisky, 2004), the origin and significance of the precision in firing remain difficult to assess, particularly in the case of extracellularly recorded spike data.
A simple hypothesis about the origin of such precision (Bryant and Segundo, 1976) is that it is determined by the slope of the membrane voltage as it crosses the threshold. If voltage crosses the threshold with a steep slope, then the noise current exerts little influence on the time of the spike; if voltage crosses the threshold with a shallow slope, noise has a greater influence. Figure 7 illustrates this intuition graphically with an example from an RGC response raster. The raster shows two adjacent periods of rapid firing. The histograms below show the distributions of the time of the first spike in each period of firing and indicate that the first period of firing exhibited more precise timing. The trace below shows the (noiseless) voltage response of the IF model obtained using the stimulus and the parameters fit for this cell. The slope of V at the threshold crossing is indicated by thick gray lines. The period of firing that begins with a steeper voltage slope exhibits much more precise timing. Qualitatively, this example supports the simple hypothesis.
Figure 7.

Precision of firing onset times. a, Two hundred millisecond portion of stimulus and a response raster showing two periods of firing onset. Below are histograms of the time of the first spike in each event. SDs, 1.3 ms (left); 4.7 ms (right). b, Simulated voltage response from the fitted IF model with noise set to zero. Tangent at time of firing onset is shown in gray. c, Precision of first spike times (inverse of SD) as a function of the mean current at the time of the first spike over 70 isolated firing onsets. Correlation coefficient, 0.89. d, Correlation coefficient (corr coeff) between precision and IF model current prediction as a function of the inverse of the average SD of the first spike time. Open circles denote ON cells, and filled circles denote OFF cells.
Although this idea about the origin of spike timing precision has been explored in both intracellular experiments and detailed modeling studies (Mainen and Sejnowski, 1995; Reich et al., 1997; Banerjee, 2001; Gutkin and Rudolph, 2003; van Rossum et al., 2003), it has not to our knowledge been connected with recent extracellular measurements and information-theoretic analyses focusing on the phenomenology and coding significance of precision (Berry et al., 1997; Berry and Meister, 1998; Koch et al., 2004; Uzzell and Chichilnisky, 2004). The IF model, which makes a prediction about the underlying voltage path for any extracellularly recorded spike train, allows us to examine this connection quantitatively. We performed an analysis of the firing precision obtained for each cell in all identified firing onsets during a 7-30 s response raster. Firing onsets were defined as periods after a silence of at least 8 ms long across all trials, followed by a spike on at least 80% of trials within a window of 40 ms (Uzzell and Chichilnisky, 2004). The SD of the first spike time during each onset was computed and compared with the average current produced by the IF model at those times. Figure 7c shows a scatterplot of precision (inverse of SD) as a function of model input current (which is proportional to the slope dV/dt crossing threshold) across 70 such firing onsets for the cell shown in Figure 7a. The model accounted for 89% of the variability in precision for this cell.
Figure 7d shows a similar analysis across all cells in the data set, plotting correlation coefficients between the predicted voltage slope and first-spike precision for all cells tested. A significant fraction of the variability in precision was clearly explained by the voltage slope at firing onset. Note that the IF model captures more of the variability in precision for ON cells (open circles) than for OFF cells (filled circles). However, for both ON and OFF cells, spike timing precision is not an intrinsic property of the cell; it varies substantially as a function of the stimulus history and in a manner predicted by elicited currents and the intrinsic noise in the IF model.
The measure described above provides a useful means of quantifying precision but is limited by its reliance on a somewhat arbitrary criterion for identifying firing onsets, assumes a univariate measure of precision (SD), and ignores all spikes beyond the first. One indication that this approach is incomplete is that subsequent spikes sometimes exhibit more precise timing than the first spike. Figure 8a shows a period of firing in which the second spike is more precise than the first, a behavior seen in more than one-third of the firing onsets recorded from this cell. Figure 8b shows a more unusual example in which the last spike is more precise than the first. Thus, restricting the analysis to the first spike fails to capture important aspects of spike train precision. Furthermore, measures of spike precision are bound up inextricably with the notion of spiking reliability. Attempts to separate precision (jitter in spike time) from reliability (probability of spike occurrence in a particular interval) require the use of ad hoc criteria for defining firing events: the length of silence preceding an event and the fraction of repeats containing a spike necessary to constitute an event. Changes in these criteria will result in the identification of different numbers of firing onsets.
Figure 8.

Generalized analysis of timing precision. a, RGC response raster sorted in order of first spike time. Below is a histogram of first spike (gray) and second spike (black) in the event, illustrating higher precision in the time of the second spike than the first. b, Sorted RGC response raster, with histograms below showing the distribution of the first (gray) and last (black) spikes in this event. Precision of the last spike is higher than the first. c-e, Use of the IF model formalism to analyze RGC spike timing precision and reliability. c, One hundred seventy millisecond stimulus fragment and corresponding RGC spike response during one trial. d, Probability distribution over subthreshold voltage for a central interspike interval on a single trial. The likelihood of the next spike time (below) is given by the probability mass crossing the threshold at each moment in time. Note that the probability distribution of the next spike time is bimodal. e, Raster of repeated RGC responses to this stimulus fragment, with rows sorted in order of first spike time. Below is the probability density of the next spike, averaged across 25 trials. Black trace, Model prediction; gray bars, actual distribution.
Given these difficulties, it is natural to ask whether the IF model can provide a more complete explanation for the precision and reliability of all recorded spikes. Such an account emerges naturally from the likelihood function used in fitting the IF model. The machinery for computing the likelihood of spike trains can be used to compute the probability density for a particular spike time, conditional on the stimulus and spike train history, as shown in Figure 8, c and d. Using the linear kernel  and after-current waveform
  , we can compute the predicted intracellular current (Istim + Isp) during the interval. This input, combined with the noise current Inse, determines a probability density over subthreshold voltage P(V) as a function of time and can be used to compute the probability density of the next spike P(next spike) as a function of time.
Of course, the probability density of the next spike time depends on the particular spike history for that trial and therefore differs slightly on each trial. Recent studies indicate that this type of history dependence can give rise to distinct patterns of response on different trials, which could be significant for the encoding of visual information across neurons (Fellous et al., 2004; Tiesinga and Toups, 2005). Figure 8e shows an example in which the distribution of the next spike time after a period of silence is bimodal, a condition in which standard measures of spike time precision are problematic. The bimodality observed here is accurately reflected in the (average) density of the next spike time, computed using the IF model. This indicates that the next-spike time density encompasses summary measures of reliability as well as precision.
Decoding of spike responses
Perhaps the most important role for a model of RGC responses is to provide a precise description of the visual information transmitted to the brain. The generalized IF model makes it possible to assess the degree to which variability in spike trains imposes limitations on the fidelity of information transmission. Specifically, the model can be used to compute the probability that an observed spike train was elicited by any given stimulus. This provides a powerful method for decoding the information contained in neural spike responses.
One method to illustrate decoding would be to simply use the model to perform stimulus reconstruction from measured spike responses. Given a particular spike response x, we can obtain the probability that it was elicited by a stimulus y via Bayes' rule:
 |
(9) |
where P(x|y) is obtained from the model likelihood calculation, P(y) is the prior over the stimulus, and P(x) is a normalizing term, the marginal probability of observing response x. We can perform stimulus reconstruction by choosing the y that is the maximum or the mean of P(y|x). The maximum provides the maximum a posteriori estimate for the stimulus, whereas the mean provides the Bayes' estimate under a squared loss function.
Rather than performing a full stimulus reconstruction, which requires choosing a previous P(y) and a search for the y that achieves the maximum or mean of Equation 6, we performed a simple illustration of decoding by using the model to discriminate stimuli in a two-alternative forced choice (2AFC) experiment. This experiment represents a much simpler demonstration of decoding: we use the model likelihood to distinguish which of two stimuli was most likely given an observed neural response, whereas reconstruction would require selecting the most likely stimulus among all possible stimuli.
In the 2AFC experiment, illustrated schematically in Figure 9a, an observer is presented with two spike trains and two different stimuli and must decide on the correct pairing of stimuli with elicited responses. The optimal decision rule given a particular model of the response is to use the pairing with the higher likelihood under that model (Green and Swets, 1966). We used the likelihood of spike responses under the IF model to discriminate pairs of stimuli, and, by applying this decision rule to each pair of responses obtained over multiple repeats of the stimulus, we obtained a percentage correct for the performance of the model at discriminating the pair of stimuli. As a benchmark, we compared this procedure against one in which likelihood was computed (and discrimination was performed) using the LNP model. Figure 9b shows a comparison of the performance of the two procedures. The predominance of data above the diagonal indicates that, on average, the IF model provided significantly more accurate discrimination than the LNP model. Thus, stimulus decoding based on the IF model exploits information in temporal patterns of spikes that is not captured by decoding based only on firing rate.
Figure 9.

Decoding responses using model-derived likelihoods. a, Two stimulus (Stim) fragments and corresponding fragments of the RGC response (Resp) raster. Gray boxes highlight a 50 ms interval of the first row of each response raster. A 2AFC discrimination task was performed on these response fragments, in which the task was to determine which stimulus gave rise to each response. The IF and LNP models were used to compute the likelihood of these responses given the “correct” and “incorrect” pairing of stimuli and responses, and the pairing with the higher likelihood was selected. This discrimination procedure was applied to each row of the response raster and used to obtain the percentage correct for the discrimination performance of each model. b, Discrimination performance of the IF and LNP models. Each point corresponds to the percentage correct of a 2AFC discrimination task using two randomly selected 50 ms windows of the response. Although both models obtain perfect performance (100%) for a majority of such randomly selected response windows, the scatter of points above the diagonal shows that when discrimination performance is imperfect, the IF model is far better at decoding the neural spike responses.
Discussion
An integrate-and-fire model, generalized to include a linear receptive field, a spike aftercurrent, and a noise source, provides an accurate description of the detailed structure of RGC spike trains elicited by visual stimuli. The model relies only on measurements of (extracellularly recorded) spike times but provides a full description of the hypothesized underlying currents along with detailed, accurate predictions of spiking behavior. The model can be fit reliably to responses from arbitrary stimuli using a straightforward procedure and does not require long measurements of responses to repeated or specialized stimuli. Most importantly, the model provides approximate mechanistic intuition about the origins of spike timing precision, as well as an optimal decoding procedure that exploits temporal patterns in spike trains.
Variability, structure, and fidelity of retinal signals
In previous work, the timing precision of firing onsets and the large gaps between periods of firing have been suggested as the basis for a novel interpretation of retinal coding (Berry et al., 1997; Keat et al., 2001). In this view, the retina encodes visual information in discrete firing events whose timing and spike count encode the timing and features of the stimulus, respectively. The IF model provides a more mechanistic explanation of spike train structure. Precisely timed spikes result primarily from stimulation that causes the membrane potential to cross the threshold rapidly, leaving little opportunity for voltage noise to influence the time of the spike (Fig. 7) (Bryant and Segundo, 1976; Banerjee, 2001; Liu et al., 2001). Similarly, long gaps between periods of firing result from stimuli that effectively suppress spiking by providing strong currents of opposite polarity. Periods of more gradual firing rate modulation arise from stimuli poorly matched to the linear filter or after periods of maintained firing. Thus, the encoding process is fundamentally linear, and the precision and structure of spike trains simply reflect the interaction of the stimulus with intrinsic filtering, noise, and spike generation.
In the model, a single noise parameter accounts for all the variability in neural response and thus summarizes the effects of noise in transduction, synaptic transfer, and cellular integration. This summary measure of response variability may serve as a parsimonious replacement for more phenomenological measures of variability, such as reliability and firing onset precision (Berry et al., 1997; Reinagel and Reid, 2000; Keat et al., 2001; Uzzell and Chichilnisky, 2004). These latter measures require ad hoc criteria for defining firing events and exclude many spikes from analysis (e.g., those that do not occur during an event). Additionally, these measures cannot easily be applied in stimulus regimens in which the neural response does not cleanly parse into discrete events (e.g., RGC responses to low-contrast flashes) (Fig. 6). In contrast, the noise parameter of the IF model explains many different measures of response variability (Fig. 8), has a rough physiological interpretation in terms of membrane current, and can be used to predict the variability of responses to novel stimuli, in both event and nonevent response regimens.
The IF model also provides a potentially significant technique for assessing the fidelity of sensory signals (Fig. 9). Because the probability of an observed spike train given any stimulus can be computed directly, the optimal stimulus discrimination procedure is provided explicitly. Such an optimal procedure is essential for a meaningful investigation of the factors that limit sensory performance. Stimulus discrimination based on the IF model was significantly more accurate than discrimination based on the LNP model, indicating that temporal patterns of spikes convey information not captured in the time-varying firing rate. Stimulus decoding based on the IF model also provides a bound on the accuracy with which the brain could decode stimulus information from RGCs. This approach to describing the fidelity of neural coding in the context of a mechanistic model could provide a valuable complement to approaches based on information theory (Bialek et al., 1991).
Limitations of the IF model
Although the IF model offers many practical and theoretical advantages, it has some shortcomings. First, although it clearly out-performs the LNP model by a variety of measures, the IF model still fails to account for ∼10-25% of the variance in the PSTH of RGCs (Fig. 5b), and deviations from the observed data exceed the variability of repeated responses by up to ∼20% (Fig. 5). One likely source of error is the existence of nonlinear stimulus dependencies (Hochstein and Shapley, 1976; Benardete et al., 1992; Victor and Purpura, 1997) not captured by the linear front end. Nonlinearities may be incorporated into the model without compromising its stable fitting properties by expanding the filter  to operate on nonlinear functions of the input. In preliminary studies, the inclusion of terms with quadratic dependence on the input led to a 5-10% increase in the percentage of explained variance. A drawback is that the elaborated model has more parameters to describe the nonlinear stimulus dependence and thus requires more data for estimation of those parameters.
Second, the fitting procedure tends to set the noise parameter somewhat higher than is necessary to account for the timing variability observed during periods of rapid firing. This is evident in the sorted rasters of Figure 3, in which the repeated interval structure of the RGC response is more regular than that of IF model responses. The discrepancy may result from the fact that the noise parameter accounts for both true variability in neural responses and any approximation errors of the model. Specifically, nonlinear mechanisms not captured by the model require an increase in the noise parameter to keep the observed spike train likelihood from becoming prohibitively small. This shortcoming could be addressed by separately optimizing the noise parameter using an objective function that isolates the stochastic behaviors of the neural response, such as the repeat interval structure (Fig. 3) or the spike-time distance (Fig. 5). A complete solution, however, requires the incorporation of nonlinear stimulus selectivity in the model (see above). This may be particularly important for applying the IF characterization to neurons in cortex.
Third, although the IF model is clearly more realistic than models with Poisson firing, it provides only a simplified description of known mechanisms underlying neural responses. This IF model is based on current rather than conductance inputs and has linear subthreshold dynamics. Although conductance-based IF and nonlinear Hodgkin-Huxley-style models provide much more biophysically realistic descriptions of intracellular dynamics, it is unfortunately the case that fitting these models to extracellular data is relatively intractable. In particular, the likelihood in such models is much more difficult to compute and generally might contain many local maxima. Another oversimplification of the IF model is the use of a single Gaussian white noise source to summarize all real noise sources (e.g., photon noise, synaptic failure, and channel noise); this assumption makes fitting tractable but does not allow us to make detailed inferences about the sources of noise.
Extensions
The present findings suggest a variety of extensions. First, the front-end linear filter can be extended to incorporate spatial dependence of model neural responses on spatially (in addition to temporally) varying stimuli. Higher stimulus dimensionality means that the model will require more data for fitting, but the problem remains tractable. In pilot studies, we have obtained reasonable fits of spatiotemporal stimulus filters using 10-15 min of data (compared with 50 s in the current experiment). The spatial components of these stimulus filters does not differ remarkably from that of the spike-triggered average, suggesting that the important differences between the IF and LNP models are restricted to their temporal properties.
Second, several studies (Smirnakis et al., 1997; Chander and Chichilnisky, 2001; Kim and Rieke, 2001; Baccus and Meister, 2002) have revealed slow contrast adaptation in RGCs, and integrate-and-fire models can likewise exhibit a form of spike rate adaptation to stimulus variance (Rudd and Brown, 1997). Although a full study of the adaptive properties of the IF model is beyond the scope of this paper, the ability of the model to predict responses to multicontrast flashes indicates that it can account for some forms of adaptation. The shape of the  current also gives rise to one simple form of adaptation: the delayed negative lobe of
  (Fig. 2b) means that several rapidly occurring spikes will give rise to a significant buildup of negative current, which produces adaptation in the response to a DC step current.
Third, the IF model can be extended to describe neural responses in sensory areas beyond the retina. We have conducted preliminary analyses that suggest that the IF model provides a reasonably accurate description of the responses of simple V1 cells to flickering bars. Additionally, in cases in which responses are driven by nonlinear stimulus transformations of a known form, the model can be augmented by fitting to the nonlinearly transformed stimulus. For example, fitting the model using a set of quadratic functions of the stimulus as input to the linear filter  allows the model to exhibit second-order stimulus dependence, such as that observed in complex V1 cells.
Fourth, the model can be extended to the modeling of multicell responses by introducing postspike currents between pairs of cells. These currents can be reliably fit to multicell data (again, by maximizing likelihood), and preliminary exploration indicates that the model can reproduce observed correlations in firing between cells (Pillow et al., 2005).
Finally, the fitting method is based on gradient ascent of the likelihood function and so can be applied to data collected with any sufficiently rich set of stimuli. Thus, unlike reverse correlation approaches to estimating LNP model parameters, IF model characterization does not require white noise stimuli. This raises the possibility of characterizing light responses using stimuli that drive cortical neurons more strongly than white noise or that more closely approximate the environment in which the visual system normally operates (Reinagel, 2001).
Footnotes
This work was supported by the Howard Hughes Medical Institute (HHMI) (E.P.S., J.W.P., L.P.), the Gatsby Charitable Trust and the Royal Society International Fellowship (L.P.), an HHMI Predoctoral Fellowship (V.J.U.), and the McKnight Foundation Scholars Award (E.J.C.). We thank W. Gerstner, G. Murphy, and F. Rieke for valuable comments and discussions.
Correspondence should be addressed to Jonathan W. Pillow, Howard Hughes Medical Institute, Center for Neural Science, and Courant Institute of Mathematical Sciences, New York University, New York, NY 10003. E-mail: pillow@cns.nyu.edu.
Copyright © 2005 Society for Neuroscience 0270-6474/05/2511003-11$15.00/0
References
- Aguera y Arcas B, Fairhall AL (2003) What causes a neuron to spike? Neural Comput 15: 1789-1807. [DOI] [PubMed] [Google Scholar]
- Baccus SA, Meister M (2002) Fast and slow contrast adaptation in retinal circuitry. Neuron 36: 909-919. [DOI] [PubMed] [Google Scholar]
- Banerjee A (2001) On the phase-space dynamics of systems of spiking neurons, ii: formal analysis. Neural Comput 13: 195-225. [DOI] [PubMed] [Google Scholar]
- Benardete EA, Kaplan E, Knight BW (1992) Contrast gain control in the primate retina: P cells are not X-like, some M cells are. Vis Neurosci 8: 483-486. [DOI] [PubMed] [Google Scholar]
- Berry M, Meister M (1998) Refractoriness and neural precision. J Neurosci 18: 2200-2211. [DOI] [PMC free article] [PubMed] [Google Scholar]
- Berry M, Warland DK, Meister M (1997) The structure and precision of retinal spike trains. Proc Natl Acad Sci USA 94: 5411-5416. [DOI] [PMC free article] [PubMed] [Google Scholar]
- Bialek W, Rieke F, de Ruyter van Steveninck RRR, Warland D (1991) Reading a neural code. Science 252: 1854-1857. [DOI] [PubMed] [Google Scholar]
- Bryant H, Segundo J (1976) Spike initiation by transmembrane current: a white-noise analysis. J Physiol (Lond) 260: 279-314. [DOI] [PMC free article] [PubMed] [Google Scholar]
- Chander D, Chichilnisky E (2001) Adaptation to temporal contrast in primate and salamander retina. J Neurosci 21: 9904-9916. [DOI] [PMC free article] [PubMed] [Google Scholar]
- Chichilnisky EJ (2001) A simple white noise analysis of neuronal light responses. Network 12: 199-213. [PubMed] [Google Scholar]
- Chichilnisky EJ, Kalmar RS (2002) Functional asymmetries in on and off ganglion cells of primate retina. J Neurosci 22: 2737-2747. [DOI] [PMC free article] [PubMed] [Google Scholar]
- Fellous JM, Tiesinga PH, Thomas PJ, Sejnowski TJ (2004) Discovering spike patterns in neuronal responses. J Neurosci 24: 2989-3001. [DOI] [PMC free article] [PubMed] [Google Scholar]
- Gerstner W (2001) A framework for spiking neuron models: the spike response model. In: The handbook of biological physics, Vol 4 (Moss F, Gielen S, eds), pp 469-516. Amsterdam: Elsevier Sciences. [Google Scholar]
- Green DM, Swets JA (1966) Signal detection theory and psychophysics. New York: Wiley.
- Gutkin BBEG, Rudolph M (2003) Spike generating dynamics and the conditions for spike-time precision in cortical neurons. J Comput Neurosci 15: 91-103. [DOI] [PubMed] [Google Scholar]
- Hochstein S, Shapley R (1976) Linear and nonlinear spatial subunits in Y cat retinal ganglion cells. J Physiol (Lond) 262: 265-284. [DOI] [PMC free article] [PubMed] [Google Scholar]
- Hubel DH, Wiesel T (1968) Receptive fields and functional architecture of monkey striate cortex. J Physiol (Lond) 195: 215-243. [DOI] [PMC free article] [PubMed] [Google Scholar]
- Jolivet R, Lewis T, Gerstner W (2003) The spike response model: a framework to predict neuronal spike trains. In: Springer lecture notes in computer science, Vol 2714 (Kaynak O, ed), pp 846-853. Berlin: Springer. [Google Scholar]
- Jolivet R, Lewis T, Gerstner W (2004) Generalized integrate-and-fire models of neuronal activity approximate spike trains of a detailed model to a high degree of accuracy. J Neurophysiol 92: 959-976. [DOI] [PubMed] [Google Scholar]
- Keat J, Reinagel P, Reid R, Meister M (2001) Predicting every spike: a model for the responses of visual neurons. Neuron 30: 803-817. [DOI] [PubMed] [Google Scholar]
- Kim KJ, Rieke F (2001) Temporal contrast adaptation in the input and output signals of salamander retinal ganglion cells. J Neurosci 21: 287-299. [DOI] [PMC free article] [PubMed] [Google Scholar]
- Koch K, McLean J, Berry M, Sterling P, Balasubramanian V, Freed MA (2004) Efficiency of information transmission by retinal ganglion cells. Curr Biol 14: 1523-1530. [DOI] [PubMed] [Google Scholar]
- Kuffler SW (1953) Discharge patterns and functional organization of mammalian retina. J Neurophysiol 16: 37-68. [DOI] [PubMed] [Google Scholar]
- Liu RC, Tzonev S, Rebrik S, Miller KD (2001) Variability and information in a neural code of the cat lateral geniculate nucleus. J Neurophysiol 86: 2789-2806. [DOI] [PubMed] [Google Scholar]
- Mainen Z, Sejnowski T (1995) Reliability of spike timing in neocortical neurons. Science 268: 1503-1506. [DOI] [PubMed] [Google Scholar]
- Paninski L, Pillow J, Simoncelli E (2004) Maximum likelihood estimation of a stochastic integrate-and-fire neural model. Neural Comput 16: 2533-2561. [DOI] [PubMed] [Google Scholar]
- Pillow JW, Simoncelli E (2003) Biases in white noise analysis due to non-Poisson spike generation. Neurocomputing 52: 109-115. [Google Scholar]
- Pillow JW, Paninski L, Simoncelli E (2004a) Maximum likelihood estimation of a stochastic integrate-and-fire neural model. In: Advances in neural information processing systems, Vol 16 (Thrun S, Saul L, Scholkopf B, eds). Cambridge MA: MIT. [DOI] [PubMed] [Google Scholar]
- Pillow JW, Paninski L, Uzzell VJ, Simoncelli EP, Chichilnisky EJ (2004b) Accounting for timing and variability of retinal ganglion cell light responses with a stochastic integrate-and-fire model. Soc Neurosci Abstr 30: 598.4. [Google Scholar]
- Pillow JW, Shlens J, Paninski L, Chichilnisky EJ, Simoncelli EP (2005) Modeling the correlated spike responses of a cluster of primate retinal ganglion cells. Soc Neurosci Abstr 31: 591.3. [Google Scholar]
- Reich DS, Victor JD, Knight BW, Ozaki T, Kaplan E (1997) Response variability and timing precision of neuronal spike trains in vivo. J Neurophysiol 77: 2836-2841. [DOI] [PubMed] [Google Scholar]
- Reich DS, Victor JD, Knight BW (1998) The power ratio and the interval map: spiking models and extracellular recordings. J Neurosci 18: 10090-10104. [DOI] [PMC free article] [PubMed] [Google Scholar]
- Reinagel P (2001) How do visual neurons respond in the real world? Curr Opin Neurobiol 11: 437-442. [DOI] [PubMed] [Google Scholar]
- Reinagel P, Reid RC (2000) Temporal coding of visual information in the thalamus. J Neurosci 20: 5392-5400. [DOI] [PMC free article] [PubMed] [Google Scholar]
- Rudd M, Brown L (1997) Noise adaptation in integrate-and-fire neurons. Neural Comput 9: 1047-1069. [DOI] [PubMed] [Google Scholar]
- Shadlen M, Newsome W (1998) The variable discharge of cortical neurons: implications for connectivity, computation, and information coding. J Neurosci 18: 3870-3896. [DOI] [PMC free article] [PubMed] [Google Scholar]
- Simoncelli E, Paninski L, Pillow J, Schwartz O (2004) Characterization of neural responses with stochastic stimuli. In: The cognitive neurosciences, Ed 3 (Gazzaniga M, ed), pp 327-338. Cambridge, MA: MIT.
- Smirnakis S, Berry M, Warland D, Bialek W, Meister M (1997) Adaptation of retinal processing to image contrast and spatial scale. Nature, 386: 69-73. [DOI] [PubMed] [Google Scholar]
- Tiesinga PH, Toups JV (2005) The possible role of spike patterns in cortical information processing. J Comput Neurosci 18: 275-286. [DOI] [PubMed] [Google Scholar]
- Troy JB, Lee BB (1994) Steady discharges of macaque retinal ganglion cells. Vis Neurosci 11: 111-118. [DOI] [PubMed] [Google Scholar]
- Troyer TW, Miller KD (1997) Physiological gain leads to high ISI variability in a simple model of a cortical regular spiking cell. Neural Comput 9: 971-983. [DOI] [PubMed] [Google Scholar]
- Uzzell VJ, Chichilnisky EJ (2004) Precision of spike trains in primate retinal ganglion cells. J Neurophysiol 92: 780-789. [DOI] [PubMed] [Google Scholar]
- van Rossum MC, O'Brien BJ, Smith RG (2003) Effects of noise on the spike timing precision of retinal ganglion cells. J Neurophysiol 89: 2406-2419. [DOI] [PubMed] [Google Scholar]
- Victor JD, Purpura K (1997) Metric-space analysis of spike trains: theory, algorithms, and application. Network 8: 127-164. [Google Scholar]