

Abstract
The α9 and α10 nicotinic cholinergic subunits assemble to form the receptor that mediates synaptic transmission between efferent olivocochlear fibers and hair cells of the cochlea. They are the latest vertebrate nicotinic cholinergic receptor (nAChR) subunits that have been cloned, and their identification has established a distant early divergent branch within the nAChR gene family. The α10 subunit serves as a “structural” component leading to heteromeric α9α10 nAChRs with distinct properties. We now have probed the stoichiometry of recombinant α9α10 nAChRs expressed in Xenopus oocytes. We have made use of the analysis of the population of receptors assembled from a wild-type subunit and its partner α9 or α10 subunit bearing a reporter mutation of a valine to threonine at position 13′ of the second transmembrane domain (TM2). Because the mutation increased the sensitivity of the receptor for acetylcholine (ACh) but mutations at different subunits were not equivalent, the number of α9 and α10 subunits could be inferred from the number of components in compound concentration-response curves to ACh. The results were confirmed via the analysis of the effects of a mutation to threonine at position 17′ of TM2. Because at this position the mutations at different subunits were equivalent, the stoichiometry was inferred directly from the shifts in the ACh EC50 values. We conclude that the recombinant α9α10 receptor is a pentamer with a (α9)2(α10)3 stoichiometry.
Keywords: nicotinic receptors, stoichiometry, ligand-gated channels, mutagenesis, cholinergic receptors, cochlea
Introduction
Nicotinic acetylcholine receptors (nAChRs) are members of the “Cys-loop” family of neurotransmitter-gated ion channels (Le Novere and Changeux, 1995). Receptors in the family are formed by five homologous subunits oriented around a central ion channel similar to barrel staves (Karlin, 2002). In vertebrates, nine nonmuscle α subunits (α2-α10) and three β subunits (β2-β4) have been cloned. The reported combinations of subunits that form functional vertebrate nAChRs are expanding and now include receptors assembled from single α subunits (α7, α8, α9) (Couturier et al., 1990; Elgoyhen et al., 1994; Gotti et al., 1994), receptors that contain multiple α subunits both with (α2α5β2, α3α5β2, α3α5β4, α4α5β2) (Conroy et al., 1992; Vernallis et al., 1993; Conroy and Berg, 1998; Balestra et al., 2000) and without (α7α8, α9α10) supplemental β subunits (Gotti et al., 1994; Elgoyhen et al., 2001), receptors with single α and multiple β subunits (α3β2β4, α3β3β4) (Colquhoun and Patrick, 1997; Groot-Kormelink et al., 1998; Boorman et al., 2000), and receptors with multiple α and β subunits (α3β2β4α5) (Gerzanich et al., 1998) as well as heteromeric nAChRs formed via pairwise combinations of α2, α3, α4, or α6 with either the β2 or β4 subunits (Boulter et al., 1987; Goldman et al., 1987; Deneris et al., 1988; Duvoisin et al., 1989; Gerzanich et al., 1997). Thus, the number of potential molecular forms of nicotinic receptors is very large. Determining the stoichiometry of each association has become challenging in most cases.
The α9 and α10 nicotinic cholinergic subunits assemble to form the receptor that mediates synaptic transmission between efferent olivocochlear fibers and hair cells of the cochlea, one of the few certified examples of postsynaptic function for a nonmuscle nAChR (Elgoyhen et al., 2001). The α9 and α10 are the latest vertebrate nAChR subunits that have been cloned, and their identification has established a distant, distinct, and peculiar early divergent branch within the nAChR gene family (Elgoyhen et al., 1994, 2001; Rothlin et al., 1999; Le Novere et al., 2002). Whereas recombinant homomeric α9 receptors are functional, α10 homomeric receptors are not. The α10 subunit serves as a structural component leading to heteromeric α9α10 nAChRs with 100- to 1000-fold bigger macroscopic currents, particular desensitization kinetics, current-voltage dependency, and sensitivity to extracellular Ca2+ (Elgoyhen et al., 1994, 2001; Sgard et al., 2002; Weisstaub et al., 2002). It is believed that the native receptor of hair cells is a heteromer assembled from both α9 and α10, because no detectable responses are recorded from hair cells that transcribe only the gene coding for the α9 subunit (Katz et al., 2004).
We have made a step forward in providing novel information on the architecture of the α9α10 nAChR. We have used reporter mutations in transmembrane region 2 (TM2) of the subunits to infer the number of each subunit type that comprises the recombinant receptor expressed in Xenopus oocytes. We conclude that the receptor is a pentamer with a (α9)2(α10)3 stoichiometry.
Materials and Methods
Generation of mutant receptors. Site-directed mutagenesis of the α9 and α10 rat cDNAs, subcloned in a modified pGEMHE vector (Elgoyhen et al., 1994, 2001), was performed with the QuikChange Site-Directed Mutagenesis Kit (Stratagene, La Jolla, CA). Mutations were confirmed by sequence analysis to verify that only the desired nucleotide changes were present. The numbering that was used is the one that has been adopted to allow for comparison of homologous amino acids from different types of neurotransmitter-gated channels, as reported previously (Plazas et al., 2005). Position 1′ corresponds to the start of the TM2 region.
Expression of recombinant receptors in Xenopus laevis oocytes. Capped cRNAs were transcribed in vitro from linearized plasmid DNA templates with the use of the mMessage mMachine T7 transcription kit (Ambion, Austin, TX). The maintenance of Xenopus laevis as well as the preparation and cRNA injection of stage V and VI oocytes has been described in detail previously (Katz et al., 2000). Typically, oocytes were injected with 50 nl of RNase-free water containing 0.01-1.0 ng of cRNAs and maintained in Barth's solution at 17°C.
Electrophysiological recordings were performed 2-6 d after cRNA injection under two-electrode voltage clamp with a GeneClamp 500 amplifier (Molecular Devices, Union City, CA). Both voltage and current electrodes were filled with 3 m KCl and had resistances of ∼1-2 MΩ. Data acquisition was performed with the use of a Digidata 1200 and pClamp 7.0 software (Molecular Devices). Data were analyzed with Clampfit from the pClamp 6.1 software. During electrophysiological recordings, the oocytes were superfused continuously (∼10 ml/min) with normal frog saline composed of the following (in mm): 115 NaCl, 2.5 KCl, 1.8 CaCl2, and 10 HEPES buffer, pH 7.2. Drugs were applied in the perfusion solution of the oocyte chamber. To minimize activation of the endogenous Ca2+-sensitive chloride current (Elgoyhen et al., 2001), we performed all experiments in oocytes incubated with the Ca2+ chelator 1,2-bis(2-aminophenoxy)ethane-N,N,N′,N′-tetra-acetic acid acetoxymethyl ester (BAPTA-AM; 100μm) for 3-4 h before the electrophysiological recordings. Oocytes were clamped at a holding potential of -70 mV.
Concentration-response curves were fit with the following equation, using a nonlinear least square method:
 |
(1) |
where x is the number of fitted components and can vary from one to four, I is the peak current at a given concentration of ACh (A), Imax is the maximum current, EC50 is the concentration of ACh yielding a half-maximum response, and n is the Hill coefficient. The best fit was estimated with the F test from the GraphPad Prism 4.00 for Windows (GraphPad Software, San Diego, CA).
Materials. ACh chloride was bought from Sigma (St. Louis, MO). BAPTA-AM (Molecular Probes, Eugene, OR) was stored at -20°C as aliquots of a 100 mm solution in dimethyl sulfoxide, thawed, and diluted 1000-fold into saline solution shortly before incubation of the oocytes.
All experimental protocols were performed in accordance with National Institutes of Health Guide for the Care and Use of Laboratory Animals (NIH publication 80-23), revised in 1978.
Results
Mutations of a conserved valine at position 13′ of TM2 of the
α9 or α10 subunits increase the sensitivity to ACh of the α9α10 nAChR We examined the subunit stoichiometry of the recombinant α9α10 nAChR by analysis of the shifts in the EC50 values in receptors carrying the V13′T reporter mutation. Although previous reports have used reporter mutations at the 9′ position of TM2 to analyze the stoichiometry of neuronal nAChR or GABAA receptors (Chang et al., 1996; Boorman et al., 2000), the 13′ position was chosen in the case of α9α10 because bigger shifts in the EC50 values were obtained (Plazas et al., 2005). We have described previously that the V13′T α9α10 double-mutant receptor displays a dramatic increase in ACh sensitivity, assessed as the decrease in its EC50 value (Plazas et al., 2005). Figure 1 shows representative responses and concentration-response curves to ACh when either α9 or α10 subunits were mutated and expressed with the wild-type partner subunit. The curves for the double-mutant and wild-type receptors are included for comparison. Henceforth, the mutated subunits will be designated α9* and α10*. Mutant receptors exhibited an increase in the sensitivity to ACh, which was evidenced by a leftward shift in the concentration-response curves, a decrease in the EC50 value, and no major changes in the Hill coefficients. The EC50 and Hill coefficient values included the following: α9α10, 14.6 ± 1.3 μm and 1.1 ± 0.1 (n = 5); α9*α10, 0.4 ± 0.1 μm and 1.1 ± 0.1 (n = 5); α9α10*, 0.5 ± 0.1 μm and 1.4 ± 0.1 (n = 5); α9*α10*, 0.2 ± 0.1 μm and 1.1 ± 0.1 (n = 5). In addition, as reported previously (Plazas et al., 2005), mutant receptors exhibited a decrease in the rate of desensitization.
Figure 1.
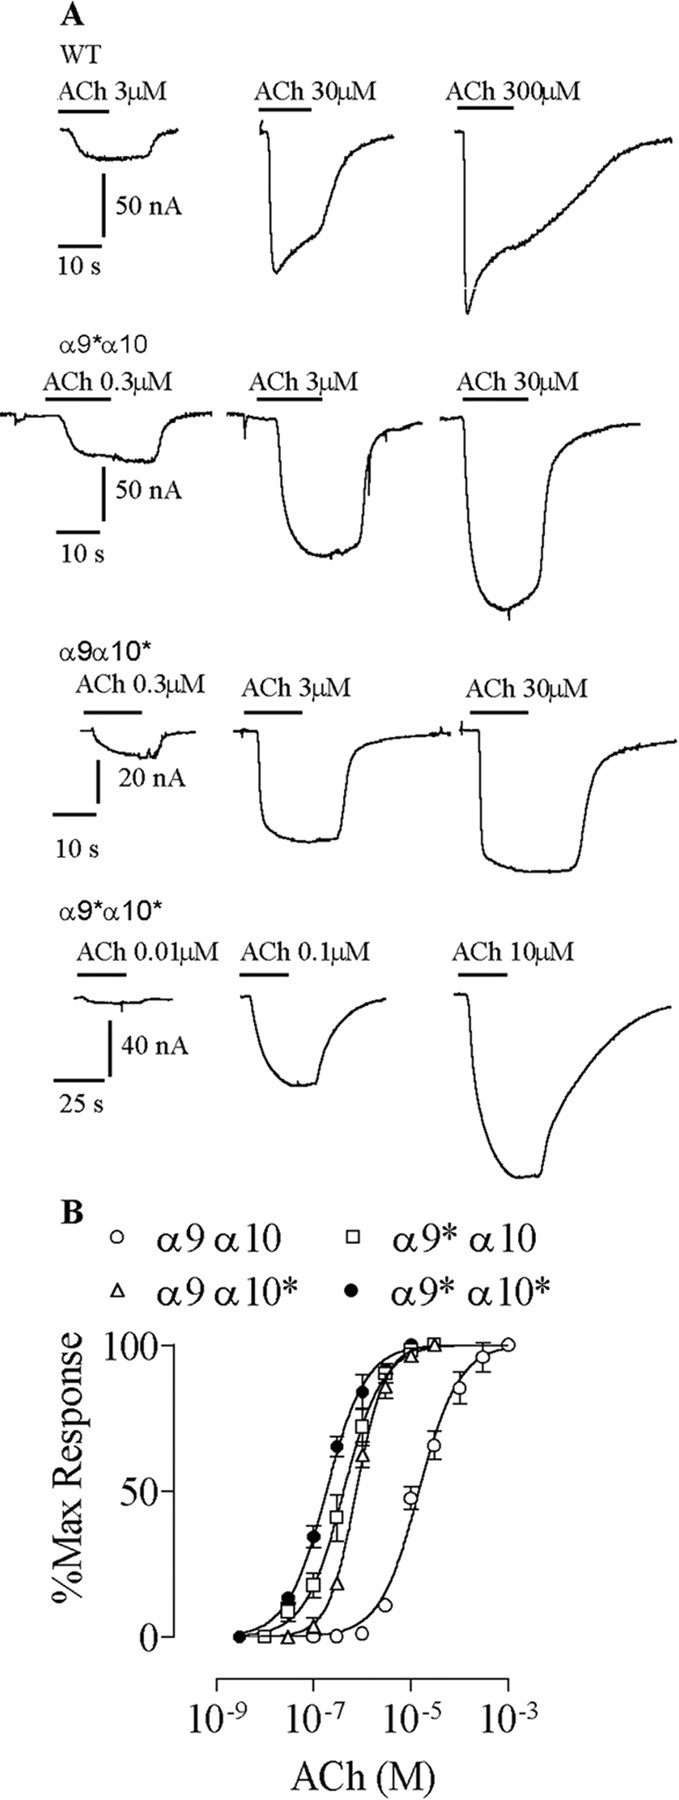
Mutation of the valine at position 13′ of TM2 to threonine in the α9 α10 enhances the sensitivity to ACh. A, Representative responses to increasing concentrations of ACh for wild-type and each mutant receptor. B, Concentration-response curves to ACh for wild-type, single-, or double-mutant receptors. Peak current values were normalized and referred to the maximal peak response to ACh in each case. The mean and SEM of five experiments per group are shown. The asterisk denotes the mutated subunit.
Studies in heteromeric (muscle and neuronal) nAChRs have concluded that the effects of mutations at position 9′of TM2 of the different subunits on the ACh EC50 are nearly independent, equivalent, and multiplicative (Filatov and White, 1995; Labarca et al., 1995; Boorman et al., 2000). In those cases, the stoichiometry can be deduced directly from the comparison of the shifts in the EC50 values produced by the introduction of one mutated subunit at a time with that of fully mutated receptors (Boorman et al., 2000). On the contrary, the EC50 values obtained for single and double mutants of the α9α10 nAChR at 9′ (Plazas et al., 2005) and 13′ indicate that at these positions both types of subunits contribute in an asymmetric and nonmultiplicative manner to the shift in EC50 values. This can be inferred from the fact that receptors containing only the α9 or the α10 mutant subunits showed the same decrease in the EC50 values, despite the fact that they cannot be in the same proportion in the pentameric assembly of a nAChR. We therefore followed the strategy described by Chang et al. (1996) for GABAA receptors, in which the deduction of the stoichiometry is independent from asymmetries in the contribution to the shifts in EC50 values produced by mutating individual subunits.
Coexpression of wild-type and mutant V13′T receptor subunits
Predictions and assumptions
If we assume there is only one α9 subunit in the α9α10 nAChR, coexpression of both α9 and α9* along with wild-type α10 subunits would result in an ACh concentration-response curve with two components (Fig. 2A): one from the activation of α9α10 receptors and the other from the activation of α9*α10 receptors. In addition, on the basis of the data derived from Figure 1, the ACh EC50 values of the two components would be ∼15 and ∼0.4 μm, respectively. Alternatively, if the α9α10 nAChR contained two α9 subunits, the ACh concentration-response curve resulting from the expression of α9, α9*, and α10 subunits would have three components (Fig. 2B): one component from receptors in which both α9 subunits are wild type (EC50, ∼15 μm), one component from receptors in which both α9 subunits are mutant (∼0.4 μm), and a third one with an intermediate EC50 value from receptors with one wild-type and one mutant α9 subunit. If the mutation of each α9 subunit has an equivalent effect, the shift in the EC50 value contributed by each α9 subunit would be the square root of the shift in EC50 value observed when both α9 subunits are mutant (∼38-fold). Thus, each α9* subunit would contribute a 6.1-fold increase in the ACh sensitivity, predicting an intermediate component with an EC50 value of 2.5 μm. Similar logic could be applied for receptors containing three or four α9* or for receptors assembled from α10-mutated subunits.
Figure 2.

Predicted results for receptors composed of either one or two α9 subunits. A, With one α9 subunit in the receptor complex, the ACh concentration-response curve from oocytes expressing α9,α9*, and α10 subunits would be composed of two components (solid line): one component from the activation of α9*α10 receptors and the other from α9α10 receptors (dotted lines).B, With two α9 subunits in the receptor complex, the ACh concentration-response curve from oocytes expressing α9, α9*, and α10 subunits would be composed of three components (solidline): one component from activation of α9* α10 receptors, one from α9* α9 α10 receptors, and the other from α9 α10 receptors (dotted lines). The asterisk denotes the mutated subunit. Each arrow indicates the predicted EC50 for each component.
The conclusions to be drawn from these experiments are dependent on the assumption that mutations do not alter the normal stoichiometry of the α9α10 receptor and that the different possible subunit arrangements of mutant and wild-type subunits within the complex are functionally equivalent. Although we have no direct evidence to prove this, it seems unlikely that a point mutation in a residue that is presumed to face the lumen of the channel (Miyazawa et al., 2003) would alter subunit interactions so drastically as to result in an atypical stoichiometry. Possible currents derived from homomeric α9 receptors were not taken into consideration, because they are almost undetectable when coexpressing α9 with α10 and are being recorded from BAPTA-treated oocytes (Elgoyhen et al., 2001).
Coexpression of α9*, α9, and α10 reveals the presence of two α9 subunits in the α9α10 receptor complex
Figure 3A shows the results from experiments in which α9*, α9, and α10 subunits were coexpressed in the same oocyte in a 1:1:2 cRNA ratio. The resulting concentration-response curve was well adjusted by the sum of three Hill equations. Table 1 shows the values of the EC50 and the percentage of maximal responses for each component. The EC50 value of the first component, 0.2 ± 0.1 μm, would correspond to that determined for α9*α10 receptors (0.4 ± 0.1 μm) (Fig. 1), and that of the third component, 9.3 ± 1.5 μm, would correspond to that of the α9α10 receptor (14.6 ± 1.3 μm) (Fig. 1). The existence of an intermediate component with an EC50 value of 1.1 ± 0.1 μm close to the predicted one (2.5 μm) indicates that the α9α10 nAChR must contain two α9 subunits. This intermediate component would result from receptors containing one α9 and one α9* subunit.
Figure 3.

ACh response curves from the coexpression of α9, α9*, and α10 subunits. The overall (α9 + α9*) to α10 cRNA ratio was 1:1 for A-C. The α9 to α9* ratio was 1:1 in A, 3:1 in B, and 1:3 in C. Peak current values were normalized and referred to the maximal peak response to ACh in each case. The mean and SEM of five or six experiments per group are shown.
Table 1.
EC50 values and percentage of the components for the different α9:α9* cRNA injection ratios
|
α9:α9* cRNA ratio |
1st Comp. (α9*)2(α10)3 |
2nd Comp. α9α9*(α10)3 |
3rd Comp. (α9)2(α10)3 |
||||||
|---|---|---|---|---|---|---|---|---|---|
| EC50 (μm) |
Max resp (%) |
EC50 (μm) |
Max resp (%) |
EC50 (μm) |
Max resp (%) |
||||
| 1:1 | 0.2 ± 0.1 | 11.8 ± 4.5 | 1.1 ± 0.1 | 28.8 ± 6.9 | 9.3 ± 1.6 | 58.1 ± 6.6 | |||
| 3:1 | ND | 2.5 ± 0.5 | 53.2 ± 13.9 | 17.8 ± 4.7 | 47.8 ± 16.1 | ||||
| 1:3 |
0.1 ± 0.1 |
32.5 ± 6.2 |
1.8 ± 0.2 |
54.1 ± 11.5 |
17.6 ± 7.9 |
13.1 ± 7.3 |
|||
The mean ± SEM is shown. In all cases, the ratio of (α9+α9*):α10 was 1:1. ND, Not detectable; comp., component; Max resp, maximal response; *V13′T; n = 6 to 7 experiments per group.
To preclude the possibility of multiple indistinguishable intermediate components (resulting from the sum of multiple stoichiometries) in the concentration-response curve of Figure 3A, we varied the ratio of wild-type and mutant cRNA (α9:α9*), maintaining an equal overall (α9 + α9*):α10 ratio. If the intermediate component of the ACh concentration-response curve consists of more than one component, the variation of the α9 to α9* ratio should change the relative fractions of the different receptor combinations underlying the putative multiple intermediate components and consequently their EC50 values. Figure 3, B and C, shows the concentration-response curves to ACh obtained when the ratio of α9 to α9* was 3:1 and 1:3, respectively. At a 1:3 cRNA injection ratio, the concentration-response curves consisted of three components. The EC50 value of the intermediate component (1.8 ± 0.2 μm) was within the same range as that obtained at a 1:1 ratio. Moreover, the relative fractions of these three components varied in a manner that would be expected for the different cRNA ratios (e.g., the amplitude of the α9*α10 component increased with an increase in the ratio of α9* to α9 cRNA) (Table 1). At a 3:1 α9 to α9* cRNA ratio, only two components were observed: one corresponding to the second component and the other to the third. Moreover, the relative fraction of the second component increased and that of the first component was below the level of detection, as expected from an increase in the ratio of α9 to α9* (Table 1). The EC50 value of the intermediate component (2.5 ± 0.5 μm) was within the same range as that obtained at the other cRNA ratios.
Coexpression of α9, α10, and α10* reveals the presence of three α10 subunits in the α9α10 receptor complex Figure 4A shows the results from experiments in which α9, α10, and α10* subunits were coexpressed in the same oocyte in a 2:1:1 cRNA ratio. The resulting concentration-response curve was well adjusted by the sum of four Hill equations. Table 2 shows the values of the EC50 and the percentage of maximal responses for each component. The EC50 value of the first component, 0.6 ± 0.1 μm, would correspond to that determined for α9α10* receptors (0.5 ± 0.1 μm) (Fig. 1), and that of the fourth component, 22.7 ± 1.3 μm, would correspond to that of the α9α10 receptor (14.6 ± 1.3 μm) (Fig. 1). The existence of two intermediate components would indicate that the α9α10 nAChR contains three α10 subunits. If we assume that α10 and α10* equally contribute to the shift in the EC50 value from α9α10 to α9α10* receptors (∼30-fold), each α10 subunit should contribute with a 3.1-fold increase in the sensitivity to ACh. This would predict two intermediate components: one component with an EC50 value of 4.7 μm for receptors with two α10 and one α10* and another component with an EC50 value of 1.5 μm for receptors with one α10 and two α10*. These values are similar to those obtained experimentally, 5.0 ± 0.4 and 2.2 ± 0.2 μm, respectively (Table 2).
Figure 4.

ACh response curves from the coexpression of α9, α10*, and α10 subunits. The overall α9 to (α10* +α10) cRNA ratio was 1:1 for A-C. The α10 to α10* ratio was 1:1 in A, 3:1 in B, and 1:3 in C. Peak current values were normalized and referred to the maximal peak response to ACh in each case. The mean and SEM of five to nine experiments per group are shown.
Table 2.
EC50 values and percentage of the components for the different α10:α10* cRNA injection ratios
|
|
1st Comp. (α9)2(α10*)3 |
2nd Comp. (α9)2(α10*)2(α10)1 |
3rd Comp. (α9)2(α10*)1(α10)2 |
4th Comp. (α9)2(α10)3 |
||||||||
|---|---|---|---|---|---|---|---|---|---|---|---|---|
| α10:α10* cRNA ratio |
EC50 (μm) |
Max resp (%) |
EC50 (μm) |
Max resp (%) |
EC50 (μm) |
Max resp (%) |
EC50 (μm) |
Max resp (%) |
||||
| 1:1 | 0.6 ± 0.1 | 6.2 ± 1.5 | 2.2 ± 0.2 | 16.3 ± 5.6 | 5.0 ± 0.4 | 22.4 ± 7.4 | 22.7 ± 1.3 | 57.5 ± 4.8 | ||||
| 3:1 | ND | 1.1 ± 0.3 | 8.4 ± 4.7 | 4.2 ± 0.3 | 12.3 ± 4.0 | 22.2 ± 1.3 | 81.0 ± 5.4 | |||||
| 1:3 |
0.5 ± 0.1 |
30.0 ± 2.7 |
1.9 ± 0.1 |
20.5 ± 4.1 |
4.9 ± 0.4 |
18.7 ± 5.2 |
14.1 ± 0.8 |
30.5 ± 3.5 |
||||
The mean ± SEM is shown. In all cases, the ratio of (α9:α10+α10*) was 1:1. ND, Not detectable; comp., component; Max resp, maximal response; *V13′T; n = 5 to 9 experiments per group.
To preclude the possibility of multiple indistinguishable intermediate components in the concentration-response curve of Figure 4A, we varied the ratio of wild-type and mutant cRNA (α10:α10*), maintaining an equal overall α9:(α10 + α10*) ratio. If the intermediate components of the ACh concentration-response curve consist of more than one component each, the variation of the α10 to α10* ratio should change the relative fractions of the different receptor combinations underlying the putative multiple intermediate components and consequently their EC50 values. Figure 4, B and C, shows the concentration-response curves to ACh obtained when the ratio of α10 to α10* was 3:1 and 1:3, respectively. At a 1:3 cRNA injection ratio, the concentration-response curves consisted of four components. The EC50 values of the intermediate components (1.9 ± 0.1 and 4.9 ± 0.4 μm) were similar to those obtained at a 1:1 ratio. Moreover, the relative fractions of these four components varied in a manner that would be expected for the different cRNA ratios (e.g., the amplitude of the α9α10* component increased with an increase in the ratio of α10* to α10 cRNA) (Table 2). At a 3:1 α10 to α10* cRNA ratio, only three components were observed: two corresponding to the intermediate components and the other to the fourth. Moreover, the relative fraction of the fourth component increased and that of the first component was below the level of detection, as expected from an increase in the ratio of α10 to α10* (Table 1). The EC50 values of the intermediate components (1.1 ± 0.3 and 4.2 ± 0.3 μm) were similar to those obtained at a 1:1 ratio.
Together, the results so far support the notion that the α9α10 receptor is assembled from two α9 and three α10 subunits to form a pentameric structure, as reported for other nAChRs (Karlin, 2002). Slight changes in the EC50 values of the different components at different cRNA ratios might result from the difficulty of extracting precise EC50 values from the compound concentration-response curves as the amplitudes of the components vary. The amplitude of the components in these wild-type and mutant coexpression studies did not follow a binomial distribution, so possible explanations are considered in the Discussion.
The stoichiometry of the α9α10 nAChR does not depend on the relative abundance of α9 and α10 subunits
Alternate stoichiometries have been reported for nAChRs depending on either the subunit availability or the experimental conditions (Zwart and Vijverberg, 1998; Nelson et al., 2003). To analyze whether the α9α10 stoichiometry can vary depending on the abundance of the different subunits, we injected α9*α10 at a 4:1 ratio and α9α10* at a 1:4 ratio (Table 3). If the increase in availability of mutant subunits would increase the number of mutant subunits incorporated to the receptor and therefore alter the final stoichiometry, the EC50 values should be smaller than those obtained at a 1:1 cRNA ratio. As we observed in Table 3, the EC50 values obtained at this 4:1 cRNA ratio were similar to those obtained at a 1:1 ratio. This result indicates that at least at these cRNA ratios the number of α9 and α10 subunits in the receptor complex is fixed with a stoichiometry of (α9)2(α10)3.
Table 3.
EC50 values and Hill coefficient at different α9:α10 ratios
|
cRNA ratio |
EC50 (μm) |
n Hill |
n |
|---|---|---|---|
| α9*:α10 1:1 | 0.42 ± 0.02 | 1.1 ± 0.1 | 5 |
| α9*:α10 4:1 | 0.54 ± 0.02 | 1.6 ± 0.1 | 3 |
| α9:α10* 1:1 | 0.46 ± 0.02 | 1.5 ± 0.1 | 5 |
| α9:α10* 1:4 |
0.63 ± 0.03 |
1.1 ± 0.1 |
5 |
The mean ± SEM is shown. *V13′T; n, number of experiments.
Assembly of α9α10 receptors with a mutation at position 17′ of TM2 supports the (α9)2(α10)3 stoichiometry
We have described previously that a α9α10 double-mutant receptor in which the isoleucine at position 17′ of the TM2 of α9 and the methionine 17′ of α10 were mutated to threonine displays an increase ACh sensitivity (Plazas et al., 2005). Figure 5 shows concentration-response curves to ACh when either α9 or α10 subunits were mutated and expressed with the wild-type partner subunit. The curves for the double-mutant and wild-type receptors are included for comparison. Mutant receptors exhibited an increase in the sensitivity to ACh, which was evidenced by a leftward shift in the concentration-response curves, a decrease in the EC50 values, and no major changes in the Hill coefficients. The EC50 and Hill coefficient values included the following: α9α10, 14.6 ± 1.3 μm and 1.1 ± 0.1 (n = 5); α9*α10, 5.5 ± 0.7 μm and 1.2 ± 0.2 (n = 5); α9α10*, 2.9 ± 0.1 μm and 1.1 ± 0.2 (n = 9); α9*α10*, 1.1 ± 0.1 μm and 1.5 ± 0.2 (n = 4). Thus, mutations in either α9 or α10 lead to a 2.7- and 5-fold decrease in the EC50 values, respectively. The expected shift for the double-mutant receptor if both types of subunits contribute independently to the ACh sensitivity would be 13.5-fold. Interestingly, this agrees with the experimentally calculated decrease in the EC50 value (13.3-fold). Therefore, it can be postulated that at this position both types of subunits contribute independently and symmetrically to ACh sensitivity. As reported by Boorman et al. (2000), in this case, the shifts in the EC50 values of mutants could be used to calculate the stoichiometry of the receptor. Because the shift in the EC50 of the double mutant was 13.3-fold, the predicted shift produced by each mutant subunit incorporated in the receptor should be 1.7-fold. Hence, the incorporation of two mutant subunits should produce a 2.9-fold shift and that of three mutant subunits a 4.9-fold shift in the EC50 values. These predicted values are similar to those experimentally obtained: 2.7- and 5-fold for α9*α10 and α9α10* mutants. These results confirm those obtained by the analysis of compound concentration-response curves with V13′T-mutated receptors and support the deduced (α9)2(α10)3 stoichiometry.
Figure 5.

Mutation at position 17′ of TM2 to threonine in the α9α10 enhances the sensitivity to ACh. Concentration-response curves to ACh for wild-type, single-, or double-mutant receptors are shown. Peak current values were normalized and referred to the maximal peak response to ACh in each case. The mean and SEM of five to nine experiments per group are shown. The asterisk denotes the mutated subunit.
Discussion
In the present work, we describe for the first time that the recombinant α9α10 nAChR is assembled from two α9 and three α10 subunits. As far as we are aware, this is the first description of the stoichiometry of a heteromeric recombinant nAChR that includes only α subunits and might contribute to the emerging knowledge of the structure of nAChRs (Karlin, 2002).
To establish the stoichiometry of the recombinant α9α10 nAChR, we used a modification of the method described by Chang et al. (1996) for GABAA receptors, which infers the number of subunits from the number of components in compound concentration-response curves to ACh derived from experiments with receptors assembled from wild-type and mutant subunits. The strategy of using mutant subunits that confer different single-channel properties to assembled receptors was used originally to determine the stoichiometry of the main CNS nAChR, (α4)2(β2)3 (Cooper et al., 1991). In the present experiments, the proportion of each component within the total population of receptors (e.g., α9α10, α9α9*α10, α9*α10) that can be deduced from the percentage of maximal response for each component in the compound concentration-response curves deviated from that predicted by a binomial distribution. For example, at a wild-type to mutant ratio of α9:α9* of 1:1 (Table 1), the percentage of maximal responses included 11.8, 28.8, and 58.1% for the α9*α10, α9α9*α10, and α9α10 components, respectively. If we assume that the proportion of each component was to follow a binomial distribution, the predicted percentage of maximal responses should have been 25, 50, and 25%, respectively. Moreover, because in the V13′T mutant channel opening is favored and desensitization is decreased when compared with wild-type receptors (Plazas et al., 2005), one would expect that components including mutant subunits should be favored over the wild-type component, a prediction that is opposite to the observed experimental results. One possible explanation could be that the assembly and/or trafficking to the membrane is less efficient for receptors that include mutant subunits. However, this does not rule out the prediction that, when assembled, subunit arrangements of mutant and wild-type receptors within the pentameric complex are equivalent and therefore that the stoichiometry can be deduced from the number of components in the compound concentration-response curves. Mutations in the TM2 are not expected to influence the correct assembly directly, because the sequence determinants for subunit assembly are not in the pore region (Gu et al., 1991; Yu and Hall, 1994; Kreienkamp et al., 1995). Moreover, our conclusions are strengthened by the agreement between the observed and predicted EC50 values. In the case of GABAA receptors that assemble from 9′ mutant subunits, a similar deviation from the binomial distribution has been observed (Chang et al., 1996).
Two different approaches have shown independently that chick α4β2 nAChRs have a stoichiometry of (α4)2(β2)3 when expressed in Xenopus laevis oocytes from cRNAs or cDNAs injected at a 1:1 α to β ratio (Anand et al., 1991; Cooper et al., 1991). However, alternate stoichiometries might exist, depending on the experimental conditions. Thus, increasing the amount of transfected β2 cDNA to human kidney cells, as well as an overnight incubation in nicotine or an overnight culture at 29°C, results in an increase in receptors with a (α4)3(β2)2 stoichiometry. Moreover, when the rat α4:β2 subunit ratio is varied from 1:1 to 1:9, nAChRs of more than one functional class are formed in oocytes (Zwart and Vijverberg, 1998). In addition, heterogeneity of neuronal nAChRs has been suggested from the observation that the occurrence of distinct single-channel conductances in oocytes expressing neuronal-type nAChRs depends on the α:β ratio (Papke et al., 1989). The existence of alternate stoichiometries for the same assembled subunits with distinct functional properties raises the possibility for an interesting mode of synaptic regulation of nicotinic signaling in the mammalian brain (Nelson et al., 2003).
Our results indicate that up to a 1:4 or a 4:1 ratio of α9 to α10, derived from the analysis of shifts in the EC50 values, only one functional class of receptor is formed with a fixed stoichiometry. We cannot preclude the possibility that, under different experimental conditions or at extreme differences in the rate of transcription of the genes coding for the α9 and α10 subunits, alternate stoichiometries might exist. However, because both α9 and α10 subunits are expressed at high levels in outer hair cells (Elgoyhen et al., 1994, 2001; Simmons and Morley, 1998; Morley and Simmons, 2002), it is unlikely that one subunit might be a limiting factor for the assembly of the more abundant representative form of the receptor. In addition, although the transcription of the gene coding for the α10 (but not the α9) gene undergoes drastic developmental changes before the onset of hearing (second postnatal week) in rats (Morley and Simmons, 2002; Katz et al., 2004), the properties of the native α9α10-containing inner hair cell receptor highly resemble those of heteromeric α9α10 expressed in Xenopus oocytes (Gomez-Casati et al., 2005).
Extrapolating the stoichiometry of native receptors from the present results would be too far-fetched. However, the biophysical and pharmacological properties of native receptors mirror those of the recombinant α9α10 nAChR expressed in Xenopus oocytes (Elgoyhen et al., 1994, 2001; Gomez-Casati et al., 2005), thus arguing in favor of the hypothesis that native and recombinant receptors might have a similar stoichiometry. Moreover, cross-linking, affinity chromatography purification, or immunopurification experiments with receptors extracted from native tissue, like those performed for other Cys-loop receptors (Hucho et al., 1978; Einarson et al., 1982; Whiting et al., 1987; Langosch et al., 1988; Keyser et al., 1993), will result in a challenge in the case of α9α10 native nAChRs because of the limited number of hair cells per cochlea. Thus, the present experiments might be the best approximation to start elucidating the molecular arrangement of the α9α10 nAChR.
The order of subunits around the channel in the neuronal α4β2 nAChR is presumed to be α4β2α4β2β2 by homology with the αγαβδ organization of the Torpedo californica and muscle nAChRs (Karlin et al., 1983; Karlin, 2002; Le Novere et al., 2002; Miyazawa et al., 2003). This provides two ACh-binding sites at specific interfaces of α4 and β2 subunits and allows the third β2, which is not involved in forming an ACh-binding site, to occupy a position equivalent to that of muscle or Torpedo californica β subunits. The much stronger affinity labeling with competitive antagonists of α1 compared with that of the γ and δ subunits supports an asymmetric location of the binding site with respect to the interface. This has led to the proposal to refer to the α1 subunits as carrying the “principal component” and the δ or γ subunits as contributing to the “complementary component” of the nicotinic binding site (Le Novere et al., 2002). By comparison, the β subunit would contribute to the complementary component in the neuronal nAChRs. By homology, and when we take into account that α9 nAChR subunits can form homomeric channels whereas α10 cannot and that α10 behaves as a structural subunit in the α9α10 heteromer to render a receptor with distinct properties (Elgoyhen et al., 2001), it is tempting to speculate an α9α10α9α10α10 arrangement within the pentamer. However, it has been reported that subunit chimeras constructed to contain the extracellular ligand-binding domain of the α9 or α10 subunits fused to the C-terminal domain of the 5-hydroxytryptamine type 3A subunit bind the nicotinic radioligand [3H]methyllycaconitine with specific high affinity (Baker et al., 2004). Therefore, either α9 or α10 or both could contribute to the main component of the binding site, resulting in alternative arrangements. Additional experiments, including the analysis of receptors formed from linked subunits (Baumann et al., 2001; Zhou et al., 2003), will be necessary to elucidate the arrangement of subunits within the α9α10 nAChR. Although the potential subunit arrangement and interaction underlying the binding of ACh and gating of this special receptor are yet to be elucidated, knowledge of the stoichiometry will facilitate structure-function studies tending to elucidate a model for the α9α10 receptor-channel complex.
Footnotes
This work was supported by an international research scholar grant from the Howard Hughes Medical Institute, National Institutes of Health Research Grant R03TW006247 from the Fogarty International Center and the National Institute on Deafness and Other Communication Disorders, the National Organization for Hearing Research, an H. F. Lenfest grant in Auditory Science, and a research grant from the National Agency of Scientific and Technological Promotion (ANPCyT) and University of Buenos Aires (Argentina) to A.B.E. This work was also supported by grants from ANPCyT, National Council of Scientific and Technical Investigations, and National University of the South (Argentina) to C.B.
Correspondence should be addressed to Dr. Ana Belén Elgoyhen, Institute of Investigations in Genetic Engineering and Molecular Biology, University of Buenos Aires, Vuelta de Obligado 2490, Buenos Aires 1428, Argentina. E-mail: elgoyhen@dna.uba.ar.
Copyright © 2005 Society for Neuroscience 0270-6474/05/2510905-08$15.00/0
References
- Anand R, Conroy W, Schoepfer R, Whiting P, Lindstrom J (1991) Neuronal nicotinic acetylcholine receptors expressed in Xenopus oocytes have a pentameric quaternary structure. J Biol Chem 266: 11192-11198. [PubMed] [Google Scholar]
- Baker ER, Zwart R, Sher E, Millar NS (2004) Pharmacological properties of α9α10 nicotinic acetylcholine receptors revealed by heterologous expression of subunit chimeras. Mol Pharmacol 65: 453-460. [DOI] [PubMed] [Google Scholar]
- Balestra B, Vailati S, Moretti M, Hanke W, Clementi F, Gotti C (2000) Chick optic lobe contains a developmentally regulated α2α5β2 nicotinic receptor subtype. Mol Pharmacol 58: 300-311. [DOI] [PubMed] [Google Scholar]
- Baumann SW, Baur R, Sigel E (2001) Subunit arrangement of γ-aminobutyric acid type A receptors. J Biol Chem 276: 36275-36280. [DOI] [PubMed] [Google Scholar]
- Boorman JP, Groot-Kormelink PJ, Sivilotti LG (2000) Stoichiometry of human recombinant neuronal nicotinic receptors containing the β3 subunit expressed in Xenopus oocytes. J Physiol (Lond) 529: 565-577. [DOI] [PMC free article] [PubMed] [Google Scholar]
- Boulter J, Connolly J, Deneris E, Goldman D, Heinemann S, Patrick J (1987) Functional expression of two neuronal nicotinic acetylcholine receptors from cDNA clones identifies a gene family. Proc Natl Acad Sci USA 84: 7763-7767. [DOI] [PMC free article] [PubMed] [Google Scholar]
- Chang Y, Wang R, Barot S, Weiss DS (1996) Stoichiometry of a recombinant GABAA receptor. J Neurosci 16: 5415-5424. [DOI] [PMC free article] [PubMed] [Google Scholar]
- Colquhoun LM, Patrick JW (1997) α3, β2, and β4 form heterotrimeric neuronal nicotinic acetylcholine receptors in Xenopus oocytes. J Neurochem 69: 2355-2362. [PubMed] [Google Scholar]
- Conroy WG, Berg DK (1998) Nicotinic receptor subtypes in the developing chick brain: appearance of a species containing the α4, β2, and α5 gene products. Mol Pharmacol 53: 392-401. [DOI] [PubMed] [Google Scholar]
- Conroy WG, Vernallis AB, Berg DK (1992) The α5 gene product assembles with multiple acetylcholine receptor subunits to form distinctive receptor subtypes in brain. Neuron 9: 679-691. [DOI] [PubMed] [Google Scholar]
- Cooper E, Couturier S, Ballivet M (1991) Pentameric structure and subunit stoichiometry of a neuronal nicotinic acetylcholine receptor. Nature 350: 235-238. [DOI] [PubMed] [Google Scholar]
- Couturier S, Bertrand D, Matter J-M, Hernandez M-C, Bertrand S, Millar N, Valera S, Barkas T, Ballivet M (1990) A neuronal nicotinic acetylcholine receptor subunit (α7) is developmentally regulated and forms a homooligomeric channel blocked by α-BTX. Neuron 5: 847-856. [DOI] [PubMed] [Google Scholar]
- Deneris ES, Connolly J, Boulter J, Wada E, Wada K, Swanson LW, Patrick J, Heinemann S (1988) Primary structure and expression of β2: a novel subunit of neuronal nicotinic acetylcholine receptors. Neuron 1: 45-54. [DOI] [PubMed] [Google Scholar]
- Duvoisin RM, Deneris ES, Patrick J, Heinemann S (1989) The functional diversity of the neuronal nicotinic acetylcholine receptors is increased by a novel subunit: β4. Neuron 3: 487-496. [DOI] [PubMed] [Google Scholar]
- Einarson B, Gullick W, Conti-Tronconi B, Ellisman M, Lindstrom J (1982) Subunit composition of bovine muscle acetylcholine receptor. Biochemistry 21: 5295-5302. [DOI] [PubMed] [Google Scholar]
- Elgoyhen AB, Johnson DS, Boulter J, Vetter DE, Heinemann S (1994) α9: an acetylcholine receptor with novel pharmacological properties expressed in rat cochlear hair cells. Cell 79: 705-715. [DOI] [PubMed] [Google Scholar]
- Elgoyhen AB, Vetter D, Katz E, Rothlin C, Heinemann S, Boulter J (2001) α10: a determinant of nicotinic cholinergic receptor function in mammalian vestibular and cochlear mechanosensory hair cells. Proc Natl Acad Sci USA 98: 3501-3506. [DOI] [PMC free article] [PubMed] [Google Scholar]
- Filatov GN, White MM (1995) The role of conserved leucines in the M2 domain of the acetylcholine receptor in channel gating. Mol Pharmacol 48: 379-384. [PubMed] [Google Scholar]
- Gerzanich V, Kuryatov A, Anand R, Lindstrom J (1997) “Orphan” α6 nicotinic AChR subunit can form a functional heteromeric acetylcholine receptor. Mol Pharmacol 51: 320-327. [PubMed] [Google Scholar]
- Gerzanich V, Wang F, Kuryatov A, Lindstrom J (1998) α5 subunit alters desensitization, pharmacology, Ca2+ permeability, and Ca2+ modulation of human neuronal α3 nicotinic receptors. J Pharmacol Exp Ther 286: 311-320. [PubMed] [Google Scholar]
- Goldman D, Deneris E, Luyten W, Kochhar A, Patrick J, Heinemann S (1987) Members of a nicotinic acetylcholine receptor gene family are expressed in different regions of the mammalian central nervous system. Cell 48: 956-973. [DOI] [PubMed] [Google Scholar]
- Gomez-Casati ME, Fuchs PA, Elgoyhen AB, Katz E (2005) Biophysical and pharmacological characterization of nicotinic cholinergic receptors in cochlear inner hair cells. J Physiol (Lond) 566: 103-118. [DOI] [PMC free article] [PubMed] [Google Scholar]
- Gotti C, Hanke W, Maury K, Moretti M, Ballivet M, Clementi F, Bertrand D (1994) Pharmacology and biophysical properties of α7 and α7-α8 α-bungarotoxin receptor subtypes immunopurified from the chick optic lobe. Eur J Neurosci 6: 1281-1291. [DOI] [PubMed] [Google Scholar]
- Groot-Kormelink PJ, Luyten WH, Colquhoun D, Sivilotti LG (1998) A reporter mutation approach shows incorporation of the “orphan” subunit β3 into a functional nicotinic receptor. J Biol Chem 273: 15317-15320. [DOI] [PubMed] [Google Scholar]
- Gu Y, Camacho P, Gardner P, Hall ZW (1991) Identification of two amino acid residues in the epsilon subunit that promote mammalian muscle acetylcholine receptor assembly in COS cells. Neuron 6: 879-887. [DOI] [PubMed] [Google Scholar]
- Hucho F, Bandini G, Suarez-Isla BA (1978) The acetylcholine receptor as part of a protein complex in receptor-enriched membrane fragments from Torpedo californica electric tissue. Eur J Biochem 83: 335-340. [DOI] [PubMed] [Google Scholar]
- Karlin A (2002) Ion channel structure: emerging structure of the nicotinic acetylcholine receptors. Nat Rev Neurosci 3: 102-114. [DOI] [PubMed] [Google Scholar]
- Karlin A, Holtzman E, Yodh N, Lobel P, Wall J, Hainfeld J (1983) The arrangement of the subunits of the acetylcholine receptor of Torpedo californica J Biol Chem 258: 6678-6681. [PubMed] [Google Scholar]
- Katz E, Verbitsky M, Rothlin C, Vetter D, Heinemann S, Elgoyhen A (2000) High calcium permeability and calcium block of the α9 nicotinic acetylcholine receptor. Hear Res 141: 117-128. [DOI] [PubMed] [Google Scholar]
- Katz E, Elgoyhen AB, Gomez-Casati ME, Knipper M, Vetter DE, Fuchs PA, Glowatzki E (2004) Developmental regulation of nicotinic synapses on cochlear inner hair cells. J Neurosci 24: 7814-7820. [DOI] [PMC free article] [PubMed] [Google Scholar]
- Keyser KT, Britto LR, Schoepfer R, Whiting P, Cooper J, Conroy W, Brozozowska-Prechtl A, Karten HJ, Lindstrom J (1993) Three subtypes of α-bungarotoxin-sensitive nicotinic acetylcholine receptors are expressed in chick retina. J Neurosci 13: 442-454. [DOI] [PMC free article] [PubMed] [Google Scholar]
- Kreienkamp HJ, Maeda RK, Sine SM, Taylor P (1995) Intersubunit contacts governing assembly of the mammalian nicotinic acetylcholine receptor. Neuron 14: 635-644. [DOI] [PubMed] [Google Scholar]
- Labarca C, Nowak MW, Zhang H, Tang L, Deshpande P, Lester HA (1995) Channel gating governed symmetrically by conserved leucine residues in the M2 domain of nicotinic receptors. Nature 376: 514-516. [DOI] [PubMed] [Google Scholar]
- Langosch D, Thomas L, Betz H (1988) Conserved quaternary structure of ligand-gated ion channels: the postsynaptic glycine receptor is a pentamer. Proc Natl Acad Sci USA 85: 7394-7398. [DOI] [PMC free article] [PubMed] [Google Scholar]
- Le Novere N, Changeux J (1995) Molecular evolution of the nicotinic acetylcholine receptor: an example of multigene family in excitable cells. J Mol Evol 40: 155-172. [DOI] [PubMed] [Google Scholar]
- Le Novere N, Corringer PJ, Changeux JP (2002) The diversity of subunit composition in nAChRs: evolutionary origins, physiologic and pharmacologic consequences. J Neurobiol 53: 447-456. [DOI] [PubMed] [Google Scholar]
- Miyazawa A, Fujiyoshi Y, Unwin N (2003) Structure and gating mechanism of the acetylcholine receptor pore. Nature 423: 949-955. [DOI] [PubMed] [Google Scholar]
- Morley BJ, Simmons DD (2002) Developmental mRNA expression of the α10 nicotinic acetylcholine receptor subunit in the rat cochlea. Brain Res Dev Brain Res 139: 87-96. [DOI] [PubMed] [Google Scholar]
- Nelson ME, Kuryatov A, Choi CH, Zhou Y, Lindstrom J (2003) Alternate stoichiometries of α4β2 nicotinic acetylcholine receptors. Mol Pharmacol 63: 332-341. [DOI] [PubMed] [Google Scholar]
- Papke RL, Boulter J, Patrick J, Heinemann S (1989) Single-channel currents of rat neuronal nicotinic acetylcholine receptors expressed in Xenopus oocytes. Neuron 3: 589-596. [DOI] [PubMed] [Google Scholar]
- Plazas PV, De Rosa MJ, Gomez-Casati ME, Verbitsky M, Weisstaub N, Katz E, Bouzat C, Elgoyhen AB (2005) Key roles of hydrophobic rings of TM2 in gating of the α9α10 nicotinic cholinergic receptor. Br J Pharmacol 145: 963-974. [DOI] [PMC free article] [PubMed] [Google Scholar]
- Rothlin C, Verbitsky M, Katz E, Elgoyhen A (1999) The α9 nicotinic acetylcholine receptor shares pharmacological properties with type A γ-aminobutyric acid, glycine and type 3 serotonin receptors. Mol Pharmacol 55: 248-254. [DOI] [PubMed] [Google Scholar]
- Sgard F, Charpentier E, Bertrand S, Walker N, Caput D, Graham D, Bertrand D, Besnard F (2002) A novel human nicotinic receptor subunit, α10, that confers functionality to the α9-subunit. Mol Pharmacol 61: 150-159. [DOI] [PubMed] [Google Scholar]
- Simmons DD, Morley BJ (1998) Differential expression of the α9 nicotinic acetylcholine receptor subunit in neonatal and adult cochlear hair cells. Brain Res Mol Brain Res 56: 287-292. [DOI] [PubMed] [Google Scholar]
- Vernallis AB, Conroy WG, Berg DK (1993) Neurons assemble acetylcholine receptors with as many as three kinds of subunits while maintaining subunit segregation among receptor subtypes. Neuron 10: 451-454. [DOI] [PubMed] [Google Scholar]
- Weisstaub N, Vetter D, Elgoyhen A, Katz E (2002) The α9/α10 nicotinic acetylcholine receptor is permeable to and is modulated by divalent cations. Hear Res 167: 122-135. [DOI] [PubMed] [Google Scholar]
- Whiting PJ, Liu R, Morley BJ, Lindstrom JM (1987) Structurally different neuronal nicotinic acetylcholine receptor subtypes purified and characterized using monoclonal antibodies. J Neurosci 7: 4005-4016. [DOI] [PMC free article] [PubMed] [Google Scholar]
- Yu XM, Hall ZW (1994) A sequence in the main cytoplasmic loop of the α-subunit is required for assembly of mouse muscle nicotinic acetylcholine receptor. Neuron 13: 247-255. [DOI] [PubMed] [Google Scholar]
- Zhou Y, Nelson ME, Kuryatov A, Choi C, Cooper J, Lindstrom J (2003) Human α4β2 acetylcholine receptors formed from linked subunits. J Neurosci 23: 9004-9015. [DOI] [PMC free article] [PubMed] [Google Scholar]
- Zwart R, Vijverberg HP (1998) Four pharmacologically distinct subtypes of α4β2 nicotinic acetylcholine receptor expressed in Xenopus laevis oocytes. Mol Pharmacol 54: 1124-1131. [PubMed] [Google Scholar]