

Abstract
The olfactory receptor (OR) superfamily provides a basis for the remarkable ability to recognize and discriminate a large number of odorants. In mice, the superfamily includes ∼1000 members, and they recognize overlapping sets of odorants with distinct affinities and specificities. To address the molecular basis of odor discrimination by the mammalian OR superfamily, we performed functional analysis on a series of site-directed mutants and performed ligand docking simulation studies to define the odorant-binding site of a mouse OR. Our results indicate that several amino acids in the transmembrane domains formed a ligand-binding pocket. Although other G-protein-coupled receptors (GPCRs) recognize biogenic ligands mainly with ionic or hydrogen bonding interactions, ORs recognize odorants mostly via hydrophobic and van der Waals interactions. This accounts for the broad but selective binding by ORs as well as their relatively low ligand-binding affinities. Furthermore, we succeeded in rational receptor design, inserting point mutations in the odorant-binding site that resulted in predicted changes in ligand specificity and antagonist activity. This ability to rationally design the receptor validated the binding site structure that was deduced with our mutational and ligand docking studies. Such broad and specific sensitivity suggests an evolutionary process during which mutations in the active site led to an enormous number of ORs with a wide range of ligand specificity. The current study reveals the molecular environment of the odorant-binding site, and it further advances the understanding of GPCR pharmacology.
Keywords: computer modeling, G-protein-coupled receptor, ligand binding, mutation, odorant, olfactory receptor
Introduction
The vertebrate olfactory system has evolved the ability to recognize and discriminate thousands of structurally diverse odorants. A molecular basis for the detection of odorants was provided by the discovery of the olfactory receptor (OR) superfamily, which is a large family of multigenes that encode rhodopsin-like G-protein-coupled receptors (GPCRs) (Buck and Axel, 1991). The OR proteins are key players in the binding of odorants and the conversion of chemical information into electronic signals in olfactory neurons (Shepherd, 1994; Buck, 1996; Firestein, 2001; Touhara, 2002; Mombaerts, 2004).
The current paradigm of OR-odorant interactions is based on studies of a limited number of ORs that have been functionally matched with their cognate ligands. Each odorant is recognized by multiple ORs, whereas an individual OR can bind multiple odorants with distinct affinities and specificities (Zhao et al., 1998; Touhara et al., 1999; Wetzel et al., 1999; Araneda et al., 2000; Kajiya et al., 2001); however, the mechanism of odorant recognition by ORs was found to be more complex than this model. Recent evidence indicates that some odorants cannot only activate but also can inhibit ORs (Oka et al., 2004a,b). This dual function of an odorant as an agonist and antagonist may provide insight into the structure-function relationship of GPCRs in general.
Multiple alignment analysis of the OR superfamily has allowed identification of highly conserved and variable regions that are likely to be involved in structural organization and ligand recognition, respectively (Buck and Axel, 1991; Zhang and Firestein, 2002). Some previous attempts, such as correlated mutational analysis (Singer et al., 1996) and Fourier analysis of multiple OR sequences (Pilpel and Lancet, 1999; Man et al., 2004), further supported the hypothesis that variable residues are responsible for odorant binding (Lancet, 1986). Computer modeling strategy was first used for the rat OR5 using coordinates of bacteriorhodopsin, a non-GPCR seven-transmembrane helix protein (Singer and Shepherd, 1994; Singer et al., 1995), and later, similar analyses were performed for two ORs, mouse S25 (putative hexanol receptor) (Floriano et al., 2000) and rat I7 (octanal receptor) (Singer, 2000), based on the 7.5 Å rhodopsin structure (Schertler, 1998). Most recently, using a 2.8 Å rhodopsin structure (Palczewski et al., 2000), computer modeling and calculation of lowest ligand-binding energy for several ORs were demonstrated (Vaidehi et al., 2002; Floriano et al., 2004); however, previous analyses lacked functional studies to compensate for the ambiguity of computer simulation and to validate the accuracy of the prediction.
mOR-EG is a mouse OR that was isolated from an eugenol (EG)-responsive olfactory neuron by Ca2+ imaging and single-cell RT-PCR (Kajiya et al., 2001). The response of mOR-EG to EG was recapitulated in a heterologous expression system using human embryonic kidney (HEK) 293T cells (Kajiya et al., 2001), as well as in an in vivo system using transgenic mice (our unpublished results). Recently, the odorant response assay using a Ca2+ imaging technique was greatly improved such that >80% of HEK293 cells transfected with mOR-EG and Gα15 responded to EG (Katada et al., 2003). In addition to efficiency and reproducibility of the response assays, mOR-EG is an excellent OR for systematic structure-activity relationship studies and computer docking simulation. EG, one of the mOR-EG ligands, is a superior ligand to study because the functional groups are at fixed positions on a benzene ring and it has fewer potential conformations, relative to aliphatic odorants. Finally, several competitive antagonists have been identified for mOR-EG (Oka et al., 2004a,b), providing a tool to investigate the molecular basis for odorant recognition and the mechanism of subsequent receptor dynamics.
In the current studies, we thoroughly examined the ligand specificity of mOR-EG. We found that this receptor recognizes 22 odorants that share certain molecular determinants, with EC50 values ranging from a few micromolar to several hundred micromolar. We then attempted to elucidate the odorant-binding environment in mOR-EG and to determine how the ligand-binding site confers such a broad but specific receptive range. To map the odorant-binding site, we combined computational and mutational analyses, resulting in a reliable structural model for OR-odorant interactions. The critical finding in this report was the ability to use the deduced model and site-directed mutagenesis to rationally design an OR with a predicted specificity for agonists and antagonists. The present study not only sheds light on the molecular pharmacology of GPCRs in general but also on how the OR family has evolved the ability to recognize such a variety of chemical structures.
Materials and Methods
Materials and reagents. Odorant solutions were prepared as 1 or 3 mm stocks in Ringer's solution containing (in mm): 140 NaCl, 5.6 KCl, 2.0 CaCl2, 2.0 MgCl2, 5.0 HEPES, 2.0 sodium pyruvate, 9.4 glucose, and 1.25 KH2PO4, pH 7.4, and diluted to give the indicated concentrations before experiments. EG was purchased from Nacalai Tesque (Kyoto, Japan), and other odorants were obtained from Tokyo Kasei (Tokyo, Japan), Sigma-Aldrich (St. Louis, MO), or T. Hasegawa (Tokyo, Japan). Isoproterenol hydrochloride was purchased from Nacalai Tesque. The mOR-EG (Kajiya et al., 2001) is a mouse OR encoded by the MOR174-9 gene, according to the nomenclature by Zhang and Firestein (Zhang and Firestein, 2002); see also http://senselab.med.yale.edu/senselab/ORDB/default.asp.
Ca2+ imaging. HEK293 cells were grown in DMEM (Nacalai Tesque) supplemented with 10% fetal bovine serum (JRH Bioscience). The transfection and Ca2+ imaging of HEK293 cells were performed using the following procedure as described previously (Katada et al., 2003). Briefly, the transfected cells were cultured for 24 h and loaded for 30 min at 37°C with 2.5 μm fura-2 AM (Molecular Probes, Eugene, OR). Odorant solutions were applied sequentially to the cells for 20 s, and a 3 min interval between each odorant application ensured that the cells were not desensitized as a result of the previous application of odorants. Fluorescence at 510 nm (excitation at 340 or 380 nm with a xenon lamp) was monitored with an intensified CCD camera. An Argus-HiSCA calcium-imaging system (Hamamatsu Photonics, Shizouka, Japan) was used to determine the fluorescence ratio at 340 and 380 nm.
Molecular modeling of mOR-EG and mapping of a possible ligand-binding pocket. The mOR-EG sequence was aligned with the bovine rhodopsin sequence (Palczewski et al., 2000) using Clustal W (version 1.8) multiple alignment program (Thompson et al., 1994). The alignment was refined manually based on the sequence motif information from the OR family sequence (Zhang and Firestein, 2002) and the compatibility of the amino acid position with the corresponding structure of the bovine rhodopsin. Putative transmembrane regions in mOR-EG were predicted using the actual transmembrane regions of bovine rhodopsin. A three-dimensional model of mOR-EG was constructed using a homology modeling approach incorporated in the program SegMod (Levitt, 1992) of GeneMine (Lee and Irizarry, 2001). The conformations of the conserved residues were kept in the mOR-EG model, and the other residues were adapted according to the alignment. Because mOR-EG seemed to form an eighth helix like that observed in the structure of rhodopsin (Katada et al., 2004), the same structure was maintained in the mOR-EG model. The ligand binding site of mOR-EG was identified by cavity search of the protein structure. One dot per angstrom of grid was sited in mOR-EG, and an open site cut-off value (7.0 Å) was used to find acceptable cavities. Sphere clusters were generated for the whole receptor, and cavities smaller than the 50.0 point were cut off. This allowed identification of six acceptable cavities in the receptor. One of these covers the extracellular portion of the receptor, as well as two-thirds of the inside of the helical barrel. This is a location similar to the established ligand-binding pockets of other GPCRs.
Docking simulation of the receptor-ligand complexes. Automatic docking was performed with the AS-Dock program on Molecular Operating Environment (MOE) (Chemical Computing Group) (Kataoka and Goto, 2002). AS-Dock docking consists mainly of three steps: generating conformations of ligand, shape fitting on receptor surface, and energy minimization. A maximum of 2000 conformations per ligand were generated by the stochastic conformation search method and stored into a database file if no duplicate was found with the root mean square (rms) tolerance (cut-off 0.5 Å). Every conformation of a ligand was placed in the promising binding cavity site comprising three helices (TM3-5-6) by superimposing it onto a grid sphere site. Each ligand-receptor complex model generated in a previous step was subsequently subjected to refinement using the molecular mechanics minimization protocol and the MMFF94x force field (Halgren, 1996a,b,c,d,e) in MOE. In the minimization step, structural flexibilities of both ligand and side-chain atoms in the residues within 4.5 Å around the grid sphere site were allowed. The distance-dependent dielectric constant and distance cut-off (8-10 Å) were used for nonbonded interaction energy calculation. Energy minimization was terminated when the rms gradient fell below the cutoff value (0.001 Å). The total energy was calculated from the sum of ligand-receptor interaction energy (electrostatic and van der Waals) and intra-energy of ligand molecule. The resulting ligand structures were aligned according to total energy, and the first structural cluster (each structural member was within 10 kcal/mol from the lowest energy structure) was considered as a candidate ligand-receptor complex.
Site-directed mutagenesis. Mutations were introduced into mOR-EG cDNA using the QuickChange site-directed mutagenesis kit (Stratagene, La Jolla, CA). All of the single mutation products were digested with EcoRI and XhoI, and fragments were inserted into the EcoRI-XhoI site of the Flag-rho-pME18S vector. All mutations were confirmed by DNA sequencing, using a BigDye Terminator v3.1 Cycle Sequencing kit (Applied Biosystems, Foster City, CA).
cAMP assay. Transfection of and cAMP assay in HEK293 cells was performed using the following procedure as described previously (Katada et al., 2003). Briefly, the mOR-EG-transfected cells were cultured for 24 h and incubated further for 30 min with 1 mm 3-isobutyl-1-methylxanthine (IBMX). The cells were exposed to the indicated concentration of odorant solution containing 1 mm IBMX for 15 min. The levels of cAMP were determined using an enzyme immunoassay kit (Applied Biosystems).
Immunoprecipitation and Western blot analyses. Immunoprecipitation and Western blot analyses were performed using the following procedure as described previously (Katada et al., 2003). Briefly, mOR-EG-transfected cells were lysed and immunoprecipitated with anti-Flag monoclonal antibodies (Sigma-Aldrich). The immunoprecipitated samples were separated on a 12% SDS-polyacrylamide gel and then transferred electrophoretically onto a polyvinylidene difluoride membrane. The membrane was blocked with 5% skim milk in Tris-buffered saline (150 mm NaCl, 30 mm Tris-HCl, pH 7.5) with 0.1% Tween 20 (TBST) for 1 h and then incubated with anti-Flag polyclonal antibody (1:1000 dilution in TBST) for 1 h. After a 1 h incubation with 1:10,000 anti-rabbit IgG-alkaline phosphatase conjugate (Promega, Madison, WI) in TBST, signals were detected by applying nitroblue tetrazolium and 5-bromo-4-chloro-3-indolyl-phosphate (Promega).
Flow cytometric analysis. Flow cytometric analysis was performed using the following procedure as described previously (Katada et al., 2004). Briefly, mOR-EG-transfected cells were washed once with PBS and stripped off from the dish with PBS containing 5 mm EDTA. The cells were then labeled with anti-Flag antibodies and Alexa Fluor 488 anti-mouse IgG and then applied to a FACS Calibur instrument (Becton Dickinson, Mountain View, CA). Approximately 10,000 events were collected. Histograms were generated using CELLQuest software (Becton Dickinson).
Results
Determination of the molecular receptive range of mOR-EG in the Ca2+ imaging assay
Several functional assays using various homologous and heterologous expression systems have been developed for examining odorant responsiveness (Mombaerts, 2004). Among these assays, Ca2+ imaging in HEK293 cells coexpressing the promiscuous G-protein, Gα15, is a reliable high-throughput system that allows for determination of the dose dependence of odorant-OR interactions (Kajiya et al., 2001; Katada et al., 2003). To construct a structure-activity matrix for mOR-EG, we tested a series of odorants based on the structure of known mOR-EG ligands, EG (Fig. 1A, compound 4) and vanillin (compound 5), with variations at the R1, R3, and R4 positions on the benzene ring (Kajiya et al., 2001). Figure 1 shows pseudocolored images and a representative profile of Ca2+ responses to a systematic array of odorants (100 μm) in HEK293 cells expressing mOR-EG and Gα15. We also examined the dose dependence for odorants that could stimulate mOR-EG.
Figure 1.
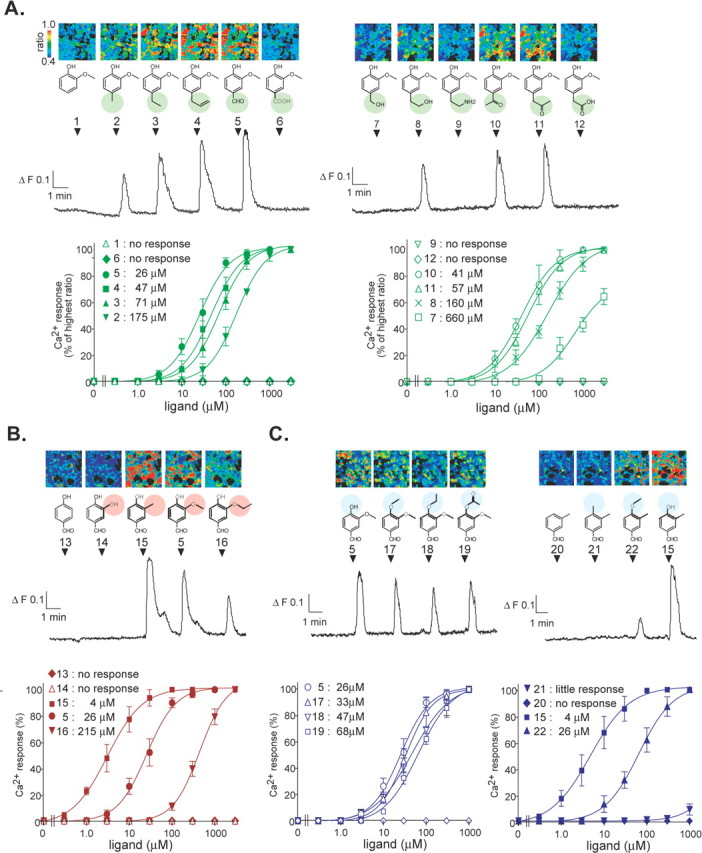
Representative Ca2+ responses and dose-response profiles for various ligands in HEK293 cells expressing mOR-EG and Gα15. Pseudocolored images and Ca2+ response profile 24 h after transfection in a representative single HEK293 cell that transiently expresses Flag-rho-tagged mOR-EG and Gα15. Odorants (100 μm) were applied for 20 s at the times indicated by arrowheads. Red cells indicate high levels of intracellular Ca2+ measured by fluorescent ratio intensities, and blue cells represent the basal levels. The series of odorants were divided into three groups: in the first group, R3 = -OCH3, R4 = -OH, and R1 is variable (A); in the second group, R1 = -CHO, R4 = -OH, and R3 is variable (B); and, in the third group, R1 = -CHO, R3 = -OCH3 or -CH3, and R4 is variable (C). The dose-response and EC50 values for each odorant are also shown. Each point represents the mean ± SE from 50-90 cells in a representative experiment from three to five replicates.
The first series of odorants possessed an ether group (-OCH3) and a hydroxyl group (-OH) at the R3 and R4 positions, respectively, with variable groups at the R1 position (Fig. 1A). The binding pocket accommodated a wide range of functional groups at the R1 position, but a charged group, such as carboxyl acid or an amine, was not acceptable. Interestingly, odorants possessing a propenyl group at the R1 position tend to become antagonists (Oka et al., 2004a,b), suggesting that mOR-EG accepts a variety of functional groups at the R1 position but also discriminates between the subtle structural differences of, for example, an allyl group and a propenyl group.
The second series of odorants possessed an aldehyde group (-CHO) and -OH at the R1 and R4 groups, respectively, with variable groups at R3 (Fig. 1B). EC50 values increased with the size of R3, for example, 4 μm for R3 = a methyl group (-CH3) (compound 15), 26 μm for R3 = -OCH3 (compound 5), and 215 μm for R3 = -OCH2CH3 (compound 16), whereas no response was observed for R3 = -OH (compound 14) or -H (compound 13). These results suggest that the size of R3 and possibly hydrophobic interactions are important determinants for agonist activity. Finally, 4-hydroxy-3-methyl benzaldehyde (compound 15) was the most potent agonist for mOR-EG among the odorants tested in this study.
The third series of odorants possessed -CHO at R1 and either -OCH3 or -CH3 at R3, with variable groups at R4 (Fig. 1C). Relatively small differences in EC50 values were observed among odorants with changes in R4, suggesting that mOR-EG is relatively tolerant to the functional group at this position; however, little or no response was observed when R4 was -CH3 (compound 21) or -H (compound 20). Thus, the presence of an oxygen atom attached to the benzene ring seems to be required for binding activity, which implies that electrostatic interactions might be involved at this position.
The orientation of three substituted groups on the benzene ring turned out to be critical. Thus, mOR-EG did not respond to vanillin isomers such as isovanillin (R1 = -CHO, R3 = -OH, and R4 = -OCH3) and o-vanillin (R1 = -CHO, R2 = -OH, and R3 = -OCH3). Furthermore, a lack of one of the functional groups or an addition of an extra functional group (compounds 1, 13, and 20) resulted in a complete loss of activity. Systematic analysis of the structure-activity relationship revealed that mOR-EG has a broad but selective molecular receptive range.
Molecular modeling of mOR-EG and analysis of ligand docking
We next constructed a molecular model of mOR-EG. We based this model on the atomic-level crystal structure of bovine rhodopsin (Palczewski et al., 2000) because ORs appear to be members of the class A rhodopsin-like GPCR family. Multiple sequence alignment using Clustal W (Thompson et al., 1994) deduced putative transmembrane regions in mOR-EG, and a three-dimensional structural model of mOR-EG was constructed using the homology modeling approach incorporated in the Seg-Mod (Levitt, 1992) of GeneMine (Lee and Irizarry, 2001). A cavity search using the binding-site module of Insight II (Accelrys Software Inc.) revealed a putative odorant-binding pocket made up of 26 amino acid residues (Table 1). Docking analysis was performed for several mOR-EG ligands using the docking module of MOE, demonstrating multiple candidate structures for a ligand-mOR-EG. LIGPLOT scoring (Wallace et al., 1995) of both hydrogen bonds and hydrophobic contacts for various ligands suggested that the 10 amino acids set in bold in Table 1 were likely candidates for being involved in odorant recognition.
Table 1.
Amino acids in the predicted binding pocket
|
Location |
Residues |
|
|
|
|
|---|---|---|---|---|---|
| TM3 | Phe 102 | Phe 105 | Cys 106 | Phe 108 | Val 109 |
| Glu 112 | Ser 113 | Leu 116 | |||
| EC2 | Glu 181 | Phe 182 | |||
| TM5 | Thr 205 | Phe 206 | Asn 207 | Ser 210 | Thr 211 |
| Leu 212 | Ile 215 | ||||
| TM6 | Ala 248 | Ile 251 | Phe 252 | Thr 255 | Ile 256 |
| Phe 258 | Leu 259 | ||||
| TM7 |
Thr 280 |
Ile 283 |
|
|
|
A total of 26 amino acids are shown. Ten amino acids predicted to interact with EG are shown in bold type.
Site-directed mutations in amino acids with a polar side chain (Ser, Thr, and Asn)
To determine the role of these 10 amino acids, they were targeted for site-directed mutagenesis and then analyzed in a functional assay of odorant binding. EG was used for functional analysis of mutated mOR-EGs because EG has been shown to be a cognate ligand of mOR-EG in olfactory neurons in vivo (Kajiya et al., 2001; Oka et al., 2004a; our unpublished results). The docking simulation suggested that Ser113, Asn207, and Thr255 had a good chance of making a hydrophilic interaction with a ligand through hydrogen bonding. To evaluate this computer prediction experimentally, Ser113 was mutated to Thr, Cys, Val, or Ala. Responsiveness to EG was examined by Ca2+ imaging in HEK293 cells coexpressing a mutant receptor and Gα15. Both S113T and S113C exhibited responses to EG with a somewhat altered EC50 value (17 and 889 μm, respectively) compared with the wild-type mOR-EG (47 μm) (Fig. 2A). In contrast, S113A and S113V completely lost the ability to respond to EG in the Ca2+ assay (Fig. 2A). In addition, these two mutants were unable to respond to the odorants tested in Figure 1. Without Gα15, stimulation of wild-type mOR-EG or S113T resulted in a robust increase in cAMP, but an increase in cAMP was not observed for S113V and S113A (Fig. 2B), a finding consistent with the Ca2+ imaging results. Western blot and flow cytometric analyses showed that there was no significant difference between the expression of wild-type and mutant receptors on the cell surface, suggesting that the complete loss of odorant responsiveness was not caused by the membrane mistargeting of the mutant receptors (Figs. 2C,D). Mutation of Ser210, which resides in the binding pocket but does not appear to interact with ligands in the docking simulation, did not affect the responsiveness to EG (Fig. 2A). These results support the idea that Ser113 acts as hydrogen donor for the formation of a hydrogen bond with an oxygen atom at R4, which is a bond that appears to be crucial for agonist activity. The S113T mutant appeared to increase the hydrophilic interactions with a ligand, and thus, the EC50 value decreased ∼2.8-fold. In contrast, the EC50 for the S113C mutant was >10-fold higher, which corresponds with the fact that Cys is not a good hydrogen donor (Table 2).
Figure 2.

Odorant responsiveness and protein expression levels in Ser113 mutants. A, Dose-response of Ser113 and Ser210 mutants for odorants as obtained from Ca2+ imaging analyses. Ca2+ measurements were performed 24 h after transfection with each mutant to generate dose-response curves. Each point represents the mean ± SE from 60-90 cells in a representative experiment from four to eight replicates. Percentages were calculated from the increase in the ratio induced by 300 μm EG in cells expressing wild-type mOR-EG. B, EG-induced cAMP increases in HEK293 cells expressing a series of Ser113 mutants. The fold increases were calculated based on cAMP levels in mock-transfected HEK293 cells that were stimulated with 300 μm EG. The data are representative of four independent experiments. C, Immunoblot analyses of Flag-rho-tagged mOR-EG and a series of tagged Ser113 mutants 48 h after transfection. The arrow indicates the bands originating from mOR-EG and mutant receptors. There was no obvious difference in the protein expression level. D, Flow cytometric analysis of wild-type mOR-EG and S113V mutant and quantification of the amount of receptors expressed on the cell surface. Unpermeabilized HEK293 cells transfected with Flag-rho-tagged mOR-EG or S113V mutant were labeled with anti-Flag monoclonal antibodies and analyzed for surface expression. Filled gray bars represent flow cytometric profiles of control mock-transfected cells, and unfilled black bars represent the flow cytometric profiles for wild-type mOR-EG or the S113V mutant. The flow cytometric profiles for each OR and mock-transfected cells are superimposed. A slight right shift was observed with both the wild-type mOR-EG and S113V mutant, demonstrating that they are equally expressed on the cell surface.
Table 2.
Effect of point mutations of mOR-EG on EC50 values obtained from the Ca2+ response assay
|
|
Mutant |
EC50 (μm) |
EC50 wild/EC50 mut |
n |
|---|---|---|---|---|
| TM3 | F105L | 36 ± 13 | 1.2 | 3 |
| V109A | 38 ± 15 | 1.2 | 4 | |
| V109L | 42 ± 22 | 1.1 | 6 | |
| S113A | No response | 0 | 7 | |
| S113V | No response | 0 | 8 | |
| S113T | 17 ± 6 | 2.8 | 4 | |
| S113C | 889 ± 461 | 0.05 | 4 | |
| TM5 | T205A | 58 ± 12 | 0.7 | 3 |
| T205V | 36 ± 16 | 1.3 | 4 | |
| T205S | 48 ± 21 | 1.0 | 3 | |
| F206L | 107 ± 18 | 0.5 | 4 | |
| N207A | No response | 0 | 7 | |
| N207Q | No response | 0 | 8 | |
| N207D | No response | 0 | 8 | |
| S210A | 38 ± 11 | 1.2 | 5 | |
| S210T | 26 ± 13 | 1.8 | 4 | |
| S210C | 32 ± 11 | 1.5 | 4 | |
| T211A | 169 ± 62 | 0.3 | 3 | |
| T211V | 107 ± 35 | 0.4 | 4 | |
| T211S | 41 ± 11 | 1.2 | 3 | |
| L212V | 384 ± 172 | 0.1 | 4 | |
| TM6 | I251L | 40 ± 10 | 1.2 | 3 |
| I251V | 43 ± 10 | 1.1 | 4 | |
| F252L | 235 ± 81 | 0.2 | 4 | |
| T255A | 157 ± 75 | 0.3 | 3 | |
| T255V | 78 ± 27 | 0.6 | 3 | |
| T255S | 38 ± 12 | 1.2 | 3 | |
| I256L | 406 ± 115 | 0.1 | 3 | |
| I256V | 57 ± 34 | 0.8 | 3 | |
| L259V | 235 ± 68 | 0.2 | 4 | |
| TM7 | T280A | 47 ± 16 | 1.0 | 4 |
| T280V | 54 ± 11 | 0.9 | 3 | |
| T280S | 41 ± 11 | 1.1 | 3 | |
|
|
Wild type |
47 ± 17 |
|
5 |
We next tested a series of mutations at Thr residues placed in the predicted odorant-binding pocket: Thr205 (TM5), Thr211 (TM5), Thr255 (TM6), and Thr280 (TM7), each of which was replaced with Ser, Val, or Ala. In contrast to Ser113, the Val or Ala mutation at Thr211 and Thr255 did not abolish the responsiveness to EG, indicating that these residues are not involved in electrostatic interactions but rather in van der Waals interactions (Fig. 3A). Also, the mutation at Thr205 and Thr280 did not affect the responsiveness, indicating that these residues are not involved in EG recognition (Fig. 3A).
Figure 3.

Responsiveness to EG of a series of site-directed mutants. A, Dose-response curves obtained from Ca2+ imaging of HEK293 cells expressing receptors mutated at various Thr residues. Thr was mutated to Ser (purple triangle), Val (green inverted triangle), or Ala (red diamond). B, EG dose-responses of mutants at hydrophobic amino acids. Leu was mutated to Val (green inverted triangle), Ile was mutated to Leu (purple triangle) or Val (inverted green triangle), Val was mutated to Ala (red diamond) or Leu (purple triangle), and Phe was mutated to Leu (inverted purple triangle).
The docking analysis predicted that Asn207 was involved in both electrostatic and hydrophobic interactions with the ligand. N207Q and N207D mutations completely abolished Ca2+ responses to EG, although the protein expression level on the cell surface was unaltered based on Western blot and flow cytometric analyses (data not shown). Because the response activity was completely impaired, we could not determine whether Asn207 was involved in ligand binding or in proper receptor folding. Interestingly, a recent report showed that OR-directed neuronal guidance to the olfactory bulb was sensitive to mutation of Asn205 in M72, another mouse OR (Zheng et al., 2000). Because this residue corresponds to Asn207 in mOR-EG, it may provide contextual information in the receptor structure for defining the ligand-binding specificity by mOR-EG (Feinstein and Mombaerts, 2004). Importantly, this position is highly variable in the OR superfamily, also supporting the idea that it helps define ligand specificity.
Site-directed mutations in hydrophobic amino acids (Leu, Ile, Val, and Phe)
It appears that there are many hydrophobic amino acids, such as Leu, Ile, Val, and Phe, in the predicted binding pocket. These probably provide a hydrophobic environment that accommodates relatively small aliphatic molecules such as odorants. Figure 3B shows the effects of mutations in these residues on the responsiveness to EG in the Ca2+ imaging assay. We mutated Leu to Val, Ile to Leu or Val, Val to Ala or Leu, and Phe to Leu because all of these substitutions provide a minimal change in size and polarity. L212V and L259V substitutions resulted in a one-order of magnitude increase in the EC50 value, suggesting that Leu212 and Leu259 are involved in van der Waals interactions with the ligand. The I251L and I251V mutants responded to EG with the same EC50 value as the wild type mOR-EG, whereas I256L but not I256V showed a reduction in responsiveness. This suggested that Ile256 is located in close proximity to the ligand and is responsible for defining the spatial configuration of the binding pocket. A mutation at V109 and Phe105 did not affect the responsiveness to EG, whereas the EC50 values for F206L and F252L increased two- and fivefold, respectively, suggesting that Phe206 and Phe252 are likely involved in ligand recognition, as predicted by the docking simulation.
Binding of EG in the binding site and the orientation of adjacent amino acids
Figure 4A shows the structure for EG bound in the binding site that is most consistent with the experimental results and the docking analyses. Ser113 serves as a hydrogen donor and forms a hydrogen bond with an oxygen atom attached to the benzene ring at the R4 position, an interaction necessary for agonist activity (Fig. 1C). Amino acids predicted by the mutation experiments to interact with EG, such as Asn207, Leu212, Leu259, Thr211, Thr255, Ile256, Phe206, and Phe252, are all located in close proximity to EG in the defined structure (Fig. 4A). Interestingly, roughly half of the binding pocket resided in the lipid bilayer, and the amino acids in the binding site are not conserved among the OR family (Fig. 4B). This variability is consistent with their role in providing a range of molecular receptivity for the ORs.
Figure 4.
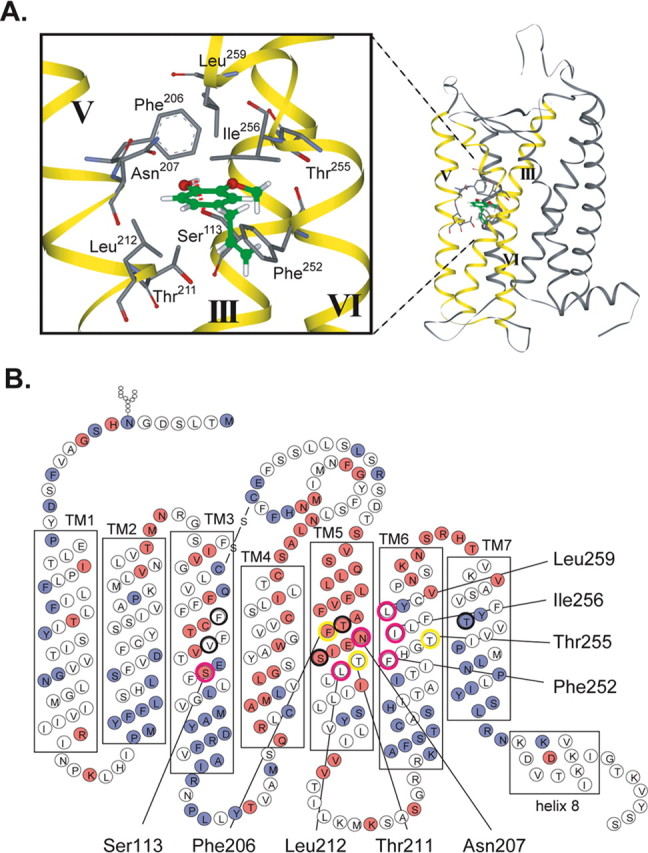
A model for binding of EG to mOR-EG and the orientation of amino acids in the binding site. A, Side view of EG bound to mOR-EG. Ser113 forms a hydrogen bond with an oxygen atom attached to the benzene ring at the R4 position (red dotted line). The orientation of amino acids in the binding site is shown, including Ser113, Phe206, Asn207, Thr211, Leu212, Phe252, Thr255, and Leu259. TMIII, V, and VI are shown as yellow ribbons. B, Location of amino acids in the binding site. Red, Variable amino acids in the OR family; blue, conserved amino acids in the OR family. Mutations in amino acids highlighted by the pink circle cause a significant (>5-fold) change in EC50 values; for those highlighted with a yellow circle, the EC50 value was modestly (<5-fold) affected; and for those indicated with a black circle, the EC50 value was not affected.
Design of a receptor with a predicted ligand specificity
Based on the binding model, we attempted to rationally design a receptor to determine whether specific point mutations would affect ligand specificity as predicted. Although Val109 appears to reside in the binding pocket, V109A or V109L substitutions do not affect the responsiveness to EG, suggesting that this residue does not make strong hydrophobic interactions with EG; however, we noticed that the score of the hydrophobic interaction between Val109 with other ligands, such as ethyl vanillin (EV) (compound 16) and 3,4-diethoxy benzaldehyde, was larger than that with EG. Indeed, Val109 was located in close proximity to a methoxy group at the R3 position of EG. Therefore, EV should interact more strongly with Val109 than EG because EV has a bulkier ethoxy group. This also suggests that the fivefold higher EC50 for EV is caused by the steric effect of Val109.
We therefore reasoned that mutation of Val109 to Ala (V109A) would reduce the EC50 value for EV. In contrast, the EC50 value of V109L for EV should become higher because Ala has less bulk and fewer steric interactions than Leu (Fig. 5A). In fact, we found that these mutations affected the EC50 values as predicted. Thus, the EC50 values of V109A and V109L for EG and 4-hydroxy-3-methyl benzaldehyde (compound 15) were the same as for the wild-type mOR-EG, whereas the EC50 value for EV was twofold lower for V109A and twofold higher for V109L. Stronger effects were observed using 3,4-diethoxy benzaldehyde, an agonist that possesses an ethoxy group at positions R3 and R4: the EC50 value for V109A was sixfold lower than the wild type, whereas V109L did not show any response to 3,4-diethoxy benzaldehyde (Fig. 5B). These results suggest that V109 is located in close proximity to the R3 position and that the size of the functional group at position R3 is one of the determinants of ligand potency. Most importantly, these observations validated the ligand binding model of mOR-EG that we had deduced based on the mutational studies.
Figure 5.

Orientation of Val109 in the binding pocket and ligand specificity of V109L and V109A mutants. A, Top view of the EG- and EV-bound mOR-EG structures. EG and EV are shown in blue and pink, respectively. Ala109 and Leu109 in Val109 mutants are shown in green. B, Ca2+ measurements were performed 24 h after transfection of each receptor, and dose-response curves were generated for EG, 4-hydroxy-3-methoxy benzaldehyde, EV, and 3,4-diethoxy benzaldehyde. The EC50 values of EV for V109L and V109A were 407 and 75 μm, respectively, whereas the EC50 value of wild-type mOR-EG for EV was 215 μm. The V109L mutant was unresponsive to 3,4-diethoxy benzaldehyde, whereas the EC50 values for the V109A mutant and the wild-type mOR-EG were 60 and 500 μm, respectively.
Elucidation of a mode of antagonist binding
We recently identified three competitive antagonists for mOR-EG: methyl isoeugenol (MIEG), isosafrole, and oxidatively dimerized isoeugenol (Oka et al., 2004a,b). A propenyl group of EG at the R1 position appears to be a prerequisite for antagonist activity (Oka et al., 2004b). The orientation of EG in the binding site is such that Phe252 is located near the allyl group of EG (Figs. 4A, 5A). We therefore hypothesized that interactions of Phe252 with a functional group at position R1 are involved in ligand binding and subsequent receptor dynamics during transition from an inactive to an active state. Thus, we reasoned that a mutation at Phe252 might affect antagonist activity. Indeed, MIEG did not inhibit the responsiveness of F252L to EG (Fig. 6). Also, T255V or V109A, which are mutations in residues just above Phe252 or near the R3 position in the binding site, showed the same antagonist sensitivity as the wild-type mOR-EG (Fig. 6). These results confirmed that Phe252 is located near the R1 position, which is consistent with the binding model, and they revealed that Phe252 is involved in antagonist recognition. Finally, an intriguing possibility is that Phe252 makes π-π interactions with a double bond of the propenyl group that is conjugated with the benzene ring. This could block conformational changes, keeping the receptor in an inactive state.
Figure 6.

Effects of mutations on the antagonist activity of MIEG. Dose-dependent inhibition of EG-induced Ca2+ increases by MIEG, an antagonist for mOR-EG, was observed for wild-type mOR-EG and the V109A and T255V mutants, but inhibition was not observed for the F252L mutant. EG (300 μm) in the presence or absence of 3000, 1000, or 300 μm MIEG was applied for 20 s to each of the receptor-expressing HEK293 cells at the time indicated by the arrowhead. EG-induced Ca2+ increases were shown for each mutant as a percentage of the Ca2+ increases induced by 300 μm EG in the absence of MIEG.
Discussion
In this study, we experimentally determined the odorant-binding site that confers the broad but selective ligand spectrum of the G-protein-coupled OR superfamily. We found that most of the critical residues involved in odorant recognition, and therefore sensitive to mutation, were hydrophobic and that the binding pocket was in the space formed by TM3, TM5, and TM6. The accuracy of the binding model that we deduced was validated by the fact that single amino acid changes caused predictable changes in ligand specificity. Based on the effects of mutations on antagonist activity, we further identified an amino acid in TM6 that was involved in receptor dynamics involved in transition from an inactive to an active conformation. The combination of functional experimental analysis and computational docking simulation strongly suggests the molecular basis of the structure-activity.
Because the GPCR families are major targets of therapeutic agents (Hopkins and Groom, 2002), many studies have focused on the molecular basis by which they bind agonists. Molecular modeling based on the atomic-level structure of a rhodopsin (Palczewski et al., 2000) and a wealth of mutational studies have revealed how ligands, such as hormones and neurotransmitters, bind seven-transmembrane GPCR proteins (Rivkees et al., 1999; Church et al., 2002; Manivet et al., 2002; Berkhout et al., 2003). It has been difficult to design agonists or antagonists based on the binding model, however, because receptor activation seems to also involve complex conformational changes. OR-odorant interactions should be an excellent model system for understanding ligand binding by GPCRs because each OR possesses a broad but specific ligand specificity and because ORs comprise the largest multigene family that belongs to the well characterized rhodopsin family of GPCRs (Bockaert and Pin, 1999).
The nature of the receptor sites that provide the molecular basis of olfactory discrimination has been argued over the years. The stereospecific receptor theory proposed by Amoore (1963) and others has been validated by the discovery of the OR superfamily and subsequent experimental functional evidence (Buck and Axel, 1991; Zhao et al., 1998; Touhara et al., 1999; Wetzel et al., 1999; Araneda et al., 2000; Kajiya et al., 2001). Physiological experiments also suggested that each functional group or “odotope,” in analogy to a pharmacophore or epitope, was a molecular determinant for the ability of odorants to act as ligands for an OR (Shepherd, 1994). Our results provide direct insight into the nature of odorant-OR interactions at the molecular level and provide evidence for a steric and functional odotope theory. The most revealing finding was that a mutation in the site that controls the ability of mOR-EG to distinguish different sizes of odorant molecules leads to an expected change in ligand specificity. We targeted Val109 for this strategy, resulting in successful rational receptor design. We further showed that ligand information or determinants were transduced by the three-dimensional configuration of the binding pocket and its specific odorant ligand. Together, these results allowed a full understanding of the molecular basis for odorant detection.
Our results revealed that nine amino acids in TM3, TM5, and TM6 were involved in odorant recognition by mOR-EG (Fig. 7). One of the critical residues is Ser113, which serves as a hydrogen donor to provide a hydrogen bond with a ligand. Consistently, recent computational studies based on computer modeling and calculation of lowest ligand-binding energy for several ORs showed that a Ser residue in TM3 serves as the anchor point for a ligand such as an aliphatic alcohol (Floriano et al., 2004). In another work, a set of 22 amino acid positions have been predicted to form the odorant-binding pocket of ORs, based on high conservation among orthologs and variability among paralogs (Man et al., 2004), four of which were matched with our predicted residues.
Figure 7.

A comparison of the ligand-binding mode of mOR-EG versus that for the β2-AR. Hydrogen bonds are shown with black arrows, and hydrophobic interactions are shown with gray arrows. EG formed multiple hydrophobic interactions and a single hydrogen bond with Ser113. In the case of β2-AR, the meta- and para-aromatic hydroxyl groups of isoproterenol form hydrogen bonds with Ser204 and Ser207, respectively, in TM5, and Asp113 in TM3 forms a salt bridge with the basic nitrogen atom.
The spatial location of the odorant-binding pocket was similar to that for other biogenic GPCRs (Rivkees et al., 1999; Church et al., 2002; Manivet et al., 2002; Berkhout et al., 2003) (Fig. 4A); however, the environment of the odorant-binding site in an OR was different from that in other GPCRs (Fig. 7). For example, catecholamines have been shown to form multiple electrostatic interactions with adrenergic receptors (ARs) (Klabunde and Hessler, 2002). Isoproterenol possesses two aromatic hydroxyl groups and one secondary amine that is conserved in the biogenic amines, and each of these form a hydrogen bond or a salt bridge with the receptor (Wieland et al., 1996). The associative strength of these ionic bonds is greater and the interaction more rigid than those that of hydrophobic or van der Waals interactions, and it accounts for high-affinity ligand binding. In contrast, hydrophobic amino acids in the odorant binding site appear to play critical roles in odorant recognition (Fig. 7). Because of the weaker association via hydrophobic interactions, OR ligands exhibit relatively high EC50 values in comparison with ligands for other GPCRs (Watson, 1994). Nonetheless, the recognition of odorants by ORs is still selective for shape, size, and length of a ligand, and this selectivity is determined by the environment of the binding site in each OR.
Mutational studies demonstrated that a subtle difference in the binding site of an OR affected odorant responsiveness. Such sensitivity implicates an evolutionary process for creating a diversity of odorant-sensing residues, because many of the amino acids that participate in ligand recognition appear to be variable in the OR family. Amino acid variations resulting from positive selection during the evolutionary process have also been found in major histocompatibility complex class I molecules, wherein the variability is found mainly in the antigen recognition site (Hughes and Nei, 1988). Furthermore, the high proportion of pseudogenes and an unusually high rate of single nucleocide polymorphisms occurred in human OR genes (Lapidot et al., 2001). Mutations in functional ORs would affect the variation in the sense of smell of humans and some of the specific amosmias.
Activation of a GPCR involves complex conformational changes from an inactive to an active form during ligand binding. It has been reported that during ligand binding, TM6 in some GPCRs undergoes a movement that unlocks a network of ionic interactions in the cytoplasmic ends of TMs, which in turn leads to the activation of downstream signaling cascades (Javitch et al., 1997; Ballesteros et al., 2001; Spalding and Burstein, 2001; Saam et al., 2002). Consistently, Phe252 in TM6 of mOR-EG appears to be critical in switching the receptor conformation from an inactive to an active state. Phe252 likely forms a stable interaction with an antagonist and helps to maintain the receptor conformation in the inactive state. Preliminary results showed that an A248G mutant in TM6 caused a reduction in the amplitude of the maximal Ca2+ responses with no change in the EC50 value (our unpublished observations), further supporting the idea that TM6 is involved in receptor activation.
In summary, our experimental evidence revealed that the odorant-binding site of an olfactory receptor lies in a hydrophobic pocket formed by TM3, TM5, and TM6, which provides the molecular basis for the broad but selective ligand spectrum of an OR. Our results suggest that the ligand specificity of an OR can be manipulated by point mutations in the binding site, allowing the OR to acquire the ability to recognize certain odorant molecules with higher affinities and others with lower affinities. In addition, it is possible to design an odorant that fits better in the binding site, which could eventually lead to the development of new, commercially useful scents or flavors. Finally, systematic mutational analysis, like that performed in the current study, will be a powerful tool for exploring the dynamics of GPCRs during ligand binding and should help in the development of therapeutic applications.
Footnotes
This work was supported in part by the Program for Promotion of Basic Research Activities for Innovative Biosciences Japan (K.T.) and by the grant-in-aid for special projects in genome science (genome informatics) from the Ministry of Education, Sports, Science and Technology (T.H., M.S.). K.T. is a recipient of grants from the Kato Memorial Bioscience Foundation and the Uehara Memorial Foundation. We thank K. Kajiya for being involved in the initial stage of this project and members of the Touhara laboratory for helpful discussion.
Correspondence should be addressed to Dr. Kazushige Touhara, Department of Integrated Biosciences, Room 201, The University of Tokyo, Kashiwa, Chiba 277-8562, Japan. E-mail: touhara@k.u-tokyo.ac.jp.
Copyright © 2005 Society for Neuroscience 0270-6474/05/251806-10$15.00/0
References
- Amoore JE (1963) Stereochemical theory of olfaction. Nature 198: 271-272. [DOI] [PubMed] [Google Scholar]
- Araneda RC, Kini AD, Firestein S (2000) The molecular receptive range of an odorant receptor. Nat Neurosci 3: 1248-1255. [DOI] [PubMed] [Google Scholar]
- Ballesteros JA, Jensen AD, Liapakis G, Rasmussen SG, Shi L, Gether U, Javitch JA (2001) Activation of the beta 2-adrenergic receptor involves disruption of an ionic lock between the cytoplasmic ends of transmembrane segments 3 and 6. J Biol Chem 276: 29171-29177. [DOI] [PubMed] [Google Scholar]
- Berkhout TA, Blaney FE, Bridges AM, Cooper DG, Forbes IT, Gribble AD, Groot PH, Hardy A, Ife RJ, Kaur R, Moores KE, Shillito H, Willetts J, Witherington J (2003) CCR2: characterization of the antagonist binding site from a combined receptor modeling/mutagenesis approach. J Med Chem 46: 4070-4086. [DOI] [PubMed] [Google Scholar]
- Bockaert J, Pin JP (1999) Molecular tinkering of G protein-coupled receptors: an evolutionary success. EMBO J 18: 1723-1729. [DOI] [PMC free article] [PubMed] [Google Scholar]
- Buck L, Axel R (1991) A novel multigene family may encode odorant receptors: a molecular basis for odor recognition. Cell 65: 175-187. [DOI] [PubMed] [Google Scholar]
- Buck LB (1996) Information coding in the vertebrate olfactory system. Annu Rev Neurosci 19: 517-544. [DOI] [PubMed] [Google Scholar]
- Church WB, Jones KA, Kuiper DA, Shine J, Iismaa TP (2002) Molecular modeling and site-directed mutagenesis of human GALR1 galanin receptor defines determinants of receptor subtype specificity. Protein Eng 15: 313-323. [DOI] [PubMed] [Google Scholar]
- Feinstein P, Mombaerts P (2004) A contextual model for axonal sorting into glomeruli in the mouse olfactory system. Cell 117: 817-831. [DOI] [PubMed] [Google Scholar]
- Firestein S (2001) How the olfactory system makes sense of scents. Nature 413: 211-218. [DOI] [PubMed] [Google Scholar]
- Floriano WB, Vaidehi N, Goddard III WA, Singer MS, Shepherd GM (2000) Molecular mechanisms underlying differential odor responses of a mouse olfactory receptor. Proc Natl Acad Sci USA 97: 10712-10716. [DOI] [PMC free article] [PubMed] [Google Scholar]
- Floriano WB, Vaidehi N, Goddard III WA (2004) Making sense of olfaction through predictions of the 3-D structure and function of olfactory receptors. Chem Senses 29: 269-290. [DOI] [PubMed] [Google Scholar]
- Halgren TA (1996a) Merck molecular force field. I. Basis, form, scope, parameterization, and performance of MMFF94. J Comput Chem 17: 490-512. [Google Scholar]
- Halgren TA (1996b) Merck molecular force field. II. MMFF94 van der Waals and electrostatic parameters for intermolecular interactions. J Comput Chem 17: 520-552. [Google Scholar]
- Halgren TA (1996c) Merck molecular force field. III. Molecular geometries and vibrational parameters for intermolecular interactions. J Comput Chem 17: 553-586. [Google Scholar]
- Halgren TA (1996d) Merck molecular force field. IV. Conformational energies and geometories for MMFF94. J Comput Chem 17: 587-615. [Google Scholar]
- Halgren TA (1996e) Merck molecular force field. V. Extension of MMFF94 using experimental data, additional computational data, and empirical rules. J Comput Chem 17: 616-641. [Google Scholar]
- Hopkins AL, Groom CR (2002) The druggable genome. Nat Rev Drug Discov 1: 727-730. [DOI] [PubMed] [Google Scholar]
- Hughes AL, Nei M (1988) Pattern of nucleotide substitution at major histocompatibility complex class I loci reveals overdominant selection. Nature 335: 167-170. [DOI] [PubMed] [Google Scholar]
- Javitch JA, Fu D, Liapakis G, Chen J (1997) Constitutive activation of the beta2 adrenergic receptor alters the orientation of its sixth membrane-spanning segment. J Biol Chem 272: 18546-18549. [DOI] [PubMed] [Google Scholar]
- Kajiya K, Inaki K, Tanaka M, Haga T, Kataoka H, Touhara K (2001) Molecular bases of odor discrimination: reconstitution of olfactory receptors that recognize overlapping sets of odorants. J Neurosci 21: 6018-6025. [DOI] [PMC free article] [PubMed] [Google Scholar]
- Katada S, Nakagawa T, Kataoka H, Touhara K (2003) Odorant response assays for a heterologously expressed olfactory receptor. Biochem Biophys Res Commun 305: 964-969. [DOI] [PubMed] [Google Scholar]
- Katada S, Tanaka M, Touhara K (2004) Structural determinants for membrane trafficking and G protein selectivity of a mouse olfactory receptor. J Neurochem 90: 1453-1463. [DOI] [PubMed] [Google Scholar]
- Kataoka R, Goto J (2002) Post-sequence techniques for protein analysis, Pt 1, analysis of whole proteins. Bioinformatics and drug design. In: Posutoshihkuensu Tanpakushitsu Zikkenn-hou 1 (in Japanese), pp 191-201. Tokyo: Tokyo Kagaku Dojin.
- Klabunde T, Hessler G (2002) Drug design strategies for targeting G-protein-coupled receptors. Chembiochem 3: 928-944. [DOI] [PubMed] [Google Scholar]
- Lancet D (1986) Vertebrate olfactory reception. Annu Rev Neurosci 9: 329-355. [DOI] [PubMed] [Google Scholar]
- Lapidot M, Pilpel Y, Gilad Y, Falcovitz A, Sharon D, Haaf T, Lancet D (2001) Mouse-human orthology relationships in an olfactory receptor gene cluster. Genomics 71: 296-306. [DOI] [PubMed] [Google Scholar]
- Lee C, Irizarry K (2001) The GeneMine system for genome/proteome annotation and collaborative data mining. IBM Systems J 40: 592-603. [Google Scholar]
- Levitt M (1992) Accurate modeling of protein conformation by automatic segment matching. J Mol Biol 226: 507-533. [DOI] [PubMed] [Google Scholar]
- Man O, Gilad Y, Lancet D (2004) Prediction of the odorant binding site of olfactory receptor proteins by human-mouse comparisons. Protein Sci 13: 240-254. [DOI] [PMC free article] [PubMed] [Google Scholar]
- Manivet P, Schneider B, Smith JC, Choi DS, Maroteaux L, Kellermann O, Launay JM (2002) The serotonin binding site of human and murine 5-HT2B receptors: molecular modeling and site-directed mutagenesis. J Biol Chem 277: 17170-17178. [DOI] [PubMed] [Google Scholar]
- Mombaerts P (2004) Genes and ligands for odorant, vomeronasal and taste receptors. Nat Rev Neurosci 5: 263-278. [DOI] [PubMed] [Google Scholar]
- Oka Y, Omura M, Kataoka H, Touhara K (2004a) Olfactory receptor antagonism between odorants. EMBO J 23: 120-126. [DOI] [PMC free article] [PubMed] [Google Scholar]
- Oka Y, Nakamura A, Watanabe H, Touhara K (2004b) An odorant derivative as an antagonist for an olfactory receptor. Chem Senses 9: 815-822. [DOI] [PubMed] [Google Scholar]
- Palczewski K, Kumasaka T, Hori T, Behnke CA, Motoshima H, Fox BA, Le Trong I, Teller DC, Okada T, Stenkamp RE, Yamamoto M, Miyano M (2000) Crystal structure of rhodopsin: a G protein-coupled receptor. Science 289: 739-745. [DOI] [PubMed] [Google Scholar]
- Pilpel Y, Lancet D (1999) The variable and conserved interfaces of modeled olfactory receptor proteins. Protein Sci 8: 969-977. [DOI] [PMC free article] [PubMed] [Google Scholar]
- Rivkees SA, Barbhaiya H, IJzerman AP (1999) Identification of the adenine binding site of the human A1 adenosine receptor. J Biol Chem 274: 3617-3621. [DOI] [PubMed] [Google Scholar]
- Saam J, Tajkhorshid E, Hayashi S, Schulten K (2002) Molecular dynamics investigation of primary photoinduced events in the activation of rhodopsin. Biophys J 83: 3097-3112. [DOI] [PMC free article] [PubMed] [Google Scholar]
- Schertler GF (1998) Structure of rhodopsin. Eye 12: 504-510. [DOI] [PubMed] [Google Scholar]
- Shepherd GM (1994) Discrimination of molecular signals by the olfactory receptor neuron. Neuron 13: 771-790. [DOI] [PubMed] [Google Scholar]
- Singer MS (2000) Analysis of the molecular basis for octanal interactions in the expressed rat 17 olfactory receptor. Chem Senses 25: 155-165. [DOI] [PubMed] [Google Scholar]
- Singer MS, Shepherd GM (1994) Molecular modeling of ligand-receptor interactions in the OR5 olfactory receptor. NeuroReport 5: 1297-1300. [DOI] [PubMed] [Google Scholar]
- Singer MS, Oliveira L, Vriend G, Shepherd GM (1995) Potential ligand-binding residues in rat olfactory receptors identified by correlated mutation analysis. Receptors Channels 3: 89-95. [PubMed] [Google Scholar]
- Singer MS, Weisinger-Lewin Y, Lancet D, Shepherd GM (1996) Positive selection moments identify potential functional residues in human olfactory receptors. Receptors Channels 4: 141-147. [PubMed] [Google Scholar]
- Spalding TA, Burstein ES (2001) Constitutively active muscarinic receptors. Life Sci 68: 2511-2516. [DOI] [PubMed] [Google Scholar]
- Thompson JD, Higgins DG, Gibson TJ (1994) CLUSTAL W: improving the sensitivity of progressive multiple sequence alignment through sequence weighting, position-specific gap penalties and weight matrix choice. Nucleic Acids Res 22: 4673-4680. [DOI] [PMC free article] [PubMed] [Google Scholar]
- Touhara K (2002) Odor discrimination by G protein-coupled olfactory receptors. Microsc Res Tech 58: 135-141. [DOI] [PubMed] [Google Scholar]
- Touhara K, Sengoku S, Inaki K, Tsuboi A, Hirono J, Sato T, Sakano H, Haga T (1999) Functional identification and reconstitution of an odorant receptor in single olfactory neurons. Proc Natl Acad Sci USA 96: 4040-4045. [DOI] [PMC free article] [PubMed] [Google Scholar]
- Vaidehi N, Floriano WB, Trabanino R, Hall SE, Freddolino P, Choi EJ, Zamanakos G, Goddard WA, 3rd (2002) Prediction of structure and function of G protein-coupled receptors. Proc Natl Acad Sci USA 99: 12622-12627. [DOI] [PMC free article] [PubMed] [Google Scholar]
- Wallace AC, Laskowski RA, Thornton JM (1995) LIGPLOT: a program to generate schematic diagrams of protein-ligand interactions. Protein Eng 8: 127-134. [DOI] [PubMed] [Google Scholar]
- Watson SA (1994) The G-protein linked receptor factsbook. New York: Academic.
- Wetzel CH, Oles M, Wellerdieck C, Kuczkowiak M, Gisselmann G, Hatt H (1999) Specificity and sensitivity of a human olfactory receptor functionally expressed in human embryonic kidney 293 cells and Xenopus laevis oocytes. J Neurosci 19: 7426-7433. [DOI] [PMC free article] [PubMed] [Google Scholar]
- Wieland K, Zuurmond HM, Krasel C, Ijzerman AP, Lohse MJ (1996) Involvement of Asn-293 in stereospecific agonist recognition and in activation of the beta 2-adrenergic receptor. Proc Natl Acad Sci USA 93: 9276-9281. [DOI] [PMC free article] [PubMed] [Google Scholar]
- Zhang X, Firestein S (2002) The olfactory receptor gene superfamily of the mouse. Nat Neurosci 5: 124-133. [DOI] [PubMed] [Google Scholar]
- Zhao H, Ivic L, Otaki JM, Hashimoto M, Mikoshiba K, Firestein S (1998) Functional expression of a mammalian odorant receptor. Science 279: 237-242. [DOI] [PubMed] [Google Scholar]
- Zheng C, Feinstein P, Bozza T, Rodriguez I, Mombaerts P (2000) Peripheral olfactory projections are differentially affected in mice deficient in a cyclic nucleotide-gated channel subunit. Neuron 26: 81-91. [DOI] [PubMed] [Google Scholar]