

Abstract
Purkinje cells (PCs) generate the sole output of the cerebellar cortex and govern the timing of action potential discharge from neurons of the deep cerebellar nuclei (DCN). Here, we examine how voltage-gated Kv1 K+ channels shape intrinsically generated and synaptically controlled behaviors of PCs and address how the timing of DCN neuron output is modulated by manipulating PC Kv1 channels. Kv1 channels were studied in cerebellar slices at physiological temperatures with Kv1-specific toxins. Outside-out voltage-clamp recordings indicated that Kv1 channels are present in both somatic and dendritic membranes and are activated by Na+ spike-clamp commands. Whole-cell current-clamp recordings revealed that Kv1 K+ channels maintain low frequencies of Na+ spike and Ca-Na burst output, regulate the duration of plateau potentials, and set the threshold for Ca2+ spike discharge. Kv1 channels shaped the characteristics of climbing fiber (CF) responses evoked by extracellular stimulation or intracellular simulated EPSCs. In the presence of Kv1 toxins, CFs discharged spontaneously at ∼1 Hz. Finally, “Kv1-intact” and “Kv1-deficient” PC tonic and burst outputs were converted to stimulus protocols and used as patterns to stimulate PC axons and synaptically activate DCN neurons. We found that the Kv1-intact patterns facilitated short-latency and high-frequency DCN neuron rebound discharges, whereas DCN neuron output timing was markedly disrupted by the Kv1-deficient stimulus protocols. Our results suggest that Kv1 K+ channels are critical for regulating the excitability of PCs and CFs and optimize the timing of PC outputs to generate appropriate discharge patterns in postsynaptic DCN neurons.
Keywords: Purkinje cell, deep cerebellar neuron, rebound discharge, Kv1 potassium channels, spike output, cerebellum
Introduction
The cerebellum coordinates the timing of motor behaviors and several types of learning. Purkinje cells (PCs), which convey the only output from the cerebellar cortex, inhibit neurons of the deep cerebellar nuclei (DCN), which generate the only output from most of the cerebellum. The timing of spike outputs from PCs onto DCN neurons and from DCN neurons onto extracerebellar structures contribute significantly to the function of the cerebellum (Marr, 1969; Albus, 1971; Ito, 1984). In particular, the delay to the rebound discharge (RD) in DCN neurons after the offset of PC inhibition has been postulated to play a significant role in the overall timing of cerebellar output (Kistler and Leo van Hemmen, 1999). Thus, the factors controlling the pattern of PC spike discharge and the resulting behavior of DCN neurons are important to understanding how timing is established within the cerebellum.
The timing of spike output is regulated in several cell types by Kv1 K+ channels (Harvey, 2001; Dodson and Forsythe, 2004). In neurons from the auditory pathway and from the hippocampus, Kv1 K+ channels control the timing and threshold of Na+ spike onset, the frequency and duration of Na+ spike discharge, or the site of Ca2+ spike initiation (Storm, 1988; Brew and Forsythe, 1995; Trussell, 1997; Golding et al., 1999; Kupper et al., 2002; Rothman and Manis, 2003). Kv1 K+ channels have also been shown to regulate presynaptic spike discharge to influence transmitter release (Meir et al., 1999; Harvey, 2001; Dodson and Forsythe, 2004). The biophysical properties of most Kv1 K+ channels, particularly their low activation threshold and lack of inactivation, are ideally suited to generate these behaviors. In the cerebellum, anatomical evidence suggests the presence of several Kv1 K+ channel α subunits in PC somata, dendrites, and in afferent fibers (Veh et al., 1995).
The roles for Kv1 K+ channels are particularly interesting in PCs, given the diversity of afferent inputs and the multiple output modes including Na+ spike, Ca2+ spike, and Ca-Na burst discharge. Here, we used Kv1-specific toxins to discern the roles of Kv1 K+ channels in PCs and their effects on afferent excitatory inputs. We identified noninactivating Kv1 K+ currents in somatic and dendritic PC membranes that modulate cell output near spike threshold. Blocking Kv1 K+ channels resulted in spontaneous climbing fiber (CF) discharge, suggesting an additional presynaptic role for Kv1 K+ channels. Furthermore, we discerned the behavior of DCN neurons when synaptically stimulated with “Kv1-intact” or “Kv1-deficient” PC output. We found that Kv1-intact PC outputs elicited short-latency and highfrequency rebound discharges in DCN neurons, whereas Kv1-deficient PC outputs were not as effective. Our results indicate that Kv1 K+ channels are critical to determining a pattern of PC spike discharge that optimizes the responsiveness of the postsynaptic DCN neuron, thereby contributing to the timing of cerebellar output.
Materials and Methods
Animal care. Sprague Dawley rats were purchased from Charles River (Saint-Constant, Quebec, Canada). Rat dams arrived with litters [postnatal day 10 (P10)] and were maintained by the Animal Resources Center. All experiments were completed in accordance with the guidelines established by the Canadian Council on Animal Care.
Preparation of tissue slices. Male Sprague Dawley rats (P11-P20; n = ∼50) were anesthetized with a subcutaneous injection of Somnotol (sodium pentobarbital; 65 mg/kg; MTC Pharmaceuticals, Cambridge, Ontario, Canada). The rat was decapitated, the brain was exposed, and the cerebellum was quickly dissected out and bathed in ice-cold artificial CSF (aCSF). For all experiments, aCSF was composed of (in mm): 125 NaCl, 3.25 KCl, 1.5 CaCl2, 1.5 MgCl2, 25 NaHCO3, and 25 d-glucose preoxygenated by carbogen (95% O2, 5% CO2) gas. A scalpel cut was used to block the cerebellum in the parasagittal plane. The cerebellum was then mounted with cyanoacrylate glue on an ice-cold Vibratome cutting tray (Ted Pella, Redding, CA). Parasagittal tissue slices (300 μm) were cut from the cerebellar vermis in ice-cold and carbogen-bubbled aCSF. Slices were immediately transferred to carbogen-bubbled aCSF maintained in a 35°C water bath and incubated for 30-45 min and were then subsequently maintained for up to 4-5 h at room temperature (22°C). All recordings were completed at physiological temperature (35°C). We found that obtaining outside-out patches at 35°C required that the recordings begin immediately after the cutting procedure and that the tissue be maintained at 35°C for the entire experiment (usually no more than 90 min after slicing).
Electrophysiology. Pipettes were pulled from thick-walled (fiber-filled) borosilicate glass (1.5 mm outside diameter; A-M Systems, Carlsborg, WA) with a Sutter (Novato, CA) P-87 puller. The electrolyte for wholecell current-and voltage-clamp recordings was designed to closely approximate physiological ionic equilibrium potentials at 35°C: ENa = 56 mV; EK =-97 mV; ECl =-76 mV. The electrolyte consisted of (in mm): 130 K-gluconate, 0.1 EGTA, 10 HEPES, 7 NaCl, 0.3 MgCl2, pH 7.3 with KOH (the theoretical junction potential with this electrolyte is ∼11.6 mV). Di-tris-creatine phosphate (5 mm), Tris-ATP (2 mm), and Na-GTP (0.5 mm) were added daily from frozen stock solutions. The K-gluconate solution was also selected for whole-cell voltage-clamp recordings to ensure that holding potentials and driving forces would be comparable between current- and voltage-clamp experiments. This facilitated the conversion of voltage-clamped synaptic currents into current-clamp stimulus protocols (described below). For outside-out recordings, we used an electrolyte consisting of (in mm): 140 KCl, 0.1 EGTA, 10 HEPES, 7 NaCl, 0.3 MgCl2, 5 di-tris-creatine phosphate, 2 Tris-ATP, and 0.5 Na-GTP, pH 7.3 with KOH. Pipettes had resistances of 4-8 MΩ for somatic recordings and 8-12 MΩ for dendritic recordings. The syringe containing the electrolyte was maintained at 4°C throughout each experiment.
Slices were transferred to the recording chamber of a Zeiss (Oberkochen, Germany) Axioskop FS-2 microscope maintained at 35°C. Slices were held in place by a nylon-strung platinum wire “harp” and maintained as a submerged preparation continuously perfused by carbogen-bubbled aCSF (∼3 ml/min). Cells were visualized with differential interference contrast (DIC)-infrared optics and a Dage-MTI (Michigan City, IN) Newvicon camera linked to a video monitor (VM9012U; Hitachi, Tokyo, Japan) (Stuart et al., 1993). PCs were easily identified by their distinct morphology and position within the cortex. DCN neurons were distinguished by their large size relative to neighboring cell types.
Whole-cell current-clamp recordings were obtained using an Axoc-lamp 2A amplifier in bridge mode or an Axopatch 200B amplifier in fast current-clamp mode (Axon Instruments, Foster City, CA). All voltageclamp recordings were obtained with an Axopatch 200B amplifier. Data was collected with pCLAMP 8.1 software (Axon Instruments) operating on IBM (White Plains, NY)-compatible hardware. Current-clamp recordings were acquired at 25 kHz and were low-pass filtered at 10 kHz, whereas voltage-clamp recordings were acquired at 10 kHz and were low-pass filtered at 2 kHz for step command protocols or acquired at 25 kHz and low-pass filtered at 10 kHz for spike-clamp command protocols. PCs were maintained at -70 mV with hyperpolarizing current (-0.77 ± 0.04 nA; n = 36) for all experiments using intracellular stimulation. The spontaneous behavior of PCs and DCN neurons was examined in the absence of any holding current.
Recordings were accepted only for initial seal formations of >2 GΩ and were rejected if series resistance after establishing the whole-cell configuration was >15 MΩ. Cells were rejected if their output was unstable or if series resistance changed appreciably (under our recording conditions cells are generally stable for >30 min, and our protocols take ∼10 min to complete). For current-clamp experiments, series resistance averaged 9.0 ± 0.2 MΩ under control conditions and 9.4 ± 0.4 MΩ after toxin application (n = 29). Average series resistance for voltage-clamp experiments was 11.7 ± 0.4 MΩ (n = 17) and was always compensated >75%. Outside-out patches were immediately rejected if they did not reseal to >1GΩ during patch formation or if current levels were unstable during the first 30 s of recording. Patch stability was calculated as the mean peak current during the first 15 s of recording relative to the mean peak current during the next 15 s of recording (average of five sweeps during each 15 s epoch). In stable patches, peak current changed on average -1 ± 2% (n = 14) over this interval. Patches were rejected post hoc if the seal decreased to <1 GΩ at the end of the experiment or if rundown of current was evident. At 35°C, patches were stable for a few minutes, enabling 15-20 sweeps of control and 15-20 sweeps after rapid toxin application to be recorded (3 s intersweep interval).
Pharmacology. All recordings were performed in synaptic blockers (unless otherwise indicated) that were bath applied in aCSF: picrotoxin (50 μm; Sigma, St. Louis, MO), dl-2-amino-5-phosphonopentanoic acid (dl-AP-5; 25 μm; Sigma), 6,7-dinitroquinoxolinedione (10 μm; Tocris Cookson, Ellisville, MO), and (2S)-3-[[(1S)-1-(3,4-dichlorophenyl)ethyl]amino-2-hydroxypropyl](phenylmethyl)phosphinic acid (CGP 55845; 1 μm; Tocris Cookson). All toxins but margatoxin (MgTX; Sigma) were obtained from Alomone Labs (Jerusalem, Israel) and were applied at working concentrations of: margatoxin (1-100 nm), α-dendrotoxin (DTX; 200 nm), hongotoxin (HgTX; 10-100 nm), and tetrodotoxin (TTX; 100 nm). Drugs were added singly to a pressure-ejection electrode containing HEPES-buffered aCSF consisting of (in mm): 150 NaCl, 3.25 KCl, 1.5 CaCl2, 1.5 MgCl2, 10 HEPES, and 20 d-glucose, pH 7.4. The pressure-ejection media was always supplemented with 0.1% BSA to minimize nonspecific binding of the toxins and always contained the same concentrations of synaptic blockers described above. The dispersal zone of red or blue food coloring was used to confirm the spatial extent of pressure-ejected drugs. The dye was always included in the pressure-ejection electrode (1:50 dilution) and had no measurable effects alone. Only one toxin was applied to any given cell or patch.
K+ currents in outside-out patches were isolated using two pressure electrodes. The first pressure electrode contained HEPES-buffered aCSF supplemented with TTX (100 nm) and Cd2+ (200 μm) and was used to isolate the total K+ current, and the second electrode contained this mixture in addition to one of the Kv1 toxins. Given the proximity of the pressure electrode to the cell, wash-in of toxins was very quick: <2 min for current-clamp recordings and <30 s for outside-out recordings (McKay and Turner, 2004). The toxins used in this study did not wash out, as reported previously (Southan and Robertson, 1998; Ishikawa et al., 2003). Given this lack of washout and the extremely high affinity of the toxins used, as a precaution we recorded from only one PC per slice, and the recording chamber and dipping lens of the microscope were rinsed between slices.
Extracellular synaptic stimulation. A bipolar stimulating electrode consisting of two tungsten wires inserted into a patch pipette (2 μm tip diameter) containing aCSF was used to evoke synaptic responses. The stimulating electrode was positioned under DIC optics to ensure both accurate placement and gentle insertion into the tissue. Stimuli (100 μs pulse width) were delivered with an Isolated Stimulator (model DS2; Digitimer, Hertfordshire, UK).
AMPA-mediated parallel fiber (PF) and CF responses were pharmacologically isolated with AP-5, picrotoxin, and CGP 55845. PF responses were evoked with the stimulating electrode positioned in the mid molecular layer ∼60 μm from the PC soma and were identified by their graded response to stimulus intensity (Konnerth et al., 1990). CF responses were evoked with the stimulating electrode positioned in the granular layer ∼40 μm from the PC soma and were identified by their all-or-none response to a threshold amount of stimulation (Konnerth et al., 1990). For these experiments, the stimulator was controlled by a Master-8 (A.M.P.I., Jerusalem, Israel).
For DCN neuron experiments, GABAAergic inhibitory synaptic responses were isolated pharmacologically with CNQX, AP-5, and CGP 55845. IPSPs were evoked with the stimulating electrode positioned ∼40 μm from the cell body and reversed between -70 and -75 mV. This approximates our calculated equilibrium potential for chloride ions of -76 mV. For a few cells, stimulation resulted in antidromic activation of spike discharge. In these cases, the electrode was repositioned such that only IPSPs were evoked, and if this was not successful, the cell was discarded. The intensity of stimulation was adjusted such that a single stimulus was sufficient to block the generation of an action potential in these spontaneously discharging neurons.
The stimulator was controlled by Clampfit 8.1 (Axon Instruments) software delivering stimulus patterns with the temporal parameters of previously recorded PC spike output. MatLab software (MathWorks, Natick, MA) was used to time stamp PC Na+ action potentials and create TTL stimulus files to activate the stimulator via the digital-to-analog converter output (see Fig. 6 A). We used actual PC recordings instead of averaged data, because Na+ spike frequencies within trains and bursts are not perfectly uniform, and we endeavored to mimic the natural outputs as closely as possible. The patterns we used to generate the stimulus files were representative of the average PC output with respect to Na+ spike frequency, Na+ spikes per burst, and burst frequency. Because extracellular DCN neuron stimulation results in a moderate amount of unrecoverable synaptic depression (∼30%) (Pedroarena and Schwarz, 2003), the stimulus patterns were applied to each cell several times before making measurements. Furthermore, the interval between individual protocols was selected as 10 s to restore that component of synaptic activity that is recoverable from depression (Pedroarena and Schwarz, 2003). Given the established variability in the frequencies of spike discharge within RDs, all frequencies were log10 transformed before statistical analyses. However, untransformed values are reported in the text and figures for ease of interpretation.
Figure 6.
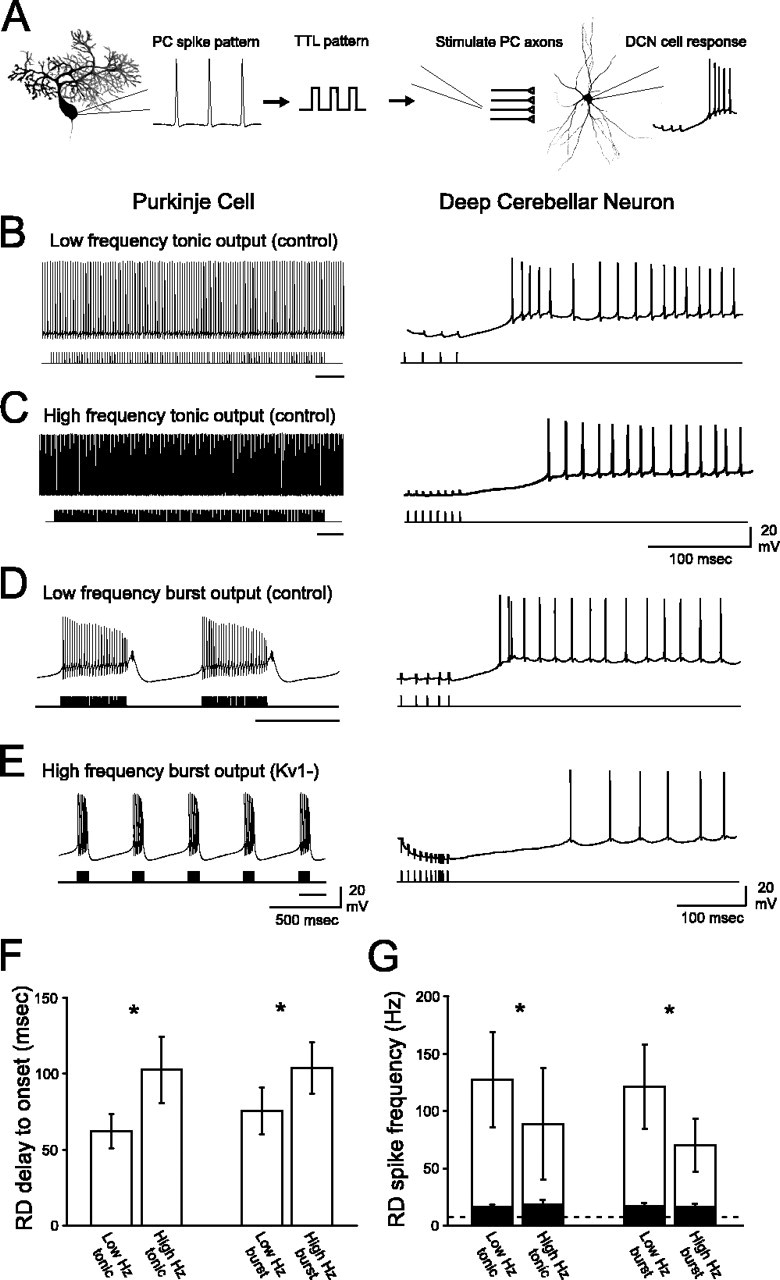
PC outputs with Kv1 K+ channels intact are optimized to facilitate short latency RDs with high Na+ spike frequency in DCN neurons. A, PC spike outputs were converted to TTL pulse patterns and used as extracellular stimulus patterns to synaptically activate DCN neurons. B-E, Left panels depict spike patterns recorded from PCs, and right panels depict the corresponding DCN neuron responses to the stimulation of inhibitory inputs using each PC discharge as a stimulus template (stimulus artifacts truncated). The black bar under each stimulus protocol corresponds to the expanded region illustrated in the right panels. B, Low-frequency Kv1-intact tonic stimulation of DCN neurons evokes a short-latency RD with high-frequency Na+ spikes. C, Na+ spike frequency decreases, and the delay to RD increases, after high-frequency tonic stimulation (same cell as in B; basal discharge rate, 5.1 Hz). D, The low-frequency Kv1-intact burst stimulation protocol facilitates the generation of a short-latency RD with a high rate of Na+ spike discharge. E, The high-frequency Kv1-deficient burst protocol results in a long latency to elicit RD and low-frequency Na+ spikes during the RD (same cell as in D; basal discharge rate, 6.4 Hz). F, The delay between cessation of inhibitory stimulation and onset of the first Na+ spike in the RD is significantly shorter for both low-frequency stimulus patterns compared with both high-frequency stimulus patterns. G, At the termination of all four stimulus protocols, there was an increase in firing frequency relative to baseline rates of discharge (dashed line; ∼10 Hz) for cells exhibiting high-frequency RDs (unfilled bars) and low-frequency RDs (filled bars). However, pattern-specific differences were noted only for the high-frequency RD group (asterisks). Within the high-frequency RD group, low-frequency tonic and burst stimuli (Kv1-intact) evoked a significantly greater increase in firing rate compared with high-frequency tonic and burst (Kv1-deficient) protocols. Given the large variability in RD spike frequency, the asterisks in G correspond to statistical analyses completed on this data after a log10 transformation.*p < 0.05 (low vs high frequency). Error bars represent SEM.
Intracellular simulated synaptic waveforms. The rise and decay taus of evoked EPSCs were measured for both PF (n = 7 cells) and CF (n = 9 cells) stimulation. The sum of two exponentials was used to simultaneously fit both rise and decay taus for both PF and CF EPSCs (Rall, 1969), and the mean kinetics was then used to construct simulated EPSCs in MatLab (see Table 1). The amplitude of simulated CF EPSCs was the average evoked EPSC size during control or Kv1-blocked conditions (see Table 1). Because PF EPSC amplitudes are graded with stimulation intensity, we arbitrarily set simulated PF EPSC amplitudes at 200, 500, and 1000 pA to cover a wide range of evoked amplitudes. All simulated EPSCs were delivered intracellularly at 1 Hz.
Table 1.
EPSC kinetics
|
|
Control (n = 7) |
Kv1-blocked (n = 7) |
Spontaneous (n = 4) |
||||||
|---|---|---|---|---|---|---|---|---|---|
|
|
Mean |
SEM |
Mean |
SEM |
Mean |
SEM |
|||
| CF EPSCs | |||||||||
| Amplitude (nA) | 4.7** | ± 0.8 | 5.3 | ± 1.0 | 5.7 | ± 1.4 | |||
| Rise tau (ms) | 0.33 | ± 0.01 | 0.31 | ± 0.02 | 0.33 | ± 0.03 | |||
| Decay tau (ms) | 4.48 | ± 0.39 | 4.49 | ± 0.67 | 4.19 | ± 0.31 | |||
| PF EPSCs | |||||||||
| Rise tau (ms) | 0.98 | ± 0.12 | 0.94 | ± 0.11 | |||||
| Decay tau (ms) |
8.88 |
± 1.19 |
8.31 |
± 1.49 |
|
|
|||
p < 0.01 control (evoked) versus Kv1-blocked (evoked and spontaneous).
Measurements. Data analysis was completed off-line with Clampfit 8.1 and Origin 7.0 (OriginLab, Northampton, MA), and figures were prepared in Corel (Ottawa, Ontario, Canada) Draw. All measurements of spike characteristics were referenced to the initial membrane potential at the point of inflection signifying the rising edge of the Na+ or Ca2+ action potential. From this value we calculated the spike height, halfwidth (duration at half amplitude), and afterhyperpolarization (AHP) amplitudes. The duration of Ca-Na bursts was calculated as the time between the onset of the first Na+ spike and the time on the falling phase of the terminal Ca2+ spike corresponding to the same voltage level as the initial Na+ spike inflection potential. AHP duration was measured from the point on the falling phase of a Na+ or Ca2+ spike corresponding to the reference membrane potential to the beginning of the next spike or to the end of a detectable inflection point during recovery of the AHP. Na+ spike frequencies reported in the text are the average of all Na+ spikes in a train before spike failure or the average Na+ spike frequency within a Ca-Na burst. The rate of change of Na+ spike or AHP amplitude was calculated using the first and last Na+ spikes in a train. Calculating rate of change in spike or AHP amplitude in this manner was possible, because the change in these parameters across a train of spikes was uniform and could be fit with a linear function for both control and Kv1-blocked conditions at all current injection intensities. For example, spike height and AHP amplitude were each correlated r > 0.77 (p < 0.0001) with spike number (or time) for the 1.2 nA control trace in Figure 3C. Spike height and AHP amplitude were each correlated r > 0.98 (p < 0.0001) with spike number (or time) for all other traces in Figure 3C. For the DCN neuron stimulation experiments, the delay to RD was calculated as the time interval between the last IPSP and the first Na+ spike of the RD. Peak frequency of RD was the highest instantaneous frequency over the first 10 Na+ spikes of the RD. RD characteristics were comparable after each individual burst within the multiburst protocols, and thus only the RD after the last burst is reported. Statistical analyses were completed with SPSS (Chicago, IL) version 10. Comparisons between control and Kv1-blocked conditions were completed with paired t tests; potential differences in the effects of individual toxins were assessed by ANOVA. Criterion for statistical significance was set at p < 0.05. Average values represent mean ± SEM.
Figure 3.

Kv1 K+ channels are activated by Na+ spike-clamp commands and enable sustained low-frequency Na+ spike generation at threshold stimulation intensities. A, Superimposing Na+ spikes from control conditions (black) or after MgTX application (gray) indicates that individual spike properties are not changed when Kv1 K+ channels are blocked (I = 0.9 nA). However, the rate of depolarization during the interspike interval (asterisk) is enhanced in MgTX, leading to higher-frequency spike output. B, Na+ spike-clamp commands (Vcomm) rapidly activate Kv1 currents that deactivate throughout the interspike interval (IKv1). Inset depicts the current activated by a single spike within the spike-clamp command under control (left) and Kv1-blocked (right) conditions. C, In control aCSF and from a holding potential of -70 mV, low-intensity current injection (e.g., 1.2 nA) evokes a train of Na+ action potentials. Higher-intensity stimulation (e.g., 1.8 nA) leads to Na+ spike failure and the emergence of a plateau potential. Additional stimulation (e.g., 2.4 nA) results in rapid Na+ spike failure and the appearance of Ca2+ spikes (C) and Ca-Na bursts (data not shown; see Fig. 1 A). Blockade of Kv1 K+ channels increases the frequency of spike output and results in a failure of spike generation early in the current step. The current injection threshold required to evoke both the plateau potential as well as Ca-Na bursts or Ca2+ spikes is lower. With greater stimulation (e.g., 1.8 or 2.4 nA), Na+ spikes fail rapidly, the duration of the plateau potential is minimal, and Ca-Na bursts or Ca2+ spikes appear very early in the current step. D, The rate at which AHP amplitude decreases throughout a train of Na+ spikes reveals that Kv1K+ channels function to maintain cell output over a narrow window of current injection intensities. The rate of change in AHP amplitude during toxin application was normalized to the rate of change during control conditions. E, Blockade of Kv1 K+ currents results in a marked increase in Na+ spike frequency for threshold levels of current injection. n = 7-13 cells per data point for D and E. Error bars represent SEM.
Results
Overview of PC output patterns
The output of PCs at physiological temperatures is complex and dependent on the intensity of stimulation (Fig. 1A). From hyperpolarized holding potentials, direct current injection evoked long trains of Na+ action potentials. With progressively greater stimulation, Na+ spikes discharged at higher frequencies with spike generation sustained throughout the entire current injection. With slightly greater amplitude current injections, spike generation failed, uncovering a plateau potential at approximately -20 mV that persisted for hundreds of milliseconds or even several seconds. At the conclusion of the plateau potential, the cells entered into a Ca-Na burst output mode (Na+ spikes superimposed on an underlying Ca2+ spike that terminated the burst) or sometimes an output mode comprising both Ca-Na bursts and individual Ca2+ spikes. With more intense stimulation, Na+ spikes were rapidly driven to inactivation, plateau potentials were brief, and Ca-Na bursts were usually replaced exclusively by Ca2+ spike output. These modes of cell output were consistent with the results of others who have studied PCs in vivo and at ∼35°C in vitro (Latham and Paul, 1971; Llinas and Sugimori, 1980; Womack and Khodakhah, 2002; Edgerton and Reinhart, 2003).
Figure 1.

Kv1 K+ channels regulate PC output. A, From a holding potential of -70 mV, a low-intensity current injection (1.2 nA; 3000 ms) evokes a train of high-frequency Na+ action potentials. With progressively greater stimulation (1.8 nA), Na+ spikes are driven to inactivation. A long plateau depolarization is uncovered, terminating with the appearance of Ca2+ spikes and Ca-Na bursts. With intense stimulation (2.4 nA), Na+ spikes inactivate rapidly, the duration of the plateau potential is shortened, and Ca-Na bursts appear early in the record. B, In the presence of 100 nm MgTX, Na+ spikes inactivate rapidly even with low-intensity stimulation (1.2 nA). The current injection threshold to evoke Ca2+ spikes and Ca-Na bursts substantially decreases and is accompanied by a pronounced shortening of the plateau potential before Ca-Na burst onset. C, D, Outside-out patches extracted from somatic (C) and dendritic (D) membranes contain MgTX-sensitive Kv1 K+ currents (steps from -70 to -20 mV). Difference currents (control record - MgTX record) reveal that PC Kv1 K+ currents are noninactivating. E, Kv1 K+ currents account for ∼15% of the total K+ current in outside-out patches sampled from both somatic (n = 9) and dendritic (n = 5) membranes. Error bars represent SEM.
Overview of the role of Kv1 K+ channels
To understand the role of Kv1 K+ channels in the many different forms of PC output, Kv1-specific toxins were locally applied to current-clamped PCs. All experiments were completed in the presence of excitatory and inhibitory synaptic blockers. Three toxins were selected on the basis of their specificity for Kv1 K+ channels: MgTX (1 or 100 nm), DTX (200 nm), and HgTX (10 or 100 nm) (Coetzee et al., 1999). At our highest concentrations, all three toxins are expected to block Kv1.2 and Kv1.6 K+ channels, with additional block of other Kv1 subunits in a toxin-specific manner. In the medial nucleus of the trapezoid body (MNTB), the application of different Kv1-specific toxins with unique subunit specificities results in differential changes in cell output (Dodson et al., 2002). However, in the Purkinje cell, we found that there were no statistically significant differences between any of the toxins at any concentration for the cell properties examined herein (see examples below). Therefore, the results from the three toxins have been pooled, and we use the term “Kv1 blockade” to refer in general to toxin application.
Toxin application had no effect on the input resistance of PCs (control, 30.5 ± 1.3 MΩ vs Kv1-blocked, 30.1 ± 1.3 MΩ; n = 29) and likewise did not change the amount of holding current required to hyperpolarize PCs to the standardized level of -70 mV (control, -0.77 ± 0.04 nA vs Kv1-blocked, -0.77 ± 0.04 nA; n = 36). However, after toxin application, we detected a slight depolarization in the membrane potential during the PC silent period from -50.6 ± 1.1 to -47.5 ± 1.0 mV.
Most PCs fired a train of Na+ action potentials with threshold current stimulation. However, during Kv1 blockade, any current injection greater than the threshold level resulted in a very brief and high-frequency discharge of Na+ spikes that rapidly inactivated (Fig. 1B). There was no change in the current threshold for the generation of Na+ spikes (control, 0.54 ± 0.04 nA vs Kv1-blocked, 0.55 ± 0.04 nA). However, the current threshold to evoke Ca-Na bursts or Ca2+ spikes was reduced by ∼30%, from 1.33 ± 0.05 nA under control conditions to 0.91 ± 0.06 nA during toxin application (p < 0.001; n = 23). This decrease in current threshold did not differ significantly between the toxins (MgTX, -20 ± 9%, n = 9; HgTX, -43 ± 8%, n = 6; DTX, -30 ± 8%, n = 8; p ≫ 0.05). Application of Kv1 toxins also markedly shortened the plateau potentials evident under control conditions, thereby dramatically reducing the onset latency of Ca-Na bursts and Ca2+ spikes. This decrease was also comparable between the three toxins (at I = 2.4 nA: MgTX, -65 ± 10%, n = 8; HgTX, -81 ± 9%, n = 6; DTX, -77 ± 6%, n = 6; p ≫ 0.05).
Kv1 K+ currents in outside-out recordings are noninactivating
Immunocytochemistry and in situ hybridization has detected several Kv1 α subunits in PCs including Kv1.1, Kv1.2, Kv1.3, and Kv1.6 (Veh et al., 1995). Furthermore, the presence of Kvβ1 and Kvβ2 subunits has been reported in PCs (Rhodes et al., 1996). Although the aforementioned Kv1 α subunits are classified as noninactivating (Coetzee et al., 1999), coexpression with Kvβ1 subunits has been shown to confer inactivation on all of these α subunits except Kv1.6 (Heinemann et al., 1996). We used outside-out patch recordings to test directly for the expression and properties of PC Kv1 K+ channels.
To identify the contribution of Kv1 K+ channels to the total outward K+ current, outside-out patches were pulled from somatic (n = 9) and dendritic (n = 5; 20-70 μm) membranes. Patches were stepped from a holding potential of -70 mV to a test potential of -20 mV for 200 ms. This holding potential was selected because it approximates the most negative hyperpolarizations experienced by a PC in vitro. The test potential of -20 mV was selected because it approximates the membrane voltage of the plateau potentials which are regulated by Kv1 K+ channels. Results for 200 nm DTX and 100 nm MgTX were equivalent and have been pooled together.
Somatic patches generated 299.2 ± 72.9 pA (n = 9) of peak current, whereas dendritic patches generated 98.3 ± 20.0 pA (n = 5) of peak current under control conditions (TTX, Cd2+). Although the differences in peak currents were not statistically significant (p < 0.10), the apparent magnitude of the discrepancy is ostensibly related to the smaller patch electrodes required for dendritic recordings. The amount of inactivation over 200 ms steps was comparable between somatic and dendritic patches (35.4 ± 3.9%; n = 14) (Fig. 1C,D). Subtraction of currents obtained in MgTX or DTX from control currents revealed noninactivating Kv1 K+ currents at both somatic and dendritic levels that constituted ∼15% of the total K+ current (Fig. 1C-E). Given the relatively small-peak Kv1 current and the short lifetime of outside-out patches at 35°C, it was not feasible to construct a full activation plot (see below for kinetic characteristics measured at room temperature). However, we were able to reach several important conclusions: Kv1 K+ channels in PCs are noninactivating, constitute ∼15% of the total K+ current, are comparably sensitive to MgTX and DTX, and are expressed in both somatic and dendritic membranes.
Kv1 K+ channels regulate spontaneous PC output
PCs express the necessary ionic conductances to generate spontaneous output. At physiological temperatures, this output is of two forms: the trimodal pattern, consisting of a short train of Na+ action potentials followed by a series of Ca-Na bursts and concluding with a hyperpolarized pause, or a very long train of Na+ action potentials alternating with hyperpolarized quiescent periods (Womack and Khodakhah, 2002). No Ca-Na bursts are observed under control conditions for these latter cells. To characterize the role of Kv1 K+ channels in these two forms of spontaneous discharge, we considered several PC variables expected to influence the final output of the cerebellum, the number of Na+ spikes within a Ca-Na burst, the average frequency of Na+ spikes within a burst, and the frequency of Ca-Na burst generation.
Under control conditions, 14 of 36 PCs spontaneously fired long trains of Na+ action potentials (78.7 ± 11.3 Hz) (Fig. 2A). Blockade of Kv1 K+ channels transformed the tonic firing into an intense Ca-Na burst output mode (13 of 14 cells). The remaining 22 of 36 PCs fired Ca-Na bursts under control conditions (Fig. 2B). After toxin application to these cells, burst discharge intensified: the average frequency of Na+ spikes within each Ca-Na burst increased from 75.4 ± 11.5 to 133.3 ± 17.2 Hz, and the burst frequency was increased from 1.1 ± 0.4 to 3.4 ± 0.7 Hz (all p < 0.01; n = 22) (Fig. 2D). Although some cells fired tonically and others in Ca-Na burst mode under control conditions, the characteristics of the bursts elicited after toxin application were comparable between these two groups (Fig. 2A,B).
Figure 2.

Kv1 K+ channels regulate output of spontaneously active PCs. A, B, Under normal conditions, PCs generate either continuous trains of fast Na+ action potentials (A) or fire with the characteristic trimodal pattern that includes a low-frequency Ca-Na burst output (B). Blockade of Kv1 K+ channels converts both tonic Na+ spike and Ca-Na burst output PC types to a high-frequency Ca-Na burst mode (A, B). The high-frequency bursts evoked by toxin application were comparable between tonic (A) and burst-firing (B) cells; the toxin-evoked bursts illustrated in the figure reflect the range of burst frequencies that could result from toxin application. C, TTX application isolated the Ca2+ spike underlying each Ca-Na burst. MgTX increased the frequency of spontaneous Ca2+ spike output dramatically and to a level similar to the frequency of Ca-Na bursts. D, Without Kv1 K+ channels, the number of Na+ spikes within each Ca-Na burst decreases, and the frequency of Na+ spikes within each Ca-Na burst increases. The frequencies of spontaneous Ca-Na bursts and TTX-isolated Ca2+ spike outputs are comparably increased after Kv1 blockade.*p < 0.05; ***p < 0.001. Error bars represent SEM.
To understand the frequency change in spontaneous Ca-Na burst output after Kv1 blockade, we isolated the Ca2+ spike component of each Ca-Na burst with 100 nm TTX (n = 6). In two of six cells, TTX silenced all spontaneous cell output. In the remaining four of six cells, TTX application isolated the Ca2+ spike within each Ca-Na burst (Fig. 2C) (Womack and Khodakhah, 2004). As noted for Ca-Na burst output, blockade of Kv1 K+ channels increased the frequency of isolated Ca2+ spikes, from 2.1 ± 0.9 to 4.6 ± 0.6 Hz (p = 0.05; n = 4) (Fig. 2D), a percentage increase in frequency that was equivalent to that for Ca-Na bursts (Fig. 2D). This result suggests that Kv1 K+ channels play a principal role in regulating the output of Ca2+ spikes, which in turn governs Ca-Na burst discharge.
Kv1 K+ channels are activated by Na+ spikes and regulate the frequency of Na+ spike discharge
To discern the role of Kv1 K+ channels in shaping individual Na+ action potentials, we compared the first Na+ action potential evoked in a train of spikes between control and toxin conditions. Blockade of Kv1 K+ channels resulted in minor decreases in spike height (-9.1 ± 2.9% at 1.2 nA) and spike width (-9.8 ± 2.8% at 1.2 nA; n = 13) (Fig. 3A). We have previously observed these results in a population of older animals (P20-P30; n = 10), and this apparently is a result unique to toxins that selectively block Kv1 K+ channels but not other K+ channels (B. E. McKay and R. W. Turner, unpublished observations; McKay and Turner, 2004). This result may be related to the small membrane depolarization associated with Kv1 K+ channel blockade, which would be expected to increase the amount of Na+ channel inactivation. In support of this, in a compartmental model, a very small decrease in Na+ channel availability is associated with decreases in both spike height and width (F. Fernandez, personal communication). No changes were evident for the AHP characteristics of the first Na+ spike.
The rate of depolarization between adjacent Na+ spikes was increased dramatically from 6.2 ± 1.3 mV/ms under control conditions to 10.2 ± 2.1 mV/ms after Kv1 blockade (p < 0.05; n = 12) (Fig. 3A). To determine whether this change in interspike depolarization was attributable to the loss of an outward current flowing between Na+ spikes, we examined the time course of Kv1 currents in outside-out patches activated by Na+ spike-clamp commands. The spike-clamp command was constructed from a current-clamp recording of a PC firing Na+ spikes at 80 Hz. After junction potential correction (-11.6 mV), the clamp command consisted of a train of 20 spikes with interspike voltages at approximately -60 mV and peak spike heights of ∼10 mV (Fig. 3B). A 20 ms test pulse from -60 to +10 mV was included in the protocol for comparison. The protocol was repeated 40-50 times in aCSF containing 100 nm TTX and 200 μm Cd2+ and another 40-50 times in solutions supplemented with 100 nm MgTX (2 s interval between each presentation of the protocol). Difference (Kv1-sensitive) currents were computed after averaging all sweeps obtained under control and toxin conditions. Because several minutes were required to obtain these data from each outside-out patch, these experiments were completed at room temperature. To compensate for the expected decrease in channel kinetics attributable to room temperature recordings, the spikeclamp command was also constructed from a PC recording obtained at room temperature.
Kv1 currents were rapidly activated by the Na+ spike-clamp commands and deactivated slowly over the time course of the interspike interval (Fig. 3B). Each Na+ spike within the command activated 15.8 ± 5.3 pA of current, corresponding to ∼20% of the total current activated by a 20 ms step command over a similar voltage range (n = 5). The amount of Kv1 current was equivalent for each spike of the command protocol, with no evidence of cumulative inactivation during repetitive stimulation. From the step command, the 10-90% activation time of the Kv1 current was 2.7 ± 0.5 ms, and the tau of deactivation (single exponential fit) was 2.1 ± 0.5 ms. These kinetics are consistent with those obtained for Kv1 current in the MNTB (Brew and Forsythe, 1995). The results of the spike-clamp commands demonstrate that Kv1 K+ currents contribute outward current during the interspike interval and that loss of this current would be expected to accelerate the membrane depolarization between spikes.
Under control conditions, spike height and AHP amplitude remained relatively constant throughout long low-intensity depolarizing steps, whereas with greater current injection, a slow dropout of spike height and AHP amplitude was noted (Fig. 3C). However, the marked increase in rate of depolarization between Na+ spikes was reflected in one of the more striking effects of Kv1 K+ channel blockade on Na+ spike output: a substantial decrease in peak Na+ spike height and AHP amplitude across a train of spikes (Fig. 3C). Blocking Kv1 K+ channels accelerated the rate of decrease in spike height and AHP amplitude most significantly over a narrow window centered around 1.2 nA of current injection. Thus, near spike threshold, the rate of decrease in spike height was 16-fold greater, and the rate of decrease of AHP amplitude 25-fold greater than during control conditions (Fig. 3D). Concomitant with spike failure was a marked acceleration of spike frequency, particularly with low stimulation intensities (Fig. 3E). For instance, with 0.6 nA current injections, Na+ spike output was sustainable at ∼66 Hz under control conditions and increased to a brief burst of ∼130 Hz during toxin application. Interestingly, ∼130 Hz was the average upper limit for sustainable Na+ spike generation under control conditions.
A current injection threshold of ∼0.5 nA (range, 0.3-0.9 nA) was required to evoke Na+ spikes in PCs maintained at -70 mV. Thus, from Figure 3C-E, the most salient effects of Kv1 K+ channel blockade occurred over the 0.6-1.2 nA range, which approximates the threshold range for current injection to elicit Na+ spikes. Furthermore, by regulating the rate of depolarization during interspike intervals, our results suggest that Kv1 currents minimize Na+ channel inactivation, thereby enabling long periods of tonic Na+ spike output at sustainable frequencies. An increase in Na+ channel inactivation is predicted to decrease spike height and thus also decrease the activation of conductances that generate AHPs.
Kv1 K+ channels regulate Ca-Na burst and Ca2+ spike output
After blockade of Kv1 K+ channels, several fundamental changes occurred in the Ca-Na burst or Ca2+ spike output of PCs (Fig. 4A). Most impressively, the duration of the plateau potential after Na+ spike failure and preceding the onset of Ca-Na bursts (or Ca2+ spikes) was markedly shortened after Kv1 blockade, decreasing by over 90% from 416 ± 186 to 34 ± 8 ms (p < 0.01; n = 21) (Fig. 4B). This result suggests that one of the most important functions of Kv1 K+ channels in PCs is to balance the inward conductances underlying the plateau potential, restraining the cell from low-threshold burst output. The characteristics of individual Ca-Na bursts, including the frequency of Na+ spike generation within each burst (Fig. 4C), the duration of each Ca-Na burst (Fig. 4D), and the frequency of Ca-Na burst output (Fig. 4E), were modulated by the Kv1 toxins in an intensity-dependent manner. At 1.5 nA current injection, the frequency of intraburst Na+ spikes increased from 212 ± 24 to 275 ± 14 Hz, the duration of Ca-Na bursts decreased from 65 ± 20 to 28 ± 7 ms, and the frequency of burst generation increased from 19 ± 3 to 25 ± 2 Hz (all p < 0.05; n = 9). The reasons for a decrease in the duration of bursts is unknown but likely reflects the actions of an increased Ca2+ spike and faster inactivation and failure of Na+ spikes.
Figure 4.
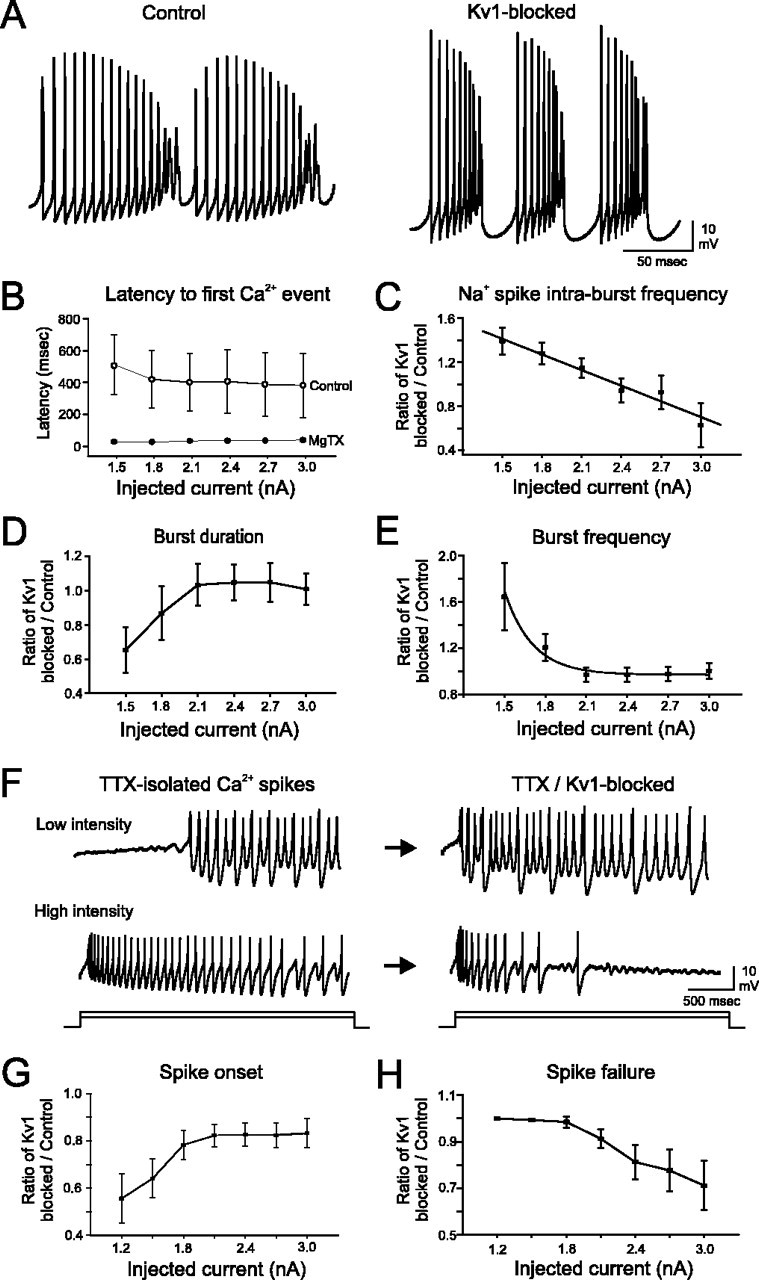
Kv1 K+ channels control Ca-Na burst output and Ca2+ spike generation in PCs. A, Blockade of Kv1 K+ channels decreases the number and increases the frequency of Na+ spikes fired within individual bursts (I = 1.5 nA). The burst output frequency also increases. B, Plateau potential duration is significantly shortened after Kv1K+ channel blockade. C, The frequency of Na+ spike generation within bursts is accelerated by Kv1 blockade at low stimulus intensities. D, E, Burst duration (D) is substantially shorter at near burst-threshold stimulation intensities, whereas burst frequency (E) markedly increases over this stimulus intensity range. F-H, In the presence of TTX, low-intensity depolarizing current (0.9 nA) evokes a plateau potential followed by Ca2+ spike generation (F). The time of Ca2+ spike onset, normalized to control latencies, is substantially shorter after Kv1 blockade (G). With higher-intensity stimulation (2.4 nA), TTX-isolated Ca2+ spikes are evoked throughout the entire current step with a moderate reduction in frequency toward the end of the step (F). Without Kv1 K+ channels, sustained generation of Ca2+ spikes during high-intensity stimulation is no longer possible (H). n = 11-20 cells per data point for B; n = 9-11 cells per data point for C-E; n = 7-9 cells per data point for G and H. Error bars represent SEM.
Both the duration (21.7 ± 10.4%) and amplitude (15.4 ± 6.5%) of the postburst AHP were increased significantly during Kv1 blockade at low stimulus intensities (p < 0.01; n = 9). For stimulus intensities ≥2.1 nA, Kv1 K+ channel block no longer influenced Ca-Na output. No relationship was found between the rate of change in intraburst Na+ spike height or AHP amplitude when plotted against current intensity. This differs from the trends found for Na+ spikes within trains and is presumably related to the significantly larger current injections required to elicit bursts (often ≥1.5 nA).
The output of TTX-isolated Ca2+ spikes also proved to be regulated by Kv1 K+ channels (Fig. 4F). The threshold to elicit isolated Ca2+ spikes from a holding potential of -70 mV decreased from 0.93 ± 0.09 to 0.80 ± 0.07 nA when Kv1 K+ channels were blocked (p < 0.05; n = 9). The onset latency of the first Ca2+ spike was shortened significantly by toxin application at all stimulus intensities (Fig. 4F,G). However, the latency reduction was most impressive at low stimulus intensities, with a decrease of 44.4 ± 10.4% at 1.2 nA compared with 16.7 ± 6.2% at 3.0 nA (n = 9). Furthermore, in the presence of toxin, isolated Ca2+ spikes failed before the end of a 3000 ms depolarization in five of nine cells, particularly at higher intensities (Fig. 4F,H). Such output failure was almost never observed in toxins when Na+ spikes were left intact, suggesting a complex interplay of Na+ and K+ conductances in maintaining Ca2+ spike output. Blocking Kv1 K+ channels further increased Ca2+ spike height by 25.6 ± 10.4% over the entire range of stimulus intensities. Changes in the AHP after a Ca2+ spike were comparable with the values reported above for postburst AHPs, and changes occurred exclusively at low stimulus intensities. Thus, as seen previously for Na+ spikes, the most significant contribution of Kv1 K+ channels to Ca-Na burst output, and to TTX-isolated Ca2+, spike output, is at, or just above, the threshold required to evoke these events.
Kv1 K+ channels regulate CF responses presynaptically and postsynaptically
CFs provide low-frequency but very intense excitation for PC somata and proximal dendrites. We sought to identify the potential role for Kv1 K+ channels in regulating the CF response. CF EPSPs were pharmacologically isolated and evoked by stimulating in the granular layer (Fig. 5A). Whereas spontaneous CF EPSPs were never observed in control solutions, blockade of Kv1 K+ channels revealed spontaneously occurring CF responses at a mean rate of 1.2 Hz (Fig. 5A,B) (n = 30 of 59 PCs in 100 nm MgTX; n = 3 of 9 PCs in 200 nm DTX). It is interesting to note that this frequency is similar to that of spontaneous CF discharge measured in vivo at 1.2-1.3 Hz (Stratton et al., 1988; Keating and Thach, 1995). Spontaneous activity was dependent on toxin concentration, in that spontaneous CF discharge was never observed in 1 nm MgTX (n = 0 of 12) but could be elicited by subsequent application of 100 nm MgTX (n = 4 of 8). MgTX-elicited spontaneous CF discharge was TTX sensitive, because 100 nm TTX immediately blocked spontaneous CF responses (n = 2 of 2), with eventual recovery after washout. When MgTX and TTX were coapplied, CF discharge was never observed (n = 0 of 15). In contrast, MgTX could still elicit spontaneous CF discharge when the intracellular Na+ channel blocker QX-314 (5 mm) was included in the patch pipette (n = 3 of 4). Together, these results implicate low affinity and presynaptically located MgTX-sensitive Kv1 K+ channels in the regulation of spontaneous CF discharge.
Figure 5.
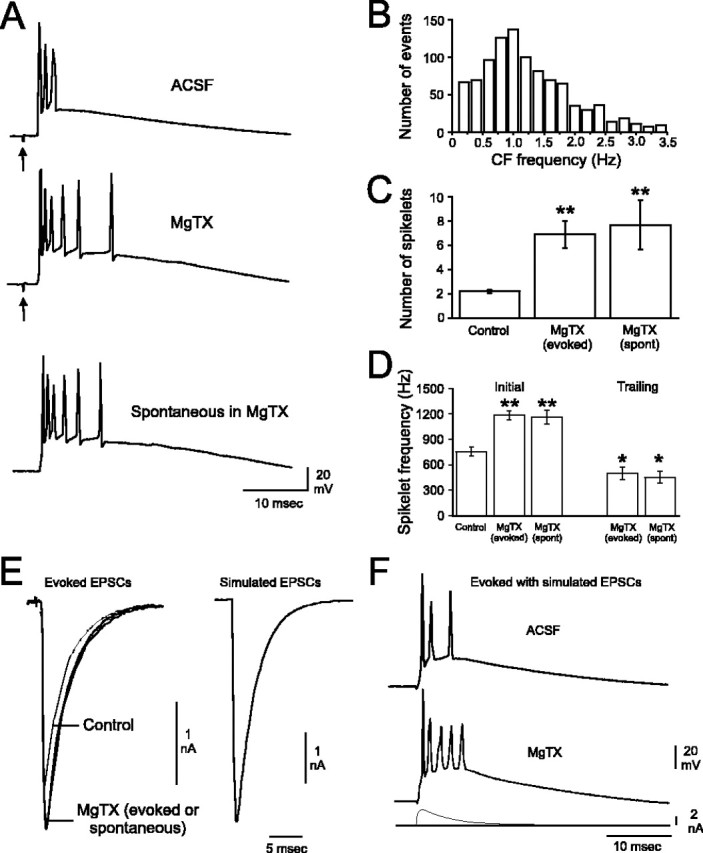
Kv1 K+ channels modulate PC responses to CF discharge and regulate the presynaptic excitability of CFs. A, Evoked CF responses are markedly changed after Kv1 blockade (arrows denote stimulus artifacts). Although never seen in control solutions, spontaneous CF discharge is elicited by application of Kv1 K+ channel blockers (bottom trace). B, Spontaneous discharges of CFs in MgTX occur over a broad range of frequencies with a peak at ∼1.2 Hz (total, 1005 events plotted). The distribution shown has been truncated at 3.5 Hz, which removed ∼7% of the data that fell outside of a normal distribution. These outlying events were evenly distributed between 3.5 and 13 Hz. C, The number of CF spikelets increases approximately threefold during toxin application. D, The frequency of the initial (2) CF spikelets is increased during Kv1 blockade. Trailing spikelets (an additional 2-7 spikelets per CF event) seen only during toxin application are generated at a significantly lower frequency than the initial spikelets. Note that the characteristics of evoked and spontaneous CF events in MgTX are identical. E, CF EPSCs evoked in control solutions or in the presence of MgTX (superimposed in left panel). The kinetics of evoked EPSCs were used to generate simulated EPSC waveforms (right panel). F, Simulated control CF EPSCs (bottom trace) delivered in current-clamp mode result in CF-like events. Blockade of Kv1 K+ channels results in increased spikelet generation in response to a simulated control EPSC waveform (depicted beneath the spike responses).*p < 0.05 and **p < 0.01 compared with control. Error bars represent SEM.
Evoked CF responses were markedly changed by toxin application. Under control conditions, each stimulus-evoked CF response began with a Na+ spike followed by 2.2 ± 0.1 smaller spikelets that generally failed to overshoot 0 mV, similar to the values reported in vivo (Simpson and Ito, 1971) (n = 10) (Fig. 5C). The last spikelet was often followed by a depolarizing after-potential that failed to reach Na+ spike threshold. With Kv1 K+ channels blocked, the number of spikelets increased significantly to 6.9 ± 1.1 for evoked CF discharge and 7.7 ± 2.0 spikelets for spontaneous CF discharge [both significantly different from control (p < 0.05) but not each other; n = 6] (Fig. 5C). The frequency of the first two spikelets increased by >50% after toxin application, whereas the subsequent two to seven spikelets occurred at a significantly lower frequency (Fig. 5D).
We sought to identify potential presynaptic and postsynaptic roles of Kv1 K+ channels in determining the phenotype of spontaneous and evoked CF responses. Because presynaptic effects may be discerned via changes in paired-pulse ratios, we evoked pairs of CF EPSCs with a 100 ms interstimulus interval in PCs voltage clamped at -70 mV. In control solutions, the second CF EPSC depressed to 0.71 ± 0.04 of its initial amplitude. Interestingly, blockade of Kv1 K+ channels significantly reduced the magnitude of the paired-pulse depression, such that the second EPSC was 0.78 ± 0.03 of its initial value (p = 0.01; n = 10). This represented an increase of 11.0 ± 4.2% of the paired-pulse ratio. To further test the presynaptic basis of the change in paired-pulse ratio, we blocked all postsynaptic K+ channels by replacing 20 mm of K-gluconate in the intracellular solution with 20 mm TEA (Yellen et al., 1991; Khodakhah et al., 1997). Under these conditions, the paired-pulse ratio increased by 17.9 ± 7.4% (n = 7). These results are consistent with the interpretation that Kv1 K+ channels normally decrease the excitability of the CF terminal and thus reduce transmitter release during repetitive activation.
We further measured the amplitude and rise and decay kinetics of CF EPSCs (Table 1). The time constants for rise and decay of CF EPSCs were determined using the sum of two exponentials. Rise and decay taus did not differ between CF EPSCs evoked under control and Kv1-blocked conditions and did not differ from spontaneous CF EPSCs elicited by MgTX (Table 1). However, the amplitude of evoked EPSCs increased significantly after toxin application (Fig. 5E) to a mean value similar to that of spontaneous CF EPSCs (Table 1).
To explore the postsynaptic role of Kv1 channels in modulating CF responses in the absence of presynaptic activity, we simulated CF EPSC waveforms based on the average rise and decay kinetics of CF EPSCs with either control (4.7 nA) or toxin (5.3 nA) amplitudes (Table 1). These simulated CF EPSC waveforms were then injected intracellularly in current-clamp mode (Fig. 5E) (see Materials and Methods). Synaptic transmission was blocked for these experiments. The simulated CF EPSCs resulted in CF-like discharges during both control and Kv1-blocked conditions (Fig. 5F, 4.7 nA simulated EPSC depicted). The CF-like discharge evoked under control conditions was identical for the 4.7 and 5.3 nA simulated waveforms (1.39 ± 0.18 spikelets at 446 ± 36 Hz; n = 9). Similarly, the CF-like discharge evoked during toxin application was identical for the 4.7 and 5.3 nA simulated waveforms (2.39 ± 0.41 spikelets at 478 ± 44 Hz; n = 9). However, the number of spikelets generated during toxin application was significantly greater than during control conditions (p < 0.01). These results suggest that a change in CF EPSC amplitude alone is insufficient to change the phenotype of the CF event. Rather, the altered frequencies and numbers of spikelets evoked during Kv1 K+ channel blockade are attributable principally to an enhanced excitability of the postsynaptic PC membrane.
Kv1 K+ channels do not shape parallel fiber EPSPs
Parallel fiber inputs provide small amplitude excitatory stimulation to PC dendrites. To examine the potential for Kv1 K+ channels to shape PF EPSPs, we voltage clamped PCs, determined a range of EPSC amplitudes that could be evoked, and measured the rise and decay kinetics of individual events. Spontaneous discharge of PF EPSCs was not observed under control conditions or during toxin application. PF EPSC rise and decay kinetics were identical between control and Kv1-blocked conditions (Table 1). As an additional test, we used simulated EPSCs with amplitudes of 200, 500, and 1000 pA to represent the EPSC range observed after single stimuli under either control or Kv1-blocked conditions. From a holding potential of -70 mV, the peak EPSP amplitude evoked by simulated EPSCs did not differ significantly between control conditions and toxin application (n = 10). These results suggest that Kv1 K+ currents do not shape PF synaptic responses, perhaps because under our holding potential conditions, they fail to sufficiently depolarize the membrane to near Na+ spike threshold at which Kv1 K+ channel effects typically begin. Thus, Kv1 K+ channels may shape PF responses at more depolarized potentials. However, it is also possible that the Kv1-blocked shift of PC output to an intense burst discharge mode could significantly filter the small amplitude PF events (Derjean et al., 2003).
Kv1 K+ channels optimize PC output to facilitate rebound discharge in DCN neurons
DCN neurons receive inhibitory input from PCs that decreases the frequency of spontaneous discharge. After the cessation of inhibition, DCN neurons depolarize and generate a highfrequency rebound discharge of Na+ spikes (Llinas and Muhlethaler, 1988). To examine the possibility that Kv1 channel-mediated effects on PC output could be reflected in the response of postsynaptic DCN neurons, we constructed TTL stimulus files from spontaneous PC tonic or burst output patterns (Fig. 6A). We used a low-frequency tonic and a low-frequency burst protocol to mimic the output of PCs under control conditions and a high-frequency burst protocol to mimic the output of PCs during Kv1 blockade (Fig. 6B-E). Although this strategy is expected to activate axons arriving from multiple PCs, it has been shown in vivo that the PCs that contact individual DCN neurons are organized in parasagittal bands and show highly correlated firing patterns (Welsh et al., 1995; Lang et al., 1999). Furthermore, multiple PC inputs must be simultaneously activated to elicit precisely timed spike output from DCN neurons (Gauck and Jaeger, 2000). Thus, a stimulating electrode that activates multiple axons may approximate a physiological condition.
Four stimulus patterns were presented (Fig. 6) and were extracted from PCs exhibiting: (1) low-frequency tonic discharge under control conditions (56 Hz), (2) high-frequency tonic discharge under control conditions (138 Hz), (3) low-frequency burst discharge under control conditions (26 Na+ spikes at 56 Hz with a 1.0 Hz burst frequency), and (4) high-frequency burst discharge during Kv1 blockade (11 Na+ spikes at 150 Hz with a 2.6 Hz burst frequency). Although Kv1 blockade does not result in sustained high-frequency output from PCs, the highfrequency tonic pattern was used as a control for the highfrequency burst pattern. Recent evidence indicates that action potentials discharging at less than ∼200 Hz are conducted faithfully down Purkinje cell axons (Monsivais and Hausser, 2003; Khaliq and Raman, 2004). Therefore, even at the highest action potential frequency we examined (150 Hz), we expect that action potentials measured intrasomatically would faithfully propagate to the DCN neurons, as would the action potentials generated by the corresponding extracellular stimulation protocols.
DCN neurons discharged Na+ spikes spontaneously at a baseline rate of 11.4 ± 1.2 Hz (n = 17), consistent with previous reports (Gauck and Jaeger, 2000). Average input resistance as determined by hyperpolarizing steps of current was 189 ± 20 MΩ. No holding current was applied during extracellular stimulation. The magnitude of RD in DCN neurons reflects a combination of the magnitude and duration of the preceding membrane hyperpolarization (Aizenman and Linden, 1999). Although repetitive stimulation evoked IPSP depression (Telgkamp and Raman, 2002), we found that all four PC stimulus protocols resulted in comparable absolute membrane hyperpolarizations during the early (-62 mV) and late (-58 mV) phase of stimulus trains. We also found that for a given frequency of stimulation, the characteristics of the subsequent RD were comparable despite up to an ∼20-fold difference in the duration of membrane hyperpolarization. Thus, neither the magnitude nor the duration of the membrane hyperpolarization induced by our PC stimulus patterns appeared to determine the characteristics of the subsequent RD. This finding would suggest that the activation of IH, or the deinactivation and subsequent availability of IT, did not differ between stimulus patterns. Rather, the frequency of stimulation proved to be the distinguishing feature of PC discharge patterns that could regulate RD characteristics.
After the offset of inhibition, DCN neurons depolarized at a stimulus frequency-dependent rate, reaching the threshold for a rebound discharge of Na+ spikes with a characteristic latency and spike frequency (Fig. 6B-E). The latency between the last IPSP and the first Na+ spike of the RD was consistently shortest for low-frequency tonic and burst PC stimulus patterns (∼70 ms). By comparison, the RD onset latency was significantly longer for the high-frequency tonic and high-frequency burst stimulus patterns (∼100 ms) (Fig. 6F). When we considered the frequency of Na+ spikes within each RD, we noted significant variability between DCN neurons for the peak frequency of RD, as reported previously (Aizenman et al., 1998; Aizenman and Linden, 1999). This variability was related to the presence of two basic cell responses: those cells whose peak RD frequency was less than two-fold the baseline discharge frequency (baseline, 11 ± 1 Hz vs peak RD, 15 ± 2 Hz; p < 0.01; n = 10 of 17 cells) and those whose peak RD frequency was more than twofold the baseline discharge frequency (baseline, 10 ± 2 Hz vs peak RD, 128 ± 42 Hz; p < 0.01; n = 7 of 17 cells). The reason for these differences are currently unknown but may reflect the heterogeneity of cell types in the deep nuclei (Czubayko et al., 2001). Stimulus protocol-dependent differences in the peak frequency of RD were evident for the high-frequency RD group (Fig. 6G, unfilled bars) but not for the low-frequency RD group (Fig. 6G, filled bars). In the high-frequency RD group, an increase in firing rate was noted for all protocols after relief of inhibition: ∼12-fold increase over baseline for both low-frequency tonic and burst stimulation protocols and ∼8-fold increase over baseline for the high-frequency tonic and high-frequency burst stimulation protocols (Fig. 6G).
These results indicate that low-frequency PC outputs were most effective in evoking a short-latency and high-frequency RD in DCN neurons. Thus, one very important function of Kv1 K+ channels in PCs is to reduce the frequency at which PCs generate Na+ spikes, which in turn optimizes the output of the DCN neuron. Although our understanding of this synapse is rapidly increasing (Aizenman and Linden, 1999; Gauck and Jaeger, 2000; Pedroarena and Schwarz, 2003; Telgkamp et al., 2004), future work with physiologically derived stimulation patterns will be required to fully determine the relationship between multiple stimulus factors and DCN neuron RD.
Discussion
The current study indicates that noninactivating Kv1 K+ currents in the somata and dendrites of PCs contribute to multiple forms of cell output principally near threshold for spike generation. We further demonstrate that Kv1 K+ channels enable lowfrequency tonic or burst PC output that is optimized to elicit short-latency and high-frequency RDs from DCN neurons.
Kv1 K+ channels regulate Purkinje cell output
We found that Kv1 K+ channels were activated near spike threshold and maintained low frequencies of Na+ spike discharge but played a limited role in shaping the Na+ spike waveform or setting the delay to spike discharge. A primary role was in enabling a sustained Na+ spike output, in that a loss of Kv1 channels resulted in a rapid inactivation of spike discharge. Kv1 K+ channels in hippocampal neurons were also found capable of supporting sustained spike output, because transfection of Kv1.3 K+ channels converted an adapting phenotype into sustained firing (Kupper et al., 2002). These results differ somewhat from other cells in which Kv1 channels delay the onset to Na+ spiking and confer strong spike adaptation (Storm, 1988; Nisenbaum et al., 1994; Brew and Forsythe, 1995; Locke and Nerbonne, 1997; Gamkrelidze et al., 1998; Golding et al., 1999; Bekkers and Delaney, 2001; Rothman and Manis, 2003; Faber and Sah, 2004). These differences may relate to the relative density of low threshold current or the presence of additional depolarizing inward currents that drive spike discharge in PCs, including a resurgent Na+ current and slow Na+ and Ca2+ currents underlying plateau potentials (Llinas and Sugimori, 1980; Raman and Bean, 1997; Rothman and Manis, 2003). Kv1 channels then appear to act near spike threshold to offset these inward currents to maintain a relatively low frequency and sustained discharge of Na+ spikes.
Kv1 K+ channels also maintained low frequencies of Ca-Na bursts and Ca2+ spikes, regulated the duration of plateau potentials, and set the threshold for Ca2+ spike discharge. Previous reports that the nonspecific K+ channel blocker 4-AP decreased plateau durations and Ca2+ spike thresholds can now be identified as Kv1-mediated effects given the specificity of the toxins we used (Hounsgaard and Midtgaard, 1988; Watanabe et al., 1998). Furthermore, we have identified Kv1 K+ currents in both somatic and dendritic membranes, providing the first electrophysiological confirmation of the Kv1 immunolabel reported in these regions. Although others have been unable to detect DTX- or MgTX-sensitive currents in mouse PCs (Southan and Robertson, 2000), this discrepancy may be related to species or age factors.
Kv1 channel toxins further elicited spontaneous CF discharge, suggesting that Kv1 K+ channels participate in setting the excitability of CF inputs. Because spontaneous CF discharge was sensitive to TTX but not internal QX-314, this activity may be interpreted as the activation of local spiking in severed CF axons or terminals, because the cell bodies of origin are lost in the in vitro preparation. In support of this conclusion, blockade of Kv1 K+ channels in isolated terminals or synaptosomes from neocortex also results in TTX-sensitive transmitter release (Tibbs et al., 1996; Lambe and Aghajanian, 2001). We additionally showed a postsynaptic role for Kv1 K+ channels in regulating the CF response using simulated EPSC waveforms. Interestingly, here the role for Kv1 channels was to limit the number of Na+ spikes discharged by the large CF EPSP. By comparison, small amplitude PF EPSCs were not shaped by Kv1 K+ channels, suggesting that activation of these channels requires the larger CF synaptic event.
Identity of Kv1 subtypes in Purkinje cells and climbing fibers
Outside-out recordings indicated that PC somatic and dendritic Kv1 K+ currents were noninactivating. Anatomical studies consistently detect the expression of noninactivating Kv1.1, Kv1.2, Kv1.3, and Kv1.6 α subunits in PCs (Veh et al., 1995). However, PCs also express Kvβ subunits that contain an “N-ball” that confers inactivation onto all but Kv1.6 subunits in expression studies (Rettig et al., 1994; Heinemann et al., 1996; Rhodes et al., 1996). Therefore, the lack of inactivation suggests that Kv1 K+ currents in PCs are mediated by Kv1.6 α subunits or that other Kv1 α subunits are expressed but not coassembled with Kvβ subunits. Our pharmacological experiments suggest this subunit might be Kv1.2, because it is the only Kv1 α subunit blocked by DTX and 1 nm MgTX (Coetzee et al., 1999). For CFs, we found that spontaneous discharge could be elicited by 100 nm but not 1 nm MgTX. These results suggest that Kv1.6 α subunits may regulate CF excitability, because they are the only Kv1 α subunits with a low sensitivity to MgTX (Coetzee et al., 1999).
Purkinje cells express both low- and high-threshold K+ channels
In several cell types, low-threshold Kv1 K+ channels are expressed together with high-threshold Kv3 K+ channels (Dodson and Forsythe, 2004). This is particularly evident in the calyx of Held/MNTB, cochlear nuclei, and in the terminals of cerebellar basket cells (Brew and Forsythe, 1995; Trussell, 1997; Grigg et al., 2000; Southan and Robertson, 2000; Ishikawa et al., 2003; Rothman and Manis, 2003; Lu et al., 2004). As a rule, low-threshold Kv1 K+ channels limit membrane excitability and preserve a one-to-one relationship between an EPSP and a Na+ spike (Dodson and Forsythe, 2004). High-threshold Kv3 K+ channels, on the other hand, rapidly repolarize action potentials and generate fast AHPs, thereby enabling high-frequency spike output (Rudy and McBain, 2001).
PCs express both Kv1 and Kv3 K+ channels, and from our present and past work in PCs (McKay and Turner, 2004), we can make detailed comparisons of the functions of these channels. For Na+ spikes, Kv1 K+ channels slow interspike depolarizations to enable sustained, low-frequency spike output, whereas Kv3 K+ channels repolarize Na+ spikes and generate fast AHPs to allow acute high-frequency spike discharge. We found that Kv1 K+ channels set the current threshold to evoke Ca2+ spikes and by opposing sustained inward currents, control plateau potentials that determine the onset latency to Ca2+ spikes. Kv1 K+ channels also maintain a low frequency of Ca2+ spike output but contribute minimally to Ca2+ spike waveform. On the other hand, Kv3 K+ channels contribute substantially to the Ca2+ spike waveform, regulating duration, amplitude, and fast AHP. By restraining Ca2+ influx, Kv3 K+ channels enable highfrequency Ca2+ spike output by limiting the activation of Ca2+-activated K+ channels and thus the duration of slow AHPs. For Ca-Na burst output, Kv1 K+ channels slow burst frequency and intraburst Na+ spike frequency. Kv3 K+ channels, especially at high stimulus intensities, restrain Ca2+ spike amplitude to ensure an efficient coupling of Na+ spikes to Ca2+ spikes. Without Kv3-mediated repolarization of the Ca2+ spike underlying each Ca-Na burst, Na+ spike generation is disabled and burst output is lost. Our results thus indicate that low- and high-threshold K+ channels contribute significantly to the output of PCs, with the role for Kv1 K+ channels centered around the threshold of spike generation, whereas Kv3 K+ channels actively shape spike waveforms.
Kv1 K+ channels optimize PC output to facilitate RD in DCN neurons
An important consideration is how ion channels that regulate spike output can affect the activity of postsynaptic neurons. In DCN cells, a rebound depolarization converts inhibitory input from PCs into a burst of spike output. We have shown that DCN neurons respond to low-frequency inhibitory stimulation reflecting normal Kv1-intact PC output with a short-latency and highfrequency RD. In contrast, stimulation of inhibitory inputs at a higher frequency representative of Kv1-deficient PC output resulted in a longer-latency and lower-frequency RD. Despite these stimulus-specific differences, all protocols resulted in comparable levels of membrane hyperpolarization throughout the course of spike trains. Therefore, the latency to RD and the frequency of spikes within the RD appear to be highly dependent on the frequency of inhibitory stimulation. Because PC output frequency is set in part by Kv1 K+ channels, our results suggest that Kv1 K+ channels generate an output that optimizes DCN neuron behavior.
Controlling the latency to RD and RD spike frequency may have important consequences for the timing of cerebellar output. One mechanism proposed to underlie cerebellar timing is a delayed reverberating loop based on the anatomy of cerebellar circuits and timing of interactions between individual cell types (Kistler and Leo van Hemmen, 1999). The basic circuit consists of the precerebellar nuclei, cerebellar cortex, and DCN neurons that project back onto precerebellar nuclei and reactivate mossy fiber input. It has been reasoned that the delay to RD in DCN neurons can enable this circuit to make temporal discriminations on the order of ∼100 ms, thereby establishing a reverberation frequency of ∼10 Hz. We found that the RD was delayed by ∼40% on blocking Kv1 channels in PCs (∼70 to ∼100 ms). Because the contribution of Kv1 K+ current to cell output can be acutely changed by phosphorylation (Huang et al., 1993; Winklhofer et al., 2003; Colley et al., 2004), it raises the interesting possibility that modulation of PC Kv1 current could dynamically modulate PC and thus DCN output to adjust cerebellar reverberation frequencies.
Footnotes
This work was supported by the Canadian Institutes of Health Research (CIHR) and an Alberta Heritage Foundation for Medical Research Scientist Award to R.W.T. B.E.M. was supported by a CIHR Canada Graduate Scholarship, a Natural Sciences and Engineering Research Council of Canada Postgraduate Fellowship, a Killam Trust Scholarship, and a Steinhauer Doctoral Award. W.H.M. was supported by a Province of Alberta Graduate Scholarship.
Correspondence should be addressed to Dr. Ray W. Turner, Hotchkiss Brain Institute, University of Calgary, 3330 Hospital Drive Northwest, Calgary, Alberta, Canada T2N 4N1. E-mail: rwturner@ucalgary.ca.
Copyright © 2005 Society for Neuroscience 0270-6474/05/251481-12$15.00/0
References
- Aizenman CD, Linden DJ (1999) Regulation of the rebound depolarization and spontaneous firing patterns of deep nuclear neurons in slices of rat cerebellum. J Neurophysiol 82: 1697-1709. [DOI] [PubMed] [Google Scholar]
- Aizenman CD, Manis PB, Linden DJ (1998) Polarity of long-term synaptic gain change is related to postsynaptic spike firing at a cerebellar inhibitory synapse. Neuron 21: 827-835. [DOI] [PubMed] [Google Scholar]
- Albus JS (1971) A theory of cerebellar function. Math Biosci 10: 25-61. [Google Scholar]
- Bekkers JM, Delaney AJ (2001) Modulation of excitability by α-dendrotoxin-sensitive potassium channels in neocortical pyramidal neurons. J Neurosci 21: 6553-6560. [DOI] [PMC free article] [PubMed] [Google Scholar]
- Brew HM, Forsythe ID (1995) Two voltage-dependent K+ conductances with complementary functions in postsynaptic integration at a central auditory synapse. J Neurosci 15: 8011-8022. [DOI] [PMC free article] [PubMed] [Google Scholar]
- Coetzee WA, Amarillo Y, Chiu J, Chow A, Lau D, McCormack T, Moreno H, Nadal MS, Ozaita A, Pountney D, Saganich M, Vega-Saenz de Miera E, Rudy B (1999) Molecular diversity of K+ channels. Ann NY Acad Sci 868: 233-285. [DOI] [PubMed] [Google Scholar]
- Colley B, Tucker K, Fadool DA (2004) Comparison of modulation of Kv1.3 channel by two receptor tyrosine kinases in olfactory bulb neurons of rodents. Receptors Channels 10: 25-36. [PMC free article] [PubMed] [Google Scholar]
- Czubayko U, Sultan F, Thier P, Schwarz C (2001) Two types of neurons in the rat cerebellar nuclei as distinguished by membrane potentials and intracellular fillings. J Neurophysiol 85: 2017-2029. [DOI] [PubMed] [Google Scholar]
- Derjean D, Bertrand S, Le Masson G, Landry M, Morisset V, Nagy F (2003) Dynamic balance of metabotropic inputs causes dorsal horn neurons to switch functional states. Nat Neurosci 6: 274-281. [DOI] [PubMed] [Google Scholar]
- Dodson PD, Forsythe ID (2004) Presynaptic K+ channels: electrifying regulators of synaptic terminal excitability. Trends Neurosci 27: 210-217. [DOI] [PubMed] [Google Scholar]
- Dodson PD, Barker MC, Forsythe ID (2002) Two heteromeric Kv1 potassium channels differentially regulate action potential firing. J Neurosci 22: 6953-6961. [DOI] [PMC free article] [PubMed] [Google Scholar]
- Edgerton JR, Reinhart PH (2003) Distinct contributions of small and large conductance Ca2+-activated K+ channels to rat Purkinje neuron function. J Physiol (Lond) 548: 53-69. [DOI] [PMC free article] [PubMed] [Google Scholar]
- Faber ES, Sah P (2004) Opioids inhibit lateral amygdala pyramidal neurons by enhancing a dendritic potassium current. J Neurosci 24: 3031-3039. [DOI] [PMC free article] [PubMed] [Google Scholar]
- Gamkrelidze G, Giaume C, Peusner KD (1998) The differential expression of low-threshold sustained potassium current contributes to the distinct firing patterns in embryonic central vestibular neurons. J Neurosci 18: 1449-1464. [DOI] [PMC free article] [PubMed] [Google Scholar]
- Gauck V, Jaeger D (2000) The control of rate and timing of spikes in the deep cerebellar nuclei by inhibition. J Neurosci 20: 3006-3016. [DOI] [PMC free article] [PubMed] [Google Scholar]
- Golding NL, Jung HY, Mickus T, Spruston N (1999) Dendritic calcium spike initiation and repolarization are controlled by distinct potassium channel subtypes in CA1 pyramidal neurons. J Neurosci 19: 8789-8798. [DOI] [PMC free article] [PubMed] [Google Scholar]
- Grigg JJ, Brew HM, Tempel BL (2000) Differential expression of voltagegated potassium channel genes in auditory nuclei of the mouse brainstem. Hear Res 140: 77-90. [DOI] [PubMed] [Google Scholar]
- Harvey AL (2001) Twenty years of dendrotoxins. Toxicon 39: 15-26. [DOI] [PubMed] [Google Scholar]
- Heinemann SH, Rettig J, Graack HR, Pongs O (1996) Functional characterization of Kv channel beta-subunits from rat brain. J Physiol (Lond) 493: 625-633. [DOI] [PMC free article] [PubMed] [Google Scholar]
- Hounsgaard J, Midtgaard J (1988) Intrinsic determinants of firing pattern in Purkinje cells of the turtle cerebellum in vitro. J Physiol (Lond) 402: 731-749. [DOI] [PMC free article] [PubMed] [Google Scholar]
- Huang XY, Morielli AD, Peralta EG (1993) Tyrosine kinase-dependent suppression of a potassium channel by the G protein-coupled m1 muscarinic acetylcholine receptor. Cell 75: 1145-1156. [DOI] [PubMed] [Google Scholar]
- Ishikawa T, Nakamura Y, Saitoh N, Li WB, Iwasaki S, Takahashi T (2003) Distinct roles of Kv1 and Kv3 potassium channels at the calyx of Held presynaptic terminal. J Neurosci 23: 10445-10453. [DOI] [PMC free article] [PubMed] [Google Scholar]
- Ito M (1984) The cerebellum and neural control. New York: Raven.
- Keating JG, Thach WT (1995) Nonclock behavior of inferior olive neurons: interspike interval of Purkinje cell complex spike discharge in the awake behaving monkey is random. J Neurophysiol 73: 1329-1340. [DOI] [PubMed] [Google Scholar]
- Khaliq ZM, Raman IM (2004) Axonal firing patterns during high-frequency spiking in Purkinje neurons. Soc Neurosci Abstr 30: 171.7. [Google Scholar]
- Khodakhah K, Melishchuk A, Armstrong CM (1997) Killing K channels with TEA+. Proc Natl Acad Sci USA 94: 13335-13338. [DOI] [PMC free article] [PubMed] [Google Scholar]
- Kistler WM, Leo van Hemmen J (1999) Delayed reverberation through time windows as a key to cerebellar function. Biol Cybern 81: 373-380. [DOI] [PubMed] [Google Scholar]
- Konnerth A, Llano I, Armstrong CM (1990) Synaptic currents in cerebellar Purkinje cells. Proc Natl Acad Sci USA 87: 2662-2665. [DOI] [PMC free article] [PubMed] [Google Scholar]
- Kupper J, Prinz AA, Fromherz P (2002) Recombinant Kv1.3 potassium channels stabilize tonic firing of cultured rat hippocampal neurons. Pflügers Arch 443: 541-547. [DOI] [PubMed] [Google Scholar]
- Lambe EK, Aghajanian GK (2001) The role of Kv1.2-containing potassium channels in serotonin-induced glutamate release from thalamocortical terminals in rat frontal cortex. J Neurosci 21: 9955-9963. [DOI] [PMC free article] [PubMed] [Google Scholar]
- Lang EJ, Sugihara I, Welsh JP, Llinas R (1999) Patterns of spontaneous Purkinje cell complex spike activity in the awake rat. J Neurosci 19: 2728-2739. [DOI] [PMC free article] [PubMed] [Google Scholar]
- Latham A, Paul DH (1971) Spontaneous activity of cerebellar Purkinje cells and their responses to impulses in climbing fibres. J Physiol (Lond) 213: 135-156. [DOI] [PMC free article] [PubMed] [Google Scholar]
- Llinas R, Muhlethaler M (1988) Electrophysiology of guinea-pig cerebellar nuclear cells in the in vitro brain stem-cerebellar preparation. J Physiol (Lond) 404: 241-258. [DOI] [PMC free article] [PubMed] [Google Scholar]
- Llinas R, Sugimori M (1980) Electrophysiological properties of in vitro Purkinje cell somata in mammalian cerebellar slices. J Physiol (Lond) 305: 171-195. [DOI] [PMC free article] [PubMed] [Google Scholar]
- Locke RE, Nerbonne JM (1997) Role of voltage-gated K+ currents in mediating the regular-spiking phenotype of callosal-projecting rat visual cortical neurons. J Neurophysiol 78: 2321-2335. [DOI] [PubMed] [Google Scholar]
- Lu Y, Monsivais P, Tempel BL, Rubel EW (2004) Activity-dependent regulation of the potassium channel subunits Kv1.1 and Kv3.1. J Comp Neurol 470: 93-106. [DOI] [PubMed] [Google Scholar]
- Marr D (1969) A theory of cerebellar cortex. J Physiol (Lond) 202: 437-470. [DOI] [PMC free article] [PubMed] [Google Scholar]
- McKay BE, Turner RW (2004) Kv3 K channels enable burst output in rat cerebellar Purkinje cells. Eur J Neurosci 20: 729-739. [DOI] [PubMed] [Google Scholar]
- Meir A, Ginsburg S, Butkevich A, Kachalsky SG, Kaiserman I, Ahdut R, Demirgoren S, Rahamimoff R (1999) Ion channels in presynaptic nerve terminals and control of transmitter release. Physiol Rev 79: 1019-1088. [DOI] [PubMed] [Google Scholar]
- Monsivais P, Hausser M (2003) Initiation and propagation of action potentials in axons of Purkinje neurons. Soc Neurosci Abstr 29: 476.3. [Google Scholar]
- Nisenbaum ES, Xu ZC, Wilson CJ (1994) Contribution of a slowly inactivating potassium current to the transition to firing of neostriatal spiny projection neurons. J Neurophysiol 71: 1174-1189. [DOI] [PubMed] [Google Scholar]
- Pedroarena CM, Schwarz C (2003) Efficacy and short-term plasticity at GABAergic synapses between Purkinje and cerebellar nuclei neurons. J Neurophysiol 89: 704-715. [DOI] [PubMed] [Google Scholar]
- Rall W (1969) Time constants and electrotonic length of membrane cylinders and neurons. Biophys J 9: 1483-1508. [DOI] [PMC free article] [PubMed] [Google Scholar]
- Raman IM, Bean BP (1997) Resurgent sodium current and action potential formation in dissociated cerebellar Purkinje neurons. J Neurosci 17: 4517-4526. [DOI] [PMC free article] [PubMed] [Google Scholar]
- Rettig J, Heinemann SH, Wunder F, Lorra C, Parcej DN, Dolly JO, Pongs O (1994) Inactivation properties of voltage-gated K+ channels altered by presence of beta-subunit. Nature 369: 289-294. [DOI] [PubMed] [Google Scholar]
- Rhodes KJ, Monaghan MM, Barrezueta NX, Nawoschik S, Bekele-Arcuri Z, Matos MF, Nakahira K, Schechter LE, Trimmer JS (1996) Voltage-gated K+ channel β subunits: expression and distribution of Kvβ1 and Kvβ2in adult rat brain. J Neurosci 16: 4846-4860. [DOI] [PMC free article] [PubMed] [Google Scholar]
- Rothman JS, Manis PB (2003) The roles potassium currents play in regulating the electrical activity of ventral cochlear nucleus neurons. J Neurophysiol 89: 3097-3113. [DOI] [PubMed] [Google Scholar]
- Rudy B, McBain CJ (2001) Kv3 channels: voltage-gated K+ channels designed for high-frequency repetitive firing. Trends Neurosci 24: 517-526. [DOI] [PubMed] [Google Scholar]
- Simpson JI, Ito M (1971) Discharges in Purkinje cell axons during climbing fiber activation. Brain Res 31: 215-219. [DOI] [PubMed] [Google Scholar]
- Southan AP, Robertson B (1998) Modulation of inhibitory post-synaptic currents (IPSCs) in mouse cerebellar Purkinje and basket cells by snake and scorpion toxin K+ channel blockers. Br J Pharmacol 125: 1375-1381. [DOI] [PMC free article] [PubMed] [Google Scholar]
- Southan AP, Robertson B (2000) Electrophysiological characterization of voltage-gated K+ currents in cerebellar basket and Purkinje cells: Kv1 and Kv3 channel subfamilies are present in basket cell nerve terminals. J Neurosci 20: 114-122. [DOI] [PMC free article] [PubMed] [Google Scholar]
- Storm JF (1988) Temporal integration by a slowly inactivating K+ current in hippocampal neurons. Nature 336: 379-381. [DOI] [PubMed] [Google Scholar]
- Stratton SE, Lorden JF, Mays LE, Oltmans GA (1988) Spontaneous and harmaline-stimulated Purkinje cell activity in rats with a genetic movement disorder. J Neurosci 8: 3327-3336. [DOI] [PMC free article] [PubMed] [Google Scholar]
- Stuart GJ, Dodt HU, Sakmann B (1993) Patch-clamp recordings from the soma and dendrites of neurons in brain slices using infrared video microscopy. Pflügers Arch 423: 511-518. [DOI] [PubMed] [Google Scholar]
- Telgkamp P, Raman IM (2002) Depression of inhibitory synaptic transmission between Purkinje cells and neurons of the cerebellar nuclei. J Neurosci 22: 8447-8457. [DOI] [PMC free article] [PubMed] [Google Scholar]
- Telgkamp P, Padgett DE, Ledoux VA, Woolley CS, Raman IM (2004) Maintenance of high-frequency transmission at Purkinje to cerebellar nuclear synapses by spillover from boutons with multiple release sites. Neuron 41: 113-126. [DOI] [PubMed] [Google Scholar]
- Tibbs GR, Dolly JO, Nicholls DG (1996) Evidence for the induction of repetitive action potentials in synaptosomes by K+-channel inhibitors: an analysis of plasma membrane ion fluxes. J Neurochem 67: 389-397. [DOI] [PubMed] [Google Scholar]
- Trussell LO (1997) Cellular mechanisms for preservation of timing in central auditory pathways. Curr Opin Neurobiol 7: 487-492. [DOI] [PubMed] [Google Scholar]
- Veh RW, Lichtinghagen R, Sewing S, Wunder F, Grumbach IM, Pongs O (1995) Immunohistochemical localization of five members of the Kv1 channel subunits: contrasting subcellular locations and neuron-specific co-localizations in rat brain. Eur J Neurosci 7: 2189-2205. [DOI] [PubMed] [Google Scholar]
- Watanabe S, Takagi H, Miyasho T, Inoue M, Kirino Y, Kudo Y, Miyakawa H (1998) Differential roles of two types of voltage-gated Ca2+ channels in the dendrites of rat cerebellar Purkinje neurons. Brain Res 791: 43-55. [DOI] [PubMed] [Google Scholar]
- Welsh JP, Lang EJ, Suglhara I, Llinas R (1995) Dynamic organization of motor control within the olivocerebellar system. Nature 374: 453-457. [DOI] [PubMed] [Google Scholar]
- Winklhofer M, Matthias K, Seifert G, Stocker M, Sewing S, Herget T, Steinhauser C, Saaler-Reinhardt S (2003) Analysis of phosphorylation-dependent modulation of Kv1.1 potassium channels. Neuropharmacology 44: 829-842. [DOI] [PubMed] [Google Scholar]
- Womack M, Khodakhah K (2002) Active contribution of dendrites to the tonic and trimodal patterns of activity in cerebellar Purkinje neurons. J Neurosci 22: 10603-10612. [DOI] [PMC free article] [PubMed] [Google Scholar]
- Womack MD, Khodakhah K (2004) Dendritic control of spontaneous bursting in cerebellar Purkinje cells. J Neurosci 24: 3511-3521. [DOI] [PMC free article] [PubMed] [Google Scholar]
- Yellen G, Jurman ME, Abramson T, MacKinnon R (1991) Mutations affecting internal TEA blockade identify the probable pore-forming region of a K+ channel. Science 251: 939-942. [DOI] [PubMed] [Google Scholar]