

Abstract
Humans and animals detect low-level tones masked by slowly fluctuating noise very efficiently. A possible neuronal correlate of this phenomenon is the ability of low-level tones to suppress neuronal locking to the envelope of the fluctuating noise (“locking suppression”). Using in vivo intracellular and extracellular recordings in cats, we studied neuronal responses to combinations of fluctuating noise and tones in three successive auditory stations: inferior colliculus (IC), medial geniculate body (MGB), and primary auditory cortex (A1). We found that although the most sensitive responses in the IC were approximately isomorphic to the physical structure of the sounds, with only a small perturbation in the responses to the fluctuating noise after the addition of low-level tones, some neurons in the MGB and all A1 neurons displayed striking suppressive effects. These neurons were hypersensitive, showing suppression already with tone levels lower than the threshold of the neurons in silence. The hypersensitive locking suppression in A1 and MGB had a special timing structure, starting >75 ms after tone onset. Our findings show a qualitative change in the representation of tone in fluctuating noise along the IC-MGB-A1 axis, suggesting the gradual segregation of signal from noise and the representation of the signal as a separate perceptual object in A1.
Keywords: auditory cortex, auditory thalamus, inferior colliculus, physiology, cat, comodulation masking release
Introduction
A major challenge in auditory neuroscience is to understand how the auditory system segregates low-level signals embedded in masking noise (Phillips and Cynader, 1985; Ramachandran et al., 2000; Neuert et al., 2004). Humans and animals perceive lowlevel signals embedded in slowly fluctuating noise more efficiently than similar signals embedded in unmodulated noise (Schooneveldt and Moore, 1989; Klump and Langemann, 1995; Langemann and Klump, 2001). Moreover, it is known that the detection of a signal in a modulated noise is facilitated with increase in noise bandwidth, a psychoacoustical phenomenon called comodulation-masking release (CMR) (Hall et al., 1984; Schooneveldt and Moore, 1989; Langemann and Klump, 2001). Given that many natural background noises are modulated and have a wide bandwidth, we hypothesized that CMR reflects an evolutional adaptation for detecting sounds over natural, coherently fluctuating backgrounds (Nelken et al., 1999).
We described previously a possible neural correlate of CMR in the primary auditory cortex (A1). We found that A1 neurons tend to lock to the amplitude envelope of slowly fluctuating noise (“envelope locking”), whereas addition of low-level tone suppresses the envelope locking (Nelken et al., 1999), a phenomenon that we refer to as “locking suppression.”
The subcortical segment of the auditory system is highly developed (Brugge, 1992), composed of numerous auditory stations that could each contribute to locking suppression. Indeed, previous studies (Pressnitzer et al., 2001; Verhey et al., 2003) have shown strong effects of low-level tones on the responses of neurons to wideband, fluctuating noise as early as the cochlear nucleus (CN). In contradistinction to the cortex, CN neurons, although more sensitive to tones embedded in wideband, fluctuating maskers, did not show locking suppression resulting from the addition of low-level tones. Rather, tone responses appeared as weak activity in the valleys of the modulation pattern of the fluctuating noise. Thus, whereas the results of these previous studies demonstrate the importance of subcortical mechanisms in the detection of low-level tones in wideband fluctuating maskers, they do not explain locking suppression in auditory cortex in response to the same stimuli.
In the present study, we trace the evolution of locking suppression along the auditory pathway. Recordings were made in A1 and in two preceding subcortical nuclei, the inferior colliculus (IC) and its output target, the medial geniculate body (MGB). We show that whereas responses in IC resemble in many respects those in CN, a new response pattern (that we name “hypersensitive locking suppression”) appears in MGB and becomes dominant in A1. Thus, locking suppression evolves along the thalamocortical segment of the auditory system.
Materials and Methods
Physiological recordings. Intracellular recordings were performed in A1 of seven cats, and extracellular recordings were performed in MGB and IC of three and eight cats, respectively. Anesthesia was induced by ketamine and xylazine and maintained with halothane (0.25-1.5%; all A1 and MGB cats and three IC cats) or isoflurane (0.1-2%; five IC cats; experiments were conducted at Johns Hopkins University, Baltimore, MD) using standard protocols authorized by the committee for animal care and ethics of the Hebrew University-Hadassah Medical School and Johns Hopkins University. For the intracellular recordings, the craniotomy was located above the low-frequency representation in A1. A well was built around the craniotomy using dental acrylic. The dura was removed, and the cisterna magna was drained. Sharp electrodes (40-80 MΩ impedance) filled with 3-5% biocytin (Sigma, St. Louis, MO) dissolved in 1 m KCl or potassium acetate were used.
For the extracellular recordings in MGB and IC, the craniotomies were made above the expected locations based on stereotaxic coordinates. The MGB and IC were approached vertically. Simultaneous recordings were performed with three glass-coated tungsten electrodes, each of which could be individually driven (EPS; Alpha-Omega, Nazareth, Israel). Spikes were sorted on-line (MSD; Alpha-Omega) and off-line (using a manual off-line sorting routine based on principal components). Small electrolytic lesions were made at the end of the MGB and IC experiments. In one of the MGB experiments, the electrodes were coated with DiI (Sigma) to facilitate the reconstruction of the electrode tracks. Neurons were recorded in all subdivisions of the MGB, as verified by locating the lesions or by locating the dye along the electrode track. Most of the IC neurons were recorded from the central nucleus, whereas some were recorded from the dorsal cortex of the IC. The recording location was verified by the reconstruction of the electrode tracks and by the response properties of the neurons.
Sound generation. Stimuli were generated digitally (AP2; Tucker-Davis Technologies, Alachua, FL), converted to analog voltage (DA3-4; Tucker-Davis), attenuated (PA4; Tucker-Davis), and switched with onset and offset ramps of 10 ms (SW2; Tucker-Davis). The sounds were presented to the animal through sealed, calibrated earphones (designed by G. Sokolich, Custom Sound Systems, Newport Beach, CA), with calibration performed in situ by probe microphones (Knowles Acoustics, Itasca, IL) precalibrated relative to a Bruel and Kjaer (Nrrum, Denmark) microphone.
Stimulation protocol. During the initial characterization of the neurons, the frequency response area (FRA) was measured to determine the best frequency (BF) and the minimum tone threshold (Fig. 1 A). Fortyfive tone frequencies (logarithmically spaced from 0.1 to 40 kHz) were presented at eight sound levels [linearly spaced between 0 and 87 dB sound pressure level (SPL)] in the extracellular experiments. In the intracellular recordings, data collected at two or three sound levels were used to determine the BF. The threshold was determined using rate-level functions at BF later in the protocol. The tuning width of the FRA was determined at the tone level that had the same energy as the noise masker (see below) and expressed as log2(Fup/Fdown), where Fdown and Fup are the lower and upper frequencies, respectively, of the FRA at the selected level. For the intracellular data, Fdown and Fup were determined using the subthreshold responses.
Figure 1.
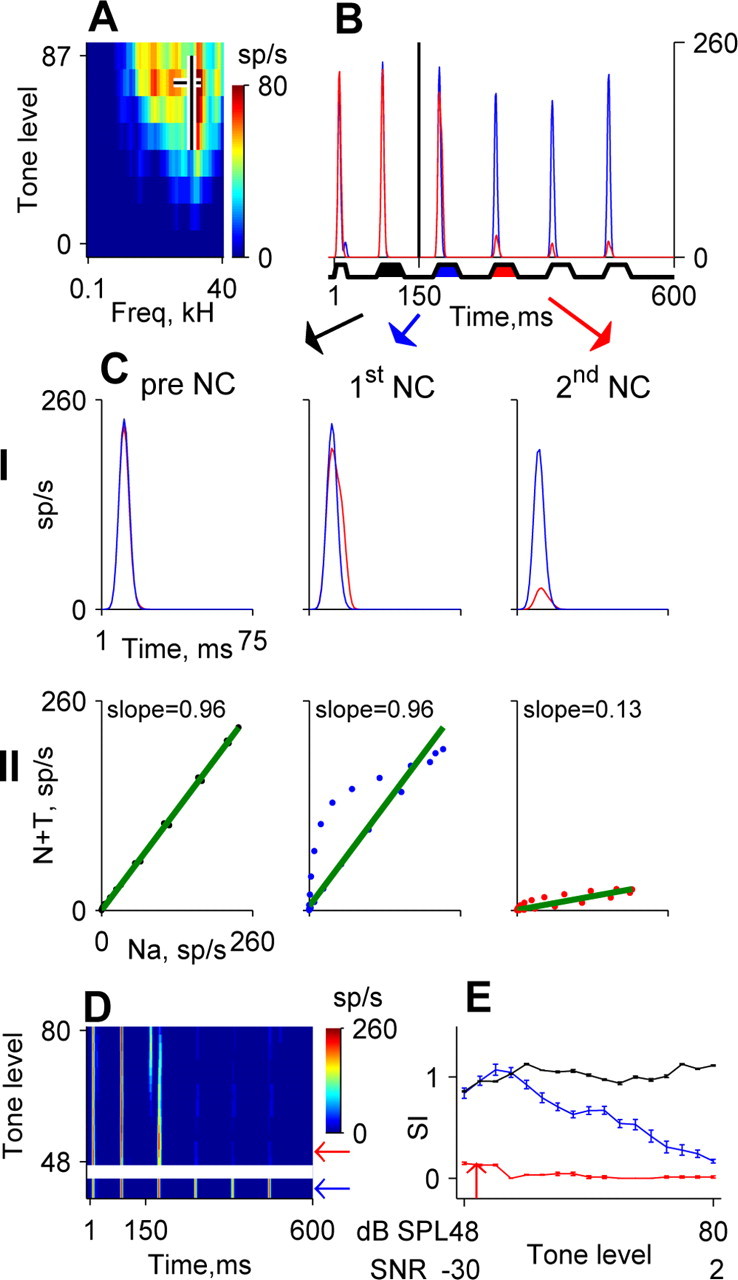
Quantification of locking suppression. A, The FRA (color coded) of a neuron in MGB. The horizontal black line indicates the bandwidth of the modulated noise that was used, and it is plotted at the level of the tones with the same energy, corresponding to SNR = 0. The vertical black line indicates the BF and is plotted over the range of levels that was used to test this neuron. B, Averaged response to the noise alone (blue line) and to the noise plus tone stimulus at the minimal tone level tested (red line). Tone onset is indicated by a vertical tick at 150 ms. Noise envelope is represented schematically at the bottom. The black, blue, and red patches indicate the noise cycle preceding tone onset and the first and second NCs after tone onset, respectively. C, Calculation of the SI. Row I shows 75 ms segments of the responses to the noise alone and noise plus tone stimuli for the three noise cycles (see Materials and Methods). Row II plots the two response segments from row I against each other. The slope of the scatter plot quantifies the effect of the added tone (same color conventions as in B). D, Average responses to amplitude-modulated noise alone (indicated by the blue arrow) and to tone plus noise combinations at different tone levels (presented as a response plane). Tone level is expressed in dB SPL. The red arrow indicates the minimal tone level at which suppression was observed. Tone onset is indicated by a vertical tick at 150 ms. E, SI as a function of tone level and SNR (relative to total noise energy in dB) for the three NCs (same colors as in B).
The noise threshold of the neuron was determined using a trapezoidsized, amplitude-modulated wide noise band, with 10 Hz modulation rate. The noise contained six noise cycles, the first being 25 ms long, whereas the rest were 50 ms, with 50 ms offset between all noise cycles (see Fig. 1 B for a schematic representation). Rise and fall time of each cycle was 12 ms. The total duration of the noise was 525 ms. The noise was centered at the BF of the neuron and had a bandwidth of BF Hz (Fig. 1 A), except for nine IC neurons, for which the noise bandwidth was BF/2 Hz. For the rest of the protocol, the noise level was set at 20 dB above the lowest level at which robust envelope locking was observed.
The masked threshold of BF tones in the trapezoidally modulated masker was crudely evaluated using random presentation of the following three types of stimuli: (1) 360 ms long BF tones at 60 different levels (with a resolution of 1 dB; each level was presented once); (2) the trapezoidally modulated masker, presented at a fixed level as described above; and (3) combinations of these two types, the sum of amplitudemodulated noise with BF tones at 60 different levels (the same levels as in stimulus 1). The tone was switched at 150 ms after noise onset and ended at the offset of the noise. The interstimulus intervals were 1300 ms (onset to onset). The masked threshold was determined as the tone level at which the response to the noise plus tone stimulus was different from the response to the noise alone. However, the masked threshold was never set to lower than 10 dB below the tone threshold in silence, and this level was often above the masked threshold. Thus, in many cases, suppression of the envelope locking occurred already at the lowest tone levels tested.
Next, we tried to determine more precisely the masked threshold using the same three types of stimuli as above. The BF tone was presented at 20 different levels, covering 38 dB with 2 dB resolution centered on the crude masked threshold (as determined above). Each tone level was presented five times alone and five times with noise.
In 11 A1 neurons recorded intracellularly, steady currents (range, -0.3 to 1.4 nA) were injected through the electrode to measure the neural responses at different depolarization levels while presenting the same set of stimuli. Additional current levels were tested as long as the recording was stable.
Data analysis. For analyzing membrane potential responses, spikes were removed from the voltage trace by linearly interpolating between the voltage values 1 ms before and 1 ms after each spike. Because only five repetitions were used at each tone level in noise, four successive tone levels (covering a range of 6 dB) were pooled together to obtain 20 trials as in the case of noise alone. This window of four levels was successively positioned at all tested levels.
Envelope locking was considered significant when there was a significant modulation of the neural responses as a function of time during a modulator cycle. The analysis of locking suppression was done only in those neurons that showed significant envelope locking. To quantify the magnitude and time course of locking suppression, we analyzed separately the responses to different noise cycles: the response to the noise cycle preceding tone onset (pre-NC), the response to the first noise cycle after tone onset (first NC), and the response to the second noise cycle after tone onset (second NC) (Fig. 1C, row I). Each of these segments was 75 ms, starting at the onset of the noise cycle and ending at 25 ms after the offset of a noise cycle. For each noise cycle, the response to the noise plus tone was plotted against the response to the noise alone (Fig. 1C, row II). The slope of the regression line through this scatter was used to quantify the effect of the addition of the tone to the noise. When the tone does not have any effect on the responses, the responses to the noise alone and noise plus tone should be similar; thus, the slope was close to 1. In contrast, suppression resulting from the addition of a tone decreased the response to the noise in the noise plus tone case, thus reducing the regression slope. We call this measure the “similarity index,” because it measures the similarity between the responses to the noise alone and the noise plus tone stimuli. The minimal tone level at which a significant reduction in the similarity index was detected for the first NC and second NC after tone onset was named masking threshold [similarity index (SI) values that were lower than 1.5 SDs from the mean SI values of the pre-NC] (Fig. 1 E).
Because each neuron was tested with a specifically tailored masker, there was a large variability in total noise energy related to the variability in BF. Thus, expressing the masked threshold in terms of dB SPL may be misleading, because the total noise energy of the maskers used for neurons with higher BFs was higher than the total energy of the maskers used for neurons with lower BFs. To compare masked thresholds of different neurons in a more principled way, thresholds were generally expressed as signal-to-noise ratios (SNRs) relative to the noise energy used for the same neuron. Both measures are given in the figures and reported in this study for tone in noise as well as tone alone stimuli.
Estimating stimulus-related conductance changes. In 6 of 11 neurons in which steady currents were injected, envelope locking was significant. For this subset of neurons, it was possible to estimate the stimulus-related conductance changes during envelope locking and its suppression. The instantaneous total conductance of the neuron during stimulus presentations, gtot(t), and the instantaneous equivalent reversal potential, Eeq(t), were computed by fitting the following equation to the current-voltage curve at each moment in time: Iinj = gtot(t) × [V(t) - Eeq(t)], where Iinj is the injected current to the neuron and V(t) is the instantaneous membrane potential. The capacitive current was estimated to represent <10% of the total current even when the membrane potential showed its fastest rate of change and was therefore neglected. The analysis was performed only in the range of current injections at which the I-V relationships were linear.
We further decomposed the total stimulus-evoked conductance change into excitatory and inhibitory components [ge(t) and gi(t), respectively]. This decomposition was performed under the assumptions that the neuron is isopotential, all the excitatory synapses have the same reversal potential, and all the inhibitory synapses have the same reversal potential. These assumptions represent obvious simplifications of the real situation, but for a reasonable range of deviations, these simplifications do not affect the qualitative features of the results. The total conductance was assumed to be composed of three components: the leak conductance, representing the spontaneous fixed-level conductance of the neuron, and the excitatory and inhibitory synaptic conductances that are stimulus related: Iinj = ge(t) × [V(t) - Ee] + gi(t) × [V(t) - Ei] + gleak × [V(t) - Vrest]. Ee and Ei are the reversal potential of the excitatory and inhibitory synapse components, respectively. Vrest, the resting potential of the cell, was determined by the modal membrane potential value during the 200 ms intervals preceding stimulus onset in trials without current injection. The leak conductance, gleak, was estimated by assuming that during the same 200 ms segments, the stimulus-evoked conductances were zero. The stimulus-related conductances ge(t) and gi(t) were derived from the above equation using least-square fit with the additional constraint that all conductances were positive. We used Ee = 10 mV and Ei = -90 (Wehr and Zador, 2003). Small changes in these values had only minor effects on the results.
Relationships between membrane potential and spiking activity. Spike threshold, Vthr, was computed using the same spontaneous 200 ms intervals. We searched for spikes that did not have another spike in the preceding 10 ms. From each of these 10 ms segments, we determined the spike initiation potential, Vspike, as the membrane potential at which the first derivative of the potential trajectory (dV/dt) reached 10% of its maximum (Azouz and Gray, 1999). The mean Vspike was the average of all of these numbers. The difference between Vrest and Vspike was defined as spike threshold, Vthr.
The correlation coefficient (CC) between sensory responses of spikes and membrane potential was computed as follows. First, the membrane potential and the spiking activity in individual trials were filtered by a 5 ms square window. Second, the correlation coefficient between these individual trials was computed in a window that started 50 ms before stimulus onset and ended 50 ms after stimulus offset. Relative lags of ±12.5 ms were used, because the peak firing rate often occurred during the rising phase, rather than at the peak of the subthreshold response. These correlation coefficients were averaged over all trials for each lag separately. The correlation coefficients were calculated only in those cases that had more than one spike in at least one trial. The maximal correlation coefficient, over all lags, was used to quantify the degree of similarity between membrane potential and spiking responses. It could range between -1 and 1, but in practice was essentially always positive. A value of 0 corresponds to no similarity between subthreshold and spike response, and 1 corresponds to maximal similarity.
Statistical tests were conducted at the 0.05 significance level, except for the tests in the section on the transformation from subthreshold activity into action potentials. In that section, a large number of correlations between different parameters were considered, and therefore the significance level was raised to 0.01 to alleviate the problem of multiple comparisons.
Results
We performed intracellular recordings in vivo from A1 (n = 20 neurons) and extracellular recordings from well isolated neurons in MGB (n = 100) and IC (n = 42).
An example of one A1 cell stained with biocytin is depicted in Figure 2A. Like all identified neurons (n = 10), it had spiny dendrites (Fig. 2B) and a pyramidal morphology. The membrane potential of this neuron fluctuated between a modal resting value of -75 mV (Fig. 2C, arrowhead) and spike threshold, which was 10-15 mV depolarized from rest (Steriade et al., 1993; Cowan and Wilson, 1994; Steriade and Contreras, 1996; Stern et al., 1997). Stained neurons were found in cortical layers II-VI. No clear correlation was found between cortical depth and the functional properties studied here.
Figure 2.

Morphology and spontaneous activity of A1 neuron. A, A biocytin-filled pyramidal neuron. Scale bar, 100 μm. B, A section of its dendritic arborization, with dendritic spines clearly observable (arrows). Scale bar, 20 μm. C, Spontaneous membrane potential activity of the neuron. Resting potential is -75 mV (arrow). Calibration: 20 mV, 200 ms.
Responses in A1
Figure 3 shows the responses of two A1 neurons to tones and modulated noise. Both neurons were tuned in frequency (Fig. 3A,B, row I). The neuron in Figure 3A had strong membrane potential and spike responses to pure tones, with essentially identical receptive fields for both. It also showed locking to the temporal envelope of the noise (envelope locking, row II) with both membrane potential and spikes. In contrast, Figure 3B shows the responses of a neuron for which membrane potential showed significant responses over a wider frequency range than the spiking responses [compare with similar findings in visual cortex by Bringuier et al. (1999)]. Moreover, in response to modulated noise bands, only the membrane potential, and not the spiking responses, of the neuron in Figure 3B showed significant envelope locking. The addition of a tone to the noise strongly suppressed the envelope locking of both neurons (Fig. 3, rows III and IV for spiking and membrane potential responses, respectively). Eleven of 20 A1 neurons had envelope locking of the membrane potential. There was a tendency for these neurons to have somewhat wider tuning widths, although this tendency did not reach statistical significance. Five of these neurons also had locking of their spiking responses. No neuron had envelope locking in its spiking response without having envelope locking in its membrane potential responses.
Figure 3.
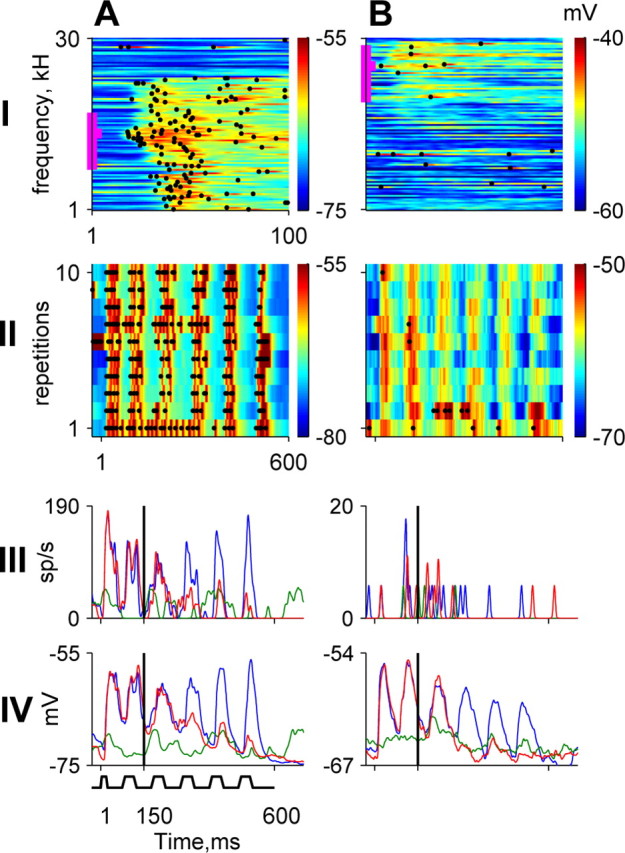
Responses of two A1 neurons (A, B) to tones and modulated noise. Each panel in row I and row II depicts the subthreshold responses in color, whereas the spikes are represented by black dots. Row I, Response to pure tones of 100 different frequencies presented at a constant tone level. BFs and tone levels: A, 4.5 kHz and 66 dB SPL; B, 17 kHz and 68 dB SPL. The bandwidth of the fluctuating masker is indicated by the vertical thick magenta line. Row II, Ten individual responses to the fluctuating maskers. The total noise energy was 90 and 70 dB SPL for A and B, respectively. Rows III and IV, Average spike and membrane potential responses to the noise plus tone stimulus at the minimal tone level tested (red), to the tone alone at the same level (green), and to the noise alone (blue).
Transformation from subthreshold activity into action potentials
Neurons in visual cortex vary in the strength of the relationships between subthreshold responses and the resulting spiking responses (Azouz and Gray, 1999; Monier et al., 2003). Previously, similar variations have been shown to occur also in the auditory cortex (De Ribaupierre et al., 1972). Our data (Fig. 3) are consistent with these findings. To quantify the relationship between subthreshold responses and the resulting spiking responses, we calculated the average CC between them (see Materials and Methods). A large range of CC values was obtained (Fig. 4D, y-axis), as expected. Moreover, the CC was correlated with measures that express the excitability of the neurons, such as spike rate, both spontaneous and evoked (spontaneous spike rate, r = 0.62, n = 18, p < 0.01; evoked spike rate, r = 0.59, n = 18, p < 0.01) (Fig. 4D). These results are in agreement with those of De Ribaupierre et al. (1972), suggesting, unsurprisingly, that the more excitable neurons had tighter relationships between membrane potential fluctuations and the resulting spike rate.
Figure 4.
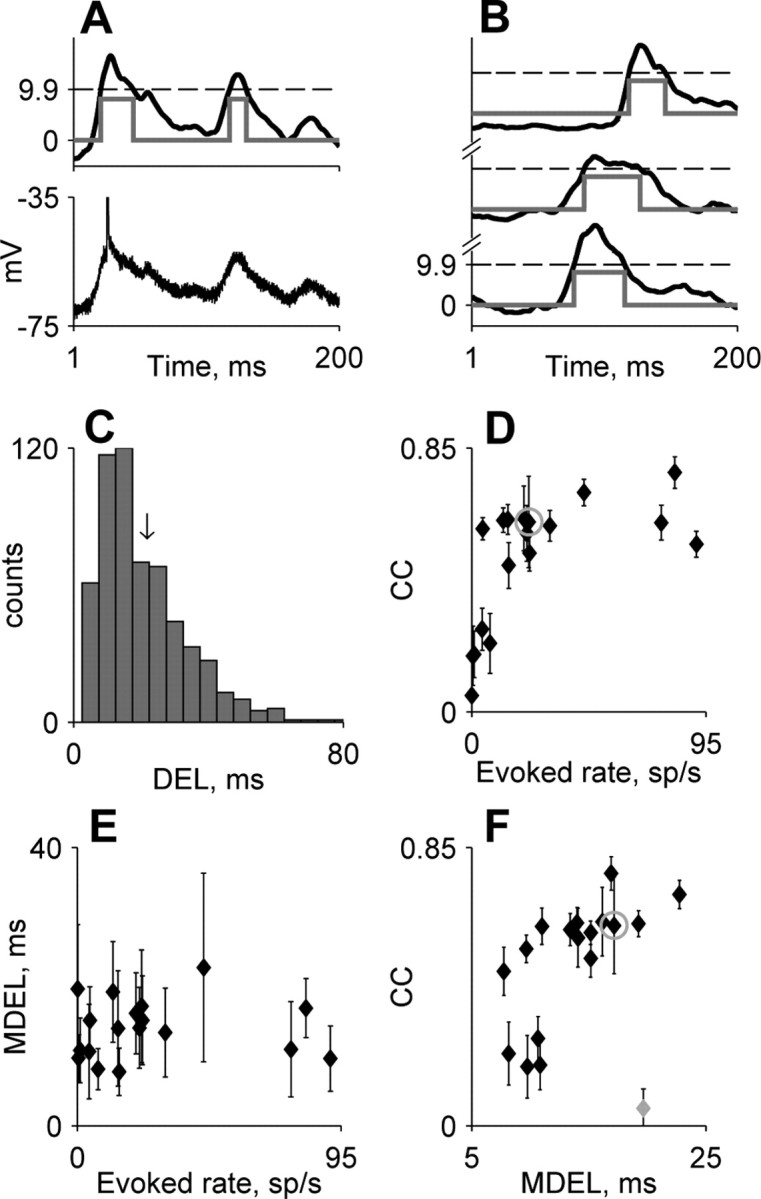
Population analysis of the relationship between subthreshold and spike responses. A, A segment of ongoing activity containing two depolarizing excursions. The bottom panel displays the original, unsmoothed 200 ms segment of membrane potential. The top panel displays the smoothed membrane potential after subtraction of Vrest. The dashed line indicates the threshold in the definition of the depolarizing excursions. The duration of the depolarizing excursion is indicated by the gray line. B, Three additional examples of depolarizing excursions from the same neuron. C, The distribution of depolarizing excursion length for the same neuron as in A and B. The black arrow indicates the MDEL (17 ms) for this neuron. D, Evoked spike rate versus CC for all neurons (n = 18). E, Evoked spike rate versus MDEL for all neurons. F, MDEL versus CC. In D and F, the error bars represent SDs over all data files of each neuron, whereas in E, error bars represent the interquartile range of the distribution of the depolarizing excursions for each neuron. Gray circles in D-F mark the neuron from A-C.
However, some of the variability in the strength of the relationships between subthreshold and spike responses was not captured by these measures of excitability and could also be attributable to other mechanisms. For example, in Figure 4D, neurons with low evoked spike rates had CC values ranging from ∼0 to ∼1.
To find other neuronal correlates that could affect the CC, we studied the ongoing activity between stimulus presentations. Only the last 200 ms before each stimulus onset was used for this analysis to minimize the effects of a preceding stimulus on the membrane potential. We studied the statistics of the depolarizing excursions, the time periods during which the membrane potential (filtered with a 5 ms square window) was higher than Vrest + 0.75 × (Vspike - Vrest) (Fig. 4A,B) (using other thresholds, between 0.1 and 0.9, gave rise to similar results).
The median duration of these events [median depolarizing excursion length (MDEL)] was significantly longer than 5 ms in all of the cells. In all of the neurons, a substantial proportion of the depolarization excursions (between 25 and 63%) lasted for >20 ms (Fig. 4C). Both the large amplitude and the duration of these events imply that at least some of the depolarizing excursions are not the result of single EPSP but rather the occurrence of convergent synchronized excitatory inputs. Thus, the variability found in MDEL values (Fig. 4F, x-axis) could be a result of differences in the connection strength between the individual neurons and the network in which they are embedded. In contrast to CC, the MDEL was correlated neither with spontaneous spike rate (r =-0.04; n = 18; NS) nor with evoked spike rate (r = 0.05; n = 18; NS) (Fig. 4E). Figure 4F shows the scatter plot of the MDEL against the correlation coefficient. The MDEL was only weakly correlated with the CC (r = 0.42; n = 18; p = 0.08). However, removing the outlier at the lower right (Fig. 4F, plotted in gray) increased the correlation and the statistical significance (r = 0.7; n = 17; p = 0.002). This neuron, contrary to all other neurons, had only inhibitory response components (resulting in very low CC value) (see responses in Figs. 7, 8) but had long depolarizing excursions. More importantly, all of the neurons with low evoked rates (<23.5 spikes/s) and high CC (>0.5) had relatively high MDEL (>14 ms; n = 7) (the circled point represents the same neuron in Fig. 4, D and F).
Figure 7.
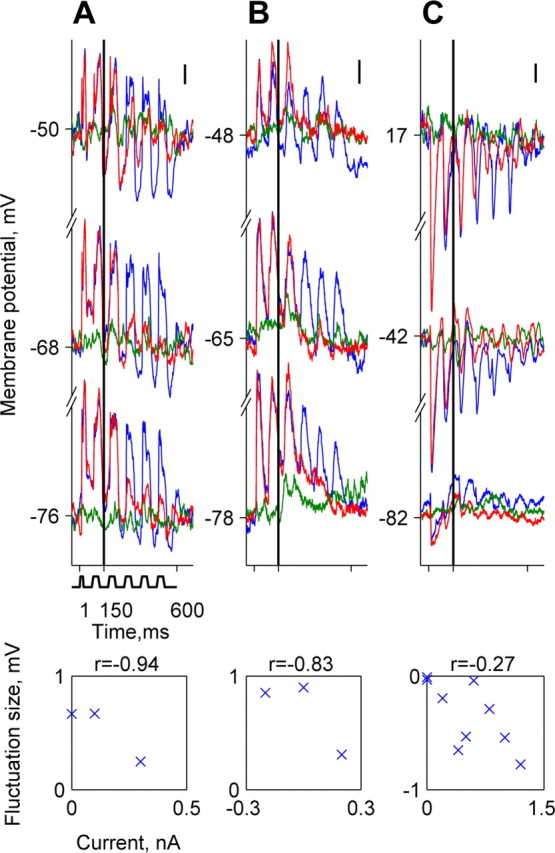
Membrane potential responses of A1 neurons during current injection. A-C, Responses of three neurons. B is the same neuron as in Figure 5A. Each panel depicts the responses to a low-level tone plus noise combination (red), the responses to tone alone at the same level (green), and responses to noise alone (blue). These are shown at three current injection levels. The scatter plots show the mean fluctuation size as a function of current level for all current levels used to test each of the three neurons. The correlation coefficient r is displayed above the scatter plot. A, Currents (nA; from bottom to top): 0, 0.1, 0.3; BF, 20 kHz; SNR, -32 dB. B, Currents (nA; from bottom to top): -0.2, 0, 0.2; BF, 17 kHz; SNR, -23 dB. C, Currents (nA; from bottom to top): 0, 0.6, 1.2; BF, 3 kHz; SNR, -32 dB. Scale bars, 2 mV.
Figure 8.

Suppression of the locking of the excitatory and inhibitory conductances to the noise envelope by low-level tones in A1 neurons. A is the same neuron as in Figure 7A, and B is the same neuron as in Figure 7C. Each panel shows the changes during noise alone (black) and noise plus tone representation (gray). Row I, Total conductance, gtot. Row II, Equivalent reversal potential, Eeq. Row III, Excitatory conductance, ge. Row IV, Inhibitory conductance, gi.
Thus, high CC could be achieved in a high-spike-rate neuron but also in a low-spike-rate neuron if it had long depolarizing excursions, suggesting that it had large synchronized synaptic inputs. Together, these results suggest that the transition from subthreshold responses into spiking activity is governed by at least two independent properties, the individual neural excitability (as indexed by, e.g., the evoked spike rate) and the functional relationships between the neuron and the network (as indexed by the depolarizing excursions). This conclusion is consistent with the conclusions of Deweese and Zador (2004), who showed that the functional relationships between the neuron and the network had large effects on the variability of the subthreshold responses in auditory cortex.
Locking suppression in A1
All 11 A1 neurons that showed envelope locking in their membrane potential responses also showed locking suppression resulting from the addition of tone. The neurons that displayed, in addition, envelope locking in their spiking responses (5 of 11) also showed locking suppression of the spikes. Therefore, both envelope locking and its suppression occurred at the membrane potential level and were mirrored in the spiking responses. The rest of the analysis focuses on membrane potential responses.
The effects of different tone levels on the subthreshold locking suppression of two A1 neurons are illustrated in Figure 5. Locking suppression in these neurons was prominent even at levels below tone threshold in silence (Fig. 5A,B, row III, compare rows I and II). In Figure 5A at high-tone levels, the responses to the combination of noise and tone were similar to those evoked by the tone-alone stimuli at the same level (compare row I and II), because at these levels, the tone dominated stimulus energy.
Figure 5.
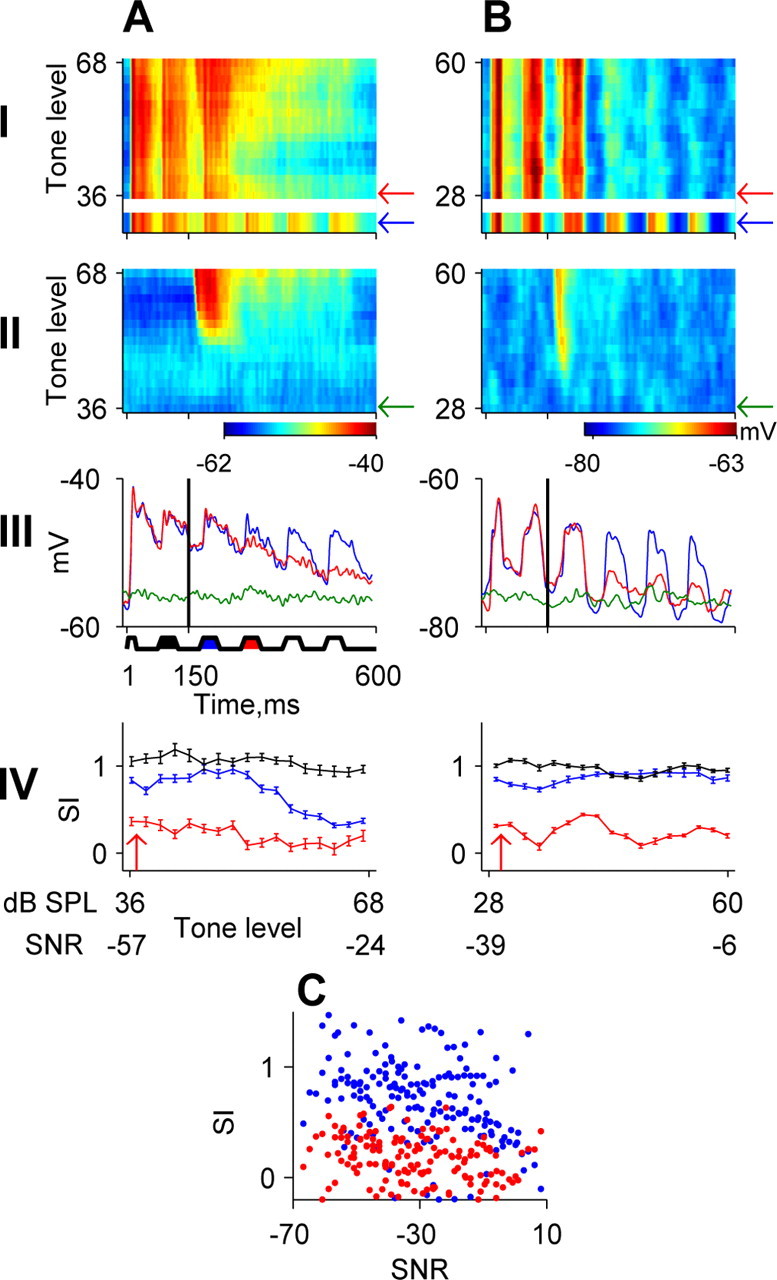
Locking suppression in A1. A, B, Membrane potential responses of two A1 neurons. Row I, Responses to noise alone and noise plus tone (same layout as in Fig. 1 D). Row II, Average responses to tone alone at the same levels as in row I. The green arrows indicate the response to the tone alone at the minimal level inducing suppression. Row III, Response to the noise plus tone stimulus at the level indicated by the red arrow in row I (red), response to tone alone at the same level (green), and response to noise alone (blue). Row IV, SI as a function of tone level and SNR (same layout as in Fig. 1 E). C, Population analysis of similarity indices at the first (blue) and second NCs (red) as a function of SNR. Each dot represents the similarity indices of one neuron at one SNR value for all neurons that exhibited significant envelope locking (n = 11). The points arising from the responses of the same neuron are not connected to reduce the clutter in the figure. Note the large differences between the similarity indices to the first and second NCs at low SNRs, demonstrating the hypersensitive locking suppression in A1 neurons.
The locking suppression had a characteristic timing structure. The response to the first noise cycle after tone onset (first NC) was unaffected by the addition of the tone, whereas the response to the second noise cycle after tone onset (second NC) was partially or fully suppressed (Fig. 5A,B). The delay from tone onset to suppression onset was at least 75 ms.
We used a similarity index to quantify the effects of the tone on the responses to the different noise cycles (see Materials and Methods). The similarity index is plotted as a function of tone level, expressed both in dB SPL and as SNR in Figure 5, A and B, row IV. At low-tone levels, the locking to the first NC was not affected, as indicated by the similarity index values of ∼1 (blue; see scheme below row III). In contrast, at the same tone levels, the similarity index of the second NC was ∼0, indicating an almost complete locking suppression (red). As a control, the similarity index for the NC preceding tone onset (black) was ∼1 and essentially independent of SNR, as expected.
This timing structure was observed in all 11 A1 neurons that had envelope locking in their membrane potential responses. It was also observed in the spiking responses of the five neurons that had locking suppression of their spiking response as well (see example in Fig. 3A, row III); these data are not discussed further here, given that they clearly mirrored the behavior of the membrane potential, as discussed above. Figure 5C shows all similarity indices for the first (blue) and second (red) NCs after tone onset. Because of the differences in bandwidth of the maskers, to usefully compare all neurons, the similarity indices are plotted as a function of the SNR rather than as a function of tone level in dB SPL (see Materials and Methods). At low SNR (low-tone levels), the similarity indices for the first NC after tone onset are mostly ∼1, whereas at the same SNR, similarity indices for the second NC after tone onset are already substantially reduced. At high SNR, the tone affects the neuronal responses at a substantially shorter latency, and the similarity indices for both the first and second NCs after tone onset are relatively low, as expected. Because the late-locking suppression occurred in A1 at these extreme signal-to-noise ratios, we will call this pattern “hypersensitive locking suppression.”
During the presentation of low-level tones, the membrane potential returned to its resting level, either abruptly (7 of 11) (Fig. 6A, gray line) or in a gradual manner (4 of 11) (Fig. 6B, gray line). Curiously, in all neurons, this pattern was similar to the one observed in response to tones at suprathreshold levels when presented alone (Fig. 6A,B, bottom panel, compare thin black lines with gray lines). As a result, after one noise cycle, the responses to a low-level tone embedded in fluctuating noise were similar to the responses to a suprathreshold tone when presented alone.
Figure 6.

Responses to near-threshold tones in noise are similar to the responses to suprathreshold tones in silence. A, B, Responses of two neurons. B is the same neuron as in Figure 5A. The top panels depict the responses to noise alone (thick black line), to a noise plus tone combination at the minimal tone level tested (gray line), and to the same tone level when presented alone (thin black line). The bottom panels depict the responses to a tone plus noise at the minimal tone level tested (gray, same as in top panel) and the response to a suprathreshold level that saturated the tone response (thin black line). Parameters [BF (kHz): low-tone level, and high-tone level in SNR, low-tone level and high-tone level in dB SPL]: A, 29, 3, 41, 73; B, 15, -57, -25, 36, 68.
Locking suppression in A1 is not attributable to tone-evoked inhibition
We tried to uncover the mechanisms underlying the generation of locking suppression. Eleven A1 neurons were injected with varying levels of steady current, while presenting combinations of noise and tone stimuli, to look for inhibitory mechanisms that could underlie locking suppression. Six of these neurons displayed significant envelope locking. Figure 7 shows the responses of three neurons, each at three current levels. Positive current injections caused a decrease in the magnitude of depolarizing response components (Fig. 7A,B) and an increase in that of hyperpolarizing components (Fig. 7A,C). In a few cases, positive current injection unmasked hyperpolarizing response components to the noise when presented alone (Fig. 7A,C, blue), presumably because of “silent inhibition” (Borg-Graham et al., 1998; Fregnac et al., 2003). The scatter plots in Figure 7 depict the mean fluctuation size in the membrane potential in response to the fluctuating noise as a function of current level. In all three neurons, the correlation between mean fluctuation size and current injection was negative, as expected by the resulting change in the difference between resting potential and the synaptic reversal potential. Such negative correlations were present in all neurons displaying significant envelope locking (6 of 11 neurons studied with current injections; t = 3.8; df = 5; p < 0.05).
However, current injections affected neither the locking suppression nor its timing pattern. Tones that suppressed envelope locking without current injection suppressed envelope locking also with current injection as long as the envelope locking was not abolished by the current injection. The inhibitory response components unmasked by depolarizing the neurons could not account for the suppression, because they were present only in noise responses but not in tone responses. Furthermore, these inhibitory components were also suppressed by the addition of low-level tones. Thus, these results suggest that the locking suppression is fully formed at the level of the input currents to the cortical neurons.
To support this observation, we measured the stimulusrelated changes in the instantaneous total conductance gtot(t) of all six neurons that were studied with current injections and that displayed envelope locking in their responses to the noise maskers. Figure 8, row I, shows gtot(t) of two A1 neurons (Fig. 7A,C, neurons) during the noise-alone stimulus and during the noise plus tone stimulus at the minimal tone level tested. The neuron in Figure 8A showed a significant reduction in the total conductance at the end of the second NC after tone onset, whereas the average level of the total conductance of the neuron in Figure 8B was not affected significantly by the addition of the tone, although its timing structure seemed to change.
In contrast to gtot, the equivalent reversal potential, Eeq (see Materials and Methods), showed large fluctuations in response to the noise alone, whereas addition of the tone caused suppression in the fluctuations starting at the second NC after tone onset (Fig. 8A, row II). The large fluctuations in Eeq suggest that the stimulus-evoked conductances alternated between excitation and inhibition.
This was verified by decomposing the total conductance into its components (see Materials and Methods for the assumptions underlying this analysis). In most cases (5 of 6), both excitatory and inhibitory components were uncovered. In Figure 8A, the excitation preceded the inhibition by 2 ms, with excitatory (row III) and inhibitory (row IV) conductances of comparable magnitude. This result is consistent with the recent demonstration of balanced stimulus-evoked excitation and inhibition in auditory cortex, with the inhibition slightly delayed with respect to the excitation (DeWeese et al., 2003; Wehr and Zador, 2003; Zhang et al., 2003). In Figure 8B, an inhibitory conductance preceded a much smaller excitatory conductance. Suprathreshold tones evoked similar balanced excitation and inhibition, with small delays between them (data not shown). Importantly, in all six neurons, both excitation and inhibition were locked to the noise envelope. Furthermore, both excitation and inhibition showed a clear locking suppression because of the addition of the low-level tone, starting at the second NC after tone onset.
Together, these results did not reveal any special tone response property that could underlie the observed locking suppression. Thus, it is plausible that the suppressive effects are already expressed at the input level of A1 neurons, possibly originating in subcortical stations.
Responses in MGB
In MGB, 58 of 100 neurons showed significant responses to the tone-alone stimuli, and 37 of those showed envelope locking. The MGB neurons that displayed envelope locking showed two response types resulting from the addition of a tone to the noise. Approximately half (18 of 37) behaved like the hypersensitive A1 neurons. They showed no tone effects on the responses to the first NC after tone onset and full suppression of the locking to the second NC after tone onset at low SNRs (Fig. 9A). The other neurons (19 of 37) showed locking suppression starting immediately after tone onset, resulting in suppression of both first and second NCs following the tone with similar level dependence (Fig. 9B). Thus, there was a parallel decrease in similarity indices of the first and second NCs after tone onset as a function of SNR (Fig. 9B, row IV). These neurons had a higher suppression threshold than neurons showing hypersensitive suppression (mean SNR, -19 dB, vs -47 dB; t = 5.7; df = 35; p < 0.05). As a result, the population distribution of the similarity indices for the first and second NCs after tone onset partially overlapped at low SNRs (Fig. 9C). No clear correlation was found between recording locations in the different subdivisions of the MGB and the two types of locking suppression. In contrast, the tuning widths of the neurons were significantly different according to their responses to noise and to tone in noise (one-way ANOVA; F(2,53) = 4.12; p < 0.05). The widest tuning was found among neurons that had significant locking and showed hypersensitive suppression, and the narrowest tuning was found among neurons that did not have locking to the modulated masker. Neurons that had significant locking but no hypersensitive suppression had intermediate bandwidths. The difference between the two extreme groups was significant in post hoc comparisons at the 0.05 level.
Figure 9.

Locking suppression of spiking responses in MGB. The same layout as in Figure 5, A and B, is used. Responses of two MGB neurons are shown. C, Population analysis of SIs; data are from 37 neurons.
Responses in IC
Because the hypersensitive locking suppression already occurred in MGB, we recorded responses in the IC, the obligatory midbrain auditory nucleus preceding the MGB (Casseday et al., 2001). In contrast to MGB and cortex, all IC neurons with significant envelope locking (29 of 42) showed locking suppression starting at first NC after tone onset, resulting in parallel decrease in the similarity indices for the first and second NCs after tone onset (Fig. 10). Furthermore, their suppression thresholds were comparatively high on average (mean SNR, -18 dB; n = 29), similar to their counterparts in the MGB. Thus, these results suggest that the hypersensitive locking suppression, with its special timing structure, is not present in IC, is first generated in MGB, and is then enhanced in A1.
Figure 10.
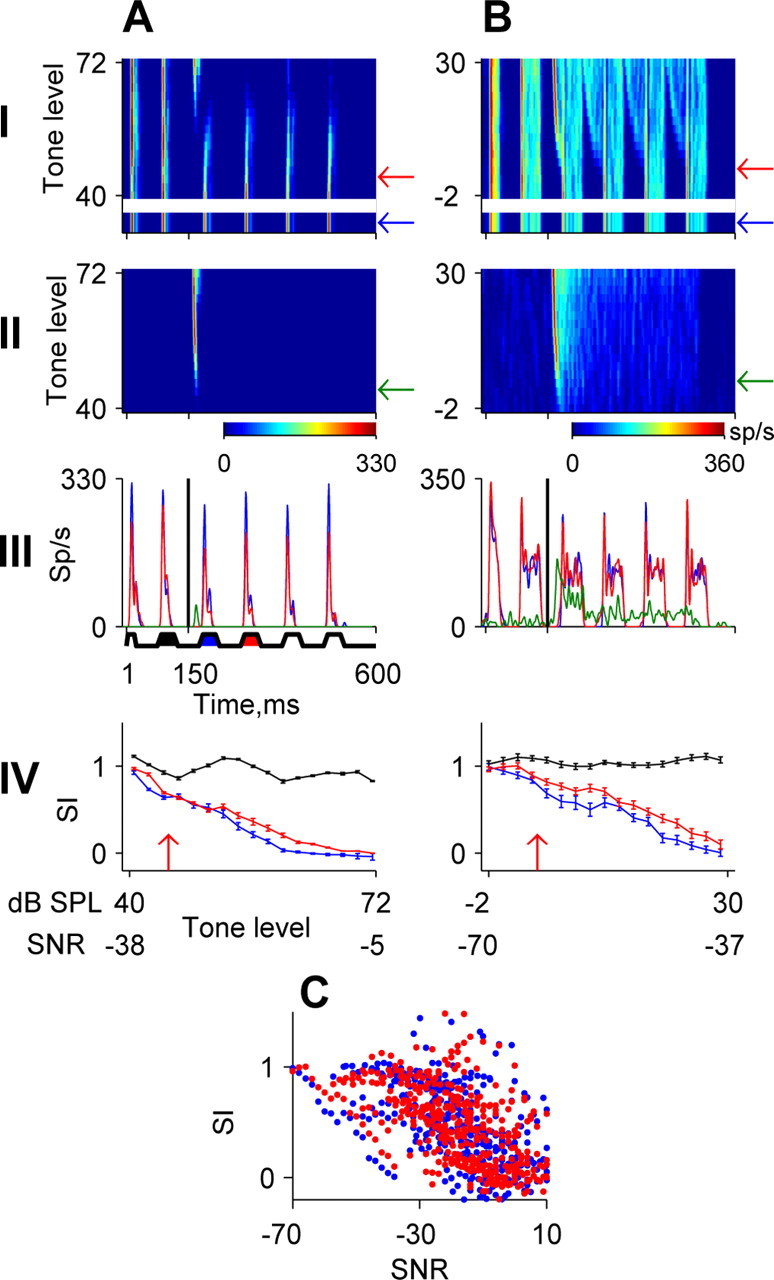
Locking suppression of spiking responses in IC. The same layout as in Figure 5, A and B, is used. Responses of two IC neurons are shown. C, Population analysis of SIs; data are from 29 neurons.
Locking suppression can be achieved by weakening the responses to the noise during the on periods of the noise cycles or by filling in the gaps between noise cycles by responses to the tone. Neurons with locking suppression starting at first NC in IC (n = 29) and MGB (n = 19) showed both behaviors. In neurons with mostly phasic responses (IC, 14 of 29; MGB, 10 of 19), the locking suppression by low-level tone was a result of the weakening of the onset responses to the noise cycles (Figs. 9B, 10A). In neurons with tonic responses (IC, 15 of 29; MGB, 9 of 19), the addition of low-level tones had little effect on the noise responses but produced weak activity in the valleys between the NCs (Fig. 10B), similar to the responses described in the cochlear nucleus (Pressnitzer et al., 2001) to similar stimuli. This type of response was not found in the A1 neurons described here.
Population analysis
Figure 11 summarizes the changes in population responses along the ascending auditory system. To easily compare masking thresholds of different neurons, tone levels, with and without noise, were expressed as signal-to-noise ratios relative to the energy of the specific masker used for each neuron (see Materials and Methods). Figure 11A plots the minimal SNR at which a reduction in the similarity index was detected for the first NC (crosses) and second NC (dots) after tone onset, as a function of tone threshold in silence. In almost all A1, MGB, and IC neurons, significant reductions in the similarity index of the first NC after tone onset occurred only at or above tone threshold in silence (crosses). The average minimal SNRs at which the tones affected the responses to the first NC were similar in the three stations (-18 dB, -22 dB, and -18 dB for A1, MGB, and IC, respectively). However, the range of SNRs inducing suppression at the second NC after tone onset was different in A1, MGB, and IC. The great majority of A1 and A1-like neurons in MGB showed locking suppression of the second NC already with tone levels at or below tone threshold in silence. In fact, in many A1 and MGB neurons, the suppression threshold was not reached because the envelope locking was suppressed already at the lowest level tested (Fig. 11A, black circles). The average SNRs at which the suppression of the second NC started was significantly lower in A1 and MGB (-47 and -33 dB, respectively) than in IC (-18 dB; one-way ANOVA; F(2,74) = 11.5; p < 0.05; post hoc comparisons using Tukey's HSD criterion; p < 0.05). However, the most sensitive neuron in IC, which was a tonic neuron (Fig. 10B), showed tone effects at SNRs as low as those tested in MGB and A1. This neuron was from the central nucleus of the IC.
Figure 11.

Comparisons between responses in IC, MGB, and A1. A, Tone thresholds in silence (in SNR relative to the masker energy used for the same neuron) as a function of the suppression threshold, defined as the minimal SNR at which suppression of the first (crosses) and second (dots) NCs after tone onset was observed. Dots above the diagonal correspond to suppression thresholds below tone thresholds in silence. Black circles depict neurons in which the lowest tone level tested suppressed their envelope locking. B, Mean SI as a function of SNR for the first (black) and second (gray) NCs in the three auditory stations.
The mean similarity indices for the first (black) and second (gray) NCs after tone onset are displayed as a function of SNR in Figure 11B. At the lowest SNRs, the representation of the tone in the IC is weak, as evidenced by the large and approximately comparable similarity indices with the first and second NCs. In contrast, at the same SNRs, the representation of the tone in A1 is strong, as evidenced by the hypersensitive locking suppression at the second NC. MGB is intermediate between the IC and A1.
Discussion
We describe here the evolution of the responses to low-level tones masked by strong fluctuating noise in three auditory stations: IC, MGB, and A1. Our study demonstrates a clear change in the effects of low-level tones on the responses to strong fluctuating maskers, suggesting a change in the character of the representation of tone in noise.
Locking suppression by low-level tones
The main result of this study is the demonstration of a specific type of locking suppression, namely hypersensitive locking suppression, with suppression occurring at tone level below tone threshold in silence. Although we did not find any IC neuron with suppression threshold below tone threshold in silence, some MGB neurons and most A1 neurons displayed hypersensitive locking suppression.
Hypersensitive locking suppression was shown here to have a special timing structure, starting one noise cycle after tone onset resulting in a minimum delay of 75 ms. This delay is long relative to the latency of these neurons (which may be 10-20 ms), suggesting that a significant amount of processing occurs before suppression starts. An interesting question is whether the delay is given in terms of absolute time, or whether it is a delay of one noise cycle, and would be reduced had we used faster envelopes. Answering this question will require additional experiments.
Our results show that each of the stations in the IC-MGB-A1 axis contains neurons that signal the presence of a low-level tone in the fluctuating noise. The most sensitive IC neuron responded to low-level tones by filling in the gaps between noise cycles with weak activity. In contrast, in many MGB and A1 neurons, the addition of a low-level tone caused a dramatic change in the temporal pattern of the responses, the almost complete disruption of their locking to the noise envelope. The contrast between the response to the noise alone and the response to noise plus tone reflects the potency of the response for signaling the presence of the tone. This contrast is much stronger in the locking suppression pattern encountered in MGB and A1 than in the one encountered in IC.
Locking suppression by low-level tones can occur only when the neuron exhibits envelope locking to the noise when presented alone. The number of neurons displaying envelope locking was highest in the IC (69% as measured extracellularly) followed by MGB (56% as measured extracellularly) and then by A1 (55% in their membrane potential responses, although only 25% showed envelope-locked spiking responses), as expected from the increasing sluggishness of the spiking responses in the ascending auditory system (Miller et al., 2002; Joris et al., 2004). Interestingly, although MGB and A1 exhibited lower proportion of neurons with envelope locking, those neurons that did show envelope locking were often more sensitive to the addition of low-level tones. For example, the proportion of envelope-locked neurons that showed significant changes in their responses resulting from the tone addition at SNR lower than -35 dB increased from IC (7%) to MGB (49%) and to A1 (72%).
Together, we suggest that although the detection of the tone could occur in IC, or even lower (Pressnitzer et al., 2001; Neuert et al., 2004), the tone representation is more explicit in MGB and even more so in A1.
Mechanisms of hypersensitive locking suppression
The hypersensitive locking suppression of envelope locking as expressed in MGB and A1, with its long delay, is hard to account with feedforward models. For example, a highly successful model of A1 neurons (Fishbach et al., 2001, 2003), based on computing the temporal derivative of the logarithmically compressed envelope, predicts the suppression of envelope locking by low-level tones, but this suppression starts already at the first noise cycle after tone onset (data not shown). A recent study of recurrent networks with activity-dependent synaptic depression (Tsodyks et al., 2000; Loebel and Tsodyks, 2002) has shown that such networks can mimic locking suppression as shown here in MGB and A1. Depressing synapses, if they are indeed involved in the suppression, could reside in MGB rather than in A1, because the hypersensitive suppression is already present in MGB. However, the long delay to suppression could also implicate the strong corticothalamic feedback loop, especially if we consider that the MGB and A1 are known to be strongly connected to each other (Bajo et al., 1995; Suga et al., 2000; Miller et al., 2001; Winer et al., 2001; He, 2003).
Locking suppression and comodulation masking release
We suggested previously that suppression of envelope locking is compatible with the properties of CMR (Nelken et al., 1999). Indeed, in previous studies, we have shown that neurons in A1 lock better to the envelopes of wide noise bands than to the envelopes of narrow noise bands (Nelken et al., 1999). Therefore, the hypersensitive suppression results in a greater contrast between the responses to noise alone and the tone plus noise in wideband fluctuating maskers than in narrowband maskers.
Recently, studies of masking by fluctuating maskers in the CN of guinea pigs have shown that many neurons responded to the addition of low-level tones by filling in the gaps between the responses to the noise cycles (Pressnitzer et al., 2001; Neuert et al., 2004). Our findings in IC are similar: some IC neurons responded to tones in fluctuating maskers by filling the gaps between the responses to the noise cycles. Thus, the presence of low-level tones in wideband fluctuating maskers can be detected already in CN and IC. In both stations, it seems that the most sensitive population is small, and the effect of the addition of low-level tones on their responses is weak, although significant.
Langemann and Klump (2001) and Nieder and Klump (2001) studied CMR in the homolog of primary auditory cortex in birds, field L2. Neurons in L2 exhibited responses to low-level tones in fluctuating maskers starting immediately after tone onset, with tone levels that are at or above tone threshold in silence (Langemann and Klump, 2001), similar to neurons in cat CN and IC. Two additional properties of L2 neurons suggest that they resemble cat IC neurons rather than A1 neurons: they showed envelope locking to amplitude modulation at higher frequencies than A1 neurons (Knipschild et al., 1992) and they were not sensitive to stimulus components outside their critical bandwidth (Nieder and Klump, 2001), in contrast to neurons in cat A1 (Bar-Yosef et al., 2002). Thus, it seems that the representation of tone in fluctuating noise in L2 is similar to its representation in cat IC rather than to cat A1. The hypersensitive suppression demonstrated here in cat MGB and A1 could be present in higher areas of the bird brain. More interestingly, it could represent a mammalian specialization.
Tone representation along the auditory pathway
The representation of the physical structure of simple sounds is degraded along the IC-MGB-A1 axis, with an increasing tuning curve width, more sluggish temporal responses (Miller et al., 2002; Joris et al., 2004), and an increasing lability (Ulanovsky et al., 2003). Moreover, recent studies suggest that A1 neurons process many kinds of stimuli by integrating their spectrotemporal content in a mostly linear manner (Kowalski et al., 1996; deCharms et al., 1998; Schnupp et al., 2001).
In contrast, the construction of a powerful representation of low-level tones masked by high-level fluctuating noise by the hypersensitive suppression is an example of a feature for which representation is greatly enhanced in the ascending auditory system. Furthermore, the hypersensitive suppression is inherently inconsistent with linear processing of a spectrotemporal stimulus representation (Machens et al., 2004). A similar dominance of low-level acoustic components in the presence of much stronger components has also been shown by Bar-Yosef et al. (2002). In that case, the low-level sound was wideband, whereas the highlevel sound was tonal (a bird chirp). Nonlinearity probably plays an important role also in the results of the study by Bar-Yosef et al. (2002). Thus, it seems that strong nonlinearities participate in enhancing the sensitivity of A1 neurons to low-level signal components in natural and naturalistic settings.
The enhancement of the representation of a low-level tone in slowly fluctuating noise demonstrated here could be a correlate of the formation of an auditory object (the tone) as a separate entity from the background noise. We hypothesize that in IC, signal representation is still primarily of the physical attributes of the sound. Such representation is comparable with the representation of the visual scene in V1 in terms of edge orientation, spatial frequency, and binocular disparity (Wurtz and Kandel, 2000). In contrast, the nonlinear interactions between stimulus components in MGB and A1 result in a more abstract representation of sounds in terms of auditory objects, a stage reached in the visual system only in higher cortical areas.
Footnotes
This work was supported by grants from the Israeli Science Foundation and the Human Frontiers Science Program. We thank J. Chin and S. T. Kajdasz for technical assistance and N. Ulanovsky, R. Paz, and G. Morris for critical comments. We thank M. J. Anderson, A. Fishbach, and E. D. Young (Johns Hopkins University, Baltimore, MD) for some of the IC data.
Correspondence should be addressed to Israel Nelken, Department of Neurobiology, Hebrew University, Jerusalem 91904, Israel. E-mail: israel@md.huji.ac.il.
Copyright © 2005 Society for Neuroscience 0270-6474/05/251503-11$15.00/0
L.L. and E.A.S. contributed equally to this work.
References
- Azouz R, Gray CM (1999) Cellular mechanisms contributing to response variability of cortical neurons in vivo J Neurosci 19: 2209-2223. [DOI] [PMC free article] [PubMed] [Google Scholar]
- Bajo VM, Rouiller EM, Welker E, Clarke S, Villa AE, de Ribaupierre Y, de Ribaupierre F (1995) Morphology and spatial distribution of corticothalamic terminals originating from the cat auditory cortex. Hear Res 83: 161-174. [DOI] [PubMed] [Google Scholar]
- Bar-Yosef O, Rotman Y, Nelken I (2002) Responses of neurons in cat primary auditory cortex to bird chirps: effects of temporal and spectral context. J Neurosci 22: 8619-8632. [DOI] [PMC free article] [PubMed] [Google Scholar]
- Borg-Graham LJ, Monier C, Fregnac Y (1998) Visual input evokes transient and strong shunting inhibition in visual cortical neurons. Nature 393: 369-373. [DOI] [PubMed] [Google Scholar]
- Bringuier V, Chavane F, Glaeser L, Fregnac Y (1999) Horizontal propagation of visual activity in the synaptic integration field of area 17 neurons. Science 283: 695-699. [DOI] [PubMed] [Google Scholar]
- Brugge JF (1992) An overview of central auditory processing. In: The mammalian auditory pathway: neurophysiology (Popper AN, Fay RR, eds), pp 1-33. New York: Springer.
- Casseday JH, Fremouw T, Covey E (2001) The inferior colliculus: a hub for the central auditory system. In: Integrative functions in the mammalian auditory pathway (Oertel D, Fay RR, Popper AP, eds), pp 238-318. New York: Springer.
- Cowan RL, Wilson CJ (1994) Spontaneous firing patterns and axonal projections of single corticostriatal neurons in the rat medial agranular cortex. J Neurophysiol 71: 17-32. [DOI] [PubMed] [Google Scholar]
- deCharms RC, Blake DT, Merzenich MM (1998) Optimizing sound features for cortical neurons. Science 280: 1439-1443. [DOI] [PubMed] [Google Scholar]
- De Ribaupierre F, Goldstein Jr MH, Yeni-Komshian G (1972) Intracellular study of the cat's primary auditory cortex. Brain Res 48: 185-204. [DOI] [PubMed] [Google Scholar]
- Deweese MR, Zador AM (2004) Shared and private variability in the auditory cortex. J Neurophysiol 92: 1840-1855. [DOI] [PubMed] [Google Scholar]
- DeWeese MR, Wehr M, Zador AM (2003) Binary spiking in auditory cortex. J Neurosci 23: 7940-7949. [DOI] [PMC free article] [PubMed] [Google Scholar]
- Fishbach A, Nelken I, Yeshurun Y (2001) Auditory edge detection: a neural model for physiological and psychoacoustical responses to amplitude transients. J Neurophysiol 85: 2303-2323. [DOI] [PubMed] [Google Scholar]
- Fishbach A, Yeshurun Y, Nelken I (2003) Neural model for physiological responses to frequency and amplitude transitions uncovers topographical order in the auditory cortex. J Neurophysiol 90: 3663-3678. [DOI] [PubMed] [Google Scholar]
- Fregnac Y, Monier C, Chavane F, Baudot P, Graham L (2003) Shunting inhibition, a silent step in visual cortical computation. J Physiol (Paris) 97: 441-451. [DOI] [PubMed] [Google Scholar]
- Hall JW, Haggard MP, Fernandes MA (1984) Detection in noise by spectrotemporal pattern analysis. J Acoust Soc Am 76: 50-56. [DOI] [PubMed] [Google Scholar]
- He J (2003) Corticofugal modulation on both ON and OFF responses in the nonlemniscal auditory thalamus of the guinea pig. J Neurophysiol 89: 367-381. [DOI] [PubMed] [Google Scholar]
- Joris PX, Schreiner CE, Rees A (2004) Neural processing of amplitudemodulated sounds. Physiol Rev 84: 541-577. [DOI] [PubMed] [Google Scholar]
- Klump GM, Langemann U (1995) Comodulation masking release in a songbird. Hear Res 87: 157-164. [DOI] [PubMed] [Google Scholar]
- Knipschild M, Dorrscheidt GJ, Rubsamen R (1992) Setting complex tasks to single units in the avian auditory forebrain. I. Processing of complex artificial stimuli. Hear Res 57: 216-230. [DOI] [PubMed] [Google Scholar]
- Kowalski N, Depireux DA, Shamma SA (1996) Analysis of dynamic spectra in ferret primary auditory cortex. I. Characteristics of single-unit responses to moving ripple spectra. J Neurophysiol 76: 3503-3523. [DOI] [PubMed] [Google Scholar]
- Langemann U, Klump GM (2001) Signal detection in amplitudemodulated maskers. I. Behavioural auditory thresholds in a songbird. Eur J Neurosci 13: 1025-1032. [DOI] [PubMed] [Google Scholar]
- Loebel A, Tsodyks M (2002) Computation by ensemble synchronization in recurrent networks with synaptic depression. J Comput Neurosci 13: 111-124. [DOI] [PubMed] [Google Scholar]
- Machens CK, Wehr MS, Zador AM (2004) Linearity of cortical receptive fields measured with natural sounds. J Neurosci 24: 1089-1100. [DOI] [PMC free article] [PubMed] [Google Scholar]
- Miller LM, Escabi MA, Read HL, Schreiner CE (2001) Functional convergence of response properties in the auditory thalamocortical system. Neuron 32: 151-160. [DOI] [PubMed] [Google Scholar]
- Miller LM, Escabi MA, Read HL, Schreiner CE (2002) Spectrotemporal receptive fields in the lemniscal auditory thalamus and cortex. J Neurophysiol 87: 516-527. [DOI] [PubMed] [Google Scholar]
- Monier C, Chavane F, Baudot P, Graham LJ, Fregnac Y (2003) Orientation and direction selectivity of synaptic inputs in visual cortical neurons: a diversity of combinations produces spike tuning. Neuron 37: 663-680. [DOI] [PubMed] [Google Scholar]
- Nelken I, Rotman Y, Bar Yosef O (1999) Responses of auditory-cortex neurons to structural features of natural sounds. Nature 397: 154-157. [DOI] [PubMed] [Google Scholar]
- Neuert V, Verhey JL, Winter IM (2004) Responses of dorsal cochlear nucleus neurons to signals in the presence of modulated maskers. J Neurosci 24: 5789-5797. [DOI] [PMC free article] [PubMed] [Google Scholar]
- Nieder A, Klump GM (2001) Signal detection in amplitude-modulated maskers. II. Processing in the songbird's auditory forebrain. Eur J Neurosci 13: 1033-1044. [DOI] [PubMed] [Google Scholar]
- Phillips DP, Cynader MS (1985) Some neural mechanisms in the cat's auditory cortex underlying sensitivity to combined tone and wide-spectrum noise stimuli. Hear Res 18: 87-102. [DOI] [PubMed] [Google Scholar]
- Pressnitzer D, Meddis R, Delahaye R, Winter IM (2001) Physiological correlates of comodulation masking release in the mammalian ventral cochlear nucleus. J Neurosci 21: 6377-6386. [DOI] [PMC free article] [PubMed] [Google Scholar]
- Ramachandran R, Davis KA, May BJ (2000) Rate representation of tones in noise in the inferior colliculus of decerebrate cats. J Assoc Res Otolaryngol 1: 144-160. [DOI] [PMC free article] [PubMed] [Google Scholar]
- Schnupp JW, Mrsic-Flogel TD, King AJ (2001) Linear processing of spatial cues in primary auditory cortex. Nature 414: 200-204. [DOI] [PubMed] [Google Scholar]
- Schooneveldt GP, Moore BC (1989) Comodulation masking release (CMR) as a function of masker bandwidth, modulator bandwidth, and signal duration. J Acoust Soc Am 85: 273-281. [DOI] [PubMed] [Google Scholar]
- Steriade M, Contreras D (1996) Mechanisms of long-lasting hyperpolarizations underlying slow sleep oscillations in cat corticothalamic networks. J Physiol (Lond) 490: 159-179. [DOI] [PMC free article] [PubMed] [Google Scholar]
- Steriade M, Nunez A, Amzica F (1993) A novel slow (<1 Hz) oscillation of neocortical neurons in vivo: depolarizing and hyperpolarizing components. J Neurosci 13: 3252-3265. [DOI] [PMC free article] [PubMed] [Google Scholar]
- Stern EA, Kincaid AE, Wilson CJ (1997) Spontaneous subthreshold membrane potential fluctuations and action potential variability of rat corticostriatal and striatal neurons in vivo J Neurophysiol 77: 1697-1715. [DOI] [PubMed] [Google Scholar]
- Suga N, Gao E, Zhang Y, Ma X, Olsen JF (2000) The corticofugal system for hearing: recent progress. Proc Natl Acad Sci USA 97: 11807-11814. [DOI] [PMC free article] [PubMed] [Google Scholar]
- Tsodyks M, Uziel A, Markram H (2000) Synchrony generation in recurrent networks with frequency-dependent synapses. J Neurosci 20: RC50(1-5). [DOI] [PMC free article] [PubMed] [Google Scholar]
- Ulanovsky N, Las L, Nelken I (2003) Processing of low-probability sounds by cortical neurons. Nat Neurosci 6: 391-398. [DOI] [PubMed] [Google Scholar]
- Verhey JL, Pressnitzer D, Winter IM (2003) The psychophysics and physiology of comodulation masking release. Exp Brain Res 153: 405-417. [DOI] [PubMed] [Google Scholar]
- Wehr M, Zador AM (2003) Balanced inhibition underlies tuning and sharpens spike timing in auditory cortex. Nature 426: 442-446. [DOI] [PubMed] [Google Scholar]
- Winer JA, Diehl JJ, Larue DT (2001) Projections of auditory cortex to the medial geniculate body of the cat. J Comp Neurol 430: 27-55. [PubMed] [Google Scholar]
- Wurtz RH, Kandel ER (2000) Central visual pathways. In: Principles of neural science, Ed 4 (Kandel ER, Schwartz JH, Jessell TM, eds), pp 523-548. New York: McGraw-Hill.
- Zhang LI, Tan AY, Schreiner CE, Merzenich MM (2003) Topography and synaptic shaping of direction selectivity in primary auditory cortex. Nature 424: 201-205. [DOI] [PubMed] [Google Scholar]