

Abstract
Down's syndrome (DS) is characterized by mental retardation and development of Alzheimer's disease (AD). Oxidative stress and mitochondrial dysfunction are both related to neurodegeneration in DS. Several genes in chromosome 21 have been linked to neuronal death, including the transcription factor ets-2. Cortical cultures derived from normal and DS fetal brains were used to study the role of ets-2 in DS neuronal degeneration. ets-2 was expressed in normal human cortical neurons (HCNs) and was markedly upregulated by oxidative stress. When overexpressed in normal HCNs, ets-2 induced a stereotyped sequence of apoptotic changes leading to neuronal death. DS HCNs exhibit intracellular oxidative stress and increased apoptosis after the first week in culture (Busciglio and Yankner, 1995). ets-2 levels were increased in DS HCNs, and, between 7 and 14 d in vitro, DS HCNs showed increased bax, cytoplasmic translocation of cytochrome c and apoptosis inducing factor, and active caspases 3 and 7, consistent with activation of an apoptotic mitochondrial death pathway. Degeneration of DS neurons was reduced by dominant-negative ets-2, suggesting that increased ets-2 expression promotes DS neuronal apoptosis. In the human brain, ets-2 expression was found in neurons and astrocytes. Strong ets-2 immunoreactivity was observed in DS/AD and sporadic AD brains associated with degenerative markers such as bax, intracellular Aβ, and hyperphosphorylated tau. Thus, in DS/AD and sporadic AD brains, converging pathological mechanisms leading to chronic oxidative stress and ets-2 upregulation in susceptible neurons may result in increased vulnerability by promoting the activation of a mitochondrial-dependent proapoptotic pathway of cell death.
Keywords: Down's syndrome, Alzheimer's disease, oxidative stress, apoptosis, mitochondria, ets-2
Introduction
Down's syndrome (DS) or trisomy 21 is the most common autosomal aneuploidy that survives birth and the single most frequent genetic cause of mental retardation. The neuropathology of DS is complex and includes development of Alzheimer's disease (AD) by middle age (Coyle et al., 1986; Mann, 1988; Lott and Head, 2001). Altered free radical metabolism and impaired mitochondrial function are linked to neuronal degeneration of DS cortical neurons in culture (Busciglio and Yankner, 1995; Busciglio et al., 2002) and may be associated with both mental retardation and AD pathology in DS patients. Overexpression of several genes localized in chromosome 21 has been linked to neuronal death, including amyloid β precursor protein (APP) (Busciglio et al., 2002), Cu/Zn superoxide dismutase (SOD1) (Bar-Peled et al., 1996; de Haan et al., 1996), and the transcription factor ets-2 (Wolvetang et al., 2003a). The ets family of transcription factors is involved in multiple cellular processes, including differentiation, maturation, and activation of signaling cascades (Macleod et al., 1992; Wasylyk et al., 1993). In mammals, ets-2 is ubiquitously expressed in various tissues during development and adulthood (Bhat et al., 1987; Kola et al., 1993). Previous work on a transgenic mouse model indicates that overexpression of ets-2 may recapitulate several features of DS pathology (Sumarsono et al., 1996). Moreover, increased levels of ets-2 predispose to apoptosis via a p53-dependent pathway (Wolvetang et al., 2003a), and neuronal cultures derived from ets-2 transgenic mice exhibit caspase activation (Wolvetang et al., 2003b). Both ets-2 and p53 expression are upregulated in DS fibroblast and cortical cultures (Wolvetang et al., 2003a), suggesting that DS cells may be more sensitive to proapoptotic stimuli than normal (NL) cells. Induction of apoptosis by p53 is usually achieved through a mitochondrial death pathway, which includes upregulation and activation of several proapoptotic factors such as bax, Apaf-1, and PERP and transcriptional inhibition of anti-apoptotic components including Bcl-2 and IAPs (Johnstone et al., 2002). Because mitochondrial dysfunction and increased apoptosis may be relevant features of DS neuropathology, we investigated the involvement of ets-2 and the mitochondrial apoptotic pathway in DS neuronal death. The results indicate that ets-2 promotes degeneration of DS cortical neurons in culture by activation of a mitochondrial death pathway. In DS/AD and sporadic AD brains, strong ets-2 expression was associated with bax, intracellular Aβ, and hyperphosphorylated tau, suggesting that upregulation of ets-2 in susceptible neurons may result in increased neuronal vulnerability and degeneration.
Materials and Methods
Neuronal cultures. Normal and DS human cortical neuron (HCN) cultures were prepared as described previously (Busciglio et al., 2002; Pelsman et al., 2003). The protocol for tissue procurement complied with federal and institutional guidelines. Briefly, cells were plated on culture dishes or glass coverslips at a density of 100,000 cells/cm2 and maintained in serum-free DMEM supplemented with N2 and B27 supplements (Invitrogen, Grand Island, NY).
Antibodies. The following antibodies were used: rabbit anti-ets-2 (Santa Cruz Biotechnology, Santa Cruz, CA); mouse monoclonal anti-Aβ42, which specifically recognize the C terminus of Aβx-42 (Busciglio et al., 2002); mouse anti-β-tubulin isotype III (Sigma, St. Louis, MO); mouse anti-p53 (Sigma); mouse monoclonal anti-cytochrome c (BD Transduction Laboratories, San Diego, CA); mouse anti-phosphorylated tau (PHF-1); mouse anti-bax (Santa Cruz Biotechnology), rabbit anti-AIF (Chemicon, Temecula, CA); rabbit anti-activated caspase 3 (CM1; PharMingen, San Diego, CA); rabbit anti-activated caspase 7 (Cell Signaling Technology, Beverly, MA); mouse anti-neurofilaments (Sigma); and mouse anti-GFAP (Sigma).
Western blot analysis. For Western blot analysis, cultures were washed with PBS and harvested in radioimmunoprecipitation assay buffer plus protease inhibitors (Complete; Roche Bioscience, Palo Alto, CA) at 4°C. Lysates were centrifuged at 100,000 × g for 30 min. Protein concentration was determined using a commercial kit (Bio-Rad, Hercules, CA). Samples were electrotransferred to polyvinylidene difluoride membranes (PVDF) (Bio-Rad), blocked, and incubated overnight at 4°C with primary antibody and developed by enhanced chemiluminescence (Amersham Biosciences, Piscataway, NJ). In all experiments, the tubulin level was used as control for protein loading (anti-tubulin; clone DM1A; Sigma). ets-2, p53, and bax antibody specificity were confirmed by preabsorption of the primary antibodies with synthetic peptide, which abolished immunoreactivity. Quantitative Western blot analysis was performed as described previously (Pigino et al., 2001, 2003).
Immunofluorescence and image analysis. Cultured cells were fixed for 30 min at 37°C in 4% paraformaldehyde and 0.12 m sucrose in PBS and permeabilized with 0.2% Triton X-100 in PBS. Double immunofluorescence was performed as described previously using Alexa-conjugated secondary antibodies (Molecular Probes, Eugene, OR) (Busciglio et al., 2002).
Brain tissue samples for immunohistology were obtained from the Institute for Brain Aging and Dementia Tissue Repositories at the University of California, Irvine; the University of Miami Brain and Tissue Bank for Developmental Disorders through National Institute of Child Health and Human Development contract NO1-HD-8-3284; and the Harvard Brain and Tissue Resource Center, McLean Hospital, and Massachusetts General Hospital. Brain tissue from the parietal cortex, entorhinal cortex, and hippocampus of five neuropathologically confirmed DS/AD cases and six age-matched controls were included in this study. Mean age at the time of death was not significantly different between DS/AD (mean, 53.40 ± 7.20 SD) and controls (mean, 64.33 ± 12.08 SD). In addition, four different specimens of sporadic AD were analyzed (mean age, 72.7 ± 6.60 SD). Tissue sections were processed for immunofluorescence as described previously (Head et al., 2002). Competition with antigenic peptide, use of nonimmune IgG instead of primary antibody, or omission of primary antibody resulted in complete elimination of specific labeling. An Axiovert 200 inverted microscope (Zeiss, Jena, Germany) was used for specimen examination and imaging. Fluorescent images were captured with a digital camera (Zeiss) and processed using AxioVision (Zeiss). Fluorescent intensity measurements in tissue sections processed in parallel were performed using NIH Image software. To quantify the frequency of colocalization of fluorescent signals, at least 20 fields per section of each individual case were captured at a final magnification of 630× and analyzed using AxioVision software. For some experiments, z-stacks of images were captured, processed, and rendered using the Apotome imaging system (Zeiss).
Treatment with H2O2. Treatment with H2O2 (Sigma) was performed as described previously (Pelsman et al., 2003). Briefly, a fresh stock of 1 mm H2O2 was prepared in DMEM before each experiment. At day 7 in culture, H2O2 was added to the culture medium of HCN at 50 μm final concentration. After 1 h, the cultures were washed with fresh medium and maintained for an additional 2 and 4 h before harvesting. After this period, the cultures were processed for analysis.
Transfection. Full-length ets-2 (Wolvetang et al., 2003a) and a dominant-negative ets-2 construct (DN) were cloned into pcDNA3 (Invitrogen). The DN expression vector contains the human ets-2 sequence encoding amino acids 280-476. This construct lacks the transactivation domain but conserves the DNA binding domain, competing with the wild-type protein for the same recognition sites (Chumakov et al., 1993). Both constructs were confirmed by sequencing. Green fluorescent protein (GFP), p53 wild-type, and p53 dominant-negative (m135) expression vectors were obtained from Clontech (Palo Alto, CA). For most experiments, HCNs were transfected at 7 d in culture. Cultures were incubated for 4 h with Lipofectamine (Invitrogen) and DNA (1 μg of DNA plus 1 μl of Lipofectamine per 500 μl of medium). Cultures were cotransfected with different vectors (GFP/ets-2, GFP/DN, ets-2/DN, ets-2/m135, and p53/m135). The efficiency of transfection was ∼20-30%, and the efficiency of cotransfection was previously established as ∼95% (Pigino et al., 2001). Cultures were transfected in 24-well plates in quadruplicate wells, fixed, and analyzed 24 h after transfection. No changes in cell viability were observed in neurons transfected with empty vector or GFP expression vector.
Viability assay. Neuronal viability was evaluated using a propidium iodide (PI) (Molecular Probes) exclusion assay as described previously (Busciglio and Yankner, 1995; Busciglio et al., 2002; Grace et al., 2002). The number of viable neurons (defined as neurons displaying GFP-positive cell bodies and propidium-negative nuclei) in ets-2-, DN-, p53-, or m135-transfected neurons was expressed as a percentage of the number of viable neurons transfected with GFP alone in control cultures. More than 200 cells were analyzed per experimental condition in each individual experiment.
Statistical analysis. All experiments were repeated at least three times using different brain specimens or cultures derived from at least three different embryos. Each individual experiment was performed in quadruplicate and scored by a blinded observer. Data were analyzed by Student's t test or ANOVA followed by Student-Newman-Keuls post hoc test. Data were expressed as mean ± SEM, and significance was assessed at p < 0.05.
Results
Analysis of ets-2 expression in normal and DS HCN
The first set of experiments was directed to analyze and characterize the pattern of expression of ets-2 in HCNs. Immunocytochemical analysis showed expression of ets-2 in HCN cultures derived from both NL and DS fetal brains (Fig. 1A,B). Expression of ets-2 was also observed in astrocytes (data not shown). Western blot analysis of NL neuronal cultures revealed a progressive increase in ets-2 protein levels during neuronal development in vitro (Fig. 1C), suggesting that ets-2 activity may play a role in neuronal development and/or maturation. Consistent with this result, significant ets-2 expression was detected in fetal human cortex (Fig. 1D). Quantitative analysis revealed that ets-2 level in DS HCNs was increased more than twofold compared with normal HCN (225 ± 37% SEM), which is significantly higher than predicted by gene dosage (Fig. 1D,E). Previous experiments have shown that ets-2 expression is upregulated by oxidative stress in fibroblast cell lines (Sanij et al., 2001). Because DS cortical neurons exhibit increased levels of reactive oxygen species in culture (Busciglio and Yankner, 1995), we explored whether ets-2 expression could be modulated by oxidative stress in human neurons. HCNs were treated with H2O2 (50 μm) for 1 h. This concentration of H2O2 was chosen because it does not affect neuronal viability during the first 4-6 h of treatment. After 24 h, it induces moderate cell death, similar to what is observed in DS HCNs undergoing degeneration in culture (Pelsman et al., 2003). Hydrogen peroxide treatment induced a significant increase in ets-2, which was evident after 2 and 4 h (Fig. 1F). Thus, oxidative stress upregulates ets-2 expression in cultured HCN and, together with gene dosage, may contribute to elevated ets-2 levels in DS neurons.
Figure 1.

Ets-2 expression is elevated in DS cortical neurons and can be upregulated by oxidative stress in normal neurons. A, B, ets-2 immunofluorescence (anti-ets-2, 1:500) in NL and DS cortical neurons fixed at 5 DIV. Scale bar, 20 μm. C, Western blot analysis shows a gradual increase in ets-2 levels during development of HCN in culture. DIV, Days in vitro. D, ets-2 expression in cultures generated from two different DS (17 and 18 weeks of gestational age) and two normal (17 and 18 weeks of gestational age) specimens, respectively. Expression of ets-2 in fetal human cortex (Ctx) is shown. ets-2-transfected COS cells (Cos) were used as positive control for antibody specificity. Specific labeling was completely abolished by preabsorption of the primary antibody with antigenic peptide (preab). The same samples (normal and DS) probed with an antibody against β-tubulin showed no significant differences in β-tubulin content. Normal and DS cultures at 3 DIV were homogenized, subjected to SDS-PAGE, and blotted onto a PVDF membrane. The blots were revealed with anti-ets-2 (1:1000) and a monoclonal against neuronal β-tubulin class III (1:2000). A total of 20 μg of protein was loaded per lane. E, The histogram shows ets-2 levels at 3 DIV in NL (standardized as 100%) and DS cultures. Four DS and four normal specimens were included in the analysis. Quantitative Western blots were performed as described in Materials and Methods. Values are expressed as mean ± SEM by unpaired Student's t test. *p < 0.02. F, Induction of ets-2 expression in normal HCN by treatment with H2O2. HCNs were treated at 7 DIV with 50 μm H2O2 for 1 h. Then, H2O2 was removed, and the cultures were incubated for an additional 0, 2, and 4 h, respectively. No significant impairment of neuronal viability was observed. Treatment with H2O2 did not change tubulin levels. A total of 20 μg of protein was loaded per lane.
Overexpression of ets-2 induces cytochrome c cytoplasmic translocation and apoptotic features in HCNs
Previous results using an ets-2 transgenic mouse model show that ets-2 overexpression induces apoptosis of thymus, spleen, and brain cells (Wolvetang et al., 2003a,b). To establish the effect of ets-2 increased expression in HCNs, cultures were cotransfected with ets-2 and GFP expression vectors at 7 d. During the following 24 h after transfection, ets-2-expressing neurons progressed through a stereotyped sequence of degenerative changes that correlated with apoptotic features. Time-lapse microscopy revealed that morphological changes included thinning and beading of neuronal processes, shrinkage of cell bodies, and neuritic fragmentation. Between 6 and 12 h after transfection, most transfected neurons exhibited normal morphology (Fig. 2, row I). After 12 h, morphological changes started to become evident and correlated with the sequential appearance of apoptotic features as follows: (1) the initial alterations in neuritic processes were accompanied by a loss of discrete immunofluorescence and localization of cytochrome c in mitochondria (Fig. 2, row II); (2) shrinkage of cell bodies was associated with nuclear condensation (Fig. 2, row III); and (3) the last stage was characterized by neuritic fragmentation (Fig. 2, row IV) and loss of membrane integrity evidenced by positive PI staining (Fig. 3A). These alterations did not occur synchronically in transfected neurons, probably because of the heterogeneous nature of the neuronal population in cortical cultures. Consequently, at any given time between 12 and 24 h after transfection, neurons at different stages of neurodegeneration were observed. Quantification of cell viability using PI staining revealed that less than half of ets-2-transfected neurons remained viable after 24 h (46 ± 2.7%) (Fig. 3C). In contrast, 24 h after transfection, control neurons expressing GFP did not show degenerative features or reduced viability (Fig. 3C). To confirm the involvement of ets-2 overexpression in neuronal cell death, we generated a dominant-negative ets-2 expression vector lacking the transactivation domain, which has been shown to abrogate ets-2 activity (DN) (Chumakov et al., 1993). Coexpression of DN with ets-2 prevented the appearance of degenerative features and significantly increased neuronal viability to 65 ± 4.5% (Fig. 3B,C). Hence, ets-2 overexpression in HCN induces the progressive appearance of apoptotic features, which can be prevented by coexpression of DN.
Figure 2.

Overexpression of ets-2 in HCNs induces a sequence of degenerative changes leading to neuronal death. Rows I-IV illustrate the sequence of alterations observed in HCNs overexpressing ets-2. Columns show differential interference contrast images (DIC), GFP fluorescence (green; GFP/ets-2), cytochrome c immunofluorescence (1:500; red; cyt-C), Hoechst DNA staining (blue, hoechst), and merged fluorescent channels (merge). Six hours after transfection, most transfected neurons exhibited normal morphology, intact neuritic processes (row I; DIC and GFP+ets-2; arrows and arrowheads), intense fluorescence of mitochondrial cytochrome c in cell bodies and neurites (row I; cyt-C; arrowhead and arrow), and normal nuclear morphology (row I; Hoechst; arrow). Between 12 and 24 h after transfection, initial morphological alterations, including thinning and beading of neurites (row II; DIC and GFP+ets-2; arrowheads), were accompanied by loss of discrete immunofluorescence and localization of cytochrome c in mitochondria (row II; cyt-C; arrow). At this stage, neurons still exhibited normal nuclear morphology (row II; hoechst; arrow). Subsequent changes included shrinkage of cell bodies and accentuated neuritic beading (row III; DIC and GFP/ets-2; arrows and arrowheads) and nuclear condensation (row III; hoechst; arrow). The last stage was characterized by neuritic fragmentation (row IV; DIC and GFP/ets-2; arrowheads) and further nuclear condensation (row IV; Hoechst; arrows). Transfection of GFP alone did not affect neuronal morphology or viability. Scale bar, 20 μm.
Figure 3.

Dominant-negative ets-2 reduces ets-2-induced neuronal degeneration. A, B, GFP/ets-2 transfected HCNs exhibit neuritic fragmentation, loss of cell membrane integrity, and chromatin condensation evidenced by positive PI staining (A, arrow). Coexpression of ets-2 and a dominant-negative ets-2 prevented cell death in HCNs (B). Neurons were visualized by GFP fluorescence. Scale bar, 20 μm. C, P53 mediates ets-2-induced neuronal death in HCNs. Viability assessment of HCN cultures transfected with the indicated vectors. Overexpression of ets-2 and p53 significantly reduced neuronal viability. Cotransfection with dominant-negative ets-2 or p53 (m135) vectors partially prevented ets-2- and p53-mediated neuronal cell death (est-2/DN; ets-2/m135; p53/m135). Primary cortical cultures were transfected at 7 DIV and fixed 24 h later. Before fixation, nonviable cells were labeled with propidium iodide. After fixation, immunofluorescence with anti-ets-2 (1:500) or anti-p53 (1:200) antibodies was performed, and the number of both transfected viable neurons and transfected propidium-positive neurons was scored. The histogram shows the relative number of viable transfected neurons in each condition. All experiments were performed in quadruplicate cultures and replicated at least three times. Values are the mean ± SE; n > 300 transfected neurons per experimental condition. *p < 0.05 relative to GFP transfected cultures (ctrl; 100%) using Student's t test; asterisks indicate a significant difference from ets-2-transfected cultures (**p < 0.05). D, ets-2 overexpression upregulates p53. Westernblot analysis of cultures transfected with GFP, ets-2, and p53 expression vectors is shown. The blot was developed with anti-p53 (1:250). Note the increase in p53 level in ets-2-transfected cells compared with GFP transfected cells. A total of 20 μg of total protein homogenate was loaded per lane.
Previous work indicates that ets-2 mediates cell death through a p53-dependent pathway (Wolvetang et al., 2003b). A palindromic sequence in the promoter of the human p53 gene contains two ets-binding elements, to which ets-2 binds with high affinity to activate p53 transcription (Venanzoni et al., 1996; Sementchenko and Watson, 2000). Consistent with these observations, we found a significant increase in p53 protein level in cultures transfected with ets-2 but not with GFP (Fig. 3D). The role of p53 in ets-2-mediated death in HCNs was further assessed using a p53 dominant-negative expression vector (m135) (Scheffner et al., 1992; Vogelstein and Kinzler, 1992). Cotransfection with m135 reduced significantly both ets-2-induced (Fig. 3C, ets-2/m135) and p53-induced (Fig. 3C, p53/m135) neuronal cell death. These experiments indicate that ets-2 overexpression induces a p53-dependent mitochondrial apoptotic pathway in HCNs.
A mitochondrial death pathway is involved in the degeneration of DS cortical neurons
We have shown previously that DS HCNs exhibit intracellular accumulation of reactive oxygen species, lipid peroxydation, degenerative morphological changes including neuritic retraction and fragmentation, shrinkage of cell bodies, chromatin condensations and positive terminal deoxynucleotidyl transferase-mediated biotinylated UTP nick end labeling staining (Busciglio and Yankner, 1995; Pelsman et al., 2003). During the second week in culture, DS neurons undergo progressive degeneration, and by day 14, only 41 ± 3% of the neurons originally present at day 7 are viable (Busciglio and Yankner, 1995). To further investigate the molecular mechanisms involved in DS neuronal degeneration and their potential relationship with ets-2 overexpression, we analyzed apoptotic effectors of the mitochondrial death pathway downstream of p53 (Johnstone et al., 2002; Danial and Korsmeyer, 2004). p53 can induce apoptosis by transcription-dependent or independent mechanisms. Both pathways involve activation of the proapoptotic factor bax and increased permeability of the inner mitochondrial membrane mediated by the mitochondrial permeability transition pore, leading to mitochondrial release of cytochrome c and apoptosis inducing factor (AIF), and activation of caspases (Mihara et al., 2003; Chipuk et al., 2004). The following experiments were performed at 8 DIV, when DS neurons had already started to exhibit the progression of degenerative features referred above. Quantitative Western blot analysis showed that the level of bax was increased almost twofold in DS compared with normal HCN homogenates (198 ± 28%) (Fig. 4A). Immunofluorescence image analysis revealed that both cytochrome c and AIF showed diffuse cytoplasmic localization in cell bodies and processes of 11 ± 6% of DS neurons devoid of obvious degenerative morphology (Fig. 4B), reminiscent of the initial stage of degeneration of normal HCN overexpressing ets-2 (Fig. 2, row II). In contrast, discrete labeling and restricted mitochondrial localization of cytochrome c and AIF was observed in cell bodies and processes of normal HCN (Fig. 4B). The presence of activated caspase 3 was detected in 9 ± 4% of DS neurons, most of them exhibiting shrinkage of cell bodies and neuritic fragmentation (Fig. 4C), which resembled the degenerative morphology of normal HCNs overexpressing ets-2 (Fig. 2, row III). A similar number of DS HCNs exhibiting activated caspase 7 was detected by immunofluorescence in DS HCN (data not shown). Thus, degenerating DS neurons exhibit features associated with the activation of a mitochondrial death pathway: increased levels of bax and cytoplasmic translocation of cytochrome c and AIF were observed in DS neurons that did not exhibit degenerative morphological changes, whereas the presence of active caspases was associated with the appearance of degenerative morphological features.
Figure 4.

Evidence for the activation of a mitochondrial death pathway in DS neurons. A, Left, The histogram shows the quantification of bax expression in NL (standardized as 100%) and DS cortical cultures at 8 DIV. Four normal and four DS independent cultures were used for the analysis. Values are expressed as mean ± SEM by unpaired Student's t test. *p < 0.05. Right, Representative Western blot showing bax expression in NL and DS neuronal cultures (anti-bax, 1:500). B, Differential interference contrast (DIC) imaging shows neurons with intact morphology in NL and DS cultures at 8 DIV. Double immunofluorescence of normal and DS neurons with anti-cytochrome c (1:500; cyt C) and anti-AIF (1:400; AIF) antibodies show mitochondrial localization of cytochrome c and AIF in cell bodies (NL; arrowheads) and processes (NL; arrows) of normal neurons. In contrast, DS neurons exhibit diffuse cytochrome c and AIF staining in both cell bodies (DS; arrowheads) and neuronal processes (DS; arrows). Bottom panels are higher magnifications of framed areas. Scale bar, 20 μm. C, Immunofluorescence shows positive immunoreactivity for active caspase 3 (1:1000) in DS neuronal cell bodies (red fluorescence; arrows). Normal neurons showed negative labeling for active caspase 3. Neurons were double labeled with anti-tubulin class III (1:2000; blue fluorescence). Scale bar, 20 μm.
Dominant-negative ets-2 expression increases DS neuronal survival
To establish a potential role for ets-2 increased expression in DS neuronal death, we reduced ets-2 activity in DS neurons by expressing ets-2 dominant-negative (DN). Transfection of GFP and DN were performed at 7 d in culture, and after 24 h, the cultures were processed and analyzed. Fluorescent microscopy revealed that degenerating DS neurons transfected with GFP exhibited similar changes as described for degenerating, nontransfected DS neurons, including neuritic beading and fragmentation, cell body shrinkage, and nuclear condensation (Fig. 5A) (Busciglio and Yankner, 1995). In contrast, DS neurons coexpressing DN/GFP exhibited normal morphology and lack of degenerative features (Fig. 5B). Quantification of neuronal cell death using PI showed a marked reduction in the number of PI-positive DS neurons expressing DN/GFP (46 ± 4%) compared with DS neurons expressing GFP alone (100 ± 8%) (Fig. 5C). This result suggests that overexpression of ets-2 may contribute to DS neuronal degeneration and that inhibition of ets-2 activity increases DS neuronal survival in culture.
Figure 5.

Expression of dominant-negative ets-2 increases DS neuronal survival. A, B, At 8 DIV, DS cortical neurons expressing GFP undergo degenerative changes similar to nontransfected DS neurons, including shrinkage of cell bodies, neuritic beading, and fragmentation (A, arrows). In contrast, DS cortical neurons cotransfected with ets-2 dominant-negative and GFP (GFP/DN) exhibit normal morphology and viability (B). Neurons were visualized by GFP fluorescence. Scale bar, 20 μm. C, Quantification of PI-positive DS neurons transfected with GFP or GFP/DN. There is a significant reduction in the number of PI-positive DS neurons transfected with GFP/DN compared with neurons transfected with GFP alone. Transfection of GFP alone did not affect DS neuronal morphology or viability. Cultures were transfected at 7 DIV and fixed after 24 h. Values are the mean ± SE; n > 300 transfected neurons per experimental condition. *p < 0.05 relative to GFP transfected cultures (100%) by Student's t test.
ets-2 expression in DS and AD brains is associated with neurodegenerative features
Immunofluorescence analysis of ets-2 in normal adult brains revealed that ets-2 is expressed in neurons and astrocytes (Fig. 6). The identity of ets-2-positive neurons was confirmed by double labeling with anti-neurofilament antibody (Fig. 6A,B), whereas ets-2-positive astrocytes were identified by double labeling with anti-GFAP (Fig. 6C,D). A low level of ets-2 expression in the cytoplasm of both neurons and astrocytes was observed throughout the cortex and hippocampal formation (Fig. 6E). Analysis of DS brains gave similar results (Fig. 6F), and image analysis revealed no significant differences in the intensity of ets-2 immunofluorescence between normal and DS brain sections (data not shown), suggesting a lack of constitutive upregulation of ets-2 in adult DS brains attributable to gene dosage.
Figure 6.
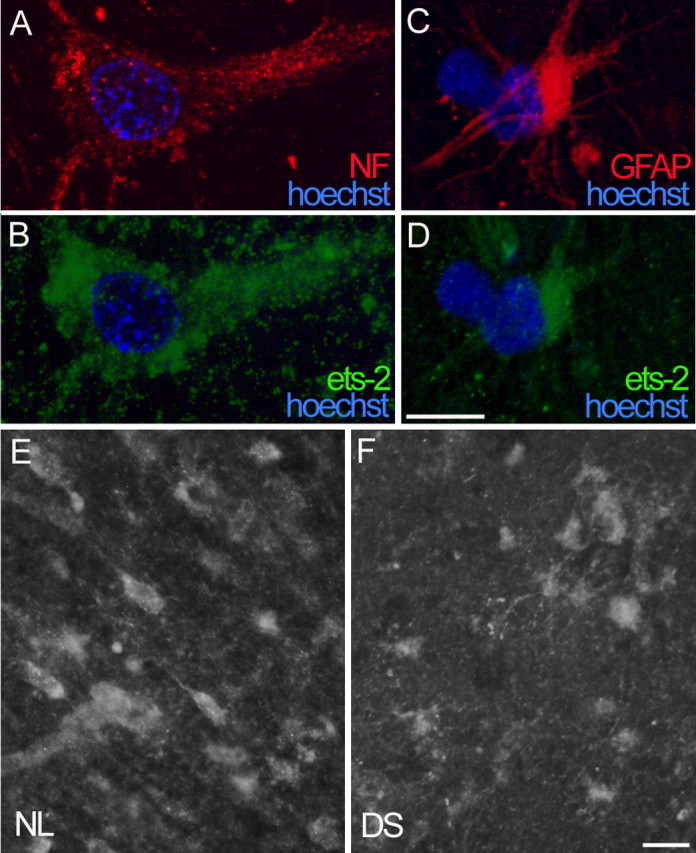
Ets-2 expression in normal and DS brains. A-D, Double immunofluorescence reveals ets-2 expression (anti-ets-2, 1:100) in neurons (A, B) and astrocytes (C, D) in normal entorhinal cortex. Neuronal identity was confirmed by positive anti-neurofilament staining (1:200; A), and astrocytes were labeled with anti-GFAP (1:200; C). Cellular nuclei were counterstained with Hoechst (blue fluorescence). E, F, Lower magnification illustrates similar level of ets-2 expression in cortex of NL and DS subjects. Images in A-D are optical sections (thickness, 0.375 μm) processed with the Apotome device (Zeiss). Scale bars: A-D, 10 μm; E, F, 20 μm.
To explore the association between ets-2 and neuronal death in situ, we analyzed the relationship between ets-2 expression, markers of apoptosis, and AD neuropathology in both DS/AD and sporadic AD brains. In DS/AD brains, we found increased ets-2 immunoreactivity associated with both markers of apoptosis and AD classic lesions. For example, image analysis indicated that high ets-2 expression was observed in 86 ± 11% of neurons showing bax immunofluorescence (Fig. 7A), suggesting a close association between ets-2 upregulation and apoptosis in DS brains. A number of studies have characterized the presence of intracellular Aβ in the brain of DS and AD patients as well as transgenic mouse models (Gouras et al., 2000; Busciglio et al., 2002; Oddo et al., 2003; Takahashi et al., 2004). Strong ets-2 immunoreactivity was found in 62 ± 3% of cortical and hippocampal neurons exhibiting intracellular Aβ (Fig. 7B). We also found an association between ets-2 and tau cytoskeletal pathology. Most neurons displaying hyperphosphorylated tau also showed high levels of ets-2 immunofluorescence (69 ± 7%) (Fig. 7C), which was evident in cells displaying different degrees of tau cytopathology, from pretangle stages (Fig. 7C, large arrow) to mature tangle-bearing neurons (Fig. 7C, small arrow). However, ets-2 was not detected to be associated with extracellular tangles (data not shown). Upregulation of ets-2 did not appear to be secondary to intracellular Aβ or tau hyperphosphorylation in affected neurons, because significant ets-2 expression was also observed in adjacent neurons lacking intracellular labeling for Aβ or hyperphosphorylated tau (Fig. 7C, arrowhead). Finally, high ets-2 expression was frequently found in astrocytes surrounding senile plaques (52 ± 16%) (Fig. 7D), implying a potential association between upregulation of ets-2 and astrocyte activation in plaque-rich cortical and hippocampal regions. Analysis of sporadic AD brains revealed similar results (Fig. 8). Strong ets-2 expression was present in cells localized in pathology-rich areas (Fig. 8A), particularly associated with tau cytopathology (Fig. 8B). Image analysis indicated that the frequency of colocalization of ets-2 with hyperphosphorylated tau in sporadic AD brain sections was 62 ± 13%. These results indicate that, in DS/AD and sporadic AD brains, strong ets-2 expression is observed in regions of abundant neuropathology, where it is often associated with markers of apoptosis and AD lesions.
Figure 7.

Increased ets-2 expression is associated with apoptosis and degenerative markers in DS/AD brains. Double immunofluorescence of DS/AD brains is shown. A, Anti-ets-2 (1:100; green fluorescence) and anti-bax (1:100; red fluorescence) showing immunoreactivity for both antigens in the cytoplasm of a neuron in the entorhinal cortex. B, Anti-ets-2 (red fluorescence) and monoclonal anti-Aβ42 (1:50; green fluorescence) labeling in the cytoplasm of a neuron located in the hippocampal formation. C, Anti-ets-2 (green fluorescence) and anti-hyperphosphorylated tau (1:1000; red fluorescence). Ets-2 immunoreactivity is present in entorhinal neurons displaying different degrees of tau pathology: a mature tangle-bearing neuron (small arrow) and a diffuse tangle-bearing neuron (large arrow). Significant ets-2 immunoreactivity is present in an adjacent neuron negative for hyperphosphorylated tau (arrowhead). D, Ets-2 immunoreactivity in astrocytes (arrows; green fluorescence) surrounding a senile plaque stained with anti-Aβ (asterisk; red fluorescence). Images in A and B are optical sections (thickness, 0.375 μm). Images in C and D are z-stacks of optical sections. Thickness of the stacks rendered in C and D are 3.75 and 1.12 μm, respectively. Images were processed with the Apotome device (Zeiss). Scale bar, 20 μm.
Figure 8.

Strong ets-2 immunoreactivity associated with degenerative markers in sporadic AD brains. Immunofluorescence with anti-ets-2 illustrates strong ets-2 expression in cell bodies located in the entorhinal cortex of a sporadic AD patient (arrows; A). Double immunofluorescence with anti-ets-2 (green) and PHF-1 (red) denotes marked ets-2 immunoreactivity in neurons displaying different stages of tau cytopathology: mature tangle-bearing neuron (arrow) and diffuse tangle-bearing neuron (arrowhead). In contrast, an extracellular tangle shows negative ets-2 immunoreactivity (small arrow). The image in B is a z-stack of optical sections 3 μm thick. Scale bars, 20 μm.
Discussion
Neuronal degeneration and development of AD are major features associated with DS. A major challenge is to characterize the genes located in chromosome 21, which contribute to loss of neuronal function and viability. Here, we show that ets-2 is expressed during normal HCN development in culture and that its expression is increased more than twofold in DS cortical neurons. However, no significant differences in general intensity, frequency, and localization of ets-2 expression were found between normal and DS brains. Thus, intracellular pro-oxidant conditions in DS neurons in culture, leading to increased generation of reactive oxygen species (Busciglio and Yankner, 1995), may account for the significant increase in ets-2 expression. This possibility is supported by a marked upregulation of ets-2 in normal HCN cultures treated with hydrogen peroxide. Overexpression of ets-2 in normal HCN led to a progressive pattern of neuronal degeneration, which was significantly reduced by coexpression of a dominant-negative form of ets-2. Similarly, DS HCN expressing dominant-negative ets-2 showed normal morphology and increased survival, implying the involvement of ets-2 in DS neuronal degeneration.
The role of p53 in the death pathway activated by ets-2 has been characterized previously in ets-2 transgenic models (Wolvetang et al., 2003a,b). In addition, increased p53 expression has been reported in DS fibroblasts, cortical cultures, and DS brains (Seidl et al., 1999; Wolvetang et al., 2003b). The involvement of p53 in ets-2-induced degeneration is further supported by experiments showing increased survival of normal HCN cotransfected with ets-2 and m135 (Fig. 3C) and increased survival of DS neurons transfected with m135 (A. Pelsman and J. Busciglio, unpublished result).
DS cortical neurons undergo increased apoptosis during the second week in culture (Busciglio and Yankner, 1995). During this period, we found alterations in downstream apoptotic effectors, including a marked increase in bax protein levels, release of cytochrome c and AIF from mitochondria to cytosol, and activation of caspases 3 and 7. Similarly, increased activated caspase 3 and apoptosis is observed in neuronal cultures generated from ets-2 transgenic mice (Wolvetang et al., 2003b). Collectively, these results suggest a close association among oxidative stress, increased expression of ets-2, and activation of a mitochondrial death pathway in DS neurons. Moreover, the presence of a similar sequence of morphological and molecular degenerative features in normal HCNs overexpressing ets-2 and in DS HCN further suggests that ets-2 may play a role in DS neuronal degeneration. In this regard, a number of studies provide evidence of bax expression, caspase activation, and apoptosis in fetal and adult DS brains (de la Monte, 1999; Sawa, 1999; Seidl et al., 1999; Head et al., 2002; Su et al., 2002)
Distinct, albeit low levels of ets-2 expression were present in the adult brain in neurons and astrocytes in the cortex and hippocampus. A previous biochemical study did not find major differences in ets-2 protein levels between control and DS brains (Engidawork et al., 2001). In agreement with those results, we found similar levels of ets-2 immunoreactivity throughout cortical and hippocampal areas in both normal and DS brains. In contrast, higher ets-2 immunoreactivity was evident in cells associated with markers of apoptosis and neurodegeneration in both DS/AD and sporadic AD brains. For instance, strong ets-2 expression was found in neurons exhibiting positive bax immunofluorescence as well as in neurons showing intracellular Aβ accumulation or different stages of tau cytopathology. Interestingly, marked ets-2 immunoreactivity was also observed in adjacent neurons devoid of the above-mentioned pathological markers, suggesting that the increase in ets-2 expression might precede their appearance. Both Aβ and tau cytopathology have been associated with pro-oxidant intracellular conditions, raising the possibility that chronic oxidative stress in DS/AD and sporadic AD brains upregulates ets-2 expression in susceptible neurons (Sayre et al., 2000; Busciglio et al., 2002; Mandelkow et al., 2003). In this scenario, ets-2 increased expression would result in enhanced neuronal vulnerability and degeneration regardless of ets-2 gene dosage. However, our results do not unequivocally rule out a subtle increase in ets-2 expression in DS brain as a result of gene dosage. Consequently, a combinatorial or even synergistic effect of gene dosage and oxidative stress may pose an additional challenge to neuronal survival in DS brains, consistent with an earlier onset of AD pathology in DS subjects than in sporadic cases. Ongoing experiments are directed to determine the expression level of ets-2 and its association with markers of oxidative damage in DS, AD, and other neurodegenerative conditions associated with increased oxidative stress such as Parkinson's and Huntington's diseases.
In DS, chronic mitochondrial dysfunction is associated with APP overexpression and the presence of intracellular Aβ (Busciglio et al., 2002), both of which can translocate to mitochondria and aggravate the energy shortfall and oxidative stress (Anandatheerthavarada et al., 2003; Lustbader et al., 2004). In a similar way, increased SOD1 activity in the mitochondrial intermembrane space may increase free radical generation and mitochondrial dysfunction (de Haan et al., 1996; Okado-Matsumoto and Fridovich, 2001). Hence, several toxic mechanisms associated with upregulation of specific genes localized in chromosome 21 (e.g., ets-2, APP, and SOD1) may converge in DS mitochondria, leading to chronic metabolic impairment, oxidative stress, and neuronal degeneration (Busciglio et al., 1998). In this regard, studies on early AD patients and patients at risk of AD show hypometabolism in posterior cingulate and temporal cortex as indicators of the disease process, which strongly suggest energy deficits associated with disease progression. In contrast, nondemented DS subjects exhibit inferior temporal/entorhinal cortex hypermetabolism (Minoshima et al., 1997; Silverman et al., 2001; Alexander et al., 2002). This increase in metabolic rate can be interpreted as a compensatory mechanism, taking place in affected areas at early stages of the disease process, which cannot be sustained as neuronal degeneration progresses (Haier et al., 2003).
In summary, ets-2 overexpression in cultured HCN leads to activation of a mitochondrial death apoptotic pathway. In DS/AD brains, upregulation of ets-2 appears closely associated with AD neurodegenerative lesions. Chronic oxidative stress in DS and AD brains may promote ets-2 expression, which in turn may predispose to the activation of a mitochondrial death pathway. Thus, modulation of ets-2 expression and preservation of redox status and mitochondrial function may be relevant to protect neuronal homeostasis and to prevent additional deterioration of cognitive ability and development of AD pathology in DS subjects.
Footnotes
This work was supported by National Institutes of Health Grant HD38466 (J.B.).
Correspondence should be addressed to Jorge Busciglio, Department of Neurobiology and Behavior, University of California, Irvine, 2205 McGaugh Hall, Irvine, CA 92697-4550. E-mail: jbuscigl@uci.edu.
Copyright © 2005 Society for Neuroscience 0270-6474/05/252295-09$15.00/0
P.H. and A.P. contributed equally to this work.
References
- Alexander GE, Chen K, Pietrini P, Rapoport SI, Reiman EM (2002) Longitudinal PET evaluation of cerebral metabolic decline in dementia: a potential outcome measure in Alzheimer's disease treatment studies. Am J Psychiatry 159: 738-745. [DOI] [PubMed] [Google Scholar]
- Anandatheerthavarada HK, Biswas G, Robin MA, Avadhani NG (2003) Mitochondrial targeting and a novel transmembrane arrest of Alzheimer's amyloid precursor protein impairs mitochondrial function in neuronal cells. J Cell Biol 161: 41-54. [DOI] [PMC free article] [PubMed] [Google Scholar]
- Bar-Peled O, Korkotian E, Segal M, Groner Y (1996) Constitutive overexpression of Cu/Zn superoxide dismutase exacerbates kainic acid-induced apoptosis of transgenic-Cu/Zn superoxide dismutase neurons. Proc Natl Acad Sci USA 93: 8530-8535. [DOI] [PMC free article] [PubMed] [Google Scholar]
- Bhat NK, Fisher RJ, Fujiwara S, Ascione R, Papas TS (1987) Temporal and tissue-specific expression of mouse ets genes. Proc Natl Acad Sci USA 84: 3161-3165. [DOI] [PMC free article] [PubMed] [Google Scholar]
- Busciglio J, Yankner BA (1995) Apoptosis and increased generation of reactive oxygen species in Down's syndrome neurons in vitro Nature 378: 776-779. [DOI] [PubMed] [Google Scholar]
- Busciglio J, Andersen JK, Schipper HM, Gilad GM, McCarty R, Marzatico F, Toussaint O (1998) Stress, aging, and neurodegenerative disorders. Molecular mechanisms. Ann NY Acad Sci 851: 429-443. [DOI] [PubMed] [Google Scholar]
- Busciglio J, Pelsman A, Wong C, Pigino G, Yuan M, Mori H, Yankner BA (2002) Altered metabolism of the amyloid beta precursor protein is associated with mitochondrial dysfunction in Down's syndrome. Neuron 33: 677-688. [DOI] [PubMed] [Google Scholar]
- Chipuk JE, Kuwana T, Bouchier-Hayes L, Droin NM, Newmeyer DD, Schuler M, Green DR (2004) Direct activation of Bax by p53 mediates mitochondrial membrane permeabilization and apoptosis. Science 303: 1010-1014. [DOI] [PubMed] [Google Scholar]
- Chumakov AM, Miller CW, Chen DL, Koeffler HP (1993) Analysis of p53 transactivation through high-affinity binding sites. Oncogene 8: 3005-3011. [PubMed] [Google Scholar]
- Coyle JT, Oster-Granite ML, Gearhart JD (1986) The neurobiologic consequences of Down syndrome. Brain Res Bull 16: 773-787. [DOI] [PubMed] [Google Scholar]
- Danial NN, Korsmeyer SJ (2004) Cell death: critical control points. Cell 116: 205-219. [DOI] [PubMed] [Google Scholar]
- de Haan JB, Cristiano F, Iannello R, Bladier C, Kelner MJ, Kola I (1996) Elevation in the ratio of Cu/Zn-superoxide dismutase to glutathione peroxidase activity induces features of cellular senescence and this effect is mediated by hydrogen peroxide. Hum Mol Genet 5: 283-292. [DOI] [PubMed] [Google Scholar]
- de la Monte SM (1999) Molecular abnormalities of the brain in Down syndrome: relevance to Alzheimer's neurodegeneration. J Neural Transm Suppl 57: 1-19. [DOI] [PubMed] [Google Scholar]
- Engidawork E, Baiic N, Fountoulakis M, Dierssen M, Greber-Platzer S, Lubec G (2001) Beta-amyloid precursor protein, ETS-2 and collagen alpha 1 (VI) chain precursor, encoded on chromosome 21, are not overexpressed in fetal Down syndrome: further evidence against gene dosage effect. J Neural Transm Suppl 61: 335-346. [DOI] [PubMed] [Google Scholar]
- Gouras GK, Tsai J, Naslund J, Vincent B, Edgar M, Checler F, Greenfield JP, Haroutunian V, Buxbaum JD, Xu H, Greengard P, Relkin NR (2000) Intraneuronal Aβ42 accumulation in human brain. Am J Pathol 156: 15-20. [DOI] [PMC free article] [PubMed] [Google Scholar]
- Grace EA, Rabiner CA, Busciglio J (2002) Characterization of neuronal dystrophy induced by fibrillar amyloid beta: implications for Alzheimer's disease. Neuroscience 114: 265-273. [DOI] [PubMed] [Google Scholar]
- Haier RJ, Alkire MT, White NS, Uncapher MR, Head E, Lott IT, Cotman CW (2003) Temporal cortex hypermetabolism in Down syndrome prior to the onset of dementia. Neurology 61: 1673-1679. [DOI] [PubMed] [Google Scholar]
- Head E, Lott IT, Cribbs DH, Cotman CW, Rohn TT (2002) Beta-amyloid deposition and neurofibrillary tangle association with caspase activation in Down syndrome. Neurosci Lett 330: 99-103. [DOI] [PubMed] [Google Scholar]
- Johnstone RW, Ruefli AA, Lowe SW (2002) Apoptosis: a link between cancer genetics and chemotherapy. Cell 108: 153-164. [DOI] [PubMed] [Google Scholar]
- Kola I, Brookes S, Green AR, Garber R, Tymms M, Papas TS, Seth A (1993) The Ets1 transcription factor is widely expressed during murine embryo development and is associated with mesodermal cells involved in morphogenetic processes such as organ formation. Proc Natl Acad Sci USA 90: 7588-7592. [DOI] [PMC free article] [PubMed] [Google Scholar]
- Lott IT, Head E (2001) Down syndrome and Alzheimer's disease: a link between development and aging. Ment Retard Dev Disabil Res Rev 7: 172-178. [DOI] [PubMed] [Google Scholar]
- Lustbader JW, Cirilli M, Lin C, Xu HW, Takuma K, Wang N, Caspersen C, Chen X, Pollak S, Chaney M, Trinchese F, Liu S, Gunn-Moore F, Lue LF, Walker DG, Kuppusamy P, Zewier ZL, Arancio O, Stern D, Yan SS, Wu H (2004) ABAD directly links Aβ to mitochondrial toxicity in Alzheimer's disease. Science 304: 448-452. [DOI] [PubMed] [Google Scholar]
- Macleod K, Leprince D, Stehelin D (1992) The ets gene family. Trends Biochem Sci 17: 251-256. [DOI] [PubMed] [Google Scholar]
- Mandelkow EM, Stamer K, Vogel R, Thies E, Mandelkow E (2003) Clogging of axons by tau, inhibition of axonal traffic and starvation of synapses. Neurobiol Aging 24: 1079-1085. [DOI] [PubMed] [Google Scholar]
- Mann DM (1988) The pathological association between Down syndrome and Alzheimer disease. Mech Ageing Dev 43: 99-136. [DOI] [PubMed] [Google Scholar]
- Mihara M, Erster S, Zaika A, Petrenko O, Chittenden T, Pancoska P, Moll UM (2003) p53 has a direct apoptogenic role at the mitochondria. Mol Cell 11: 577-590. [DOI] [PubMed] [Google Scholar]
- Minoshima S, Giordani B, Berent S, Frey KA, Foster NL, Kuhl DE (1997) Metabolic reduction in the posterior cingulate cortex in very early Alzheimer's disease. Ann Neurol 42: 85-94. [DOI] [PubMed] [Google Scholar]
- Oddo S, Caccamo A, Shepherd JD, Murphy MP, Golde TE, Kayed R, Metherate R, Mattson MP, Akbari Y, LaFerla FM (2003) Triple-transgenic model of Alzheimer's disease with plaques and tangles: intracellular Aβ and synaptic dysfunction. Neuron 39: 409-421. [DOI] [PubMed] [Google Scholar]
- Okado-Matsumoto A, Fridovich I (2001) Subcellular distribution of superoxide dismutases (SOD) in rat liver: Cu, Zn-SOD in mitochondria. J Biol Chem 276: 38388-38393. [DOI] [PubMed] [Google Scholar]
- Pelsman A, Hoyo-Vadillo C, Gudasheva TA, Seredenin SB, Ostrovskaya RU, Busciglio J (2003) GVS-111 prevents oxidative damage and apoptosis in normal and Down's syndrome human cortical neurons. Int J Dev Neurosci 21: 117-124. [DOI] [PubMed] [Google Scholar]
- Pigino G, Pelsman A, Mori H, Busciglio J (2001) Presenilin-1 mutations reduce cytoskeletal association, deregulate neurite growth, and potentiate neuronal dystrophy and tau phosphorylation. J Neurosci 21: 834-842. [DOI] [PMC free article] [PubMed] [Google Scholar]
- Pigino G, Morfini G, Pelsman A, Mattson MP, Brady ST, Busciglio J (2003) Alzheimer's presenilin 1 mutations impair kinesin-based axonal transport. J Neurosci 23: 4499-4508. [DOI] [PMC free article] [PubMed] [Google Scholar]
- Sanij E, Hatzistavrou T, Hertzog P, Kola I, Wolvetang EJ (2001) Ets-2 is induced by oxidative stress and sensitizes cells to H2O2-induced apoptosis: implications for Down's syndrome. Biochem Biophys Res Commun 287: 1003-1008. [DOI] [PubMed] [Google Scholar]
- Sawa A (1999) Neuronal cell death in Down's syndrome. J Neural Transm Suppl 57: 87-97. [DOI] [PubMed] [Google Scholar]
- Sayre LM, Perry G, Harris PL, Liu Y, Schubert KA, Smith MA (2000) In situ oxidative catalysis by neurofibrillary tangles and senile plaques in Alzheimer's disease: a central role for bound transition metals. J Neurochem 74: 270-279. [DOI] [PubMed] [Google Scholar]
- Scheffner M, Takahashi T, Huibregtse JM, Minna JD, Howley PM (1992) Interaction of the human papillomavirus type 16 E6 oncoprotein with wild-type and mutant human p53 proteins. J Virol 66: 5100-5105. [DOI] [PMC free article] [PubMed] [Google Scholar]
- Seidl R, Fang-Kircher S, Bidmon B, Cairns N, Lubec G (1999) Apoptosis-associated proteins p53 and APO-1/Fas (CD95) in brains of adult patients with Down syndrome. Neurosci Lett 260: 9-12. [DOI] [PubMed] [Google Scholar]
- Sementchenko VI, Watson DK (2000) Ets target genes: past, present and future. Oncogene 19: 6533-6548. [DOI] [PubMed] [Google Scholar]
- Silverman DH, Small GW, Chang CY, Lu CS, Kung De Aburto MA, Chen W, Czernin J, Rapoport SI, Pietrini P, Alexander GE, Schapiro MB, Jagust WJ, Hoffman JM, Welsh-Bohmer KA, Alavi A, Clark CM, Salmon E, de Leon MJ, Mielke R, Cummings JL, et al. (2001) Positron emission tomography in evaluation of dementia: regional brain metabolism and long-term outcome. JAMA 286: 2120-2127. [DOI] [PubMed] [Google Scholar]
- Su JH, Kesslak JP, Head E, Cotman CW (2002) Caspase-cleaved amyloid precursor protein and activated caspase-3 are colocalized in the granules of granulovacuolar degeneration in Alzheimer's disease and Down's syndrome brain. Acta Neuropathol (Berl) 104: 1-6. [DOI] [PubMed] [Google Scholar]
- Sumarsono SH, Wilson TJ, Tymms MJ, Venter DJ, Corrick CM, Kola R, Lahoud MH, Papas TS, Seth A, Kola I (1996) Down's syndrome-like skeletal abnormalities in Ets2 transgenic mice. Nature 379: 534-537. [DOI] [PubMed] [Google Scholar]
- Takahashi RH, Almeida CG, Kearney PF, Yu F, Lin MT, Milner TA, Gouras GK (2004) Oligomerization of Alzheimer's β-amyloid within processes and synapses of cultured neurons and brain. J Neurosci 24: 3592-3599. [DOI] [PMC free article] [PubMed] [Google Scholar]
- Venanzoni MC, Robinson LR, Hodge DR, Kola I, Seth A (1996) ETS1 and ETS2 in p53 regulation: spatial separation of ETS binding sites (EBS) modulate protein: DNA interaction. Oncogene 12: 1199-1204. [PubMed] [Google Scholar]
- Vogelstein B, Kinzler KW (1992) p53 function and dysfunction. Cell 70: 523-526. [DOI] [PubMed] [Google Scholar]
- Wasylyk B, Hahn SL, Giovane A (1993) The Ets family of transcription factors. Eur J Biochem 211: 7-18. [DOI] [PubMed] [Google Scholar]
- Wolvetang EJ, Bradfield OM, Hatzistavrou T, Crack PJ, Busciglio J, Kola I, Hertzog PJ (2003a) Overexpression of the chromosome 21 transcription factor Ets2 induces neuronal apoptosis. Neurobiol Dis 14: 349-356. [DOI] [PubMed] [Google Scholar]
- Wolvetang EJ, Wilson TJ, Sanij E, Busciglio J, Hatzistavrou T, Seth A, Hertzog PJ, Kola I (2003b) ETS2 overexpression in transgenic models and in Down syndrome predisposes to apoptosis via the p53 pathway. Hum Mol Genet 12: 247-255. [DOI] [PubMed] [Google Scholar]