

Abstract
Alterations in the PI3K/AKT pathway occur in up to 70% of melanomas and are associated with disease progression. The three AKT paralogs are highly conserved but data suggest they have distinct functions. Activating mutations of AKT1 and AKT3 occur in human melanoma but their role in melanoma formation and metastasis remains unclear. Using an established melanoma mouse model, we evaluated E17K, E40K, and Q79K mutations in AKT1, AKT2, and AKT3 and show that mice harboring tumors expressing AKT1E17K had the highest incidence of brain metastasis and lowest mean survival. Tumors expressing AKT1E17K displayed elevated levels of focal adhesion factors and enhanced phosphorylation of focal adhesion kinase. AKT1E17K expression in melanoma cells increased invasion and this was reduced by pharmacological inhibition of either AKT or FAK. These data suggest that the different AKT paralogs have distinct roles in melanoma brain metastasis and that AKT and FAK may be promising therapeutic targets.
Keywords: AKT, FAK, melanoma, mouse model, RCAS/TVA
Introduction
Cutaneous melanoma is the most lethal form of skin cancer due to its propensity to metastasize. The disease exhibits organotropism for specific sites including the lung and brain (1). The predilection of melanoma to preferentially seed and colonize select organs is particularly prominent in the form of brain metastasis. Melanoma has the highest propensity to metastasize to the brain among all adult malignancies (1) with up to 75% of stage IV patients with evidence of brain metastases at autopsy (2). However, the mechanisms that contribute to melanoma brain tropism are not well understood.
Hyper-activation of the PI3K/AKT signaling pathway occurs in most metastatic melanomas and increased PI3K/AKT pathway activity correlates with disease progression (3,4). Loss or inactivation of the tumor suppressor phosphatase and tensin homolog deleted on chromosome 10 (PTEN) is common in cutaneous melanoma and results in activation of the pathway leading to elevated phospho-AKT (P-AKT) levels (5,6). Interestingly, melanoma brain metastases exhibit higher P-AKT than those of the liver or lung (6). Melanomas with loss of PTEN also have a shorter time to brain metastasis (5) and AKT overexpression results in a shift from radial to vertical tumor growth (7). Taken together, these data suggest that overstimulation of the PI3K/AKT pathway plays a key role in melanoma progression and may be particularly important in brain homing and/or colonization.
AKT1 is one of three closely related serine/threonine kinases (AKT1, AKT2, and AKT3). Although less common than PTEN loss, the ‘hotspot’ mutation E17K in AKT1 and AKT3 (6,8) also induces PI3K/AKT pathway hyper-activation (9) by disrupting the intramolecular interaction between the pleckstrin homology domain and the kinase domain (10). AKT1Q79K has also been detected in human melanoma and reported to not only result in constitutive activation of the enzyme but to also mediate resistance to mutant BRAF inhibition (11). To date, mutations that result in constitutive activation of AKT2 have not been observed in melanoma; however, one study reported that PTEN loss preferentially activates AKT2 over the other AKT paralogs suggesting that aberrant AKT2 signaling may also influence melanoma progression (12). This finding seems contradictory to a recent report demonstrating that AKT2 preferentially binds phosphatidylinositol-3,4-biphosphate (PI(3,4)P2), which forms from phosphatidylinositol-3,4,5-triphosphate (PIP3) by SHIP2 at the plasma membrane and delivered to early endosomes through clathrin-mediated endocytosis. Conversely, AKT1 and AKT3 preferentially bind PIP3, a phosphatidylinositol sequestered to the plasma membrane (13). These differential fates of AKT paralogs may contribute to differential exposure to substrates. Studies aimed at defining the role of different AKT paralogs in cancer have provided some insight into paralog-specific functions in disease progression. Riggio et al., reported that while AKT1 overexpression promoted primary tumor growth in breast cancer – cell migration, invasion and metastasis were inhibited. Conversely, overexpression of AKT2 had the opposite effect (14). AKT3 has been reported to inhibit migration and metastasis in breast cancer (15), whereas in melanoma, AKT3 has been implicated in tumorigenic potential (16). These studies imply that the different AKT paralogs may have specific and context-dependent functions in cancer, including tumor suppressive properties, and therefore it is critical that these functions are accurately characterized so effective therapeutic strategies targeting AKT or its effectors can be developed.
Using an established autochthonous mouse model of melanoma, we previously demonstrated that activation of AKT1 through the addition of an N-terminal myristoylation sequence (myrAKT1) reduced survival and increased the incidence of melanoma lung and brain metastasis in the context of BRAFV600E expression and Cdkn2a loss. Loss of Pten cooperated with myrAKT1 and further enhanced brain metastasis in this context (17). In this study, we evaluated the ability of constitutively active E17K, E40K, or Q79K mutants of each AKT paralog to promote tumor progression and metastasis in the context of BRAFV600E expression and loss of Cdkn2a and Pten. Expression of AKT1E17K promoted highly aggressive melanomas that metastasized to the lungs and brain. This metastatic phenotype was not significantly observed in the case of other mutant AKT-positive tumors, suggesting that the AKT paralogs have distinct, non-overlapping roles in the development of melanoma brain metastases. AKT1E17K-positive tumors showed AKT1E17K-dependent up-regulation of multiple focal adhesion (FA) factors, which are key components of focal adhesions and established stimulators of cell motility, as well as phosphorylation of focal adhesion kinase (FAK). Ectopic expression of AKT1E17K in non-metastatic melanoma cells increased cell invasion, a phenotype abrogated by pharmacological inhibition of AKT or FAK. These findings strongly suggest that one mechanism by which AKT1 promotes melanoma lung and brain metastasis is through regulation and activation of proteins involved in focal adhesions. This has important implications for the development of therapeutic strategies aimed at preventing or treating disseminated disease.
Methods
Mice and Genotyping
Dct::TVA;BrafCA;Cdkn2alox/lox;Ptenlox/lox mice have been described (17). The breeding scheme and genotype procedures are described in supplementary materials.
Viral Constructs and Propagation
The avian retroviral vectors used in this study are replication-competent Avian Leukosis Virus splice acceptor and Bryan polymerase-containing vectors of envelope subgroup A [designated RCASBP(A) and abbreviated RCAS]. Cloning details for RCAS AKT mutant constructs and the method of viral propagation are described in supplementary materials.
Cell Culture
The culture conditions for DF-1, YUMM 1.1, and primary tumor cell lines are described in supplementary materials. All primary tumor cell lines were derived from Dct::TVA mice.
Viral Infections (In Vivo and In Vitro)
Detailed experimental procedures describing the injection of Dct::TVA mice, as well as the generation YUMM1.1 isogenic variants, and primary tumor cell line variants used in functional experiments are described in supplementary materials.
Histology and Histochemical Staining
Mice were euthanized at their experimental endpoints and subjected to a full necropsy. Brain, lung, and primary tumor tissues were fixed in formalin overnight, dehydrated in 70% ethyl alcohol, and paraffin embedded. Sections were stained with H&E or left unstained for immunohistochemistry. Expression of mutant AKT in each primary tumor of the mutant AKT cohorts was confirmed by immunohistochemistry for the HA epitope tag. Mice whose tumors were absent detectable HA were excluded from all analyses. A separate portion of each primary tumor was frozen for use in immunoblot analyses, RPPA, and RNA sequencing.
High-Throughput Arrays
Detailed experimental procedures and GEO accession numbers for the reverse phase protein array (RPPA) and RNA sequencing as well as TCGA data analysis are described in supplementary materials.
Spheroid Formation, Transwell Invasion, and Transwell Migration Assays
All 3D cell growth/motility assays were performed using YUMM 1.1 cells. Detailed experimental procedures, including the pharmacological inhibitors used in the transwell invasion study, are provided in supplementary materials.
Tail Vein and Intracranial Injections
NOD scid gamma (NSG) mice were injected via the tail vain or intracranially with primary mouse melanoma cells. Additional experimental details are provided in supplementary materials.
Immunohistochemistry, Immunoblotting, and Immunofluorescence
Detailed experimental procedures for all antibody-based assays are described in supplementary materials.
Statistical Methods
Analytical methods used to determine significant differences between groups with respect to mouse survival, incidence of metastasis, immunoblots, spheroid formation, RPPA, and RNA sequencing are described in supplementary materials. The asterisks shown in figures correspond to P values as follows: p < 0.05 (*), p < 0.01 (**), p < 0.001 (***).
Study Approval
All animal experimentation was performed in AAALAC approved facilities at the University of Utah. All animal protocols were reviewed and approved prior to experimentation by the Institutional Animal Care and Use Committee (IACUC) at the University of Utah.
Supplementary Material
Refer to Web version of PubMed Central for supplementary material
Results
AKT1E17K promotes melanoma metastasis in vivo
To evaluate the effect of distinct activating mutations in AKT on melanoma growth and metastasis, we used an established autochthonous mouse model of melanoma based on the RCAS/TVA avian retroviral system (17). In this model, transgenic mice express the TVA viral receptor under the control of the dopachrome tautomerase (DCT) promoter, which allows targeting of the virus, and expression of the genes it contains, specifically in melanocytes. Dct::TVA mice were previously crossed to BrafCA, Cdkn2alox/lox, and Ptenlox/lox mice to model the most common alterations in cutaneous melanoma (17). Delivery of RCAS-Cre results in expression of BRAFV600E and genetic loss of Cdkn2a and Pten. Activating mutants (E17K, E40K, or Q79K) of AKT1, AKT2, and AKT3 were created using site-directed mutagenesis, engineered to contain an N-terminal HA epitope tag, and cloned into the RCAS retroviral vector. Prior to in vivo studies, all mutant AKT viruses were shown to infect TVA-positive cells and express the mutant AKT protein in vitro (Figure S1). For in vivo analysis, newborn Dct::TVA;BrafCA;Cdkn2alox/lox;Ptenlox/lox mice were subcutaneously injected with viruses encoding mutant AKT1, AKT2, or AKT3 alone or in combination with RCAS-Cre. All mice injected with viruses containing mutant AKT alone, in the absence of RCAS-Cre, remained tumor-free for the duration of the study (150 days, n = 59) (Figure 1). Conversely, all mice injected with viruses encoding Cre, alone or in combination with mutant AKT, developed primary tumors at the site of injection. Delivery of RCAS-AKT1E17K or RCAS-AKT1E40K in combination with RCAS-Cre significantly reduced survival compared with delivery of RCAS-Cre alone (p = 0.0063 and 0.0004, respectively) (Figure 1A and Table S1). Likewise, delivery of viruses containing AKT2E40K, AKT3E17K or AKT3Q79K in combination with RCAS-Cre significantly reduced survival compared with delivery of RCAS-Cre alone (p = 0.0025, 0.0026, and 0.0058, respectively) (Figures 1B, 1C and Table S1). Interestingly, delivery of viruses containing AKT1Q79K, AKT2E17K, AKT2Q79K, or AKT3E40K in combination with RCAS-Cre did not significantly reduce survival compared with delivery of RCAS-Cre alone (Figure 1A-C and Table S1).
Figure 1.
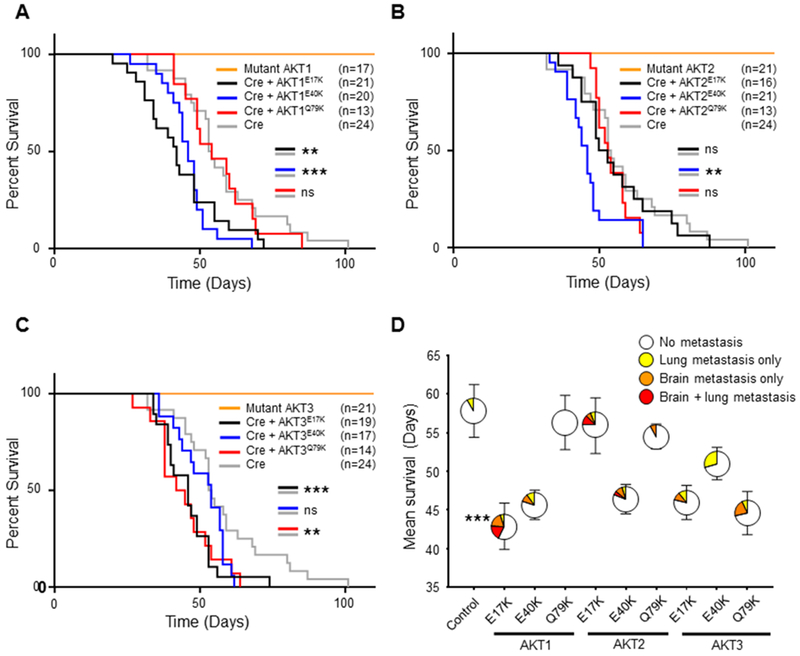
AKTE17K reduces survival and promotes brain metastasis in mice with melanoma. A, Kaplan-Meier percent survival curves for Dct::TVA;BrafCA;Cdkn2alox/lox;Ptenlox/lox mice injected with viruses encoding either Cre (gray line) (control), Cre + AKT1E17K (black line), Cre + AKT1E40K (blue line), Cre + AKT1Q79K (red line), or AKT1 (E17K, E40K or Q79K) alone (orange line). Cre + AKT1E17K and Cre + AKT1E40K reduced survival of mice compared with Cre alone (p = 0.0063 and 0.0004 respectively). B, Kaplan-Meier percent survival curves with comparable color scheme for AKT2 mutant cohorts; Cre + AKT2E40K reduced survival of mice compared with Cre alone (p = 0.0025). C, Kaplan-Meier percent survival curves with comparable color scheme for AKT3 mutant cohorts; Cre + AKT3E17K and Cre + AKT3Q79K reduced survival of mice compared with Cre alone (p = 0.0026 and 0.0058 respectively). A logrank (Mantel-Cox) text was used to determine significant differences between cohorts. D, Mean survival ± SEM depicted on the y-axis; colored areas in circles represent the percentage of mice that developed no metastases (white), lung metastasis only (yellow), brain metastasis only (orange), or lung and brain metastasis (red). The number of mice (n) for each cohort is equal to those depicted in (A-C). There was a significant increase in the incidence of brain metastasis (asterisk) in AKT1E17K mice compared with controls (38% versus 0% respectively) (p = 0.0009). A Fisher’s exact test (two-tailed) was used to determine significant differences in the incidence of metastasis. P values are as follows: p < 0.05 (*), p < 0.01 (**), p < 0.001 (***). ns = not significant.
To assess metastasis, full necropsies were performed and all major organs were examined histologically. Brain metastases were detected in 38% (8/21) of mice injected with viruses encoding AKT1E17K and Cre (AKT1E17K cohort: BRAFV600E;Cdkn2a−/−;Pten−/−;AKT1E17K) , whereas no brain metastases were detected in mice injected with viruses containing Cre alone (control cohort: BRAFV600E;Cdkn2a−/−;Pten−/−) (n = 24) (p = 0.0009) (Figure 1D). Lung metastases were detected in 24% (5/21) of mice in the AKT1E17K cohort but this was not significantly different from the control cohort (p = 0.225). No significant difference in the incidence of brain or lung metastases was observed between all other experimental cohorts and the controls (Table S1). These data suggest that AKT1E17K confers an enhanced capacity to promote brain metastasis compared with the other AKT mutants tested.
AKT1 kinase activity is required for induction of melanoma metastasis in vivo
Propagation of AKT signaling is accomplished through kinase-dependent phosphorylation of downstream effectors that drive cell survival, growth, and motility. However, AKT1 has been reported to promote cell survival in a kinase-independent manner (18). To assess the requirement for kinase activity of AKT1E17K for tumor growth and brain metastasis in our model, we cloned a validated kinase-dead version of the E17K mutant (AKT1E17K, K179M) into the RCAS vector (18,19). Mice injected with viruses encoding AKT1E17K, K179M and Cre showed no significant difference in survival (Figure S2) or incidence of metastasis (Table S1) compared with the Cre-only control cohort. This was also true for the wild type AKT1 and Cre cohort compared with the Cre-only control cohort. These data demonstrate that the reduced survival and enhanced brain metastases observed require AKT1 kinase activity, which is activated by the E17K substitution.
Primary and metastatic melanomas are histologically similar to the human disease
Primary tumors generated in Dct::TVA;BrafCA;Cdkn2alox/lox;Ptenlox/lox mice were examined histologically following hematoxylin and eosin (H&E) staining by board-certified pathologists (A.H.G. and K.L.D.; Figure 2A). Tumors displayed characteristics consistent with malignancy, including mitotic figures and high nuclear grade with prominent nucleoli. They consisted primarily of short spindle cells but epithelioid cells were variably observed in addition to non-brisk inflammation (tumor infiltrating lymphocytes), coagulative tumor necrosis, and intratumoral hemorrhage. Analysis of tumor sections by IHC revealed heterogeneous detection of mutant AKT (HA epitope tag; Figure 2B), the presence of proliferation marker Ki67 (Figure 2C), P-AKT (Figure 2D), P-ERK (Figure 2E), and the melanoma marker S100 (Figure 2F).
Figure 2.
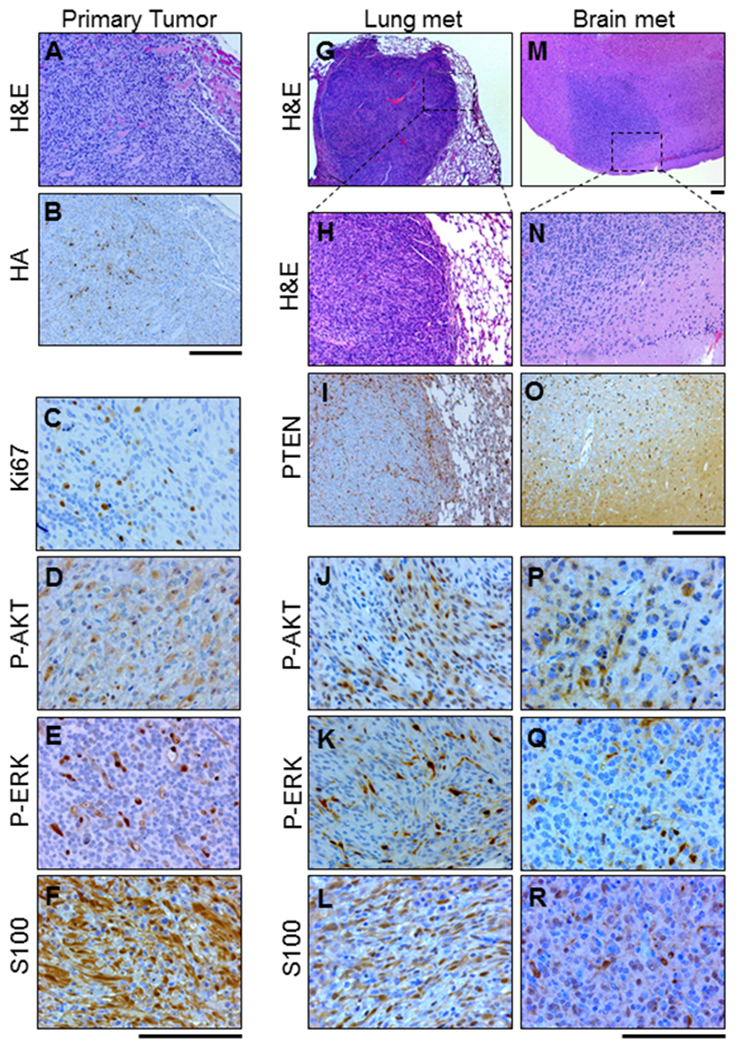
Histological analysis of the primary tumor and metastatic tumor tissue show similarities with human melanoma. Representative images of serial sections from a primary tumor, lung lesion, and brain lesion in BRAFV600E;Cdkn2a−/−;Pten−/−;AKT1E17K mice are shown. A, primary tumor stained with H&E. B, IHC for HA performed on the primary tumor tissue revealed AKT1E17K- expression as well as the presence of C, Ki67 D, P-AKT (S473) E, P-ERK (T202/Y204) and F, S100. G-H, H&E staining was used to identify lung metastases. I, IHC for PTEN revealed expression in normal tissue but absence of expression in lung metastases and the presence of J, P-AKT (S473) K, P-ERK (T202/Y204), and L, S100. M-N, H&E staining was used to identify brain metastases. These tumors were subject to identical IHC analyses as the lung metastases. Analyses revealed the absence of O, PTEN and presence of P, P-AKT (S473) Q, P-ERK (T202/Y204), and R, S100. Scale bars represent 100 μm.
Microscopic examination of the lungs revealed that a subset of mice had developed metastatic lesions; these tumors exhibited a malignant morphology consistent with those of the primary tumors (Figures 2G–H). Lung lesions were evaluated by IHC and exhibited loss of PTEN expression (Figure 2I) as well as detectable P-AKT (Figure 2J), and P-ERK (Figure 2K). Likewise, and similar to the primary tumors, lung metastases exhibited positivity for S100 confirming the melanocytic and metastatic origin of these lesions (Figure 2L). Similar analyses were performed on brain tissue from injected mice to identify those that had developed brain metastases and to characterize the histopathological features of these lesions (Figures 2M, 2N). These analyses confirmed the melanocytic and metastatic origin of these tumors as well as loss of PTEN and positivity for P-AKT, and P-ERK (Figures 2O–2R).
Expression and activation of focal adhesion factors are altered in melanomas expressing AKT1E17K
The AKT1E17K cohort exhibited the lowest mean survival and highest incidence of brain metastasis of all mutant AKT cohorts tested. To identify key effectors essential for AKT1E17K-dependent metastasis, we performed reverse phase protein array (RPPA) on five primary tumors samples from each cohort. For RPPA, protein samples were probed for 245 different epitopes and 15% (36/245) were significantly different (p ≤ 0.05) between AKT1E17K and control tumors (Figure 3A). Several PI3K/AKT-pathway-related proteins were differentially regulated in the AKT1E17K –positive tumors compared with controls (Figure S3A). Of these proteins, c-KIT (downregulated; p = 0.0255), and p70-S6K1 (downregulated; p = 0.0346) were found to exhibit consistent patterns of dysregulation in patient brain-metastatic melanomas compared with non-brain metastatic melanomas (TCGA data) (20). However, downregulation of c-KIT and p70-S6K1 would not be predicted to enhance tumor progression. Interestingly, we found that paxillin, a FA factor known for the ability to stimulate cell motility, was upregulated in both AKT1E17K mouse tumors compared with controls (p = 0.0060), as well as patient brain-metastatic melanomas compared with non-brain metastatic melanomas (p = 0.0138). This finding revealed a potential AKT1 downstream effector that contributes to brain metastasis. Likewise, a second FA factor, phospho-focal adhesion kinase (Y397) (P-FAK) was also upregulated in AKT1E17K mouse tumors compared with controls (p = 0.0016); however, P-FAK was not an included epitope in the TCGA RPPA panel. The Y397 phosphorylation event in FAK acts as a molecular switch that promotes focal adhesion turnover and ultimately drives cell motility (21). Paxillin is one of several FA scaffolding proteins recruited to nascent FAs by P-FAK and is a necessary component of the FA turnover process (22). RPPA analysis of tumors from AKT2E17K or AKT3E17K cohorts revealed no differential regulation of P-FAK or paxillin compared with controls (Figures S3B, S3C, respectively).
Figure 3.
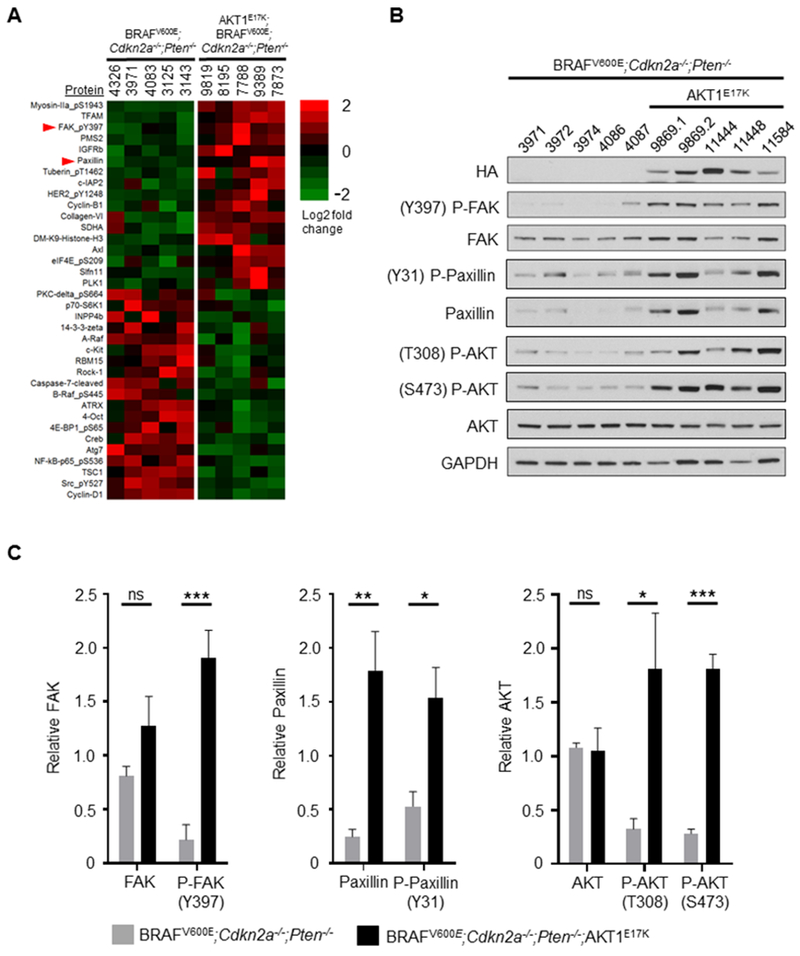
Phospho-FAK (P-FAK; Y397), paxillin, and phospho-paxillin (P-Paxillin; Y31) are upregulated in AKT1E17K-positive primary tumors. A, Reverse phase protein array (RPPA) was performed on BRAFV600E;Cdkn2a−/−;Pten−/− (control) and BRAFV600E;Cdkn2a−/−;Pten−/−;AKT1E17K (AKT1E17K-positive) primary tumors to identify differentially regulated proteins and phospho-proteins between the two groups. Significant results (p ≤ 0.05) are presented as a heatmap based on log2 fold change. B, Immunoblot analysis was performed on control and AKT1E17K-positive tumors followed by C, densitometry analysis from three independent blots to quantify total protein levels in each group. A significant increase in P-FAK expression (p = 0.0004), paxillin (p = 0.0030), P-paxillin (p = 0.0130), P-AKT (T308) (p = 0.0227), and P-AKT (S473) (p < 0.0001) was detected in AKT1E17K-positive tumors compared with controls. The numbers listed at the top of each column for (A) and (B) represent individual mouse numbers; 9869.1 and 9869.2 denote two separate primary tumors from mouse 9869. Significant differences between groups were determined using a two-tailed unpaired t-test. P values are as follows: p < 0.05 (*), p < 0.01 (**), p < 0.001 (***). ns = not significant.
To validate these findings, protein levels of P-FAK, total FAK, phospho-paxillin (P-paxillin), and total paxillin were measured in five AKT1E17K and five control primary tumors via immunoblot (Figure 3B). Consistent with the RPPA data, a significant increase in the relative levels of P-FAK and total paxillin was observed in the AKT1E17K tumors compared with control tumors (p = 0.0004 and 0.0030 respectively). P-paxillin (Y31), which was not included in the RPPA analysis, similarly exhibited an increase in AKT1E17K tumors compared with controls (p = 0.0130) (Figure 3C). This is consistent with P-FAK-mediated phosphorylation of paxillin on Y31. A significant increase in the relative levels of P-AKT (T308) (p = 0.0227) and (S473) (p < 0.0001) was also observed in the AKT1E17K tumors compared with controls (Figure 3C). IHC analysis of P-FAK, paxillin, and P-paxillin in primary tumors was consistent with the immunoblot results (Figure S4). These data suggest that the AKT1E17K mutant potentiates AKT signaling beyond that of Pten loss alone.
FAK and paxillin have been widely reported to promote cancer cell motility and have been implicated in tumor progression and metastasis (23), including in melanoma where FAK has been shown to have a role in proliferation, motility, and invasion (24,25). FAK and paxillin are critical for FA disassembly (FA turnover), which involves a FAK-Src-paxillin complex, although the precise mechanism(s) are unclear (26). Consistent with these reports, our data suggest that the increase in P-FAK, paxillin, and P-paxillin by AKT1E17K may contribute to tumor cell spreading. Because only a small fraction of the RPPA platform was dedicated to FA factors, we set out to determine whether additional FA proteins were differentially expressed between AKT1E17K and control tumors. RNA was isolated from the same primary tumors used in the RPPA analysis and subjected to RNA sequencing. Of the ten primary tumors sequenced, one AKT1E17K tumor did not pass quality control procedures and thus was excluded from further examination. Assessment of global differential gene expression by principal component analysis and unsupervised hierarchical clustering of gene expression profiles revealed that samples within each cohort clustered together appropriately (Figures S5A). The majority of the most highly differentially expressed genes were downregulated in AKT1E17K tumors compared with controls (Figure S5B). In contrast, out of 18 different FA genes that have reported roles in FA assembly and/or disassembly (21), 16 of these genes were upregulated in AKT1E17K tumors compared with controls (Figures 4A, 4B). These data strongly suggest that AKTE17K has a critical role in upregulating several FA factors.
Figure 4.
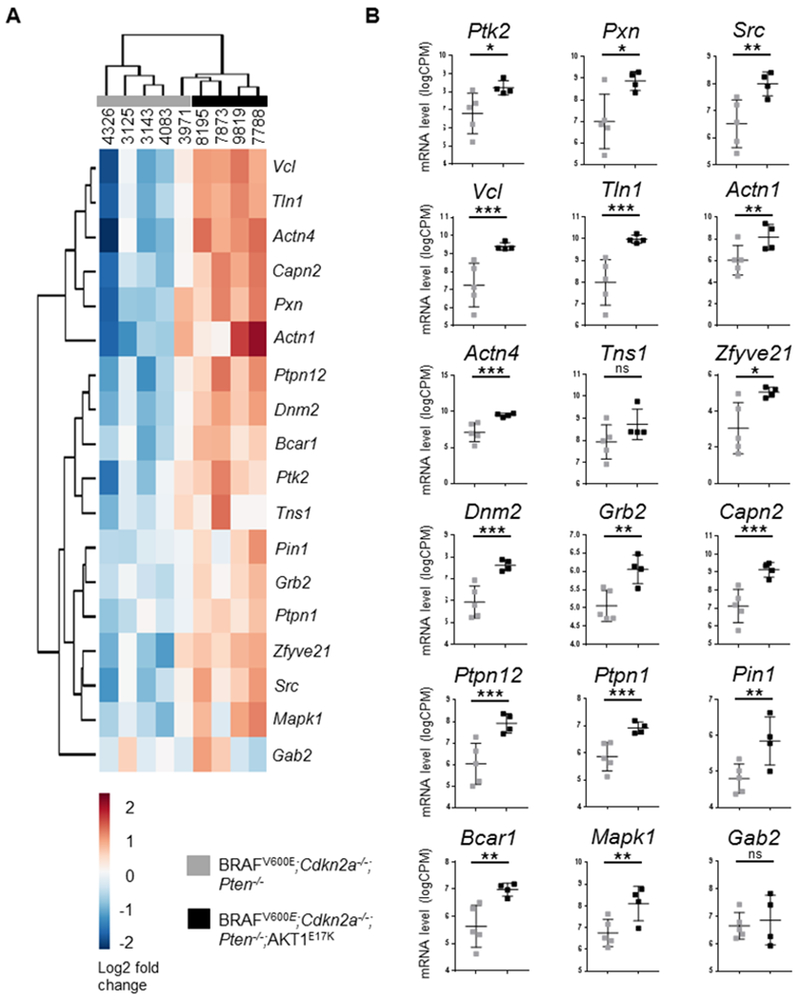
Expression of AKT1E17K promotes the upregulation of focal adhesion factors. The mRNA levels of 18 focal adhesion factors were compared between BRAFV600E;Cdkn2a−/−;Pten−/− (control, gray) and BRAFV600E;Cdkn2a−/−;Pten−/−;AKT1E17K (AKT1E17K-positive, black) primary tumors. A, Dendrogram with heat-map using unsupervised hierarchical clustering of focal adhesion factors illustrates similarities in gene expression profiles within groups. B, Expression of AKT1E17K promoted the upregulation of FAK (Ptk2) (p = 0.0173), Paxillin (Pxn) (p = 0.0116), Src (p = 0.0026), Vcl (p = 0.0005), Tln1 (p = 0.0001), Actn1 (p = 0.0098), Actn4 (p = 0.0002), Zfyve21 (p = 0.0299), Dnm2 (p = 3.2 × 10⁻⁵), Grb2 (p = 0.0051), Capn2 (p = 2.2 × 10⁻⁵), Ptpn12 (p = 0.0003), Ptpn1 (p = 0.0007), Pin1 (p = 0.0083), Bcar1 (p = 0.0017), and Mapk1 (p = 0.0018). An adjusted p value generated by a Benjamini-Hochberg correction was used to determine significant differences between groups. P values are as follows: p < 0.05 (*), p < 0.01 (**), p < 0.001 (***). ns = not significant.
Expression of AKT1E17K alters integrin expression
Expression patterns of alpha and beta integrin genes were also assessed between AKT1E17K and control tumors. Integrin proteins link the actin cytoskeleton to the extracellular matrix (ECM) by forming transmembrane heterodimers. The proteins not only provide an anchor to the ECM required for cell motility during myosin II contraction of actin filaments, but channel mechanical information from the ECM through intracellular FAs to modulate cell responses to the external environment. Each cohort retained similar integrin gene expression profiles within their respective groups (Figure S6A), but 14 of 27 integrins were differentially expressed between the AKT1E17K cohort compared with the controls with 6 genes significantly upregulated (Itgav, Itga5, Itga8, Itgbl1, Itgb1, and Itgb5) and 8 genes significantly downregulated (Itgad, Itgae, Itgal, Itgax, Itga2b, Itga10, Itga11, and Itgb6) in the AKT1E17K tumors (Figure S6B). These data indicate that AKTE17K also influences the expression of integrins.
AKT1E17K promotes melanoma cell migration and invasion
To test whether expression of AKT1E17K promotes cell motility and/or proliferation in vitro, we utilized Yale University Mouse Melanoma (YUMM) cell line 1.1, which expresses BRAFV600E and is deficient for Cdkn2a and Pten (27). These molecular alterations mirror the tumors within our control cohort. The YUMM 1.1 cells were used to generate isogenic cell lines that stably express either wild type AKT1 or AKT1E17K (Figure 5A). Immunofluorescence followed by total internal reflection fluorescence (TIRF) and confocal microscopy was used to further visualize AKT1E17K and FAs in these cells. Distinct paxillin puncta, indicative of FA formation, were located primarily at the cell periphery in both the parental and AKT1E17K cells; in some cases, AKT1E17K co-localized with paxillin (Figure 5B).
Figure 5.
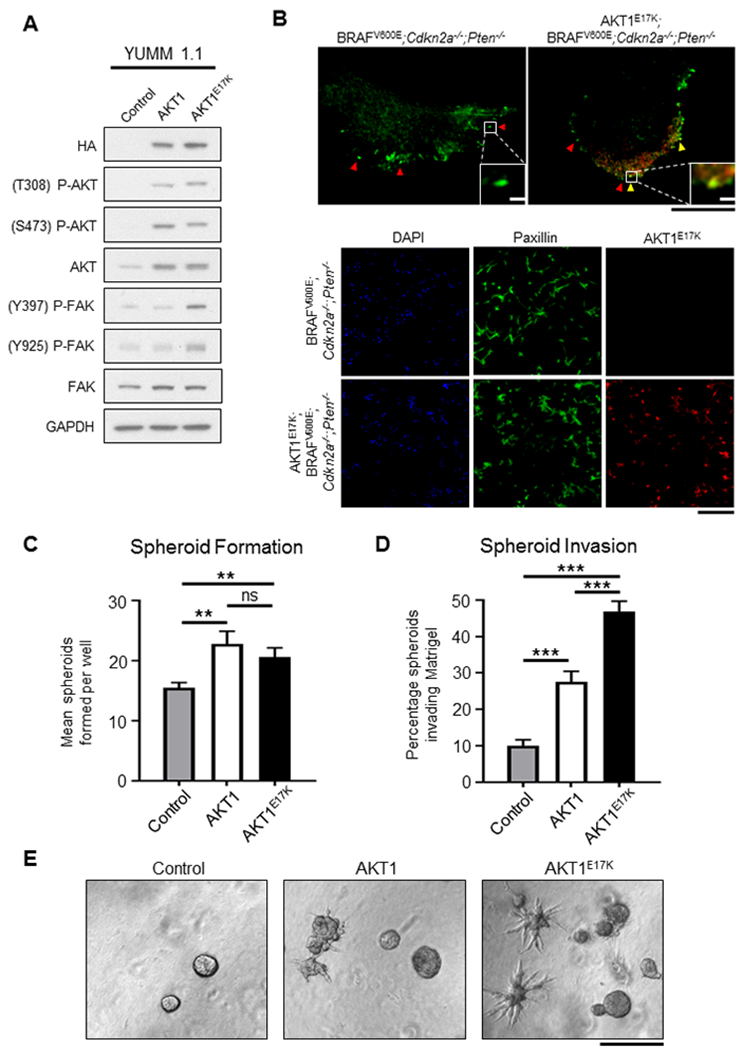
Expression of AKT1E17K activates FAK and promotes invasion of melanoma spheroids. A, Yale University Mouse Melanoma (YUMM 1.1; BRAFV600E;Cdkn2a−/−;Pten−/−) cells engineered to express wild type AKT1 or AKT1E17K. Expression of either AKT1 or AKT1E17K resulted in upregulation of P-AKT (T308 and S473) compared with the control parental cell line but P-FAK (Y397 and Y925) was only elevated in cells expressing AKT1E17K. B, Immunofluorescence used to detect paxillin (green) and AKT1E17K (red) in YUMM 1.1 cells. Upper panel depicts a single YUMM 1.1 control (left) and AKT1E17K-expressing cell (right). Red arrows specify paxillin puncta, demonstrating the formation of focal adhesions (FAs). Yellow arrows denote the co-localization of paxillin and AKT1E17K in FAs. Black scale bar represents 20 µm; white scale bar represents 2 µm. Lower panel depicts immunofluorescence of multiple YUMM 1.1 cells. AKT1E17K expression was abundant in YUMM 1.1 cells engineered to express AKT1E17K (red). DAPI stain (blue) was used to label nuclei. Scale bar represents 400 µm. C, YUMM 1.1 Control, AKT1, or AKT1E17K cells were plated on Matrigel and the number of melanoma spheroids formed were counted on day 5. Expression of AKT1 promoted spheroid formation compared with controls (p = 0.0038), as did AKT1E17K compared with controls (p = 0.0041). There was no difference in spheroid formation between AKT1 and AKT1E17K conditions. The mean number of spheroids formed for each condition were compared using an unpaired t test (n > 15 for each condition). D, The number of spheroids in (C) that were found to invade the ECM was increased in both the AKT1 condition and the AKT1E17K condition compared with controls (p = 5 × 10⁻⁶ and 8 × 10⁻¹⁵, respectively). AKT1E17K-induced invasion was also significantly elevated compared with AKT1 (p = 3 × 10⁻⁵). The percentage of spheroids that invaded the ECM for each condition was compared using an unpaired t test. E, Representative images of YUMM 1.1 control, AKT1 and AKT1E17K conditions are shown. Scale bar represents 1 mm. P values are as follows: p < 0.05 (*), p < 0.01 (**), p < 0.001 (***). ns = not significant.
Cell proliferation assays were performed at multiple time points over 5 days in the presence or absence of growth factors. With the exception of an increase in proliferation for cells expressing wild type AKT1 compared with the parental cells on day 5 (Figure S7A), no differences were observed between conditions (Figure S7B). These data suggests that AKT1E17K does not confer a proliferative advantage compared with controls in this context. When the same cells were plated on Matrigel, an increase in the ability of AKT1E17K and wild type AKT1 expressing cells to form melanoma spheroids compared with the parental cells was observed (p = 0.0041 and 0.0038, respectively; Figure 5C). However, because wild type AKT1 expression does not confer a metastatic phenotype in vivo (Table S1), the increased capacity of AKT1 expressing cells to form spheroids in this context does not translate to the pro-metastatic phenotype seen in vivo by AKT1E17K tumors. This distinction could potentially be explained by differences in invasive capacity. Indeed, we observed almost a five-fold increase in the number of AKT1E17K-expressing spheroids that invaded the ECM compared with the parental cells (p = 8 × 10⁻¹⁵), but less than a three-fold increase in invasion with cells expressing wild type AKT1 compared with the parental cells (p = 3 × 10⁻⁵) (Figures 5D, 5E). These data suggest that AKT1 signaling increases the ability of melanoma cells to invade the ECM and that the oncogenic mutation of AKT1 (E17K) enhances this effect.
To determine whether AKT1E17K promotes cell migration, we performed a transwell migration assay using the isogenic YUMM 1.1 cell lines. AKT1E17K-expressing cells demonstrated a substantial increase in their ability to migrate through transwell pores towards a chemoattractant compared with both the parental cells (p = 0.0006) and cells expressing wild type AKT1 (p = 0.0046) (Figures 6A, 6B). These data demonstrate that unlike wild type AKT1, AKT1E17K promotes migration in this context.
Figure 6.
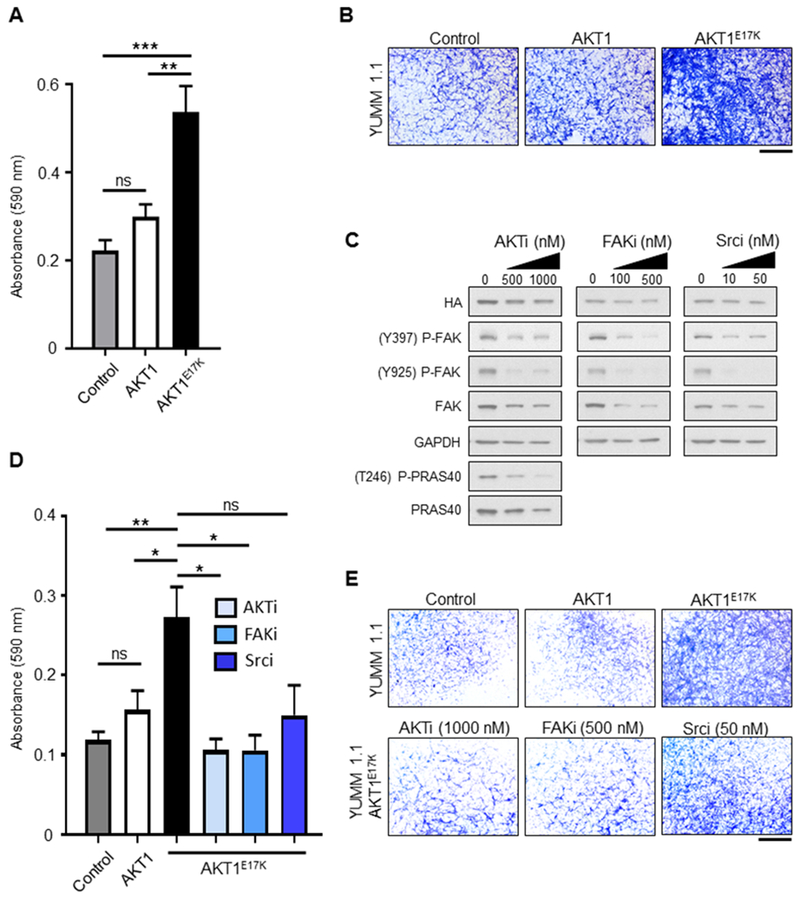
Expression of AKT1E17K promotes transwell migration and invasion. A, YUMM 1.1 control, wild type AKT1, or AKT1E17K-expressing cells were plated on the apical surface of transwells. The ability of cells to migrate through pores towards a chemoattractant was measured on day 3. Cells on the basolateral side of the transwells were fixed and stained with crystal violet. The relative absorbance of solubilized crystal violet was compared between conditions using an unpaired t test (n = 6 for each condition). AKT1E17K-expressing cells demonstrated enhanced migration compared with control (p = 0.0006) and AKT1 cells (p = 0.0046). B, Representative images of crystal violet staining for each condition in the migration assay are shown. Scale bar represents 1 mm. C, YUMM 1.1 AKT1E17K-expressing cells were treated with either DMSO vehicle control, 500 or 1000 nM GSK-2141795 (AKTi), 100 or 500 nM PF-573228 (FAKi), or 10 or 50 nM Dasatinib (Srci) daily for 5 days. Immunoblot analysis demonstrated targeted inhibition of P-FAK (Y397 and Y925) for drug-treated cells, as well as P-PRAS40 (T246) for AKTi-treated cells. D, YUMM 1.1 control, wild type AKT1, or AKT1E17K-expressing cells were plated on the apical surface of transwells above a layer of Matrigel in media supplemented with DMSO vehicle control (n = 10 transwells per condition); AKT1E17K-expressing cells were additionally plated in 1000 nM AKTi, 500 nM FAKi, or 50 nM Srci (n = 4 transwells per condition). The ability of cells to invade through Matrigel and pores towards a chemoattractant was measured on day 5. Cells on the basolateral side of the transwells were processed as per the migration assay in (A). AKT1E17K-expressing cells (black bar) demonstrated enhanced invasion compared with control cells (gray bar) (p = 0.0010) and AKT1 expressing cells (white bar) (p = 0.0186). Inhibition of AKT (checkered box) and FAK (diagonally lined box) significantly reduced invasion of AKT1E17K-expressing cells (p = 0.0200 and 0.0205, respectively). The difference between AKT1E17K-expressing cells (DMSO) and those treated with the Src inhibitor (horizontally lined box) was not significant (p = 0.0847). E, Representative images of crystal violet staining for each condition in the invasion assay are shown. Scale bar represents 1 mm. P values are as follows: p < 0.05 (*), p < 0.01 (**), p < 0.001 (***). ns = not significant.
Inhibition of AKT or FAK reduces AKT1E17K-mediated invasion
We next sought to determine whether pharmacological inhibition of AKT or FAK interferes with cell invasion. To address this question, parental, AKT1, and AKT1E17K-expressing isogenic YUMM 1.1 cells were plated into Matrigel-coated transwell chambers and treated with vehicle alone, 1000 nM GSK-2141795 (AKT inhibitor), 500 nM PF-573228 (FAK inhibitor), or 50 nM Dasatinib (Src inhibitor). Src acts at the intersection of the FAK-initiated FA assembly and disassembly by forming a complex with FAK and phosphorylating several key FAK tyrosine residues, one of which (Y925) stimulates FA turnover (21). Each compound was found to reduce levels of P-FAK (Y397 and Y925) in culture (Figure 6C). Expression of AKT1E17K significantly enhanced the ability of cells to invade compared with both the parental (p = 0.0010) and AKT1 isogenic cells (p = 0.0186) (Figures 6D, 6E), consistent with our observations of spheroid invasion and transwell migration. Inhibition of either AKT or FAK significantly reduced the invasion of AKT1E17K-expressing cells (p = 0.0200 and 0.0205, respectively) compared with vehicle only treated AKT1E17K-expressing cells (Figure 6D, 6E). Although inhibition of Src trended towards decreased invasive capacity of AKT1E17K-expressing cells, this difference was not significant compared with vehicle only treated AKT1E17K-expressing cells (p = 0.0847). Collectively, these data indicate that AKT1E17K promotes invasion of mouse melanoma cells in a FAK-dependent manner. Importantly, the invasive phenotype of oncogenic AKT1 can be impaired by pharmacological inhibition of either AKT or FAK.
Either PTEN loss or AKT1E17K expression is sufficient for brain colonization
While enhanced invasive properties allow the melanoma cells to exit the primary tumor site, it is unclear if activation of the PI3K/AKT pathway is sufficient to allow circulating tumor cells to colonize distal organs, including the brain, and promote tumor growth in these distant sites. To test this, we generated three primary tumor cell lines with variations in PI3K/AKT activity from Dct::TVA mice: 5610 (BRAFV600E;Cdkn2a−/−), 9678 (BRAFV600E;Cdkn2a−/−;Pten−/−), and 7788 (BRAFV600E;Cdkn2a−/−;Pten−/−;AKT1E17K) (Figure 7A, 7B). Each of the three cell lines were injected into the tail vein of NOD scid gamma (NSG) mice to assess the ability of each cell line to colonize lungs. All mice, regardless of the cell line injected, developed detectable lung lesions (Figure 7C). To assess the ability to colonize the brain, each of the three cell lines were injected intracranially into NSG mice. Mice injected with 5610 remained healthy for the duration of the study whereas all mice injected with either 9678 or 7788 demonstrated signs of illness and were euthanized prior to the experimental endpoint. The brains of all mice were examined post-necropsy, sectioned, and stained with H&E in an effort to detect melanoma growth. All mice injected with 9678 and 7788 were found to have detectable brain lesions whereas no mice injected with 5610 had detectable lesions (Figure 7D); these differences were statistically significant (p = 0.0119 and 0.0048, respectively) (Figure 7E). Expression of AKT1E17K in the 5610 cell line (5610E17K) (Figure 7A, 7B) and intracranial injection of this cell line, resulted in illness and early euthanasia for all mice. Additionally, all mice injected with 5610E17K were found to have detectable brain lesions (Figure 7D, 7E) and this was statistically significant when compared with mice injected with the 5610 parental line (p = 0.0048). These data indicate that while aberrant PI3K/AKT pathway signaling does not appear to impact the ability of tumor cells to promote lung colonization, it does promote melanoma brain colonization either through Pten loss, expression of AKT1E17K, or both.
Figure 7.
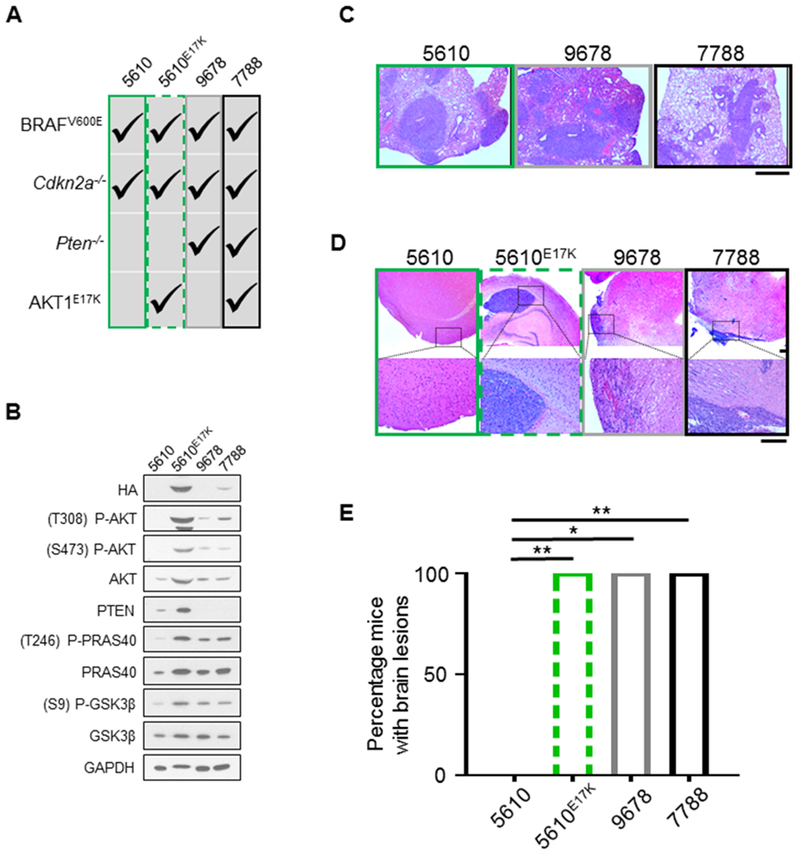
Aberrant PI3K/AKT pathway activity promotes melanoma brain colonization. A, The following primary tumor cell lines sourced from Dct::TVA mice were used: 5610 (BRAFV600E;Cdkn2a−/−) (green box), 5610E17K (BRAFV600E;Cdkn2a−/−;AKT1E17K) (green dashed box), 9678 (BRAFV600E;Cdkn2a−/−>;Pten−/−) (gray box), and 7788 (BRAFV600E;Cdkn2a−/−;Pten−/−;AKT1E17K) (black box). Alterations within each cell line are denoted by check marks. B, The four cell lines listed in (A) were subject to immunoblot analysis; results demonstrate hyperactivity of canonical PI3K/AKT pathway signaling in cells deficient in Pten and/or those that express AKT1E17K as evidenced by an increase in P-AKT, P-PRAS40, and P-GSK3β. C, H&E staining was used to detect lesions in the lung tissue sections of all mice. Mean survival ± SEM are reported for each cohort and all mice injected with 5610 (31.3 ± 1.7, n = 6), 9678 (29.2 ± 1.9, n = 6), or 7788 (35.5 ± 0.3, n = 6) developed lesions. Representative images are shown. Scale bar represents 1 mm. D, H&E staining was used to detect lesions in brain tissue sections of all mice. Representative images of a normal brain from the 5610 cohort, and brains with detectable lesions from the 5610E17K, 9678, and 7788 cohorts are shown. Scale bar represents 200 µm. E, Mean survival ± SEM are reported for each cohort and no mice intracranially injected with cell line 5610 (150 day endpoint, n = 6) developed detectable lesions, whereas all mice injected with cell lines 5610E17K (64.3 ± 8.6 days, n = 4) (green dashed box), 9678 (28.7 ± 0.7 days, n = 3) (gray box), or 7788 (32.8 ± 0.8 days, n = 4) (black box) were found to have tumor growth in the brain and these differences were statistically significant (p = 0.0048, 0.0119, and 0.0048, respectively). A Fisher’s exact test (two-tailed) was used to determine significant differences in incidence. P values are as follows: p < 0.05 (*), p < 0.01 (**), p < 0.001 (***). ns = not significant.
Discussion
We performed an objective and comprehensive in vivo analysis of three separate AKT activating mutations (E17K, E40K, or Q79K) in each of the three AKT paralogs on melanoma progression using an established autochthonous mouse model of melanoma. Each of the AKT mutants used in this study engender constitutive activation of the protein (9,10,19,28). The mechanism of AKT constitutive activation was elegantly described by Carpten et al. in 2007 using the E17K mutant, whereby the lysine substitution of glutamic acid at amino acid 17 was shown through x-ray crystallography to disrupt the intramolecular interactions that occur between the PH domain and kinase domain. This perturbation forces a conformational change in the protein resulting in increased affinity of the PH domain for phosphatidylinositols at the plasma membrane where the protein is phosphorylated (10). Since this time, dozens of amino acid substitutions in the PH domain of AKT that are predicted to interfere with the PH-Kinase domain interface have been shown to promote kinase hyperactivity, including those found in cancers (9).
To measure the impact of AKT activating mutations on melanoma, we used overall survival and the incidence of metastasis as readouts of disease progression. We discovered a mutant-dependent effect on survival for all three AKT paralogs. Although AKT2 and AKT3-mutant tumors reduced the survival of mice compared with BRAFV600E;Cdkn2a−/−;Pten−/− control tumors in some cases, they did not significantly promote lung and brain metastasis. However, an analysis of AKT1 mutants in the same context, revealed that AKT1E17K-positive tumors not only reduced the survival of mice compared with controls, but also increased the incidence of brain metastasis to nearly 40% (Figure 1D). This discovery is particularly noteworthy as AKT1 was reported in one study to be “the most important hub gene” as determined by the PageRank algorithm used to identify top hub genes in melanoma (29), and to exhibit the “second highest centrality score” in melanoma as determined by an algorithm that combines PageRank with closeness and betweenness (30). Furthermore, the E17K substitution in AKT1 is the most common mutation found among all AKT paralogs in human cancer, representing over one-third of AKT1 mutations in cBioPortal (31). Specific to melanoma, cBioPortal indicates that ~3% of these tumors have missense substitutions in AKT1. Of those, the most common is the hotspot mutation AKT1E17K, which represents 17% of these mutations. Recent evidence also suggests that this alteration may be a more common occurrence in advanced melanomas that are resistant to MAPK inhibition. Shi et al., detected AKT1E17K in a melanoma that had acquired resistance to BRAFi (vemurafenib), but this mutation was not detected in the pre-treated tumor (11).
The differences in tumorigenic potential among E17K, E40K, and Q79K variants of each AKT paralog is likely due to the unique molecular features imparted by each amino acid substitution. Indeed, Parikh et al., reported that AKT1 wild-type, E17K, and Q79K variants possessed varying magnitudes of intramolecular interactions between the PH and kinase domains as well as contrasting levels of phospho-AKT (S473) (9). These differences may in turn, produce a range of conformational modifications that could ultimately influence activity, including PH domain affinity for phosphatidylinositols, intrinsic kinase activity, differential activation of downstream substrates, as well as the capacity to confer differential exposure to substrates as a result of changes in subcellular localization. As such, any potential functional modification between variants of a single AKT paralog would likely translate to corresponding paralogs, for which unique target substrates have already been identified.
In order to develop mechanistic insight into the molecular and cell biological features that cause AKT1E17K-positive tumors to metastasize to the brain, we used RPPA to screen for differentially regulated proteins and phospho-proteins in control versus AKT1E17K-positive primary tumors. FA factors P-FAK and paxillin were found to be among the most highly upregulated factors in AKT1E17K-positive tumors compared with controls. Functionally, FAK and paxillin are intimately involved in stimulating FA turnover processes that promote cell motility and have been implicated in the metastasis of numerous malignancies through their phosphorylation and activation (23). RNA sequencing analyses of the same primary tumors revealed that the mRNA levels of the vast majority of FA genes we examined were upregulated in AKT1E17K-positive tumors compared with controls. Among all FA factors examined, several have been implicated in driving melanoma progression, including Dnm2 (32), Pin1 (33,34), Bcar1 (24), Actn4 (35), and Itgav (36).
These results led us to hypothesize that the melanoma brain metastases that emerge in our in vivo model may be at least partially explained by an increase in tumor cell invasiveness during an early step in the metastatic cascade when efficient assembly and disassembly of FA structures are critical determinants of this process. To test this hypothesis, we first utilized YUMM 1.1 (BRAFV600E;Cdkn2a−/−;Pten−/−) mouse melanoma cells that stably expressed AKT1E17K or wild type AKT1. AKT1E17K-expressing cells displayed enhanced invasion of melanoma spheroids, increased migration, and increased invasion through Matrigel compared with the parental and isogenic cells expressing wild type AKT1. Secondly, we performed in vivo studies using primary tumor cell lines derived from Dct::TVA mice. Both BRAFV600E;Cdkn2a−/−;Pten−/− and BRAFV600E;Cdkn2a−/−;Pten−/−;AKT1E17K melanoma readily colonized the lungs of mice when introduced directly into the circulation. This suggests that the failure of BRAFV600E;Cdkn2a−/−;Pten−/− melanoma to metastasize is likely the result of a diminished capacity to enter the circulation.
The FA assembly and disassembly processes that stimulate cell motility in response to external cues are well coordinated but highly complex. Although many FA proteins have been identified, the precise interactions that occur between FA factors and the consequences of those interactions on cell behavior are not completely understood and often context-dependent. To date, nearly 100 FA factors had been identified (37), many of which remain largely uncharacterized. What remains apparent is that activation of FAK is an early and key event that orchestrates FA turnover and cell motility. We previously reported cooperation between Pten loss and activation of AKT1 in the formation of melanoma lung and brain metastases but the mechanism of cooperation was not clear (17). Interestingly, PTEN has been shown to co-precipitate with FAK and paxillin in colorectal cancer cells, and more importantly, to dephosphorylate Y397 on FAK in glioblastoma and breast cancer cells. This dephosphorylation event diminishes the capacity of P-Src to bind and phosphorylate additional tyrosine residues on FAK, resulting in a reduced ability of the cells to form FAs (38,39). Furthermore, P-FAK has been found to phosphorylate PTEN on Y336, an event that enhances PTEN phosphatase activity in an apparent negative feedback loop that prevents an overabundance of intracellular P-FAK and results in repression of cell motility (38,40). In our melanomas, deficiency of Pten was not sufficient to induce brain metastases despite a presumed increase in FAK activity compared with wild type Pten melanomas (BRAFV600E;Cdkn2a−/−). This suggests that further activation of FAK by AKT1 (beyond that of Pten loss alone) is required to promote FA turnover, increase tumor invasion, and ultimately elicit brain metastasis.
Several lines of evidence support the hypothesis that AKT1E17K promotes brain metastasis through activation of FAK. AKT1E17K-positive primary tumors express considerably higher levels of P-AKT than the Pten−/− tumors and this increase in P-AKT correlates with increased P-FAK (Figure 3C). Although conventionally FAK has been considered an upstream activator of AKT signaling (41), more recently it has been shown to be a direct target of AKT1. In mouse embryonic fibroblasts, AKT1 phosphorylates S695 and T700 on FAK (42) and in human colon cancer cells AKT1 phosphorylates S517, S601, and S695 on FAK (43,44). These phosphorylation events precede and stimulate FAK autophosphorylation of Y397. These studies provide evidence of a direct link between AKT1 and FAK and assert that FAK activation in this context is not simply an associative event, which co-occurs with P-AKT, but rather the direct result of AKT1-mediated phosphorylation. In addition, pharmacological inhibition of FAK or AKT in AKT1E17K-positive mouse melanomas not only diminishes the levels of P-FAK (Figure 6C) but also decreases cell invasion through Matrigel (Figure 6D). Furthermore, while our findings imply FAK-mediated tumor cell invasion, an independent study suggests that FAK also induces melanoma transendothelial migration. Jouve et al. demonstrated that pharmacological inhibition of FAK reduced transmigration of B16 mouse melanoma cells across a monolayer of lung endothelial cells (45), a finding that is relevant for both intravasation and extravasation. Collectively, these data point to a model consistent with a threshold effect. Pten loss alone does not promote brain metastases, however it is sufficient for intracranial growth of melanoma cells following direct injection into the brain (Figure 7D, 7E). The combination of AKT1E17K expression coupled with Pten loss yields persistently elevated levels of P-FAK. An abundance of P-FAK in turn promotes an increase in cell motility and the ability to transmigrate across endothelial barriers thereby allowing the melanoma cells to more effectively spread to distant sites. Although the cell invasion data using FAKi suggests a causal link between AKT1 and FAK in disease progression, further experiments using pharmacological or genetic inhibition of FAK in vivo are required to demonstrate that FAK activation drives melanoma brain metastasis in this context.
One obvious question pertains to the physiological relevancy of AKT1E17K mutations coupled with PTEN loss in human melanoma. AKT1E17K occurs at a low frequency but spans over a large range of cancers, including melanoma (9,31), whereas a loss or deficiency in PTEN is particularly common in melanoma (4,5). To our knowledge, a comprehensive analysis evaluating the degree of mutual exclusivity of AKT mutations coupled with PTEN loss in melanoma has not been performed. One study designed to partially address this question was performed using colorectal cancer tissue whereby 2,631 cases of cancer were examined for the presence of AKT1E17K. Of colorectal carcinomas found to harbor this mutation, 33-38% were estimated to be accompanied by PTEN loss (46). Future studies designed to answer this question in melanoma will be important to establish the physiological relevancy of this cooperation.
While the restoration of tumor suppressor genes such as PTEN remains a colossal therapeutic challenge in cancer biology, numerous compounds designed to molecularly target and inhibit kinases such as AKT and FAK have been developed. Many AKT inhibitors have already demonstrated remarkable specificity and efficacy, with low toxicity (47), and although less well-studied clinically, FAK inhibitors have also shown promise as effective suppressors of FAK activity (23,48). Because the three AKT paralogs are capable of inducing opposing effects on tumor progression, as has been demonstrated in breast cancer (14), the option to pharmacologically target AKT for patients with melanomas that exhibit hyper-activated PI3K/AKT signaling may require careful consideration. However, because none of the paralog-specific AKT mutant tumors from our in vivo studies offered a protective effect compared with controls, our results suggest that indiscriminant inhibition of all AKT paralogs using a pan-inhibitor would not be detrimental to melanoma therapy. Whether pan-inhibition of AKT in this context offers a survival benefit remains to be determined.
Historically, the use of AKT inhibitors as monotherapies in clinical trials have either failed, or produced modest anti-tumor effects (49). Current clinical trials using AKT or FAK inhibitors as anti-cancer agents primarily focus on combinatorial treatment regimens. Hirata et al., found that while BRAF mutant patient-derived xenograft melanomas failed FAK inhibitor monotherapy, the combination of BRAF and FAK inhibition led to a prolonged period of tumor control – a phenomenon that persisted even after tumors developed resistance to mutant BRAF inhibitor monotherapy. The mechanism of resistance to single agent BRAF inhibition in this study was attributed to BRAF inhibitor-dependent melanoma-associated fibroblast-mediated remodeling of the ECM. Interestingly, this event was shown to stimulate FAK signaling in melanoma cells, which in turn reactivated the MAPK signaling pathway (50). Our findings in conjunction with studies such as these, highlight the role of FAK as an important proto-oncogene in melanoma, and one that may be particularly relevant to BRAF-mutated melanoma. Further studies will determine whether inhibition of AKT and/or FAK in combination with other pathway targeted agents is a rationale therapeutic strategy in this disease.
Supplementary Material
Implications.
This study suggests that AKT1E17K promotes melanoma brain metastasis through activation of focal adhesion kinase and provides a rationale for the therapeutic targeting of AKT and/or FAK to reduce melanoma metastasis.
Acknowledgements
We thank members of the Davies, VanBrocklin, McMahon, Mendoza, and Holmen labs as well as W. Pavan, M. Bosenberg, A.J. Lazar, C. Stubben, C. Conley, A. Welm, B. Welm, and T. Oliver for providing mouse strains, reagents, vectors and/or advice. We thank Rowan Arave for assistance with figures. We thank the Huntsman Cancer Institute Vivarium staff for assistance with mouse husbandry and the Preclinical Research Resource (PRR) for assistance with tumor cell injections. We acknowledge the use of the DNA Synthesis Core, the DNA Sequencing Core, the Fluorescence Microscopy Core, and the Flow Cytometry Core at the University of Utah. Microscopy equipment was obtained using a NCRR Shared Equipment Grant # 1S10RR024761-01. We also acknowledge the use of the HCI Shared Resources for Research Informatics (RI), Cancer Biostatistics (CB), High-Throughput Genomics and Bioinformatics Analysis (GBA), and the Biorepository and Molecular Pathology (BMP) Research Histology Section supported by P30CA042014 awarded to HCI from the National Cancer Institute. Flow cytometry research reported in this publication was supported by the National Center for Research Resources of the National Institutes of Health under Award Number 1S10RR026802-01. RPPA analyses were performed at the Functional Proteomics Core Facility at the M.D. Anderson Cancer Center, which is supported by a National Cancer Institute (NCI) Cancer Center Support Grant (P30CA016672). This work was supported by R01CA121118 (SLH) from the National Cancer Institute and 347651 (SLH) from the Melanoma Research Alliance.
Financial Support: NIH R01CA121118 and MRA 347651 for S.L.H.
Footnotes
Declaration of interests: The authors declare no potential conflicts of interest.
References
- 1.Sandru A, Voinea S, Panaitescu E, Blidaru A. Survival rates of patients with metastatic malignant melanoma. Journal of medicine and life 2014;7(4):572–6. [PMC free article] [PubMed] [Google Scholar]
- 2.Shapiro DG, Samlowski WE. Management of melanoma brain metastases in the era of targeted therapy. J Skin Cancer 2011;2011:845863 doi 10.1155/2011/845863. [DOI] [PMC free article] [PubMed] [Google Scholar]
- 3.Dai DL, Martinka M, Li G. Prognostic Significance of Activated Akt Expression in Melanoma: A Clinicopathologic Study of 292 Cases. Journal of Clinical Oncology 2005;23(7):1473–82 doi 10.1200/jco.2005.07.168. [DOI] [PubMed] [Google Scholar]
- 4.Zhou XP, Gimm O, Hampel H, Niemann T, Walker MJ, Eng C. Epigenetic PTEN silencing in malignant melanomas without PTEN mutation. Am J Pathol 2000;157(4):1123–8 doi 10.1016/S0002-9440(10)64627-5. [DOI] [PMC free article] [PubMed] [Google Scholar]
- 5.Bucheit AD, Chen G, Siroy A, Tetzlaff M, Broaddus R, Milton D, et al. Complete Loss of PTEN Protein Expression Correlates with Shorter Time to Brain Metastasis and Survival in Stage IIIB/C Melanoma Patients with BRAFV600 Mutations. Clinical Cancer Research 2014;20(21):5527–36 doi 10.1158/1078-0432.ccr-14-1027. [DOI] [PMC free article] [PubMed] [Google Scholar]
- 6.Davies MA, Stemke-Hale K, Lin E, Tellez C, Deng W, Gopal YN, et al. Integrated Molecular and Clinical Analysis of AKT Activation in Metastatic Melanoma. Clinical Cancer Research 2009;15(24):7538–46 doi 10.1158/1078-0432.ccr-09-1985. [DOI] [PMC free article] [PubMed] [Google Scholar]
- 7.Govindarajan B, Sligh JE, Vincent BJ, Li M, Canter JA, Nickoloff BJ, et al. Overexpression of Akt converts radial growth melanoma to vertical growth melanoma. The Journal of Clinical Investigation 2007;117(3):719–29 doi 10.1172/jci30102. [DOI] [PMC free article] [PubMed] [Google Scholar]
- 8.Davies MA, Stemke-Hale K, Tellez C, Calderone TL, Deng W, Prieto VG, et al. A novel AKT3 mutation in melanoma tumours and cell lines. Br J Cancer 2008;99(8):1265–8. [DOI] [PMC free article] [PubMed] [Google Scholar]
- 9.Parikh C, Janakiraman V, Wu WI, Foo CK, Kljavin NM, Chaudhuri S, et al. Disruption of PH-kinase domain interactions leads to oncogenic activation of AKT in human cancers. Proceedings of the National Academy of Sciences of the United States of America 2012;109(47):19368–73 doi 10.1073/pnas.1204384109. [DOI] [PMC free article] [PubMed] [Google Scholar]
- 10.Carpten JD, Faber AL, Horn C, Donoho GP, Briggs SL, Robbins CM, et al. A transforming mutation in the pleckstrin homology domain of AKT1 in cancer. Nature 2007;448(7152):439–44 doi 10.1038/nature05933. [DOI] [PubMed] [Google Scholar]
- 11.Shi H, Hong A, Kong X, Koya RC, Song C, Moriceau G, et al. A novel AKT1 mutant amplifies an adaptive melanoma response to BRAF inhibition. Cancer discovery 2014;4(1):69–79 doi 10.1158/2159-8290.CD-13-0279. [DOI] [PMC free article] [PubMed] [Google Scholar]
- 12.Nogueira C, Kim KH, Sung H, Paraiso KH, Dannenberg JH, Bosenberg M, et al. Cooperative interactions of PTEN deficiency and RAS activation in melanoma metastasis. Oncogene 2010;29(47):6222–32 doi 10.1038/onc.2010.349. [DOI] [PMC free article] [PubMed] [Google Scholar]
- 13.Liu SL, Wang ZG, Hu Y, Xin Y, Singaram I, Gorai S, et al. Quantitative Lipid Imaging Reveals a New Signaling Function of Phosphatidylinositol-3,4-Bisphophate: Isoform- and Site-Specific Activation of Akt. Molecular cell 2018;71(6):1092–104 e5 doi 10.1016/j.molcel.2018.07.035. [DOI] [PMC free article] [PubMed] [Google Scholar]
- 14.Riggio M, Perrone MC, Polo ML, Rodriguez MJ, May M, Abba M, et al. AKT1 and AKT2 isoforms play distinct roles during breast cancer progression through the regulation of specific downstream proteins. Sci Rep 2017;7:44244 doi 10.1038/srep44244. [DOI] [PMC free article] [PubMed] [Google Scholar]
- 15.Grottke A, Ewald F, Lange T, Norz D, Herzberger C, Bach J, et al. Downregulation of AKT3 Increases Migration and Metastasis in Triple Negative Breast Cancer Cells by Upregulating S100A4. PLoS One 2016;11(1):e0146370 doi 10.1371/journal.pone.0146370. [DOI] [PMC free article] [PubMed] [Google Scholar]
- 16.Madhunapantula SV, Robertson GP. Therapeutic Implications of Targeting AKT Signaling in Melanoma. Enzyme Res 2011;2011:327923 doi 10.4061/2011/327923. [DOI] [PMC free article] [PubMed] [Google Scholar]
- 17.Cho JH, Robinson JP, Arave RA, Burnett WJ, Kircher DA, Chen G, et al. AKT1 Activation Promotes Development of Melanoma Metastases. Cell reports 2015;13(5):898–905 doi 10.1016/j.celrep.2015.09.057. [DOI] [PMC free article] [PubMed] [Google Scholar]
- 18.Vivanco I, Chen ZC, Tanos B, Oldrini B, Hsieh WY, Yannuzzi N, et al. A kinase-independent function of AKT promotes cancer cell survival. Elife 2014;3 doi 10.7554/eLife.03751. [DOI] [PMC free article] [PubMed] [Google Scholar]
- 19.Aoki M, Batista O, Bellacosa A, Tsichlis P, Vogt PK. The akt kinase: molecular determinants of oncogenicity. Proceedings of the National Academy of Sciences of the United States of America 1998;95(25):14950–5. [DOI] [PMC free article] [PubMed] [Google Scholar]
- 20.Cancer Genome Atlas N. Genomic Classification of Cutaneous Melanoma. Cell 2015;161(7):1681–96 doi 10.1016/j.cell.2015.05.044. [DOI] [PMC free article] [PubMed] [Google Scholar]
- 21.Nagano M, Hoshino D, Koshikawa N, Akizawa T, Seiki M. Turnover of focal adhesions and cancer cell migration. Int J Cell Biol 2012;2012:310616 doi 10.1155/2012/310616. [DOI] [PMC free article] [PubMed] [Google Scholar]
- 22.Deakin NO, Turner CE. Paxillin comes of age. J Cell Sci 2008;121(Pt 15):2435–44 doi 10.1242/jcs.018044. [DOI] [PMC free article] [PubMed] [Google Scholar]
- 23.Kanteti R, Batra SK, Lennon FE, Salgia R. FAK and paxillin, two potential targets in pancreatic cancer. Oncotarget 2016;7(21):31586–601 doi 10.18632/oncotarget.8040. [DOI] [PMC free article] [PubMed] [Google Scholar]
- 24.Hamamura K, Furukawa K, Hayashi T, Hattori T, Nakano J, Nakashima H, et al. Ganglioside GD3 promotes cell growth and invasion through p130Cas and paxillin in malignant melanoma cells. Proceedings of the National Academy of Sciences of the United States of America 2005;102(31):11041–6 doi 10.1073/pnas.0503658102. [DOI] [PMC free article] [PubMed] [Google Scholar]
- 25.Kaneda T, Sonoda Y, Ando K, Suzuki T, Sasaki Y, Oshio T, et al. Mutation of Y925F in focal adhesion kinase (FAK) suppresses melanoma cell proliferation and metastasis. Cancer letters 2008;270(2):354–61 doi 10.1016/j.canlet.2008.05.042. [DOI] [PubMed] [Google Scholar]
- 26.Hu YL, Lu S, Szeto KW, Sun J, Wang Y, Lasheras JC, et al. FAK and paxillin dynamics at focal adhesions in the protrusions of migrating cells. Sci Rep 2014;4:6024 doi 10.1038/srep06024. [DOI] [PMC free article] [PubMed] [Google Scholar]
- 27.Meeth K, Wang JX, Micevic G, Damsky W, Bosenberg MW. The YUMM lines: a series of congenic mouse melanoma cell lines with defined genetic alterations. Pigment Cell Melanoma Res 2016;29(5):590–7 doi 10.1111/pcmr.12498. [DOI] [PMC free article] [PubMed] [Google Scholar]
- 28.Shi H, Hugo W, Kong X, Hong A, Koya RC, Moriceau G, et al. Acquired resistance and clonal evolution in melanoma during BRAF inhibitor therapy. Cancer discovery 2014;4(1):80–93 doi 10.1158/2159-8290.CD-13-0642. [DOI] [PMC free article] [PubMed] [Google Scholar]
- 29.Zhao J, Zeng X, Song P, Wu X, Shi H. AKT1 as the PageRank hub gene is associated with melanoma and its functional annotation is highly related to the estrogen signaling pathway that may regulate the growth of melanoma. Oncol Rep 2016;36(4):2087–93 doi 10.3892/or.2016.5048. [DOI] [PubMed] [Google Scholar]
- 30.Regan-Fendt KE, Xu J, DiVincenzo M, Duggan MC, Shakya R, Na R, et al. Synergy from gene expression and network mining (SynGeNet) method predicts synergistic drug combinations for diverse melanoma genomic subtypes. NPJ Syst Biol Appl 2019;5:6 doi 10.1038/s41540-019-0085-4. [DOI] [PMC free article] [PubMed] [Google Scholar]
- 31.Yi KL, Josh. Recurrent AKT mutations in human cancers: functional consequences and effects on drug sensitivity. Oncotarget 2015;7(4):4241–51. [DOI] [PMC free article] [PubMed] [Google Scholar]
- 32.Baldassarre M, Pompeo A, Beznoussenko G, Castaldi C, Cortellino S, McNiven MA, et al. Dynamin participates in focal extracellular matrix degradation by invasive cells. Mol Biol Cell 2003;14(3):1074–84 doi 10.1091/mbc.e02-05-0308. [DOI] [PMC free article] [PubMed] [Google Scholar]
- 33.Jin J, Zhang Y, Li Y, Zhang H, Li H, Yuan X, et al. RNA-interference-mediated downregulation of Pin1 suppresses tumorigenicity of malignant melanoma A375 cells. Neoplasma 2013;60(1):92–100 doi 10.4149/neo_2013_013. [DOI] [PubMed] [Google Scholar]
- 34.Kruiswijk F, Hasenfuss SC, Sivapatham R, Baar MP, Putavet D, Naipal KA, et al. Targeted inhibition of metastatic melanoma through interference with Pin1-FOXM1 signaling. Oncogene 2016;35(17):2166–77 doi 10.1038/onc.2015.282. [DOI] [PMC free article] [PubMed] [Google Scholar]
- 35.Shao H, Li S, Watkins SC, Wells A. alpha-Actinin-4 is required for amoeboid-type invasiveness of melanoma cells. The Journal of biological chemistry 2014;289(47):32717–28 doi 10.1074/jbc.M114.579185. [DOI] [PMC free article] [PubMed] [Google Scholar]
- 36.Alonso SR, Tracey L, Ortiz P, Perez-Gomez B, Palacios J, Pollan M, et al. A high-throughput study in melanoma identifies epithelial-mesenchymal transition as a major determinant of metastasis. Cancer Res 2007;67(7):3450–60 doi 10.1158/0008-5472.CAN-06-3481. [DOI] [PubMed] [Google Scholar]
- 37.Lo SH. Focal adhesions: what’s new inside. Dev Biol 2006;294(2):280–91 doi 10.1016/j.ydbio.2006.03.029. [DOI] [PubMed] [Google Scholar]
- 38.Haier J, Nicolson GL. PTEN regulates tumor cell adhesion of colon carcinoma cells under dynamic conditions of fluid flow. Oncogene 2002;21(9):1450–60 doi 10.1038/sj.onc.1205213. [DOI] [PubMed] [Google Scholar]
- 39.Tamura M, Gu J, Danen EH, Takino T, Miyamoto S, Yamada KM. PTEN interactions with focal adhesion kinase and suppression of the extracellular matrix-dependent phosphatidylinositol 3-kinase/Akt cell survival pathway. The Journal of biological chemistry 1999;274(29):20693–703. [DOI] [PubMed] [Google Scholar]
- 40.Tzenaki N, Aivaliotis M, Papakonstanti EA. Focal adhesion kinase phosphorylates the phosphatase and tensin homolog deleted on chromosome 10 under the control of p110delta phosphoinositide-3 kinase. FASEB J 2015;29(12):4840–52 doi 10.1096/fj.15-274589. [DOI] [PubMed] [Google Scholar]
- 41.Sonoda Y, Watanabe S, Matsumoto Y, Aizu-Yokota E, Kasahara T. FAK is the upstream signal protein of the phosphatidylinositol 3-kinase-Akt survival pathway in hydrogen peroxide-induced apoptosis of a human glioblastoma cell line. The Journal of biological chemistry 1999;274(15):10566–70. [DOI] [PubMed] [Google Scholar]
- 42.Higuchi M, Kihara R, Okazaki T, Aoki I, Suetsugu S, Gotoh Y. Akt1 promotes focal adhesion disassembly and cell motility through phosphorylation of FAK in growth factor-stimulated cells. J Cell Sci 2013;126(Pt 3):745–55 doi 10.1242/jcs.112722. [DOI] [PubMed] [Google Scholar]
- 43.Basson MD, Zeng B, Wang S. Akt1 binds focal adhesion kinase via the Akt1 kinase domain independently of the pleckstrin homology domain. J Physiol Pharmacol 2015;66(5):701–9. [PubMed] [Google Scholar]
- 44.Wang S, Basson MD. Akt directly regulates focal adhesion kinase through association and serine phosphorylation: implication for pressure-induced colon cancer metastasis. American journal of physiology Cell physiology 2011;300(3):C657–70 doi 10.1152/ajpcell.00377.2010. [DOI] [PMC free article] [PubMed] [Google Scholar]
- 45.Jouve N, Bachelier R, Despoix N, Blin MG, Matinzadeh MK, Poitevin S, et al. CD146 mediates VEGF-induced melanoma cell extravasation through FAK activation. Int J Cancer 2015;137(1):50–60 doi 10.1002/ijc.29370. [DOI] [PubMed] [Google Scholar]
- 46.Hechtman JF, Sadowska J, Huse JT, Borsu L, Yaeger R, Shia J, et al. AKT1 E17K in Colorectal Carcinoma Is Associated with BRAF V600E but Not MSI-H Status: A Clinicopathologic Comparison to PIK3CA Helical and Kinase Domain Mutants. Mol Cancer Res 2015;13(6):1003–8 doi 10.1158/1541-7786.MCR-15-0062-T. [DOI] [PMC free article] [PubMed] [Google Scholar]
- 47.Nitulescu GM, Margina D, Juzenas P, Peng Q, Olaru OT, Saloustros E, et al. Akt inhibitors in cancer treatment: The long journey from drug discovery to clinical use (Review). Int J Oncol 2016;48(3):869–85 doi 10.3892/ijo.2015.3306. [DOI] [PMC free article] [PubMed] [Google Scholar]
- 48.Kanteti R, Mirzapoiazova T, Riehm JJ, Dhanasingh I, Mambetsariev B, Wang J, et al. Focal adhesion kinase a potential therapeutic target for pancreatic cancer and malignant pleural mesothelioma. Cancer biology & therapy 2018;19(4):316–27 doi 10.1080/15384047.2017.1416937. [DOI] [PMC free article] [PubMed] [Google Scholar]
- 49.Brown JS, Banerji U. Maximising the potential of AKT inhibitors as anti-cancer treatments. Pharmacol Ther 2017;172:101–15 doi 10.1016/j.pharmthera.2016.12.001. [DOI] [PMC free article] [PubMed] [Google Scholar]
- 50.Hirata E, Girotti MR, Viros A, Hooper S, Spencer-Dene B, Matsuda M, et al. Intravital imaging reveals how BRAF inhibition generates drug-tolerant microenvironments with high integrin beta1/FAK signaling. Cancer Cell 2015;27(4):574–88 doi 10.1016/j.ccell.2015.03.008. [DOI] [PMC free article] [PubMed] [Google Scholar]
- 51.Dankort D, Filenova E, Collado M, Serrano M, Jones K, McMahon M. A new mouse model to explore the initiation, progression, progressionand therapy of BRAFV600E-induced lung tumors. Genes Dev 2007;21(4):379–84 doi 10.1101/gad.1516407. [DOI] [PMC free article] [PubMed] [Google Scholar]
- 52.VanBrocklin MW, Robinson JP, Lastwika KJ, Khoury JD, Holmen SL. Targeted delivery of NRASQ61R and Cre-recombinase to post-natal melanocytes induces melanoma in Ink4a/Arflox/lox mice. Pigment Cell & Melanoma Research 2010;23(4):531–41 doi 10.1111/j.1755-148X.2010.00717.x. [DOI] [PMC free article] [PubMed] [Google Scholar]
- 53.Zheng H, Ying H, Yan H, Kimmelman AC, Hiller DJ, Chen AJ, et al. p53 and Pten control neural and glioma stem/progenitor cell renewal and differentiation. Nature 2008;455(7216):1129–33 doi 10.1038/nature07443. [DOI] [PMC free article] [PubMed] [Google Scholar]
- 54.Loftus SK, Larson DM, Watkins-Chow D, Church DM, Pavan WJ. Generation of RCAS vectors useful for functional genomic analyses. DNA Res 2001;8(5):221–6. [DOI] [PubMed] [Google Scholar]
- 55.Bromberg-White JL, Webb CP, Patacsil VS, Miranti CK, Williams BO, Holmen SL. Delivery of short hairpin RNA sequences by using a replication-competent avian retroviral vector. J Virol 2004;78(9):4914–6. [DOI] [PMC free article] [PubMed] [Google Scholar]
Associated Data
This section collects any data citations, data availability statements, or supplementary materials included in this article.