Abstract
Translesion synthesis (TLS) has emerged as a mechanism through which several forms of cancer develop acquired resistance to first-line genotoxic chemotherapies by allowing replication to continue in the presence of damaged DNA. Small molecules that inhibit TLS hold promise as a novel class of anti-cancer agents that can serve to enhance the efficacy of these front-line therapies. We previously utilized a structure-based rational design approach to identify the phenazopyridine scaffold as an inhibitor of TLS that functions by disrupting the protein-protein interaction (PPI) between the C-terminal domain of the TLS DNA polymerase Rev1 (Rev1-CT) and the Rev1 interacting regions (RIR) of other TLS DNA polymerases. To continue the identification of small molecules that disrupt the Rev1-CT/RIR PPI, we generated a pharmacophore model based on the phenazopyridine scaffold and utilized it in a structure-based virtual screen. In vitro analysis of promising hits identified several new chemotypes with the ability to disrupt this key TLS PPI. In addition, several of these compounds enhanced the efficacy of cisplatin in cultured cells, highlighting their anti-TLS potential.
Keywords: pharmacophore, virtual screening, translesion synthesis, Rev1-CT, cancer
Graphical Abstract
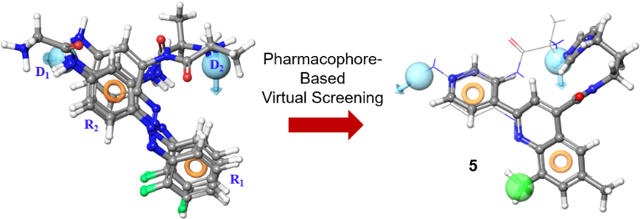
We utilized a pharmacophore-based virtual screen to identify novel small molecule scaffolds that disrupt the protein-protein interaction (PPI) between the C-terminal domain of Rev1 and the Rev1 interacting region present in multiple translesion synthesis (TLS) polymerases. This PPI is essential for the proper function of TLS and its disruption demonstrates promise as an anti-cancer therapeutic target.
Introduction
Translesion synthesis (TLS) is an important cellular mechanism through which proliferating cells bypass DNA lesions during replication.[1–3] While this mechanism is responsible for rescuing cells during active replication, it does so at the expense of an increased mutation rate in the surviving cells.[4–5] The role of TLS in promoting cell survival has resulted in its emergence as a potential target for the development of a new class of anti-cancer agents.[3,6–7] In the context of cancer treatment, TLS promotes tumor cell survival in the presence of first-line genotoxic chemotherapies, which can ultimately lead to acquired resistance to the first-line therapy.[4–5] Disruption of TLS can sensitize cancers to genotoxic agents and reduce mutagenesis in tumors, suggesting that combination therapy with a TLS inhibitor could enhance the efficacy of first-line agents and prevent chemoresistance.[3,6–7]
Proper TLS function requires the concerted effort of multiple DNA polymerases in complex with the DNA clamp PCNA to control a series of switching events that ensure this mechanism is only recruited to rescue replication stalled at DNA lesions.[1–2,8–9] Several of these switching events are mediated by protein-protein interactions (PPIs) between the C-terminal domain of the Y-family polymerase Rev1 (Rev1-CT) and the Rev1 interacting regions (RIR) from the Y-family polymerases polη, polκ, polι, and polζ.[10–13] We recently identified the first small molecules (Figure 1A, 1-2) that disrupt the Rev1-CT/RIR PPI.[14–16] These compounds increase sensitivity to cisplatin and reduce cisplatin-mediated mutagenesis in human cancer cells, highlighting their potential as combination therapies for various forms of cancer.
Figure 1.
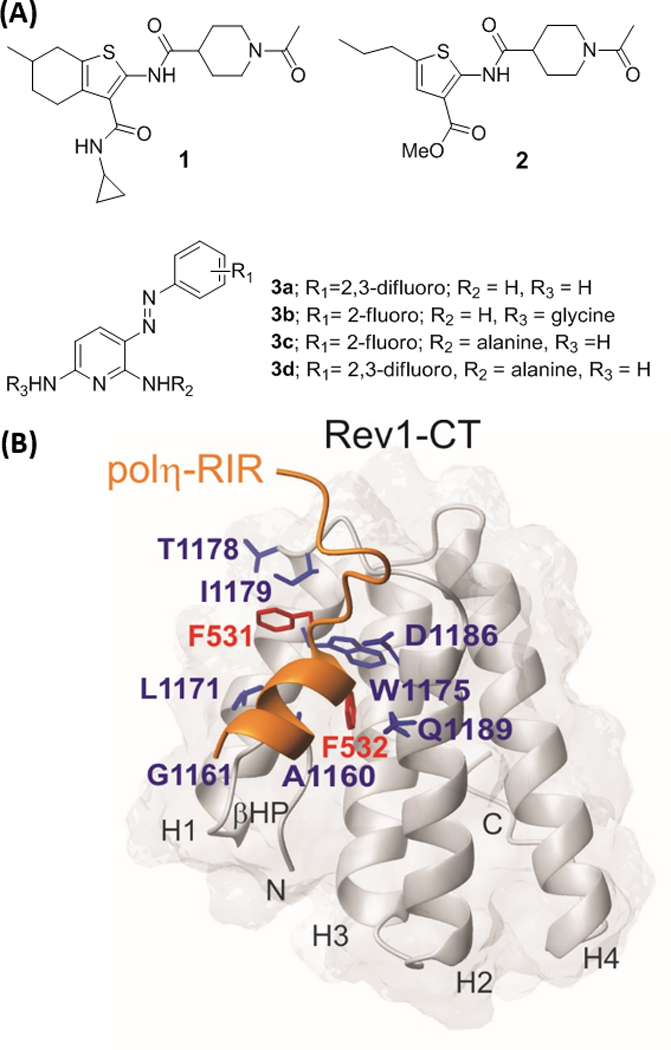
(A) Small molecule scaffolds that disrupt the Rev1-CT/RIR PPI. (B) Key amino acid residues at the Rev1-CT (blue) and polη-RIR (red) interface.
In addition to our de novo biochemical screening efforts, we also utilized a computationally-aided rational design approach to identify a small molecule scaffold that disrupts the Rev1-CT/RIR PPI.[15] The RIR motif contains a peptide sequence consisting of two Phe residues flanked by an N-cap residue and four helix forming residues (-nFFhhhh-), which serve as a ‘recognition sequence’ for binding to Rev1-CT.[10–11] This peptide motif orients the two Phe residues in the proper conformation to interact with a hydrophobic binding pocket and an adjacent surface groove on Rev1-CT (Figure 1B). We utilized the overall conformation and spatial arrangement of the Phe-Phe residues in this recognition sequence to identify the phenazopyridine (PAP, 3) scaffold as a closely related structural mimic of this key RIR structure.[15] Additional studies on the PAP scaffold demonstrated that it disrupts the Rev1-CT/RIR PPI through direct binding interactions at the RIR interface of Rev1-CT and structure-based analogue design identified initial structure-activity relationships (SAR) for the scaffold.[15] Herein, we utilized the PAP scaffold to generate a pharmacophore that was utilized in a virtual screening effort to identify several additional small molecule scaffolds that target the Rev1-CT/RIR PPI.
Results and Discussion
Initial computational studies
Common Pharmacophore Generation.
As noted above, we synthesized and evaluated a small series of PAP analogues that provided important initial SAR for this scaffold of Rev1-CT/RIR PPI inhibitors.[15] In addition, we performed extensive per-residue free energy decomposition profiling from molecular dynamics (MD) simulations of each analogue in complex with Rev1-CT to determine which amino acid residues are critical for high-affinity binding. In the present study, compounds 3a-3d were utilized to generate a pharmacophore for the PAP scaffold in regards to its ability to disrupt this PPI (Figure 2). Our previous MD studies for the core PAP scaffold demonstrated that each compound interacts with Leu1159, Ala1160, Leu1171, Gln1174, Trp1175, Ile1179, Asp1186 and Glu1189 either by hydrogen bonding or hydrophobic interactions (Figure 1B).[9]
Figure 2.
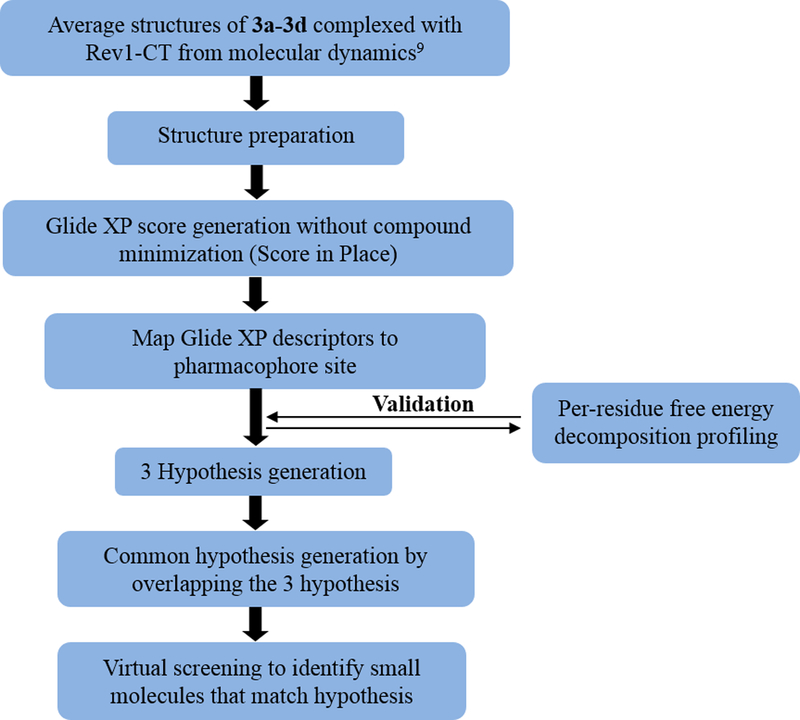
Flow chart for computational lead scaffold identification.
The average structures of 3a-3d in complex with Rev1-CT generated from our previous MD studies were prepared in the Protein Preparation Wizard (Schrödinger, 2015), which utilizes the constrain minimization method so that heavy atom strain can be relieved without significant structural modifications to the input geometry. The hydrogen atoms are not restrained, which allows the system to optimize the hydrogen bond network of each complex. First, we extracted each active ligand (3a-3d) from the corresponding complex and performed a ‘score in place’ docking in Glide XP mode to ensure that the isolated compounds adopt the same structural orientation seen in the average complex. Analysis of the root mean square deviation (RMSD) between the averaged structure and the isolated ligands in complex with Rev1-CT demonstrated that both structures correlated well when superimposed (RMSD < 0.1 Å).[15]
Next, we utilized Glide XP to automatically generate a four-point e-pharmacophore hypothesis for each active compound complexed with Rev1-CT (Figure 3). The e-pharmacophore was generated based on a ranking and scoring of important energetic terms involved in the Rev1-CT/RIR PPI. The inter-site distances among the structural features of each pharmacophore hypothesis are depicted in Figure 3. In addition, this method allows us to exclude volumes around the pharmacophore that correspond to regions of space that are occupied by the Rev1-CT binding site. Our previous per-residue ligand interaction analysis for 3a-3d demonstrated that key intermolecular interactions occur between the PAP scaffold and Gln1174, Trp1175, and Asp1186 of Rev1-CT.[15] The e-pharmacophore hypothesis generated for each of the PAP ligands correlated well with the per-residue free energy decomposition profiling highlighting that this approach could effectively map the important three-dimensional chemical features that govern affinity for the targeted binding site on Rev1-CT. Three features were generated across the four pharmacophore models: aromatic rings (R1 and R2), hydrogen bond donors (D1 and D2), and a hydrophobic moiety (H). Most notably, the e-pharmacophores for 3a-3d consisted of two aromatic rings (R1 and R2), which strongly suggests that the π-π and hydrophobic interactions between the phenyl rings and their binding region on Rev1-CT are the most important intermolecular interactions at the Rev1-CT/RIR interface. These results were not surprising considering the known importance of the hot spot Phe-Phe residues in the RIR motif.
Figure 3.
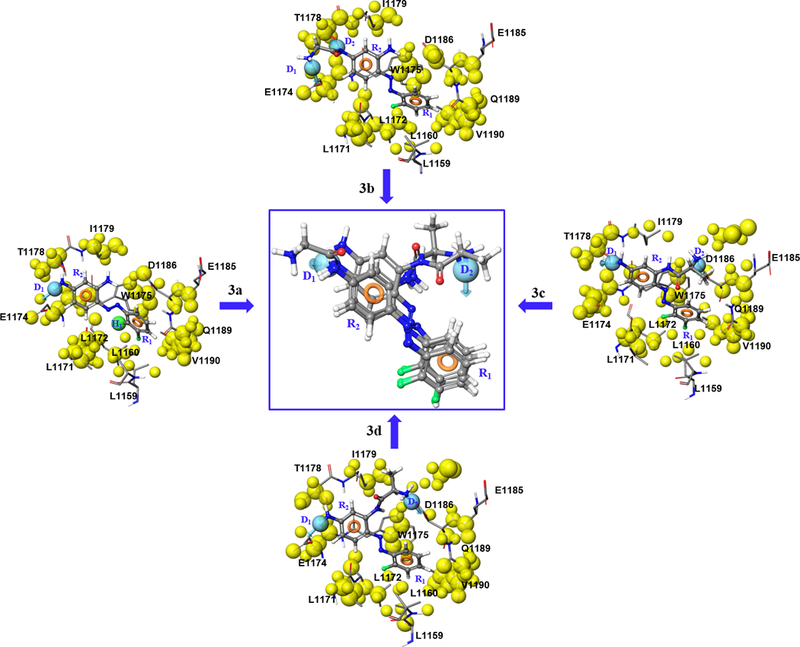
Pharmacophore generation from 3a-3d.
The energy score ranges for R1 (−1.21 to −1.49) suggest that this aromatic moiety provides stronger π-π interactions between the scaffold and Rev1-CT compared to R2 (−0.7 to −0.93) (Table 1). The aromatic planes of both aromatic rings are orthogonal to each other, with an interatomic distance ranging from 6.20–6.31 Å from the respective centers of their aromatic symmetry.[15] The structural features of these aromatic moieties closely resemble the natural orientation of the Phe-Phe amino acids in the RIR motif. The hydrogen bond donor generated across all four e-pharmacophores (D1, energy score range −0.79 to −0.90) interacts with E1174 in our models. A second hydrogen bond donor feature (D2) was identified in the e-pharmacophores generated for 3b-3d. This feature was a particularly strong component of the pharmacophore for 3c-3d (−1.26 to −1.47) due to its interaction with the key Rev1-CT residue D1186. Compound 3a exhibited an additional hydrophobic feature (H1), but the low relative energy score (−0.17) suggests it makes minimal contributions to the binding energy compared to the other features.
Table 1.
Energy scores for the features generated by the e-pharmacophore hypothesis.
| Cmpd | R1 | R2 | D1 | H | D2 |
|---|---|---|---|---|---|
| 3a | −1.49 | −0.88 | −0.88 | −0.17 | --- |
| 3b | −1.38 | −0.93 | −0.90 | --- | −0.31 |
| 3c | −1.38 | −0.83 | −0.79 | --- | −1.26 |
| 3d | −1.21 | −0.70 | −0.87 | --- | −1.47 |
Virtual screening.
The e-pharmacophore analyses of 3a-3d in complex with Rev1-CT revealed that three key features (D1R1R2) represent the minimum pharmacophore hypothesis for binding of the PAP scaffold to the RIR interface of Rev1-CT. An additional four feature model (D1R1R2D2) that depends on the presence of a side chain at the 2-position of the pyridine ring was also identified. In order to find novel chemotypes that disrupt the Rev1-CT/RIR PPI through direct binding interactions with the defined pocket on Rev1-CT, the three- and four-point pharmacophore models were utilized to screen a chemical database of approximately 150K small molecules for diverse scaffolds that satisfy the pharmacophore models (Figure 4). Initially, a pre-screen was performed to rapidly remove the majority of compounds that did not match the required features (D1R1R2D2). This pre-screen returned 5,421 hits containing the desired pharmacophoric features. For the next round of screening, conformers of the initial hits were incorporated into the compound set and a match to all four pharmacophoric features was mandatory, a process that narrowed our search down to 481 compounds. We further reduced our hit compounds by removing compound with a fitness score less than 60%. The fitness score defines the extent to which the pharmacophoric features in a particular molecule match the features present in the reference structure. This procedure reduced our hit set to 108 compounds, which were initially docked to the Rev1-CT binding pocket (PDB code 2LSI) through the high-throughput virtual screening (HTVS) protocol in Schrödinger. Compounds with a predicted docking score ≤ −4.5 were subjected to the more rigorous Glide SP docking procedure into the same Rev1-CT structure. Compounds that exhibited an SP Glide score < −5.22 were docked with Rev1-CT in XP mode, the most robust docking procedure in Glide. This final docking procedure narrowed our set to 33 compounds (XP Glide Score ≤ −4.9), which were chosen for experimental evaluation.
Figure 4.
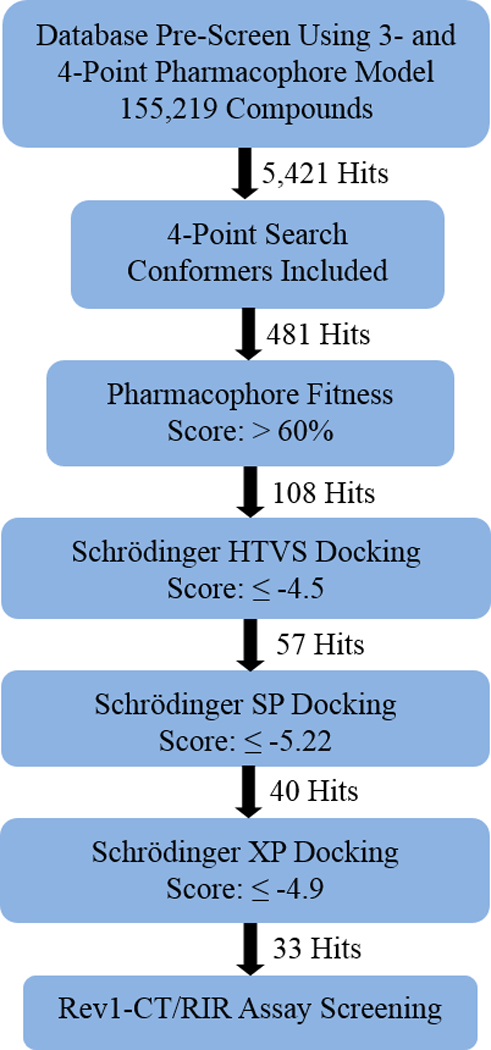
Virtual Screening Flow Chart for Hit Progression.
Biological studies.
Hit validation.
Each of the 33 compounds identified as potential hits through our computational screening approach were evaluated for their ability to disrupt the Rev1-CT/RIR PPI through our previously described fluorescence polarization (FP) assay.[14] Compounds with IC50 values less than 15 μM were classified as our primary hits (4-11, Figure 5), while those with IC50 values greater than 20 μM are shown in Supplementary Table 2. Overall, our computational docking correlated well with activity in the FP assay (Table 2). The three most potent compounds in the FP assay (4-6) also demonstrated the highest Glide XP scores for our primary hits. In addition, while several analogues (6-11) with Glide XP scores in the −4.9 to −6.0 range were promising hits in the FP assay, the majority of compounds with a docking score in this range (~80%) were weakly active or inactive. These biochemical results serve to validate our computational strategy to identify small molecules capable of disrupting the Rev1-CT/RIR PPI. In addition, we utilized the data from the FP assays to calculate predicted Kd and Ki values for each hit compound. Overall, the Kd and Ki values for the most active compounds (4-7) correlated well with the experimentally determined IC50 values. By contrast, the predicted values for the compounds that were less active in the FP assay (8-11) were everstimated, but still followed the general trend seen in the experimental assay.
Figure 5.
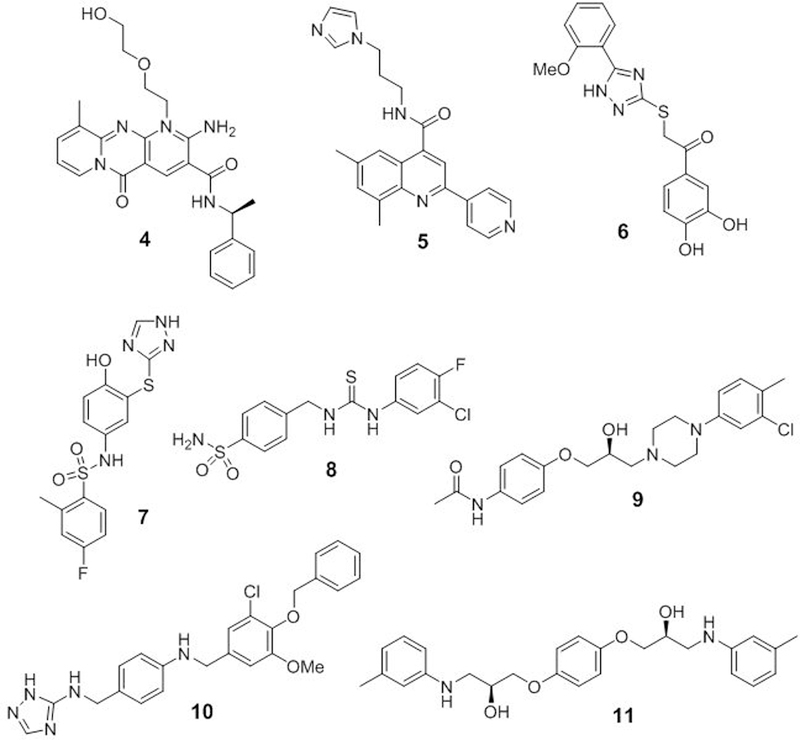
Structures of small molecule hits that disrupt the Rev1-CT/RIR PPI.
Table 2.
Docking score and initial activity for most potent hit compounds.
| Compound | Glide XP Score[a] |
IC50 (μM)b | Kd (μM)c | Ki (μM)d |
|---|---|---|---|---|
| 4 | −6.875 | 1.6 ± 0.9 | 1.8 | 2.1 |
| 5 | −6.061 | 6.7 ± 1.6 | 4.3 | 4.9 |
| 6 | −5.542 | 4.9 ± 2.5 | 5.3 | 5.9 |
| 7 | −5.485 | 9.7 ± 0.4 | 5.4 | 6.1 |
| 8 | −5.182 | 11.0 ± 6.4 | 16.4 | 18.5 |
| 9 | −5.222 | 11.4 ± 1.1 | 19.8 | 22.2 |
| 10 | −5.082 | 13.7 ± 4.2 | 40.8 | 45.6 |
| 11 | −4.946 | 9.8 ± 2.3 | 20.6 | 23.2 |
Glide Score from docking studies.
IC50 values are the mean ± SEM of at least four separate experiments performed in triplicate.
Kd values were calculated via Equation 17 in Ref 17.
Ki values were calculated via the Cheng-Prusoff Equation.
Cellular activity of promising leads.
To gain initial information about the cellular anti-TLS activity of these compounds, we evaluated the ability of our three most potent compounds (4-6) to enhance cisplatin-mediated cell killing of mouse embryonic fibroblasts (MEFs). The replicative bypass of cisplatin intrastrand crosslinks requires Rev1/polζ-mediated TLS and we have demonstrated previously that these cells are a valid model for evaluating TLS inhibitors that function via direct binding to Rev1-CT.[8–9,14,18] Each compound significantly enhanced the ability of cisplatin to kill the MEFs, albeit at concentrations (≥15 – 45 μM) higher than those that were effective for our previously reported Rev1-CT/RIR inhibitors 1/2 (Figure 6). These results clearly establish these compounds as promising leads for future development as TLS inhibitors.
Figure 6.
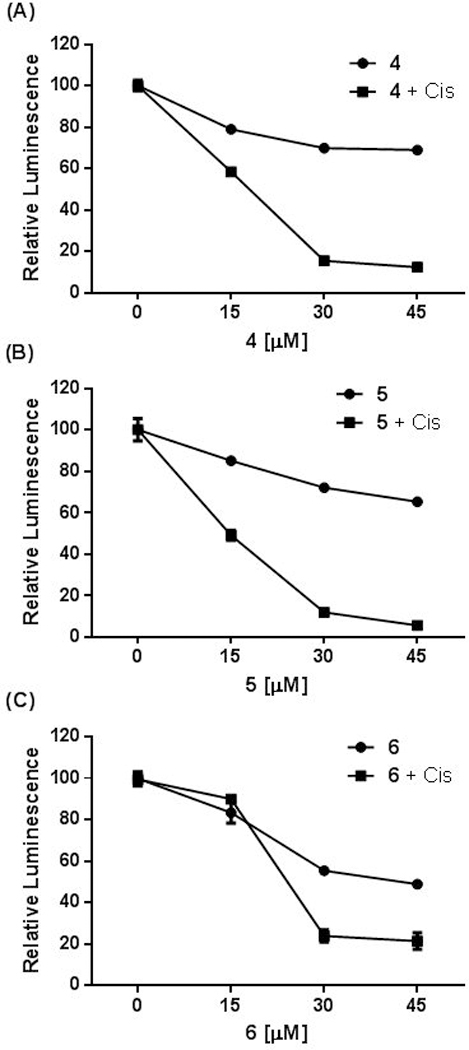
Rev1-CT/RIR PPI inhibitors enhance sensitivity to cisplatin. MEF cells were incubated with compounds 4 (A), 5 (B), and 6 (C) alone at varying concentrations or in combination with cisplatin (0.6 μM) for 24 hrs and cell viability was assessed with the Promega CellTiter-Glo® Luminescent Kit.
Post-validation molecular dynamics.
To explore the stability and dynamic properties of the Rev1-CT/compound complexes, atomistic molecular dynamics (MD, 20 ns) simulations for compounds 4-11 were performed. These MD simulations provide detailed insights into the intermolecular interactions between Rev1-CT and the small molecule that contribute to stable binding conformations. In addition, they allow us to visualize the effect ligand binding has on the overall Rev1-CT conformation.
The initial bound structures and the average structures after MD simulations were compared. The RMSD plots, which describe fluctuations in atom positions in Rev1-CT, the hit ligand, and the Rev1-CT/hit complexes during the MD simulations (Supplemental Figure 2), demonstrate that Rev1-CT converges at a higher RMSD when complexed to the hit ligands. In addition, the RMSD values for the majority of lead compounds was less than 2 Å. Taken together, these results clearly indicate that the structure of Rev1-CT is stabilized when bound to the small molecule hits (Table 3). The average short range Lennard-Jones (VLJ, van der Waals), electrostatic (VC), and total (VLJ + VC) energies were also calculated for the Rev1-CT/hit complexes (Table 4). Overall, the van der Waals interactions between Rev1-CT and the small molecule ligand contributed the most to the total binding energy for each complex.
Table 3.
RMSD values from MD simulations of the Rev1-CT/Hit complexes.
| Compound | Protein | Ligand | Complex |
|---|---|---|---|
| 4 | 2.51 ± 0.3[a] | 2.68 ± 0.2 | 2.75 ± 0.3 |
| 5 | 2.47 ± 0.2 | 2.17 ± 0.1 | 2.42 ± 0.1 |
| 6 | 2.54 ± 0.3 | 1.95 ± 0.6 | 2.75 ± 0.4 |
| 7 | 2.19 ± 0.2 | 1.49 ± 0.1 | 2.19 ± 0.2 |
| 8 | 2.42 ± 0.2 | 2.28 ± 0.4 | 2.52 ± 0.2 |
| 9 | 2.26 ± 0.3 | 1.48 ± 0.2 | 2.29 ± 0.3 |
| 10 | 2.31 ± 0.2 | 1.37 ± 0.3 | 2.34 ± 0.2 |
| 11 | 2.16 ± 0.2 | 2.80 ± 0.6 | 2.53 ± 0.3 |
Values are average ± SD.
Table 4.
Energy scores derived from MD studies on Rev1-CT/Hit complexes.
| Compound |
VLJ[a] (kcal/mol) |
Vc[b] (kcal/mol) |
VLJ+VC[c] (kcal/mol) |
|---|---|---|---|
| 4 | −27.41 ± 4.1[d] | −6.65 ± 5.4 | −34.07 ± 5.9 |
| 5 | −23.92 ± 3.4 | −9.92 ± 5.6 | −33.84 ± 4.9 |
| 6 | −21.75 ± 4.3 | −14.06 ± 6.8 | −35.18 ± 9.5 |
| 7 | −27.17 ± 2.9 | −13.02 ± 7.6 | −40.29 ± 5.3 |
| 8 | −24.13 ± 3.4 | −7.36 ± 3.9 | −31.49 ± 4.6 |
| 9 | −25.59 ± 3.4 | −9.36 ± 4.7 | −34.95 ± 4.2 |
| 10 | −23.37 ± 4.0 | −8.17 ± 2.1 | −31.54 ± 3.9 |
| 11 | −25.65 ± 3.9 | −6.12 ± 4.7 | −31.78 ± 4.3 |
VLJ = Lennard-Jones energy derived from van der Waals forces.
VC = Electrostatic energy.
VLJ +VC = Total energy.
Values are average ± SD.
Next, we evaluated the orientation of the small molecule scaffolds when complexed to the Rev1-CT binding site to more clearly determine which specific intermolecular interactions contribute most to the total interaction energies of the Rev1-CT/hit complexes (Figure 7). As noted previously, the RIR interface on Rev1-CT is characterized by a small, hydrophobic binding pocket. Not surprisingly, an aromatic moiety in each of our most potent hits penetrated into this binding site and formed strong van der Waals interactions with the hydrophobic amino acids lining the pocket (Leu1159, Ala1160, Leu1171, Leu1172, Trp1175, and Val1192). π-π stacking interactions between an aromatic moiety in 4 and 6 and Trp1175 also contributed strongly to the binding interactions. While a clear π-π interaction between 5 and Trp1175 was not predicted, the central quinoline of the scaffold is in very close proximity to the indole. Polar functional groups on each scaffold extended out of the binding pocket into the solvent accessible area, suggesting these regions can be modified to enhance scaffold solubility. Docking poses and key interactions for primary hits 7-11 are shown in Supplemental Figures 3 and 4.
Figure 7.
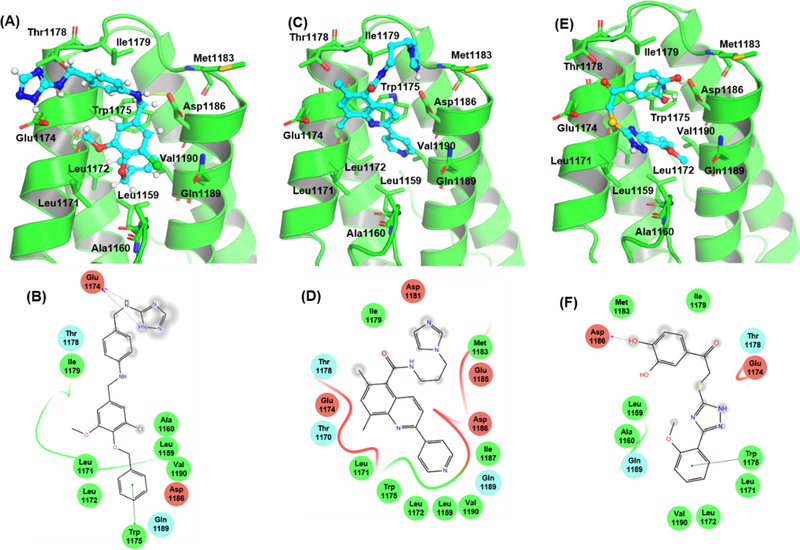
Binding conformations and key interactions with Rev1-CT for compounds 4 (A and B), 5, (C and D), and 6 (E and F). Green circles = hydrophobic residues. Red circles = negatively charged residues. Blue circles = positively charged residues. Green line = π-π interaction. Purple arrow = hydrogen bond.
Finally, we extracted the small molecule binding conformation from the most energetically favorable Rev1-CT/compound complexes and overlaid them with our generated e-pharmacophore. The overlays for our three most potent structures (Figure 8) highlight the key features of each scaffold driving its ability to disrupt the Rev1-CT/RIR PPI. Compounds 4 and 6 both shared all four structural characteristics of our four feature e-pharmacophore model (D1R1R2D2); however, the overall arrangement of these features was not a perfect fit over the four-point model. By contrast, compound 5 only shared three of the four structural features (R1, R2, and D2), but the two aromatic moities in 5 that mimic the two conserved Phe-Phe residues in the RIR motif more closely align to the e-pharmacophore structure. Overlays for the remaining hits are shown in Supplemental Figure 5.
Figure 8.
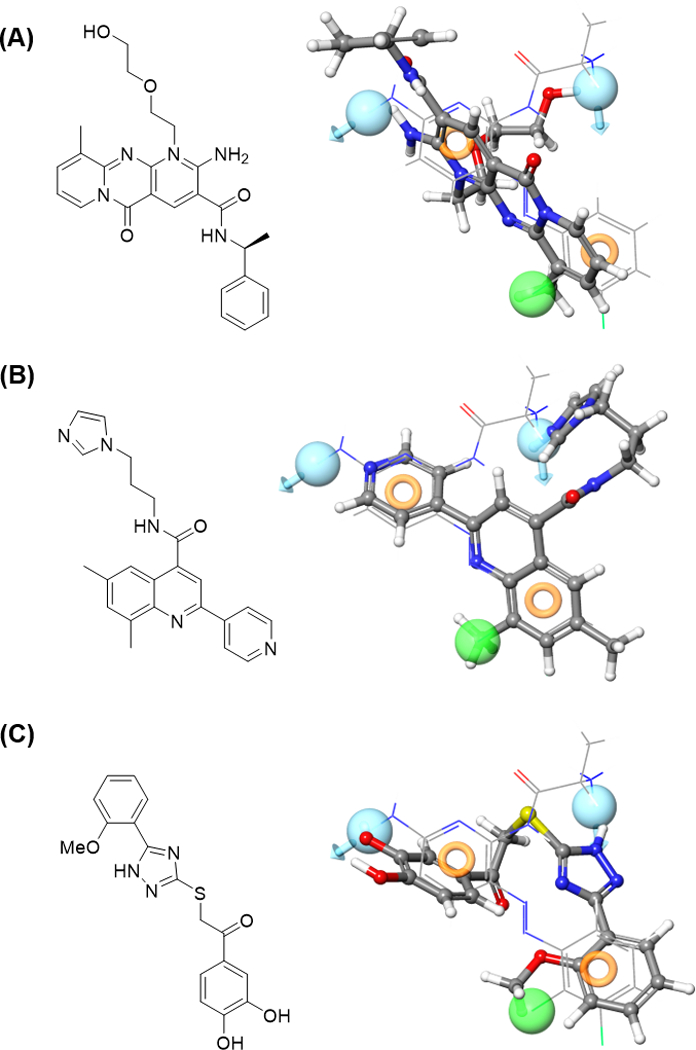
Hit scaffolds overlaid with the e-pharmacophore. Compound structures of hit compounds 4 (A), 5 (B), and 6 (C) extracted from the energetically stabilized Rev1-CT/ligand MD complexes were overlaid with our D1R1R2D2 e-pharmacophore. The compound structure is represented as ball and stick and the e-pharmacophore represented as a line structure.
Conclusions
Inhibition of TLS has emerged as a valid strategy to enhance genotoxic chemotherapy and prevent acquired resistance. We previously demonstrated that small molecule disruption of the PPI between Rev1-CT and the RIR motif present in multiple TLS polymerases inhibits TLS in cell culture.[14] In this manuscript, we generated a pharmacophore model from a small molecule scaffold known to disrupt the Rev1-CT/RIR PPI. Our pharmacophore was utilized as the basis for a structure-based virtual screening protocol to identify additional small molecule lead scaffolds that disrupt the PPI and enhance cisplatin-mediated cell killing. These scaffolds share similar structural features and interact in a comparable fashion with the RIR interface on Rev1-CT. Our results further support the druggable nature of this PPI and provide a basis for the continued structure-based development of multiple scaffolds as anti-cancer therapeutics that target TLS.
Experimental Section
General information
The chemical database used for the pharmacophore screen was comprised of an in-house library of approximately 150K small molecules purchased from ChemBridge. The polκ-RIR peptide (560–575) incorporating an N-terminal fluorescent FAM label (FAM-Polκ-RIR) utilized in the FP assay was custom synthesized by GenScript. Recombinant Rev1-CT and the subsequent 1:1 Rev1-CT/FAM-Polκ-RIR complex used in the FP assay were prepared as described previously.[9] All statistical analysis and graphing was carried out in GraphPad Prism 5.
Computational Studies
Preparation of Rev1-CT and small molecule structures.
The Rev1-CT structure from PDB code 2LSI was prepared for docking with the protein preparation wizard module from Schrödinger Suite 2015[19] using the OPLS_2005 force field. The small molecule database was prepared using LigPrep and Epik to expand protonation and tautomeric states at pH 7.0 for each molecule. The ConfGen search algorithm was used for conformational sampling, with the OPLS_2005 force field and a duplicate pose elimination criterion set to 1.0 Å RMSD to remove redundant conformers. Electrostatic interactions were modeled using distance-dependent dielectric solvation treatment. To exclude high energy structures that represent weakly binding compounds, a maximum relative energy difference of 10.0 kcal/mol was utilized.
Molecular docking and E-pharmacophore generation.
The grid box was generated around the Rev1-CT amino acid residues interacting with the RIR region of polκ. The Glide XP docking module was used for initial docking and visualization of the docked results. The docking conformer of the four phenodiazopyridines along with their binding poses were utilized as the input for E-pharmacophore mapping[20] using the energetic terms from the Glide XP scoring[21] function onto the center of the interacting ligand atom. All ligand structures were built using the Maestro module of the Schrödinger Suite package and energy minimized using Macromodel with the OPLS_2005 force field. The remaining parameters were left at their default settings.
Virtual screening protocol.
To identify novel scaffolds with the ability to disrupt the Rev1-CT/RIR PPI, we screened an in-house library of 155,499 molecules from Chembridge in silico against the E-pharmacophore model generated from our PAP scaffold. Initially, prescreening was performed by utilizing the following search criteria for the compound database: x log p ≤ 5.0, molecular weight in the range of 150–800, hydrogen bond donors ≤ 5, hydrogen bond acceptors ≤ 10. Initially, the three- and four-point pharmacophore models generated from our PAP analogous were used as filters to screen our chemical database of small molecules. Our virtual screening workflow utilized the Glide module for ligand and protein docking. In this protocol, the Glide program filters the compounds using the HTVS (high throughput virtual screening) module, followed by the SP (standard precision) and XP (extra precision) modes. The OPLS_2005 force field parameters were applied while performing docking calculations. The molecules with the best Glide scores were visually inspected and considered for further analysis.
Post screening molecular dynamics.
To explore the binding energetics for each individual amino acid residue involved in the binding between Rev1-CT and our hits, the three-dimensional Rev1-CT:hit complexes generated through the above docking procedures were subjected to molecular dynamics (MD). The general CHARMM36 force was utilized to generate the force field parameters for protein and ligands. To neutralize the total charge of the system, sodium counter ions were placed in positions with the largest negative coulombic potentials around the protein and the whole system was immersed in a rectangular box of TIP3P water molecules. The water box extended 8 Å away from any solute atom. In molecular minimization and molecular dynamics simulations, particle mesh Ewald (PME) was employed to treat the long-range electrostatic interactions.[22] Before MD simulations, the complexes were gradually relaxed using 10,000 cycles of minimization (500 cycles of steepest descent[23–24] and 9,500 cycles of conjugate gradient minimization[25]). After minimization, MD simulations in the NPT ensemble with a target temperature of 298 K and a target pressure of 1 atm were performed. The SHAKE procedure[26] was employed to constrain all hydrogen atoms and the time step was set to 2.0 fs. Before the actual MD simulations, the system was gradually heated in the NVT ensemble from 10K to 298K over 500 ps. Initial velocities were assigned from a Maxwellian distribution at the starting temperature. Rev1-CT/hit complexes were analyzed following 20 ns MD trajectories.
Biological Evaluation
Fluorescence polarization assay.
The FP assay was performed as described previously.[15] Briefly, 1:1 Rev1-CT/FAM-Polκ-RIR complex (10 μL, 0.2 μM) and compound (10 μL, varying concentrations) were mixed in a black 384-well plate and incubated for one hour. Fluorescence polarization was measured on a Synergy H1 Hybrid multi-mode plate reader (Biotek, excitation 485 nM, emission 528 nM).
Methods for Cisplatin Sensitivity Assay.
Mouse embryonic fibroblasts (MEFs) were purchased from ATCC and grown at 37°C in a humidified atmosphere (5% CO2) in RPMI 1640 (Gibco), supplemented with 10% FBS (HyClone) and 1% Penicillin/Streptomycin. For passaging, cells were trypsinized with 0.25% Trypsin-EDTA (Corning). MEFs were seeded in a 96-well plate (10,000 cells/well, 100 μL) and incubated overnight (37°C, 5% CO2). Cells were treated in triplicate with DMSO, cisplatin alone, compound alone, or cisplatin plus compound at the concentrations indicated (0.1% DMSO/well). Following a 24 hr incubation, the number of viable cells were quantitated using the CellTiter-Glo® Luminescent Cell Viability Assay kit per the manufacturer’s instructions (Promega). Luminescence was quantified on a Tecan Spark 10M plate reader. The relative survival of metabolically active cells was calculated by dividing the luminescence of treated samples by the luminescence of DMSO controls.
Supplementary Material
Acknowledgements
This research was supported by the Connecticut Institute for Clinical and Translational Sciences (D.M.K. and M.K.H.), the University of Connecticut Research Foundation (D.M.K. and M.K.H.), the National Science Foundation (D.M.K., 1615866), and the National Institute of Environmental Health Sciences (NIEHS) Grant R35-ES028303 to G.C.W., and NIEHS Grant P30 ES002109 to the Massachusetts Institute of Technology Center of Environmental Health Sciences. G.C.W. is an American Cancer Society Professor.
Footnotes
Supporting information for this article is given via a link at the end of the document.
Conflict of Interest
The authors declare no conflict of interest.
References:
- [1].Waters LS, Minesinger BK, Wiltrout ME, Souza SD, Woodruff RV, Walker GC, Microbiol. Mol. Biol. Rev. 2009, 73, 134–154. [DOI] [PMC free article] [PubMed] [Google Scholar]
- [2].Vaisman A, Woodgate R, Crit. Rev. Biochem. Mol. Biol. 2017, 52, 274–203. [DOI] [PMC free article] [PubMed] [Google Scholar]
- [3].Korzhnev DM, Hadden MK, J. Med. Chem. 2016, 59, 9321–9336. [DOI] [PubMed] [Google Scholar]
- [4].Xie K, Doles J, Hemann MT, Walker GC, Proc. Natl. Acad. Sci. USA 2010, 107, 20792–20797. [DOI] [PMC free article] [PubMed] [Google Scholar]
- [5].Doles J, Oliver TG, Cameron ER, Hsu G, Jacks T, Walker GC, Hemann MT, Proc. Natl. Acad. Sci. USA 2010, 107, 20786–20791. [DOI] [PMC free article] [PubMed] [Google Scholar]
- [6].Zafar MK, Eoff RL, Chem. Res. Toxicol. 2017, 20, 1942–1955. [DOI] [PMC free article] [PubMed] [Google Scholar]
- [7].Yamanaka K, Chatterjee N, Hemann MT, Walker GC, PLOS Genet. 2017, 13, e1006842. [DOI] [PMC free article] [PubMed] [Google Scholar]
- [8].Shachar S, Ziv O, Avkin S, Adar S, Wittschieben J, Resiiner T, Chaney S, Friedberg EC, Wang Z, Carell T, Geacintov N, Livneh Z, EMBO J. 2009, 28, 383–393. [DOI] [PMC free article] [PubMed] [Google Scholar]
- [9].Livneh Z, Ziv O, Shachar S, Cell Cycle, 2010, 9, 729–735. [DOI] [PubMed] [Google Scholar]
- [10].Ohashi E, Hanafusa T, Kamei K, Song I, Tomida J, Hashimoto H, Vaziri C, Ohmori H, Genes to Cells 2009, 14, 101–111. [DOI] [PMC free article] [PubMed] [Google Scholar]
- [11].Pozhidaeva A, Pustovalova Y, D’Souza S, Bezsonova I, Walker GC, Korzhnev DM, Biochemistry 2012, 51, 5506–5520. [DOI] [PMC free article] [PubMed] [Google Scholar]
- [12].Wojtaszek J, Liu J, D’Souza S, Wang S, Xue Y, Walker GC, Zhou P, J. Biol. Chem. 2012, 287, 26400–26408. [DOI] [PMC free article] [PubMed] [Google Scholar]
- [13].Pustovalova Y, Magalhães MT, D’Souza S, Rizzo AA, Korza G, Walker GC, Korzhnev DM, Biochemistry 2016, 55, 2043–2053. [DOI] [PMC free article] [PubMed] [Google Scholar]
- [14].Sail V, Rizzo AA, Chatterjee N, Dash RC, Ozen Z, Walker GC, Korzhnev DM, Hadden MK, ACS Chem. Biol. 2017, 12, 1903–1912. [DOI] [PMC free article] [PubMed] [Google Scholar]
- [15].Dash RC, Ozen Z, Rizzo AA, Lim S, Korzhnev DM; Hadden MK, J. Chem. Inf. Model. 2018, 58, 2266–2277. [DOI] [PubMed] [Google Scholar]
- [16].Ozen Z, Dash RC, McCarthy KR, Chow SA, Rizzo AA, Korzhnev DM, Hadden MK, Bioorg. Med. Chem. 2018, 26, 4301–4309. [DOI] [PubMed] [Google Scholar]
- [17].Wang ZX, FEBS Lett. 1995, 360, 111–114. [DOI] [PubMed] [Google Scholar]
- [18].Lee Y-S, Gregory MT, Yang W, Proc. Natl. Acad. Sci. USA 2014, 111, 2954–2959. [DOI] [PMC free article] [PubMed] [Google Scholar]
- [19].Sastry GM, Adzhigirey M, Day T, Annabhimoju R, Sherman W, J. Comput-Aided Drug Des. 2013, 27, 221–234. [DOI] [PubMed] [Google Scholar]
- [20].Salam NK, Nuti R, Sherman W, J. Chem. Inf. Model. 2009, 49, 2356–2368. [DOI] [PubMed] [Google Scholar]
- [21].Friesner RA, Banks JL, Murphy RB, Halgren TA, Klicic JJ, Mainz DT, Repasky MP, Knoll EH, Sheller M, Perry JK, Shaw DE, Francis P, Shenkin PS, J. Med. Chem. 2004, 47, 1739–1749. [DOI] [PubMed] [Google Scholar]
- [22].Darden T, York D, Pedersen L, J. Chem. Phy. 1993, 98, 10089–10092. [Google Scholar]
- [23].Kiwiel KC, C K, Mutry K, J. Optimiz Theory App. 1996, 89, 221–226. [Google Scholar]
- [24].Petrova SS, Solov’ev AD, Historia Mathematica 1997, 24, 36–375. [Google Scholar]
- [25].Hestenes MR, Stiefel E, J. Res. Natl. Bureau Stand. 1952, 49, 409–436. [Google Scholar]
- [26].Ryckaert J-P, Ciccotti G, Berendsen HJC, J. Comput. Phys. 1977, 23, 327–341. [Google Scholar]
Associated Data
This section collects any data citations, data availability statements, or supplementary materials included in this article.


