Abstract
Multiple sclerosis (MS) is a complex, demyelinating disease with the involvement of autoimmunity and neurodegeneration. Increasing efforts have been made towards identifying the diagnostic markers to differentiate the classes of MS from other similar neurological conditions. Using a systems biology approach, we constructed four types of gene regulatory networks (GRNs) involved in peripheral blood mononuclear cells (PBMCs). The regulatory strength of each GRN across primary progressive MS (PPMS), relapsing-remitting MS (RRMS), secondary progressive MS (SPMS), and control were evaluated by an integrity algorithm. Among the constructed GRNs (referred as TF_gene_miRNA), POU3F2_CDK6_hsa-miR-590-3p, MEIS1_CASC3_hsa-miR-1261, STAT3_OGG1_hsa-miR-298, and TCF4_FMR1_hsa-miR-301b were top-ranked and differentially regulated in all classes of MS compared to control. These GRNs showed potential involvement in regulating various molecular pathways such as interleukin, integrin, glypican, sphingosine phosphate, androgen, and Wnt signaling pathways. For validation, the qPCR analysis of the GRN components (TFs, gene, and miRNAs) in PBMCs of healthy controls (n = 30), RRMS (n = 14), PPMS (n = 13) and SPMS (n = 12) were carried out. Real-time expression analysis of GRNs showed a similar regulatory pattern as derived from our systems biology approach. Also, our study provided several novel GRNs that regulate unique and common molecular mechanisms between MS conditions. Hence, these regulatory components of GRNs will help to understand the disease mechanism across MS classes and further insight may though light towards diagnosis.
Subject terms: Myelin biology and repair, Regulatory networks
Introduction
Multiple sclerosis (MS) is a complex demyelinating disease that affects the central nervous system (CNS). Based on the progression, MS is classified as relapsing-remitting (RRMS), primary progressive (PPMS) and secondary progressive (SPMS). Nearly 2.5 million people are affected globally, of which the majority exhibit relapsing-remitting MS. The etiology and molecular mechanisms of MS are largely unknown1. Investigations suggest that both genetic and epigenetic factors play a crucial role in disease susceptibility2,3. Gene expression changes are reported in the blood and brain of multiple sclerosis patients that are associated with autoimmune and neurodegenerative process4. International Multiple Sclerosis Genetics Consortium has performed a genome-wide association study to explore genetic predispositions of MS, which suggests multiple disease-associated loci5. Dysregulation of the regulatory mechanism at MS loci has been noticed to alter the expression of genes related to MS6.
Gene regulatory network (GRN) plays a vital role in normal cellular processes such as metabolism, cell differentiation, cell cycle, and cell signaling. GRN regulates gene expression through ‘cis’ and ‘trans’ regulatory elements such as microRNA (miRNA) and transcription factor (TF). miRNA is a single-stranded, non-coding RNA with ~22 nucleotide bases binds at the 3′ untranslated region (UTR) of the targeted gene (mRNA) for degradation7. Over 60% of mammalian genes are controlled by miRNAs8. Each miRNA regulates hundreds of its target genes. Change in miRNA expression plays an important role in the development and progression of MS. Particularly, altered expression of miR-326, miR-155, miR-146a, miR-146b, miR-142-3p, and miR-21 dysregulate interleukins and apoptotic process in MS9. Also, miRNA and TF co-regulate each other to form a regulatory network that controls cellular gene expression. TF regulates gene at the transcriptional level within the nucleus, whereas the miRNA is post-transcriptionally active at the cytoplasm. Many of such, dysregulating GRNs are reported in Alzheimer’s disease, Parkinson’s disease and Schizophrenia10–12. Understanding the regulatory network will enhance the knowledge of cellular mechanism, which may light towards the diagnosis and treatment for the disease. Several efforts have been made to understand the GRNs in multiple sclerosis13–16. However, their studies are compromised while describing the type of GRNs and their regulatory strength contributing to RRMS, PPMS, and SPMS.
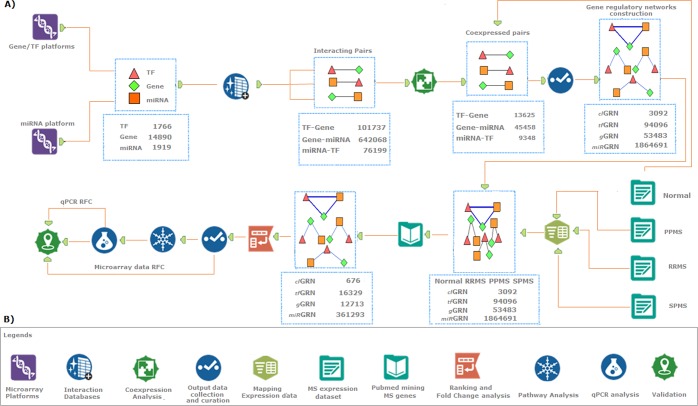
In this study (Fig. 1) we develop, four types of GRNs across three MS conditions to demonstrate its molecular pathogenesis. We integrate the gene and miRNA expression profile of PBMCs with a systems biology approach to create GRN based on sequence and co-expressed interaction of TF, gene, and miRNA. An integrity algorithm is implemented to rank significant GRNs based on network integrity. Our approach identifies a diverse range of the regulatory network that explains the common and unique GRNs between the MS conditions. These GRNs regulate several previously known and unknown molecular pathways involved in RRMS, PPMS, and SPMS. Also, qPCR analysis of selected GRN components (TF, gene, and miRNA) confirm the differential regulation in PBMCs of RRMS, PPMS, and SPMS compared to healthy controls. Overall, our study elaborates and highlights the involvement of GRNs in PBMCs of multiple sclerosis which is essential to understand the disease pathogenesis that may throw light towards biomarkers for diagnosis.
Figure 1.
Schematic representation of the overall strategy used in this study. (A) Workflow explaining the collection, construction, and validation of gene regulatory networks. (B) Components used in the workflow.
Results
Co-expressed interaction and gene regulatory network
To construct the PBMC based gene regulatory network, the gene, TF, and miRNA expressed in human PBMCs were collected from microarray platforms. All extracted data were curated and converted into an official symbol using the Hugo gene nomenclature committee (HGNC) database to have 14980 genes, 1766 TFs, and 1919 miRNAs. From the curated list, the interactions between TFs, genes, and miRNAs were retrieved. A total of 820004 feed-forward and feed-back co-expressed interactions were identified. To validate these interactions, the Pearson correlation analysis was executed using microarray expression data of healthy controls. The microarray datasets E-MTAB-358 (gene) and E-MTAB-359 (miRNA) were obtained from the Array Express repository. Of the 820004 analyzed interactions, 155611 were significantly co-expressed to have 2016172 GRNs based on their common molecular entities, as described in the methodology (Fig. 2). Among 2016172 GRNs, 3092, 53483, 94906 and 1864691 were attributed to clGRNs, gGRNs, tfGRNs, and miRGRNs, respectively. These GRNs were mapped with the microarray expression data of healthy controls, RRMS, SPMS, and PPMS (4*2016172). Further, the GRNs were selected, which contains MS-associated genes and TFs that were obtained from the text-mining approach.
Figure 2.
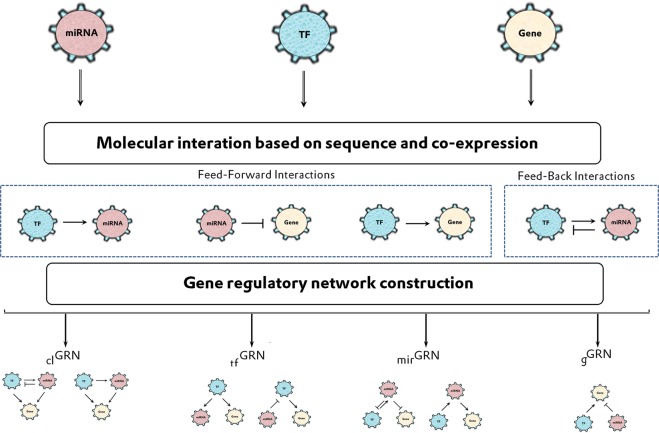
Workflow for the construction of gene regulatory motifs (1) clGRN: closed-loop convergent network; (2) gGRN: a common gene GRN; (3) tfGRN: a common TF GRN and (4) miRGRN: a common miRNA GRN.
Text-mining
In text-mining, we retrieved 56335 abstracts from the PubMed database using a combination of keywords related to multiple sclerosis (articles published from January 2000 to May 2017). Using an in-house R-script, 2022 genes and 473 TFs associated with MS were extracted from the PubMed abstracts. Among 2016172, the GRNs containing MS-associated text-mined genes and TFs were filtered to have 391011 (clGRNs = 676, gGRNs = 12713, tfGRNs = 16329 and miRGRNs = 361293) GRNs in each MS condition and control.
GRN integrity scoring algorithm
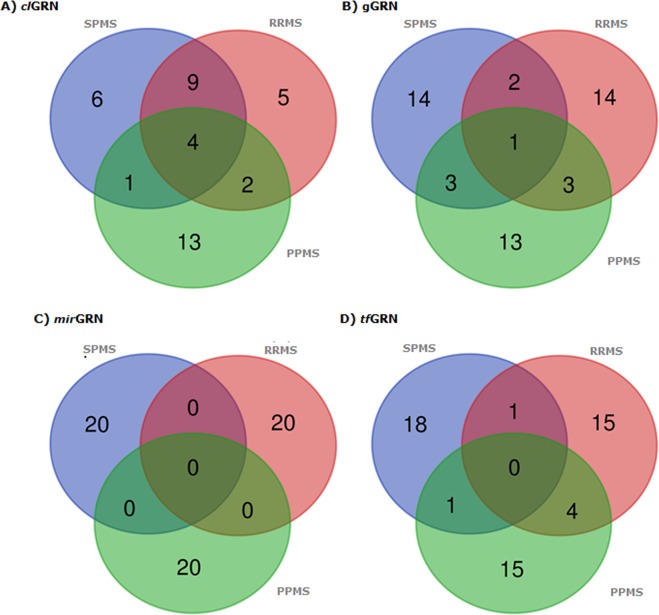
The integrity algorithmic score (N) was calculated to determine the regulatory strength of 391011 GRNs in control, RRMS, PPMS, and SPMS (4*391011 = 1564044). The regulatory strength of GRN was ranged from 5.92 to 29.93 for control. In RRMS, it was ranged from 6.38 to 22.39. Similarly, for SPMS and PPMS regulatory strength was ranged between 6.24 to 24.10 and 6.19 to 24.5, respectively. Further, the regulatory fold change (RFC) was evaluated for each GRN between, a) control vs RRMS, b) control vs PPMS and c) control vs SPMS. Based on the RFC, a twenty top-ranked (ten up and ten down) differentially regulated GRNs in RRMS, PPMS, and SPMS were identified. A total of 240 differentially regulating top-rank GRNs were identified, containing 20 for each GRN type (clGRNs, gGRNs, tfGRNs, and miRGRNs) across three MS classes (80*3 = 240 GRNs) (Supplementary information 2). Among 240 GRNs, several were unique and common between MS conditions (Fig. 3). For instance, of 60 differentially regulating top-ranked clGRNs, POU3F2_CDK6_hsa-miR-590-3p, MEIS1_CASC3_hsa-miR-1261, STAT3_OGG1_hsa-miR-298 and TCF4_FMR1_hsa-miR-301b were commonly noticed in all MS conditions. The POU3F2_CDK6_hsa-miR-590-3p was down-regulated in PPMS and up-regulated in RRMS and SPMS. Whereas, the other three GRNs were down-regulated in all the conditions.
Figure 3.
Venn diagrams representing the common and unique GRNs across disease conditions. (A) clGRNs, (B) gGRNs, (C) miRGRNs and (D) tfGRNs. The green circle represents PPMS, the pink circle represents RRMS and the blue circle represents SPMS.
Functional enrichment analysis
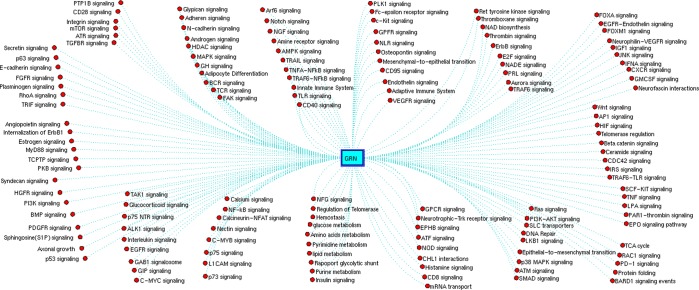
Functional analysis of 240 GRNs showed involvement in regulating 144 pathways (Fig. 4). To our knowledge of these 144, a few were previously reported while others were noticed novel to MS conditions. Although few molecular pathways were well reported in MS, our study provides the functional insight about the regulators that contribute to these pathways (Supplementary information 2). For instance, 51 pathways were regulated by five GRNs (four clGRNs and one gGRN) which were commonly noticed between PPMS, SPMS, and RRMS. Similarly, 67 pathways were regulated by eight common GRNs of SPMS and RRMS. Whereas, nine common GRNs of RRMS and PPMS regulate 63 molecular pathways. Also, three GRNs of PPMS and SPMS regulate 33 molecular pathways. Most of these GRNs regulate T-cells immune responses, oligodendrocyte maturation, androgen signaling, axon myelination, and hormonal signaling (Fig. 4). In particular, POU3F2_CDK6_hsa-miR-590-3p, MEIS1_CASC3_hsa-miR-1261, STAT3_OGG1_hsa-miR-298, and TCF4_FMR1_hsa-miR-301b regulate interleukin signaling, integrin signaling, glypican signaling, sphingosine phosphate signaling, androgen signaling, and Wnt signaling mechanism (Supplementary information 2). Understanding the potential involvement of the four clGRNs in all MS conditions, their components (TF, gene, and miRNA) may hold good as candidate markers. Hence, the relative expression levels of STAT3, POU3F2, MEIS1, TCF4, CDK6, CASC3, OGG1, FMR1, hsa-miR-590-3p, hsa-miR-1261, hsa-miR-298 and hsa-miR-310 were quantified using qPCR (2 − ∆Ct) in PBMCs of healthy controls and MS patients.
Figure 4.
GRNs regulating 144 pathways associated with multiple sclerosis.
Real-time validation of the top-ranked GRNs
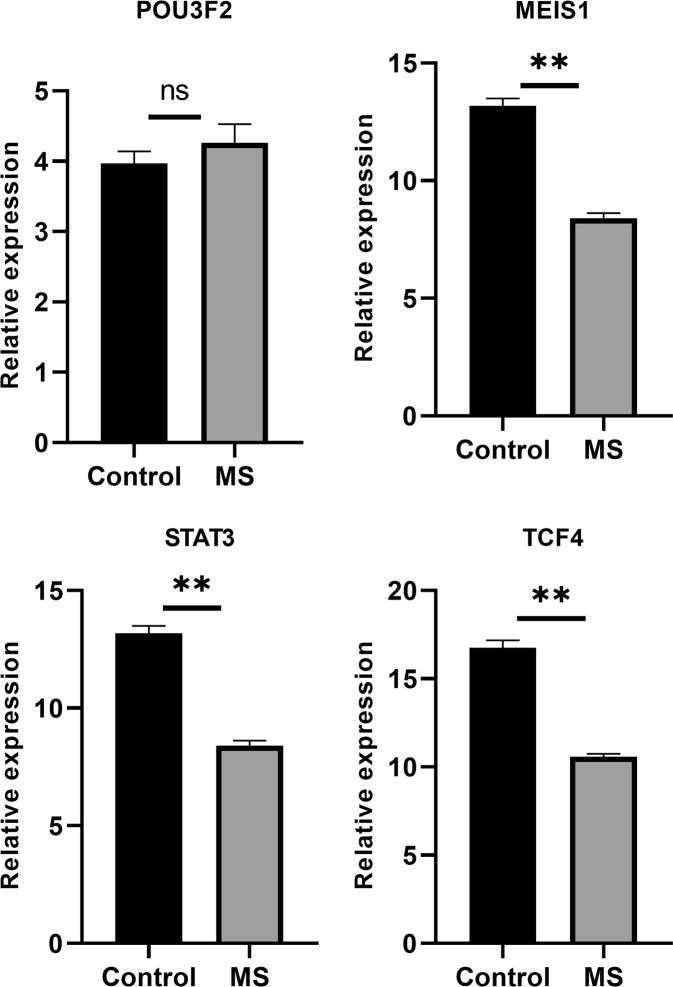
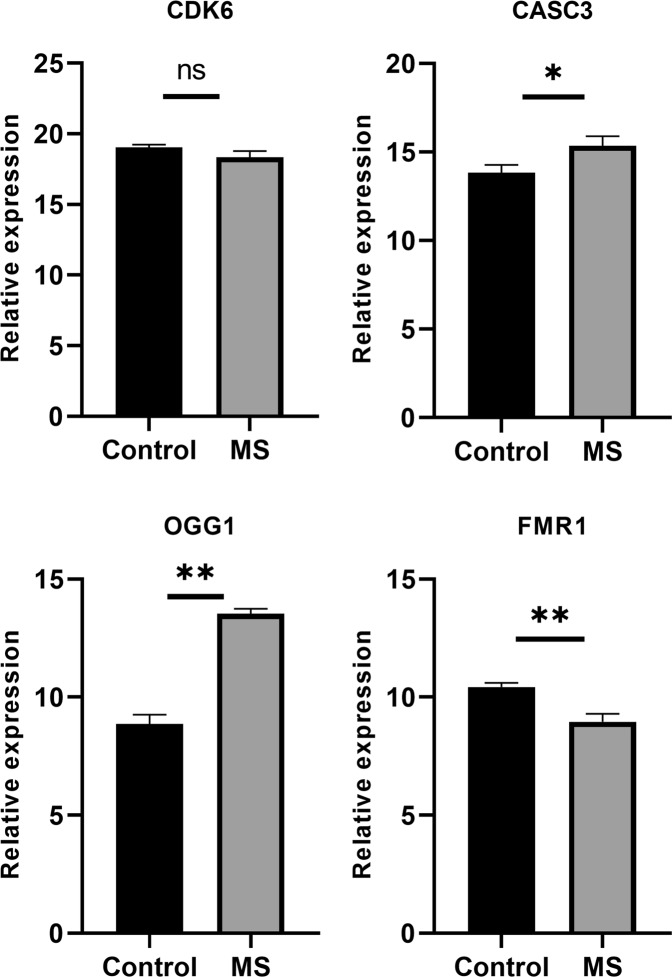
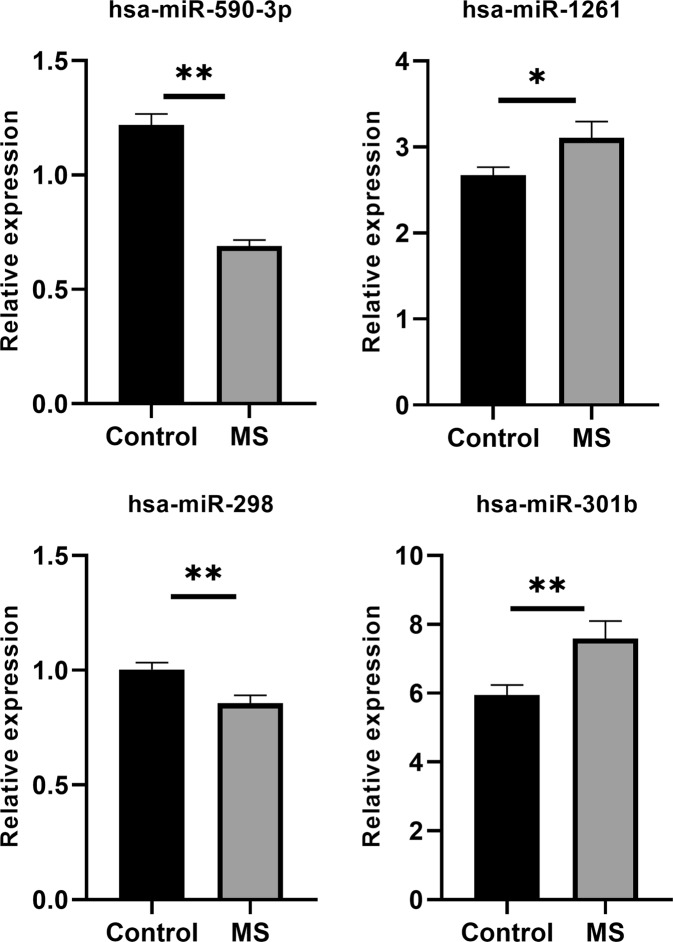
We observed a significant (p-value ≤ 0.05) up-regulation of OGG1, CASC3, hsa-miR-1261 and hsa-miR-301b and down-regulation of FMR1, MEIS1, STAT3, TCF4, hsa-miR-298, and hsa-miR-590-3p in pooled MS (RRMS + SPMS + PPMS) compared with healthy controls (Figs 5–7). Further, the sub-group analysis (Supplementary information 1) based on MS conditions showed similar trends as pooled MS, except for CASC3 and hsa-miR-1261. Significant (p-value ≤ 0.05) down-regulation of hsa-miR-1261 was noticed in RRMS and up-regulation was observed in PPMS and SPMS. Whereas, CASC3 was down-regulated in SPMS and up-regulated in PPMS and RRMS with p-value ≤ 0.05. Alternatively, POU3F2 and CDK6 did not show minimal statistical significance (p-value ≤ 0.05) in both pooled and sub-group analysis.
Figure 6.
Relative expressions of the selected transcription factors between control and MS were plotted. GAPDH gene was used as an internal control to calculate relative expression. Data are expressed as the mean ± standard error of the mean. Asterisks represent statistical significant (*p ≤ 0.05, **p ≤ 0.01 and ns: no significant).
Figure 5.
Relative expression of the genes in control and MS were plotted. GAPDH gene was used as an internal control to calculate relative expression. Vertical bars represent the mean ± standard error of the mean. Asterisks indicate statistical significant (*p ≤ 0.05, **p ≤ 0.01 and ns: no significant).
Figure 7.
Relative expressions of the selected miRNAs between control and MS were plotted. U6 snRNA miRNA is used as an internal control to calculate a relative expression. Data are expressed as the mean ± standard error of the mean. Asterisks indicate statistical significant (*p ≤ 0.05, **p ≤ 0.01 and ns: no significant).
GRN regulation with real-time expression
The integrative score was calculated using the qPCR expression of the TFs, genes, and miRNAs for the top-ranked four clGRNs in control, RRMS, PPMS, and SPMS. Based on the score, RFCs were calculated which showed down-regulation of POU3F2_CDK6_hsa-miR-590-3p in PPMS and up-regulation in RRMS and SPMS. Whereas, other GRNs were down-regulated in all MS conditions. The accuracy of the integrity algorithm was determined by comparing the regulatory pattern between the calculated RFC of experimental qPCR data and microarray data (E-MTAB-358 and E-MTAB-359). All four GRNs showed a similar regulatory pattern in RRMS, PPMS, and SPMS between qPCR and microarray data. Although, POU3F2_CDK6_hsa-miR-590-3p exhibit similar regulatory pattern, the qPCR expression of POU3F2 and CDK6 were statistically insignificant (p-value ≤ 0.05) in all MS conditions. Overall, the analysis of four GRNs across three MS conditions (4*3 = 12) showed nine truly classified output except for POU3F2_CDK6_hsa-miR-590-3p in RRMS, PPMS, and SPMS, which show 75% accuracy of the integrity algorithm.
Discussion
Recent development in the technologies allow us to dissect and describe the molecular function of the cell from a single functional molecule to complex biological pathways. Several genetic analyses show the importance of miRNA and transcription factor in regulating gene expression in normal physiological conditions. For instance, both miRNA and transcription factors are involved in the regulatory process of brain development, neuronal differentiation, and synaptic plasticity. Thus, understanding the role of regulatory network in the pathological state will aid in the development of both diagnostic markers and new therapeutic strategies. Although several studies generate and discuss the GRNs in multiple sclerosis, there are few limitations that had a potential impact on the biological relevance13–16. Particularly, in most of the studies (1) GRNs were constructed using a heterogeneous microarray dataset from the various populations. (2) A few types of GRNs were focused, (3) No significant exploration was made to differentiate GRNs based on MS conditions (RRMS, SPMS, and PPMS). (4) The regulatory strength of the GRN was not explicitly defined, which is important in determining the difference in the expression levels of genes in MS. In this juncture, our approach involved in constructing GRNs from the homogenous population avoids experimental bias and population-based expression variation. Using FF and FB interactions, four types of GRNs were constructed for three MS conditions. Also, integrative algorithm and regulatory fold change were implemented to describe the regulatory strength of GRNs in RRMS, SPMS and PPMS compared to healthy controls. In addtion, functional enrichment analysis of GRNs showed several previously un-notified regulatory network of MS-associated molecular pathway mechanisms.
Overall, our analyses identified several promising gene regulatory networks that are unique and common between RRMS, PPMS, and SPMS. Of the identified clGRNs, STAT3_OGG1_hsa-miR-298 was noticed top-ranked and common in all three classes of MS. STAT3 transcription factor regulates genes involved in differentiation, proliferation, apoptosis, innate and adaptive immune responses. In particular, STAT3 is activated by the Janus Kinase pathway in response to cytokines that induce inflammatory mechanisms. Also, the knockout mice study of IL-6−/− and STAT3−/− develops encephalomyelitis resistant, which suggests the role of STAT3 in neuropathogenesis17. Additionally, a genetic study has shown the risk association of MS in the German population with rs744166 and rs2293152 polymorphism in STAT318. STAT3 was implicated in inflammatory neurodegenerative conditions such as Alzheimer, Parkinson, and Huntington disease19,20. In our analysis, STAT3 was noticed to activate OGG1 and hsa-miR-298. The OGG1 encodes 8-oxoguanine DNA glycosylase that involved DNA repair mechanism21. A recent study by Roya et al. (2017) reported the significant up-regulation of OGG1 in RRMS22. Additionally, Karahalil et al. (2015) suggest the risk association of OGG1 polymorphism (Ser326Cys) in developing multiple sclerosis23. The above studies are in accordance with our findings, confirming the contribution of OGG1 in MS pathogenesis. To our knowledge, there is no literature evidence suggesting the involvement of hsa-miR-298 in MS. However, the report of Dai et al. 2007, describes the association of hsa-miR-298 in autoimmune conditions such as systemic lupus erythematosus24.
Similar to STAT3 GRN, the TCF4_FMR1_hsa-miR-301b was noticed as one of the top-ranked clGRN in all three classes of MS. TCF4 is the potential transcription factor mediates Wnt signaling pathway that associated with infiltration of immune cells in multiple sclerosis. Several studies have reported the significant role of TCF4 in the development of oligodendrocytes and myelination25–27. TCF4 regulates the expression of myelin-related genes such as CNPase, MBP, and PLP of neurons. Experimental study of TCF4 null mice showed reduced expression of CNPase, MBP, and PLP in the brain that may cause dysregulation of the myelination process28–30. In our analysis, TCF4 was noticed to activate fragile X mental retardation 1 (FMR1) gene, which is associated with the neurodegenerative condition such as Fragile X-associated tremor ataxia syndrome (FXTAS). In myelin-producing oligodendrocytes, FMR1 interacts with MBP that regulates CNS myelination. CNS demyelination is one of the notable factors in neurological diseases, including MS31. Several clinical studies have showed that patients with fragile X associated tremor/ataxia syndrome were susceptible to MS32,33. In addition, FMR1 and TCF4 were observed to regulate hsa-miR-301b. To our knowledge, no study has shown the influence of hsa-miR-301b in MS. However, the hsa-miR-301b belonging mir-130 family34 has implicated in most of the neuroinflammatory conditions35.
MEIS1 (transcription factor) is a Meis homeobox 1 protein belongs to TALE homeodomain family, which forms a clGRN with CASC3 and hsa-miR-1261. Experimental study of a transgenic mouse with the rs12469063 variant of MEIS1 shows an involvement in the neuronal development process36. Although, there is no direct association of MEIS1 with multiple sclerosis, the rs2300478 polymorphism of MEIS1 is proven to contribute to neurological diseases37. Similarly, Jang et al. (2006) reported the over-expression of CASC3 (also known as MLN51) in autoimmune disease38. On the other hand, the role of hsa-miR-1261 in MS has not been widely studied. However, considering the interaction of hsa-miR-1261 with the neurologically associated MEIS1 and CASC3, we suggest MEIS1 regulatory network may have a potential role in the neuropathological process of MS. Similarly, POU3F2 (synonym BRN2) is a member of POU III class of the neuronal transcription factor forms a clGRN with CDK6 and miR-590-3p. POU3F2 plays a vital role in the development and differentiation of the neuron. Julien Ghislain et al. (2006) showed the involvement of POU3F2 in the process of pro-myelin to myelin transition in Schwann cells39. Grafting of Schwann cell in experimental rat showed re-myelination of demyelinated axons in the central nervous system40. Down-regulation of POU3F2 suggests dysregulation in myelination processes in MS. In addition, POU3F2 was noticed to regulate CDK6 which activates pro-inflammatory cytokines through NF kappa B and STAT pathways41,42. Also, hsa-miR-590 of POU3F2 GRN showed involved in the inflammation process by modulating Th17 cell differentiation in the autoimmune condition of central nervous system43.
Method
miRNA-TF/gene interactions
To construct human PBMCs based GRNs, the genes, and miRNAs expressed in human PBMCs were retrieved from microarray platforms (GPL95, GPL96, and GPL570) of Gene Expression Omnibus (GEO, http://www.ncbi.nlm.nih.gov/geo/) database. All genes were compiled and converted to the official gene symbols using the HGNC (https://www.genenames.org/) database to avoid duplicates. A curated list of official gene symbols was classified as genes and transcription factors using Tcof and DBD databases44,45. Further, the sequence-based interaction between TF and gene was predicted using transcription factor binding sites (TFBS) data of UCSC table browser46. To increase the true positive interaction, the Z-score cut-off was set to 2.33. Further, the interaction of TF-gene was confirmed using a Chipbase47 database. Similarly, a list of human miRNA was retrieved from the microarray platform (GPL18044). The interaction between miRNA with TF and gene were predicted based on the known promoter sequence following the procedure of Mullany et al.48. The presence of interactions between miRNA with TF and gene were confirmed from the CircuitDB49, TransmiR50, puTmiR51, miRwalk52, miRecords53, mirTarbase54, Phenomir55, and mir2disease56 databases. Among these retrieved interactions, we observed three types of regulatory interactions, i) miRNA regulating target gene (miRNA-gene) ii) miRNA regulating TF (miRNA-TF) and, iii) TF regulating miRNA (TF-miRNA). Here the interaction of miRNA-TF and TF-miRNA together act as feedback (FB) interaction, if the same TF and miRNA reciprocally regulate each other (TF ⇋ miRNA). Alternatively, the unidirectional interactions of miRNA-gene, TF-miRNA, and TF-gene were considered as feed-forward (FF) interaction.
Co-expressed interaction data
The co-expression of TF, gene, and miRNA in FF and FB interactions were validated using Multi-Experiment Matrix (MEM)57 and Co-expression Meta-analysis of miRNA Targets (CoMeTa)58 databases. MEM generates p-value for each TF-gene interaction; the p-value ≤ 0.05 was considered statistically significant interaction. Similarly, co-expression of TF-miRNA, miRNA-gene, and TF ⇋ miRNA interactions were validated using the CoMeTa database, with a score ≥4. Strict cut-offs for MEM and CoMeTa were followed to minimize false-positive co-expressed interactions.
GRNs with MS expression data
Besides MEM and CoMeTa, the existence of co-expressed interactions in FBIs and FFIs were cross-validated using microarray expression data of healthy controls. For which, the microarray expression dataset was retrieved from the ArrayExpress database based on the following criteria: (1) Expression profiling should be conducted in PBMC. (2) Gene and miRNA expression profiling should be conducted in the same individual. (3) Enough information should be available for the dataset to classify MS into RRMS, PPMS, and SPMS. (4) The dataset should contain a minimum of three samples in each MS condition, including control. Considering the above criteria, the expression data Accession No. E-MTAB-358 (gene) and E-MTAB-359 (miRNA) were selected from ArrayExpress database59 contains 14 controls and 19 MS patients (RRMS 7, SPMS 6, PPMS 6)60. The dataset represents miRNA and gene expression profiles from the same individual with the expression data of 35133 genes and 1146 miRNAs. The obtained data were normalized and the co-expression of interactions in FB and FF were confirmed using Pearson’s correlation.
Gene regulatory network
Based on the co-expressed interactions, four different GRNs (clGRN, gGRN, tfGRN, and miRGRN) were constructed with all possible combinations of FB and FF interactions. The closed-loop convergent network (clGRN) contains two sub-classes of networks, generated from the interactions (FBIs and FFIs). (1) The interactions with mutual gene target regulated by reciprocal regulators (TF ⇋ miRNA). (2) Interactions with mutual gene target regulated unidirectional regulators (TF-miRNA). Similarly, gGRN was constructed with the interactions having a common gene to the regulators (TF and miRNA). Likewise, the TF that regulates common gene and miRNA was termed as tfGRN, whereas the FB and FF interactions with miRNA regulating common TF and genes were denoted as miRGRN. Further, these four types of gene regulatory networks were used as a template to map expression data of RRMS, SPMS, PPMS, and controls.
Text mining of MS genes and integrity ranking of GRNs
To extract the MS-associated GRNs, the genes and TFs reported in multiple sclerosis were text-mined using the in-house R-script by collecting abstracts from NCBI PubMed database (https://www.ncbi.nlm.nih.gov/pubmed). The gene regulatory networks of control, RRMS, PPMS and SPMS containing the text mined genes and TFs were selected to determine their regulatory strength. The integrity algorithmic score (N) was calculated for each selected regulatory network of control, RRMS, PPMS, and SPMS.
In the integrity algorithmic score (N), the weight of each component in GRN was designated based on their regulatory role in the cellular gene expression process. For instance, TF assigned the highest weight (rtf = 1) for its involvement in initiating the expression of gene and miRNA. Similarly, the gene was designated with moderate weight (rgene = 0.75) by considering its participation with several molecular and cellular processes. Whereas, the regulatory weight of miRNA was assigned as rmir = 0.5 due to its alternate suppression of competing endogenous RNA61. In addition to the regulatory weight, the normalized expression values of the gene (egene), TF (etf) and miRNA (emir) were included to determine the regulatory strength of the GRNs in control, RRMS, PPMS, and SPMS. Further, the regulatory fold difference of each GRN between a) control vs RRMS, b) control vs PPMS and c) control vs SPMS were calculated and ranked. The top twenty differentially regulated gGRNs, tfGRNs, mirGRNs, and clGRNs were selected (RFC > 1 designated as up-regulation; RFC < 1 determined as down-regulation) in RRMS, PPMS, and SPMS.
Functional enrichment analysis
The functional enrichment analysis was executed to determine the molecular mechanism of the selected top-ranked GRNs in MS conditions. The TFs, genes, and miRNAs of each GRN were functionally enriched using the FunRich tool62. A p-value < 0.05 was considered as the cut-off for enriched pathways. The collected pathways of each molecular entity (TF, gene, and miRNA) was manually curated to have non-redundant pathways. Further, GRN regulating pathway was determined by identifying the commonly representing pathway between TF, gene, and miRNA for each GRN. In addition, expression of top-ranked GRNs (TF, gene, and miRNA) was validated in patients with RRMS, PPMS, SPMS and healthy controls using qPCR.
Ethics for sample collection
All participants were recruited from the Chettinad Hospital and Research Institute (CHRI), India. The protocol for this study was approved by the Institutional Human Ethics Committee of CHRI (IHEC/04/Sep2014/Desp.no. 420). The written informed consent was obtained from each participant before collecting the samples. All procedures, including sample collection, processing, and analysis, were conducted under the regulations and guidelines of the institutional ethical committee. The neurologist diagnosed the patients with MS based on neurological examination, family and medical history. The McDonald criteria63 and expanded disability status scale (EDSS)64 were followed to have true-positive MS patients. For the comparative analysis, participants with no sign of neurologic or neuropsychiatric symptoms were taken as a control.
Inclusion and exclusion criteria for sample collection
Participants (control = 30; RRMS = 14; PPMS = 13 and SPMS = 12) were selected based on the following criteria. Inclusion criteria: (1) the ability to comply with study procedures. (2) Diagnosis based on McDonald criteria and EDSS score. The exclusion criteria include (1) history of HIV infection, immunodeficiency disease and autoimmune diseases other than MS. (2) coexistence of other neurological symptoms. Demographic parameters such as age, gender, disease status, and treatment were recorded before blood collection (Table 1).
Table 1.
Demographic characteristics of Samples collected.
| Control | Multiple Sclerosis | |
|---|---|---|
| Number of participants | 30 | 39 |
| Age (years)¥ | 51.8 ± 10.9 | 46.9 ± 8.7 |
| Gender ratio (male: female) | 15:15 | 16:14 |
| Disease Course (PPMS/RRMS/SPMS) | — | 13/14/12 |
| Treatment | ||
| Dimethyl fumarate | — | 12 |
| Fingolimod | — | 14 |
| Teriflunomide | — | 13 |
¥Mean; ± Standard error of mean (SEM).
Sample collection and processing
Peripheral blood (5 ml) was collected from 30 healthy controls (average age 51.8 ± 10.9 years) and 39 multiple sclerosis patients (average age 46.9 ± 8.7 years). Further, PBMCs were isolated using graduated centrifugation over Lymphoprep™ (STEMCELL Technologies, UK). Total RNA was extracted by Trizol method and the quality was assessed using a NanoDrop ND-1000 spectrophotometer. The extracted RNA was further purified into two separate fractions containing small (18–200 bases) and large (>200 bases) using NucleoSpin miRNA, Machery-Nagel kit.
Gene and miRNA expression
From the large fraction, cDNA was synthesized using SuperScript® III Reverse Transcriptase kit (Life Technologies, NY). SYBR green PCR master mix (Applied Biosystems, CA) was used to perform qRT-PCR on 7900 HT Fast Real-Time PCR system. The miScript II RT Kit, Qiagen and Fast SYBR Green Master Mix, Invitrogen was used to detect the levels of selected miRNA expression following the manufacturer’s protocol. U6 snRNA and GAPDH were used as the internal control for miRNA and mRNA analysis, respectively. The relative expression of the selected gene and miRNA was determined by following the 2 − ∆Ct calculation65. The primers of selected TFs, genes, and miRNAs were shown in Table 2. Further, fold change was calculated, and the student’s t-test was performed to analyze the statistical significance between the control and pooled MS (RRMS + PPMS + SPMS). Sub-group analysis, (a) control vs RRMS, (b) control vs PPMS, and (c) control vs SPMS were carried out by comparing appropriate age and gender-matched control for RRMS, PPMS, and SPMS, respectively. The significance of TF, gene, and miRNA in RRMS, SPMS and PPMS were inspected by following similar statistical procedures. Further, the qPCR expression of the genes, TFs, and miRNAs were implemented in the integrity algorithm. We compared the resulting GRNs pattern based on RFCs with microarray data to determine the accuracy of the algorithm.
Table 2.
Genes and microRNA primer sequence.
| GENES/miRNAs | orientation | Primer Sequence |
|---|---|---|
| STAT3 | Forward | ACCCAACAGCCGCCGTAG |
| Reverse | CAGACTGGTTGTTTCCATTCAGAT | |
| POU3F2 | Forward | CCGCAGCGTCTAACCACTAC |
| Reverse | GTGGGACAGCGCGGTGATCC | |
| MEIS1 | Forward | TGACCGTCCATTACGAAACCT |
| Reverse | CCAGTCCAACCGAGCAGTAAG | |
| TCF4 | Forward | ACATGCATGGAATCATTGGA |
| Reverse | TGAATGTCTGTTGGCTGAAA | |
| CDK6 | Forward | CTGAATGCTCTTGCTCCTTT |
| Reverse | AAAGTTTTGGTGGTCCTTGA | |
| CASC3 | Forward | CAAGGAAGGTCGTGCTGGTT |
| Reverse | ACCAGACCGGCCACCAT | |
| OGG1 | Forward | AATTCCAAGGTGTGCGACTG |
| Reverse | CGATGTTGTTGTTGGAGGAAC | |
| FMR1 | Forward | CCCTTCAAAGAGTCGTCCAC |
| Reverse | GTGAGATCCCCAGCTGTCTC | |
| GAPDH | Forward | AGCCACATCGCTCAGACAC |
| (House Keeping gene) | Reverse | GCCCAATACGACCAAATCC |
| hsa-miR-590-3p | Forward | GCAGCGCAGTAATTTTATGTATAAG |
| Reverse | GCAGCGCAGTAATTTTATGTATAAG | |
| hsa-miR-1261 | Forward | AAGGCTTTGGCTTATGGGGATATTGTGGTTGATCTGTTCTATCCAGATGACTGAAACTTTCTCCA |
| Reverse | GGTCCAGTTTTTTTTTTTTTTTGCT | |
| hsa-miR-298 | Forward | GCAGAAGCAGGGAGGT |
| Reverse | CCAGTTTTTTTTTTTTTTTGGGAGA | |
| hsa-mir-301b | Forward | CTCTGACGAGGTTGCACTACTGTGCTCTGAGAAGCAG |
| Reverse | CAGTTTTTTTTTTTTTTTGGTCCCA | |
| U6 snRNA | Forward | TGGCCCCTGCGCAAGGATG |
| Reverse | GTAGGAACGCGTCCCCGG |
Conclusion
In conclusion, our study explores the regulatory behaviors TF, gene, and miRNA as GRNs in MS. Although the public repository data were used, we implemented several levels of data curation to achieve the pathologically relevant GRNs of MS. Our regulatory scoring algorithm of GRN shows consistency with the real-time expression of TF, gene, and miRNA. Further functional enrichment of the GRNs shows several key regulators for known and unknown molecular pathways across three MS conditions. Interestingly, the potential GRNs that regulating hormone, cellular differentiation, and inflammation have been exposed. Few of other GRNs left out several clues and questions to explore its link between MS. Overall, our results pinpoint the dysregulating regulators of neuronal development and neuroinflammatory processes associated with MS which might help towards the development of biomarkers.
Supplementary information
Author Contributions
P.G. executed the bioinformatics protocol, interpretation of data and wrote the base manuscript; R.M. provides critical suggestions in designing and execution; S.S.J. study concept, design, pooled the data, interpret the data, finalized and approved the manuscript. All authors read and approved the final manuscript.
Competing Interests
The authors declare no competing interests.
Footnotes
Publisher’s note: Springer Nature remains neutral with regard to jurisdictional claims in published maps and institutional affiliations.
Supplementary information
Supplementary information accompanies this paper at 10.1038/s41598-019-49124-x.
References
- 1.Weiner HL. Multiple sclerosis is an inflammatory T-cell–mediated autoimmune disease. Arch Neurol. 2004;61:1613–1615. doi: 10.1001/archneur.61.10.1613. [DOI] [PubMed] [Google Scholar]
- 2.Gacias M, Casaccia P. Epigenetic mechanisms in multiple sclerosis. Rev Esp Escler Mult. 2014;6:25. [PMC free article] [PubMed] [Google Scholar]
- 3.Rito Y, Torre-Villalvazo I, Flores J, Rivas V, Corona T. Epigenetics in multiple sclerosis: Molecular mechanisms and dietary intervention. Cent Nerv Syst Agents Med Chem. 2018;18:8–15. doi: 10.2174/1871524916666160226131842. [DOI] [PubMed] [Google Scholar]
- 4.Hauser SL, Jorge RO. The neurobiology of multiple sclerosis: genes, inflammation, and neurodegeneration. Neuron. 2006;52:61–76. doi: 10.1016/j.neuron.2006.09.011. [DOI] [PubMed] [Google Scholar]
- 5.The International Multiple Sclerosis Genetics Consortium (IMSGC) Genetic risk and a primary role for cell-mediated immune mechanisms in multiple sclerosis. Nature. 2011;476:214–219. doi: 10.1038/nature10251. [DOI] [PMC free article] [PubMed] [Google Scholar]
- 6.Tajouri L, Fernandez F, Lyn RG. Gene expression studies in multiple sclerosis. Curr Genomics. 2007;8:181–189. doi: 10.2174/138920207780833829. [DOI] [PMC free article] [PubMed] [Google Scholar]
- 7.Martinez NJ, Albertha JMW. The interplay between transcription factors and microRNAs in genome‐scale regulatory networks. Bioessays. 2009;31:435–445. doi: 10.1002/bies.200800212. [DOI] [PMC free article] [PubMed] [Google Scholar]
- 8.Friedman RC, et al. Most mammalian mRNAs are conserved targets of microRNAs. Genome Res. 2009;19:92–105. doi: 10.1101/gr.082701.108. [DOI] [PMC free article] [PubMed] [Google Scholar]
- 9.Ma X, et al. Expression, regulation and function of microRNAs in multiple sclerosis. Int J Med Sci. 2014;11:810. doi: 10.7150/ijms.8647. [DOI] [PMC free article] [PubMed] [Google Scholar]
- 10.Kawalia SB, et al. Analytical strategy to prioritize Alzheimer’s disease candidate genes in gene regulatory networks using public expression data. J Alzheimers Dis. 2017;59:1237–1254. doi: 10.3233/JAD-170011. [DOI] [PMC free article] [PubMed] [Google Scholar]
- 11.Dusonchet J, et al. A Parkinson’s disease gene regulatory network identifies the signaling protein RGS2 as a modulator of LRRK2 activity and neuronal toxicity. Hum Mol Genet. 2014;23:4887–4905. doi: 10.1093/hmg/ddu202. [DOI] [PMC free article] [PubMed] [Google Scholar]
- 12.Potkin SG, et al. Identifying gene regulatory networks in schizophrenia. Neuroimage. 2010;53:839–847. doi: 10.1016/j.neuroimage.2010.06.036. [DOI] [PMC free article] [PubMed] [Google Scholar]
- 13.Yang Q, Pan W, Qian L. Identification of the miRNA–mRNA regulatory network in multiple sclerosis. Neurol Res. 2017;39:142–151. doi: 10.1080/01616412.2016.1250857. [DOI] [PubMed] [Google Scholar]
- 14.Freiesleben S, et al. Analysis of microRNA and gene expression profiles in multiple sclerosis: integrating interaction data to uncover regulatory mechanisms. Sci Rep. 2016;6:34512. doi: 10.1038/srep34512. [DOI] [PMC free article] [PubMed] [Google Scholar]
- 15.Cervantes-Gracia K, Husi H. Integrative analysis of Multiple Sclerosis using a systems biology approach. Sci Rep. 2018;8:5633. doi: 10.1038/s41598-018-24032-8. [DOI] [PMC free article] [PubMed] [Google Scholar]
- 16.Nuzziello N, et al. Investigating the role of MicroRNA and transcription factor co-regulatory networks in multiple sclerosis pathogenesis. Int J Mol Sci. 2018;19:3652. doi: 10.3390/ijms19113652. [DOI] [PMC free article] [PubMed] [Google Scholar]
- 17.Yang Y, et al. Targeting IL-6/STAT3 pathway with small-molecule compounds for multiple sclerosis therapy (THER6P. 849) J Immunol. 2014;192:201–205. [Google Scholar]
- 18.Lill CM, et al. Independent replication of STAT3 association with multiple sclerosis risk in a large German case-control sample. Neurogenetics. 2012;13:83–86. doi: 10.1007/s10048-011-0305-6. [DOI] [PubMed] [Google Scholar]
- 19.Tiwari P, Chandra, Pal R. The potential role of neuroinflammation and transcription factors in Parkinson disease. Dialogues Clin Neurosci. 2017;19:71–80. doi: 10.31887/DCNS.2017.19.1/rpal. [DOI] [PMC free article] [PubMed] [Google Scholar]
- 20.Haim LB, et al. The JAK/STAT3 pathway is a common inducer of astrocyte reactivity in Alzheimer’s and Huntington’s diseases. J. Neurosci. 2015;35:2817–2829. doi: 10.1523/JNEUROSCI.3516-14.2015. [DOI] [PMC free article] [PubMed] [Google Scholar]
- 21.Tumurkhuu G, et al. Ogg1-dependent DNA repair regulates NLRP3 inflammasome and prevents atherosclerosis. Circ Res. 2016;119:e76–e90. doi: 10.1161/CIRCRESAHA.116.308362. [DOI] [PMC free article] [PubMed] [Google Scholar]
- 22.Amirinejad R, et al. Alteration of OGG1, MYH and MTH1 genes expression in relapsing-remitting multiple sclerosis patients. Physiol Pharmacol. 2017;21:129–136. [Google Scholar]
- 23.Karahalil B, Orhan G, Ak F. The impact of detoxifying and repair gene polymorphisms and the levels of serum ROS in the susceptibility to multiple sclerosis. Clin Neurol Neurosurg. 2015;139:288–294. doi: 10.1016/j.clineuro.2015.10.028. [DOI] [PubMed] [Google Scholar]
- 24.Dai Y, et al. Microarray analysis of microRNA expression in peripheral blood cells of systemic lupus erythematosus patients. Lupus. 2007;16:939–946. doi: 10.1177/0961203307084158. [DOI] [PubMed] [Google Scholar]
- 25.Hammond E, et al. The Wnt effector transcription factor 7-like 2 positively regulates oligodendrocyte differentiation in a manner independent of Wnt/β-catenin signaling. J Neurosci. 2015;35:5007–5022. doi: 10.1523/JNEUROSCI.4787-14.2015. [DOI] [PMC free article] [PubMed] [Google Scholar]
- 26.Zhao C, et al. Dual regulatory switch through interactions of Tcf7l2/Tcf4 with stage-specific partners propels oligodendroglial maturation. Nat Commun. 2016;7:p.10883. doi: 10.1038/ncomms10883. [DOI] [PMC free article] [PubMed] [Google Scholar]
- 27.Weng C, Ding M, Fan S, Cao Q, Lu Z. Transcription factor 7 like 2 promotes oligodendrocyte differentiation and remyelination. Mol Med Rep. 2017;16:1864–1870. doi: 10.3892/mmr.2017.6843. [DOI] [PMC free article] [PubMed] [Google Scholar]
- 28.Gray PA, et al. Mouse brain organization revealed through direct genome-scale TF expression analysis. Science. 2004;306:2255–2257. doi: 10.1126/science.1104935. [DOI] [PubMed] [Google Scholar]
- 29.Fu H, et al. A genome-wide screen for spatially restricted expression patterns identifies transcription factors that regulate glial development. J Neurosci. 2009;29:11399–11408. doi: 10.1523/JNEUROSCI.0160-09.2009. [DOI] [PMC free article] [PubMed] [Google Scholar]
- 30.Fancy SPJ, et al. Dysregulation of the Wnt pathway inhibits timely myelination and remyelination in the mammalian CNS. Genes Dev. 2009;23:1571–1585. doi: 10.1101/gad.1806309. [DOI] [PMC free article] [PubMed] [Google Scholar]
- 31.Giampetruzzi A, John HC, Barbarese E. FMRP and myelin protein expression in oligodendrocytes. Mol Cell Neurosci. 2013;56:333–341. doi: 10.1016/j.mcn.2013.07.009. [DOI] [PMC free article] [PubMed] [Google Scholar]
- 32.Marek D, et al. Carriers of the fragile X mental retardation 1 (FMR1) premutation allele present with increased levels of cytokine IL-10. J Neuroinflammation. 2012;9:238. doi: 10.1186/1742-2094-9-238. [DOI] [PMC free article] [PubMed] [Google Scholar]
- 33.Zhang L, et al. FMR1 premutation in females diagnosed with multiple sclerosis. J Neurol Neurosurg Psychiatry. 2009;80:812–814. doi: 10.1136/jnnp.2008.160960. [DOI] [PubMed] [Google Scholar]
- 34.Egawa H, et al. The miR-130 family promotes cell migration and invasion in bladder cancer through FAK and Akt phosphorylation by regulating PTEN. Sci Rep. 2016;6:20574. doi: 10.1038/srep20574. [DOI] [PMC free article] [PubMed] [Google Scholar]
- 35.Lopez-Ramirez MA, et al. Regulation of brain endothelial barrier function by microRNAs in health and neuroinflammation. FASEB J. 2016;30:2662–2672. doi: 10.1096/fj.201600435RR. [DOI] [PubMed] [Google Scholar]
- 36.Spieler D, et al. Restless legs syndrome-associated intronic common variant in Meis1 alters enhancer function in the developing telencephalon. Genome Res. 2014;24:592–603. doi: 10.1101/gr.166751.113. [DOI] [PMC free article] [PubMed] [Google Scholar]
- 37.Thireau J, et al. MEIS1 variant as a determinant of autonomic imbalance in Restless Legs Syndrome. Sci Rep. 2017;7:46620. doi: 10.1038/srep46620. [DOI] [PMC free article] [PubMed] [Google Scholar]
- 38.Jang J, et al. MLN51 and GM-CSF involvement in the proliferation of fibroblast-like synoviocytes in the pathogenesis of rheumatoid arthritis. Arthritis Res Ther. 2006;8:R170. doi: 10.1186/ar2079. [DOI] [PMC free article] [PubMed] [Google Scholar]
- 39.Ghislain J, Charnay P. Control of myelination in Schwann cells: a Krox20 cis‐regulatory element integrates Oct6, Brn2 and Sox10 activities. EMBO Rep. 2006;7:52–58. doi: 10.1038/sj.embor.7400573. [DOI] [PMC free article] [PubMed] [Google Scholar]
- 40.Kohama I, et al. Transplantation of cryopreserved adult human Schwann cells enhances axonal conduction in demyelinated spinal cord. J Neurosci. 2001;21:944–950. doi: 10.1523/JNEUROSCI.21-03-00944.2001. [DOI] [PMC free article] [PubMed] [Google Scholar]
- 41.Bandarra D, et al. HIF-1α restricts NF-κB-dependent gene expression to control innate immunity signals. Dis Model Mech. 2015;8:169–181. doi: 10.1242/dmm.017285. [DOI] [PMC free article] [PubMed] [Google Scholar]
- 42.Schmitz ML, et al. Signal integration, crosstalk mechanisms and networks in the function of inflammatory cytokines. Biochim.Biophys Acta Mol Cell Res. 2011;1813:2165–2175. doi: 10.1016/j.bbamcr.2011.06.019. [DOI] [PubMed] [Google Scholar]
- 43.Liu Q, et al. MicroRNA-590 promotes pathogenic Th17 cell differentiation through targeting Tob1 and is associated with multiple sclerosis. Biochem Biophys Res Commun. 2017;493:901–908. doi: 10.1016/j.bbrc.2017.09.123. [DOI] [PubMed] [Google Scholar]
- 44.Schaefer U, Schmeier S, Vladimir BB. TcoF-DB: dragon database for human transcription co-factors and transcription factor interacting proteins. Nucleic Acids Res. 2010;39:D106–D110. doi: 10.1093/nar/gkq945. [DOI] [PMC free article] [PubMed] [Google Scholar]
- 45.Kummerfeld SK, Sarah A. Teichmann. DBD: a transcription factor prediction database. Nucleic Acids Res. 2006;34:D74–D81. doi: 10.1093/nar/gkj131. [DOI] [PMC free article] [PubMed] [Google Scholar]
- 46.Karolchik D, et al. The UCSC genome browser database. Curr Protoc Bioinformatics. 2003;31:51–54. doi: 10.1002/0471250953.bi0104s40. [DOI] [PubMed] [Google Scholar]
- 47.Zhou K-R, et al. ChIPBase v2. 0: decoding transcriptional regulatory networks of non-coding RNAs and protein-coding genes from ChIP-seq data. Nucleic Acids Res. 2016;45:D43–50. doi: 10.1093/nar/gkw965. [DOI] [PMC free article] [PubMed] [Google Scholar]
- 48.Mullany LE, et al. MicroRNA‐transcription factor interactions and their combined effect on target gene expression in colon cancer cases. Genes, Chromosomes and Cancer. 2018;57:192–202. doi: 10.1002/gcc.22520. [DOI] [PMC free article] [PubMed] [Google Scholar]
- 49.Friard O, et al. CircuitsDB: a database of mixed microRNA/transcription factor feed-forward regulatory circuits in human and mouse. BMC Bioinformatics. 2010;11:435. doi: 10.1186/1471-2105-11-435. [DOI] [PMC free article] [PubMed] [Google Scholar]
- 50.Wang J, et al. TransmiR: a transcription factor–microRNA regulation database. Nucleic Acids Res. 2009;38:D119–D122. doi: 10.1093/nar/gkp803. [DOI] [PMC free article] [PubMed] [Google Scholar]
- 51.Bandyopadhyay S, Bhattacharyya M. PuTmiR: a database for extracting neighboring transcription factors of human microRNAs. BMC Bioinformatics. 2010;11:190. doi: 10.1186/1471-2105-11-190. [DOI] [PMC free article] [PubMed] [Google Scholar]
- 52.Dweep, H., Gretz, N, & Sticht, C. miRWalk Database for miRNA–Target Interactions. Methods Mol Biol. 289–305 (2014). [DOI] [PubMed]
- 53.Xiao F, et al. miRecords: an integrated resource for microRNA–target interactions. Nucleic Acids Res. 2008;37:D105–D110. doi: 10.1093/nar/gkn851. [DOI] [PMC free article] [PubMed] [Google Scholar]
- 54.Hsu S-D, et al. miRTarBase: a database curates experimentally validated microRNA–target interactions. Nucleic Acids Res. 2010;39:D163–D169. doi: 10.1093/nar/gkq1107. [DOI] [PMC free article] [PubMed] [Google Scholar]
- 55.Ruepp Andreas, Kowarsch Andreas, Schmidl Daniel, Bruggenthin Felix, Brauner Barbara, Dunger Irmtraud, Fobo Gisela, Frishman Goar, Montrone Corinna, Theis Fabian J. PhenomiR: a knowledgebase for microRNA expression in diseases and biological processes. Genome Biology. 2010;11(1):R6. doi: 10.1186/gb-2010-11-1-r6. [DOI] [PMC free article] [PubMed] [Google Scholar]
- 56.Jiang Q, et al. miR2Disease: a manually curated database for microRNA deregulation in human disease. Nucleic Acids Res. 2008;37:D98–D104. doi: 10.1093/nar/gkn714. [DOI] [PMC free article] [PubMed] [Google Scholar]
- 57.Adler Priit, Kolde Raivo, Kull Meelis, Tkachenko Aleksandr, Peterson Hedi, Reimand Jüri, Vilo Jaak. Mining for coexpression across hundreds of datasets using novel rank aggregation and visualization methods. Genome Biology. 2009;10(12):R139. doi: 10.1186/gb-2009-10-12-r139. [DOI] [PMC free article] [PubMed] [Google Scholar]
- 58.Gennarino VA, et al. Identification of microRNA-regulated gene networks by expression analysis of target genes. Genome Res. 2012;22:1163–1172. doi: 10.1101/gr.130435.111. [DOI] [PMC free article] [PubMed] [Google Scholar]
- 59.Parkinson H, et al. ArrayExpress—a public database of microarray experiments and gene expression profiles. Nucleic Acids Res. 2006;35:D747–D750. doi: 10.1093/nar/gkl995. [DOI] [PMC free article] [PubMed] [Google Scholar]
- 60.Martinelli-Boneschi F, et al. MicroRNA and mRNA expression profile screening in multiple sclerosis patients to unravel novel pathogenic steps and identify potential biomarkers. Neurosci Lett. 2012;508:4–8. doi: 10.1016/j.neulet.2011.11.006. [DOI] [PubMed] [Google Scholar]
- 61.Subramanian, S. Competing endogenous RNAs (ceRNAs): new entrants to the intricacies of gene regulation. Front Genet. 5, 10.3389/fgene.2014.00008 (2014). [DOI] [PMC free article] [PubMed]
- 62.Pathan M, et al. FunRich: An open access standalone functional enrichment and interaction network analysis tool. Proteomics. 2015;15:2597–2601. doi: 10.1002/pmic.201400515. [DOI] [PubMed] [Google Scholar]
- 63.Polman CH, et al. Diagnostic criteria for multiple sclerosis: 2010 revisions to the McDonald criteria. Ann Neurol. 2011;69:292–302. doi: 10.1002/ana.22366. [DOI] [PMC free article] [PubMed] [Google Scholar]
- 64.Kurtzke JF. Rating neurologic impairment in multiple sclerosis: an expanded disability status scale (EDSS) Neurology. 1983;33:1444–1444. doi: 10.1212/WNL.33.11.1444. [DOI] [PubMed] [Google Scholar]
- 65.Rao X, Huang X, Zhou Z, Lin X. An improvement of the 2ˆ (−delta delta CT) method for quantitative real-time polymerase chain reaction data analysis. Biostat Bioinforma Biomath. 2013;3:71–85. [PMC free article] [PubMed] [Google Scholar]
Associated Data
This section collects any data citations, data availability statements, or supplementary materials included in this article.


