

Abstract
The percentage of programmed death ligand 1 (PD‐L1) positivity in cancer cells, named as the tumor proportion score, is considered to be a predictive biomarker for anti‐PD‐1/PD‐L1 therapy in lung cancer. PD‐L1 is expressed on not only cancer cells but also on immune cells, including macrophages. Although previous studies related to PD‐L1/2 expression in cancer tissues have been generally based on single immunohistochemistry (IHC), in the present study, we attempted to evaluate accurate PD‐L1/2 expression in cancer cells in lung adenocarcinoma cells using double IHC to also evaluate macrophages. Of the 231 patients, PD‐L1 expression was negative in 169 patients (73.2%), 1%‐49% positive in 47 patients (20.3%), and ≥50% positive in 15 patients (6.5%). Interestingly, PD‐L1 positivity was decreased when using double IHC compared with the estimation by single IHC. High PD‐L1 expression was associated with high‐grade cancer cells and in higher stage cancer. PD‐L2 was negative in 109 patients (47.2%), 1%‐49% positive in 50 patients (21.6%), and ≥50% positive in 72 patients (31.2%). The number of PD‐L2‐positive patients was increased in cases that had an epidermal growth factor receptor (EGFR) mutation and in lower stage cancer. Thirty‐five patients (15.2%) were positive for both PD‐L1 and PD‐L2, whereas 81 patients (35.1%) were negative for both PD‐L1 and PD‐L2. Log‐rank analysis showed that progression‐free survival and overall survival were significantly the longest in the PD‐L1‐negative and PD‐L2‐positive groups (P < .0001 and P = .0120). We observed lower PD‐L1 or PD‐L2 expression in lung adenocarcinoma than previously reported. Double IHC for macrophages may help clinicians to evaluate PD‐L1 or PD‐L2 expression specifically in cancer cells.
Keywords: lung adenocarcinoma, macrophage, PD‐L1, PD‐L2, tumor proportion score
1. INTRODUCTION
Lung cancer is the leading cause of cancer death, and mortality and morbidity are increasing continuously worldwide.1 Tobacco smoking is the most well known risk factor for lung cancer. Recent advancement and spread of computed tomography scanning have contributed to early diagnosis, but lung cancer is still often found at the advanced stages.2, 3 In addition to conventional chemotherapy/radiotherapy, intervention with immunotherapy blocking immune checkpoint molecules such as programmed cell death protein 1 (PD‐1) has shown significant anti‐cancer effects in non‐small‐cell lung cancers (NSCLCs),4, 5, 6 and the use of anti‐PD‐1 or anti‐programmed death ligand 1 (PD‐L1) antibodies is now becoming standard therapy for NSCLCs.
T‐cell exhaustion due to binding of PD‐1 and PD‐L1 induces immune evasion of cancer cells from anti‐cancer immune responses.7 The percentage of PD‐L1‐positivity in cancer cells, named the tumor proportion score (TPS), is also considered a predictive biomarker for anti‐PD‐1/PD‐L1 therapy in lung cancer.8 Several monoclonal antibodies such as 22C3, 28‐8, SP263, and SP142 have been used for immunohistochemistry (IHC) to detect PD‐L1 expression, and clones 22C3 and SP142 are now available for companion and complementary diagnostics.9 Several retrospective studies using pathological specimens have been published recently. High PD‐L1 expression has been associated with shortened recurrence‐free survival in NSCLCs, and PD‐L1 expression in cancer cells was involved in poor overall survival in lung adenocarcinoma, but not in small‐cell carcinoma and squamous‐cell carcinoma.10 While several studies have investigated the significance of PD‐L1 expression in lung cancers, only a few studies using clone 22C3 have been published.
PD‐L1 is expressed on not only cancer cells but also on immune cells including macrophages.11, 12 Although many researchers noted that PD‐L1 expression on macrophages made it difficult to evaluate PD‐L1 expression in cancer cells, recently published studies related to PD‐L1 expression in cancer tissues have generally performed single IHC using anti‐PD‐L1 antibody. In the present study, we attempted to evaluate PD‐L1 expression (clone 22C3) and PD‐L2 expression in cancer cells in lung adenocarcinoma specifically by using double IHC for macrophages.
2. MATERIALS AND METHODS
2.1. Samples
Paraffin‐embedded samples were prepared from specimens obtained from 231 patients diagnosed with lung adenocarcinoma between 2010 and 2013 at Kumamoto University Hospital, Japan. Written informed consent was obtained from all patients in accordance with protocols from the Kumamoto University Review Board, and the study design was approved by the Kumamoto University Review Board (approval no. 1174). Two pathologists reviewed all tissue specimens, and the most representative area of a 5‐mm diameter core containing viable lung adenocarcinoma cells was carefully selected for tissue microarrays.
2.2. Immunohistochemistry
The DAKO automation system (Autostainer Link 48; DAKO, Glostrup, Denmark) was used for immunohistochemical analysis of PD‐L1 (clone 22C3; DAKO). For PD‐L2 staining, anti‐PD‐L2 antibody (clone D7U8C; Cell Signaling Technology, Danvers, MA, USA) was used as the primary antibody. The specificity of the anti‐PD‐L2 antibody has been tested previously.13 Horseradish peroxidase (HRP)‐labeled anti‐rabbit immunoglobulin antibody (Nichirei, Tokyo, Japan) was used as the secondary antibody. For PD‐L2 staining, the Tyramide Signal Amplification (TSA) system (DAKO) was used before visualization. 3,3′‐Diaminobenzidine was used to visualize positive signals in the 1st step. Then, sections were treated by heating in 1 mmol/L EDTA buffer (pH 8.0) and macrophages were detected using anti‐Iba1 antibody (rabbit polyclonal, WAKO, Tokyo, Japan). Sections were then treated with HRP‐labeled anti‐rabbit immunoglobulin antibody, and the positive signal was visualized using HistoGreen substrate (#AYS‐E109; Linaris, Dossenheim, Germany) as the 2nd step for double IHC. Two investigators (YK and YS), who were blinded to information about the samples, evaluated PD‐L1 and PD‐L2 expression.
2.3. Statistical analysis
Statistical analysis was carried out using StatMate V (ATOMS, Tokyo, Japan) and JMP7 software (SAS Institute, Chicago, IL, USA). Bivariate comparisons of clinicopathological features between patients with PD‐L1/2‐positive and PD‐L1/2‐negative cancer cells were performed using the chi‐squared test (Fisher's exact test). The association of multiple prognostic factors with cancer‐specific survival was assessed using univariate and multivariate Cox proportional hazard model analyses. Survival curves were calculated using the Kaplan‐Meier method, and the difference between survival curves was analyzed using the log‐rank test. Regression analysis was used to assess the relationship between two variables. Differences were considered statistically significant at P < .05.
3. RESULTS
3.1. Double IHC of PD‐L1 and macrophages (Iba‐1) improved the diagnostic accuracy of PL‐L1 tumor proportion score due to single IHC
It was difficult to distinguish PD‐L1‐positive cancer cells from PD‐L1‐positive macrophages by single IHC in some cases. However, double IHC of PD‐L1 and macrophages helped to determine PD‐L1 expression specifically in cancer cells (Figure 1A). PD‐L1 expression was scored based on the percentage of positive staining (referred to as the tumor proportion score, TPS) as follows: <1% of positive cells, negative; 1%‐49% and >50%, positive.14 Of 231 patients, PD‐L1 expression was negative in 169 patients (73.2%) and positive in 62 patients (26.8%). Of 62 PD‐L1‐positive patients, 47 patients (20.3%) were TPS 1%‐49% and 15 patients (6.5%) were TPS ≥50%. Although high TPS (≥50%) was associated with high‐grade cancer cells and higher stage cancer, PD‐L1 expression was not correlated with age, sex, smoking, and epidermal growth factor receptor (EGFR) mutation (Table 1). Then we compared the results of TPS scoring from single and double IHC. The percentages of TPS score due to single IHC was 140 patients (<1%), 65 patients (1%‐49%), and 26 patients (>50%). These results indicated that overestimation of TPS score was observed in 37 (16.0%) patients when estimated using single IHC (Figure 1B).
Figure 1.
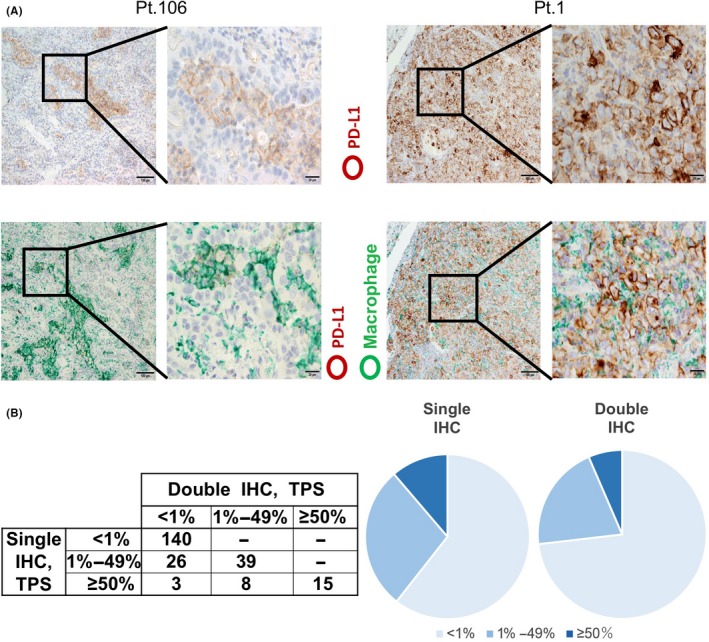
Anti‐programmed death ligand 1 (PD‐L1) immunohistochemistry (IHC). A, Single IHC of PD‐L1 (upper panels) and double IHC of PD‐L1 and Iba‐1 (a pan‐macrophage marker) (lower panels). Representative images from PD‐L1‐negative (left side) and PD‐L1‐positive (right side) cases are presented. PD‐L1 and Iba‐1 signals were labeled as brown and green, respectively. B, Tumor proportion score determined by single IHC of PD‐L1 and double IHC of PD‐L1 and Iba‐1. Numbers represent the number of patients for each group
Table 1.
PD‐L1 or PD‐L2 expression and clinicopathological factors
| PD‐L1 | PD‐L2 | |||||||
|---|---|---|---|---|---|---|---|---|
| <1% | 1%‐49% | ≥50% | P | <1% | 1%‐49% | ≥50% | P | |
| Age | ||||||||
| <65 | 49 | 12 | 7 | .2858 | 36 | 13 | 19 | .5265 |
| ≥65 | 120 | 35 | 8 | 73 | 37 | 53 | ||
| Gender | ||||||||
| Male | 79 | 26 | 10 | .2334 | 62 | 22 | 31 | .1244 |
| Female | 90 | 21 | 5 | 47 | 28 | 41 | ||
| Smoking | ||||||||
| Ever | 78 | 27 | 10 | .1568 | 62 | 21 | 32 | .1207 |
| Never | 91 | 20 | 5 | 47 | 29 | 40 | ||
| EGFR | ||||||||
| Mutation | 86 | 17 | 3 | .0648 | 40 | 25 | 41 | .0217 |
| Wild type | 71 | 27 | 11 | 63 | 19 | 27 | ||
| Unknown | 12 | 3 | 1 | 6 | 6 | 4 | ||
| Grade | ||||||||
| 1 | 101 | 16 | 4 | .0009 | 53 | 30 | 38 | .4096 |
| 2‐3 | 68 | 31 | 11 | 56 | 20 | 34 | ||
| pStage | ||||||||
| 0‐I | 139 | 32 | 7 | .0019 | 74 | 42 | 62 | .0071 |
| II‐VI | 30 | 15 | 8 | 35 | 8 | 10 | ||
Chi‐squared test (Fisher's exact test) was performed. Italics indicates statistical significance.
3.2. PD‐L1 expression was associated with progression‐free survival (PFS) and overall survival (OS) in patients with lung adenocarcinoma
Log‐rank analysis indicated that PFS and OS were significantly shorter in the high TPS group (≥50% PD‐L1‐positive) than the low TPS groups (1%‐49% and <1%) (P = .0176) (Figure 2A, B and Tables 2 and 3). Moreover, TPS was an independent prognostic factor for PFS in multivariate analysis (P = .0103). When PD‐L1 expression was classified into two groups (<1% and ≥1%), PFS and OS were also significantly shorter in the PD‐L1‐positive group than the PD‐L1‐negative group (P = .0103 and P < .0001, respectively). When patients were grouped into two groups according to EGFR mutation, PD‐L1 TPS was associated with PFS in both groups.
Figure 2.
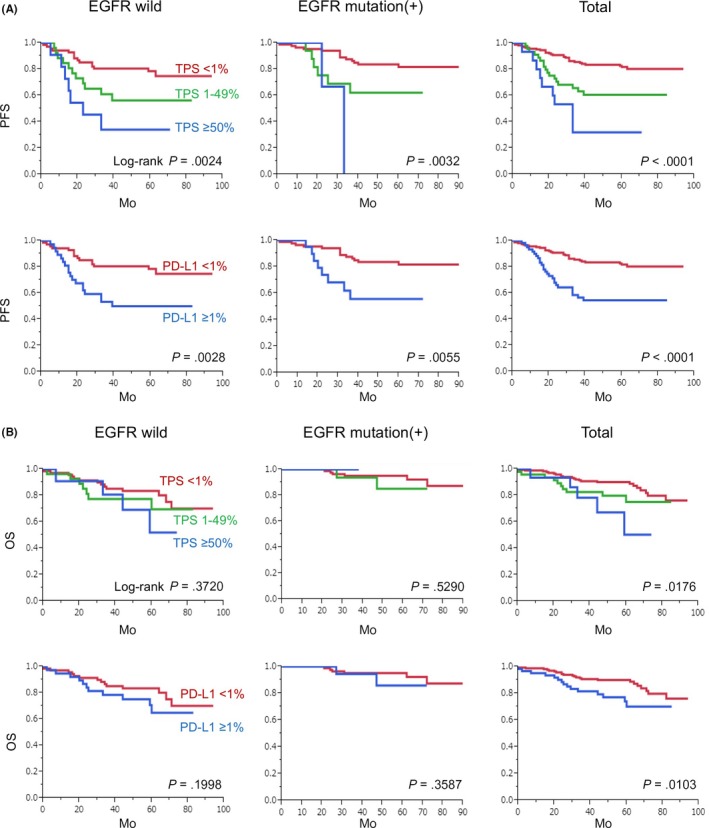
Kaplan‐Meier analysis of PD‐L1 tumor proportion score (TPS) and survival rate. PD‐L1 expression was divided into three or two groups according to TPS. Statistical analyses related to progression‐free survival (A) and overall survival (B) were performed
Table 2.
Univariate and multivariate analyses for progression‐free survival
| Univariate | Multivariate | |||||
|---|---|---|---|---|---|---|
| P‐value | HR | 95%CI | P‐value | HR | 95%CI | |
| Age | ||||||
| ≤65 vs 65< | .5900 | 1.175 | 0.664‐2.196 | |||
| Gender | ||||||
| Male vs Female | .0259 | 0.546 | 0.313‐0.930 | .6472 | 0.828 | 0.365‐1.841 |
| Smoking | ||||||
| Never vs Ever | .0215 | 1.870 | 1.096‐3.252 | .8379 | 0.917 | 0.404‐2.100 |
| EGFR | ||||||
| Wild type vs Mutation | .0651 | 0.605 | 0.348‐1.032 | |||
| Grade | ||||||
| 1 vs 2‐3 | <.0001 | 3.380 | 1.923‐6.230 | .0647 | 1.772 | 0.966‐3.384 |
| pStage | ||||||
| pStage 0‐I vs pStage II‐IV | <.0001 | 9.485 | 5.488‐16.84 | <.0001 | 6.236 | 3.423‐11.60 |
| PD‐L1 | ||||||
| Negative vs Positive | <.0001 | 3.134 | 1.830‐5.341 | .0103 | 2.086 | 1.192‐3.635 |
| PD‐L2 | ||||||
| Negative vs Positive | .0006 | 0.388 | 0.216‐0.672 | .0823 | 0.594 | 0.321‐1.068 |
Italics indicates statistically significant.
Abbreviations: CI: confidential interval; HR: hazard ratio.
Table 3.
: Univariate and multivariate analyses for overall survival
| Univariate | Multivariate | |||||
|---|---|---|---|---|---|---|
| P‐value | HR | 95%CI | P‐value | HR | 95%CI | |
| Age | ||||||
| ≤65 vs 65< | .0536 | 2.123 | 0.989‐5.258 | |||
| Gender | ||||||
| Male vs Female | <.0001 | 0.233 | 0.099‐0.484 | .1357 | 0.404 | 0.112‐1.309 |
| Smoking | ||||||
| Never vs Ever | .0001 | 3.811 | 1.876‐8.548 | .6951 | 1.281 | 0.394‐4.780 |
| EGFR | ||||||
| Wild type vs Mutation | .0015 | 0.304 | 0.128‐0.645 | .2946 | 0.622 | 0.236‐1.485 |
| Grade | ||||||
| 1 vs 2‐3 | .0002 | 3.594 | 1.803‐7.783 | .0592 | 2.206 | 0.971‐5.504 |
| pStage | ||||||
| pStage 0‐I vs pStage II‐IV | <.0001 | 5.399 | 2.846‐10.47 | .0106 | 2.657 | 1.255‐5.771 |
| PD‐L1 | ||||||
| Negative vs Positive | .0165 | 2.313 | 1.173‐4.433 | .7792 | 1.112 | 0.521‐2.307 |
| PD‐L2 | ||||||
| Negative vs Positive | .2096 | 1.202 | 0.902‐1.606 | |||
Italics indicates statistical significance.
Abbreviations: CI: confidential interval; HR: hazard ratio.
3.3. PD‐L2 expression was associated with PFS in patients with lung adenocarcinoma
We then evaluated PD‐L2 expression in cancer cells using double IHC for macrophages (Figure 3A). Of 231 patients, PD‐L2 was negative in 109 patients (47.2%) and positive in 122 patients (52.8%). Of 122 PD‐L2‐positive patients, 50 patients (21.6%) were TPS 1%‐49% and 72 patients (31.2%) were TPS ≥ 50%. High TPS (≥50%) was associated with EGFR mutation and the patients that had low stage cancer (Table 3); however, there was no significant correlation between PD‐L2 expression and other clinicopathological factors such as age, sex, smoking, and grade (Tables 1, 2, 3). Compared with PD‐L1, a greater number of PD‐L2‐positive cases was seen (Figure 3B). Log‐rank analysis indicated that PFS was significantly longer in the PD‐L2‐positive (≥1%) group than the PD‐L1‐negative (<1%) group (P = .0006) (Figure 4A). When patients were grouped into two groups according to EGFR mutation, PD‐L2 TPS was associated with PFS in cases without EGFR mutation. However, there was no correlation between PD‐L2 expression and OS (Figure 4B).
Figure 3.
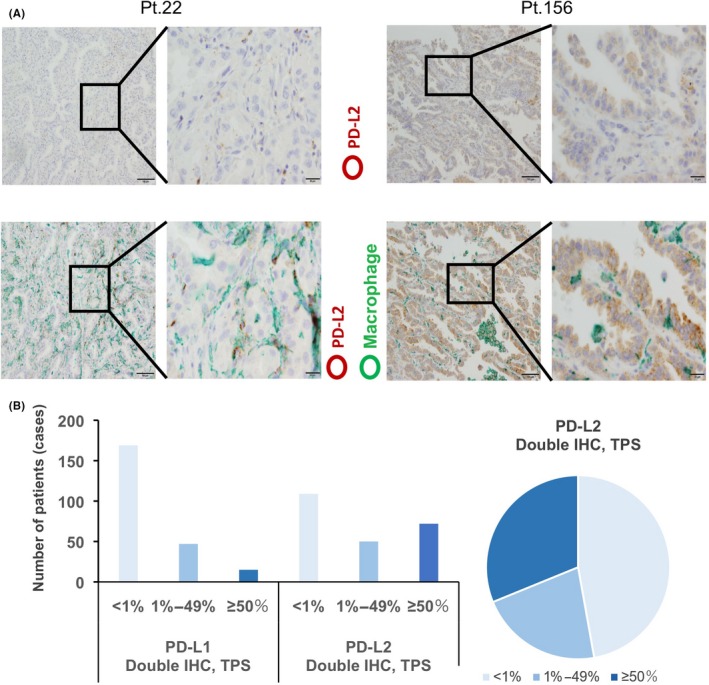
Anti‐programmed death ligand 2 (PD‐L2) immunohistochemistry (IHC). A, Single IHC of PD‐L2 (upper panels) and double IHC of PD‐L2 and Iba‐1 (lower panels). Representative images from PD‐L2‐negative (left side) and anti‐programmed death ligand 1 (PD‐L1)‐positive (right side) cases are presented. PD‐L2 and Iba‐1 signals were labeled as brown and green, respectively. B, The number of cases for each PD‐L1 and PD‐L2 tumor proportion score (TPS) and percentages of PD‐L2 TPS by double IHC are presented
Figure 4.
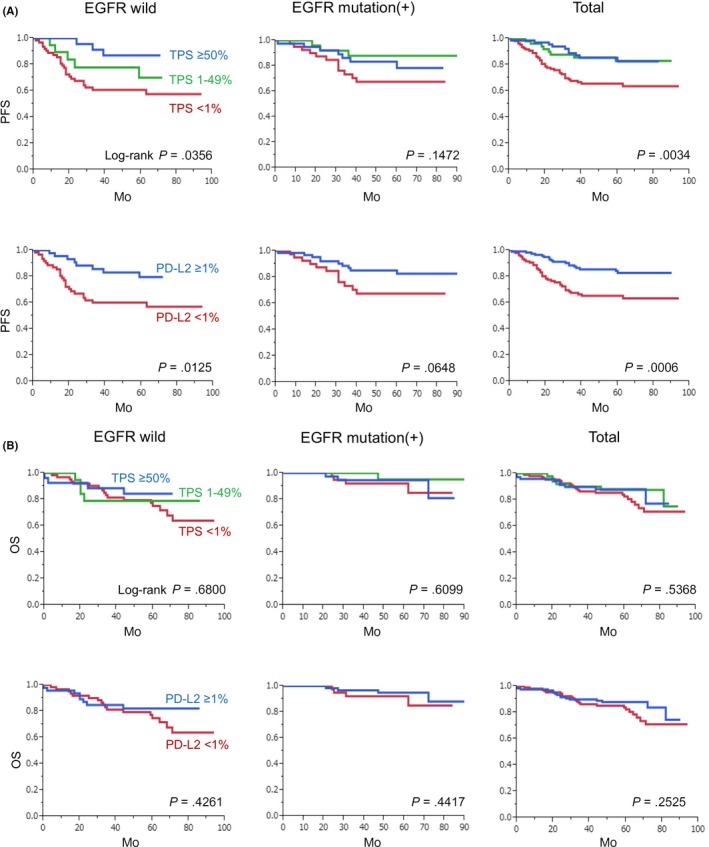
Kaplan‐Meier analysis of anti‐programmed death ligand 2 (PD‐L2) tumor proportion score (TPS) and survival rate. PD‐L2 expression was divided into three or two groups according to TPS. Statistical analyses related to progression‐free survival (A) and overall survival (B) were performed
3.4. PD‐L1‐negative and PD‐L2‐positive cases showed the longest PFS and OS
Thirty‐five (15.1%) of 231 patients were positive (≥1%) for both PD‐L1 and PD‐L2, whereas 81 patients (35.1%) were negative (<1%) for both PD‐L1 and PD‐L2 (Figure 5A). Twenty‐seven (11.7%) and 88 patients (38.1%) were positive for only PD‐L1 and PL‐L2, respectively. There was no significant correlation between PD‐L1 and PD‐L2 expression (Table 4). We then divided patients into four groups based on PD‐L1 and PD‐L2 expression and found that PFS and OS in the PD‐L1‐negative and PD‐L2‐positive group were longest (Figure 5B).
Figure 5.
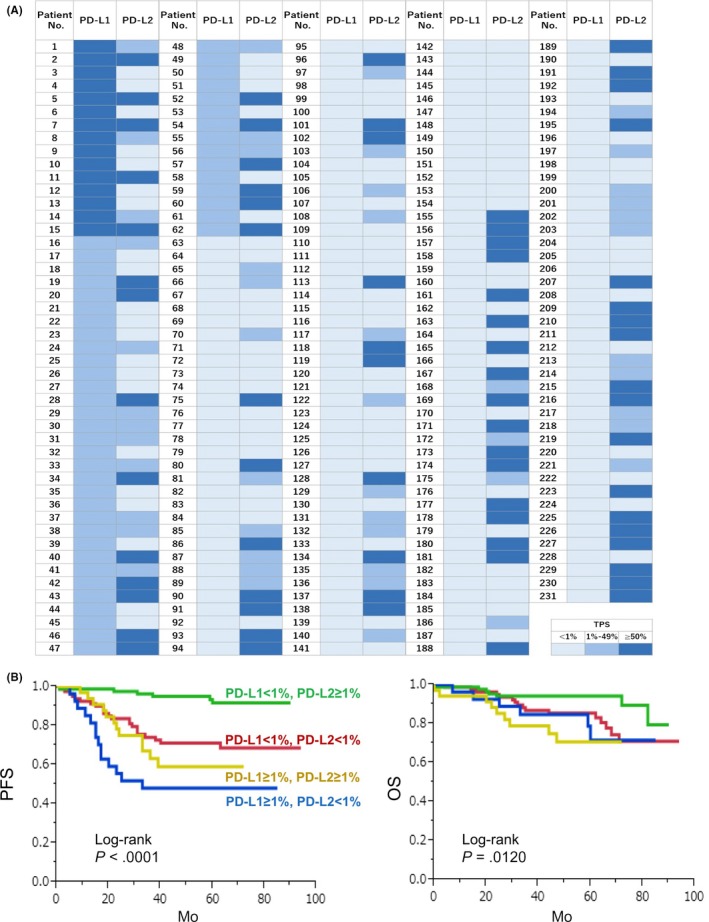
Anti‐programmed death ligand 1 (PD‐L1) and anti‐programmed death ligand 2 (PD‐L2) expression in cancer cells. A, PD‐L1 and PD‐L2 expression was evaluated in 231 patients. B, Patients were divided into four groups based on PD‐L1 and PD‐L2 expression and Kaplan‐Meier analysis was performed
Table 4.
Correlation of PD‐L1 and PD‐L2 expression
| PD‐L2 | P‐value | |||
|---|---|---|---|---|
| <1% | 1%‐49% | ≥50% | ||
| PD‐L1 | ||||
| <1% | 81 | 36 | 52 | 0.957 |
| 1%‐49% | 20 | 12 | 15 | |
| ≥50% | 7 | 3 | 5 | |
Fisher's exact test was performed.
4. DISCUSSION
Nivolumab, pembrolizumab, and atezolizumab have recently been approved by the United States Food and Drug Administration as immune checkpoint inhibitors for the treatment of lung cancers.15, 16, 17 For first‐line treatment of lung cancer, pembrolizumab is approved for PD‐L1‐positive cases (TPS ≥ 1%) based on the results of KEYNOTE‐042. Several monoclonal antibodies such as 22C3, 28‐8, SP263, and SP142 that have been used for IHC, and PD‐L1 IHC 22C3 pharmDx and Ventana PD‐L1 (SP142) assay are now available for companion and complementary diagnostics.9 However, the TPS scoring system was created using single IHC of PD‐L1. In the present study, we used clone 22C3 for PD‐L1 IHC and we attempted both single and double IHC (PD‐L1 and macrophages). Although we showed only results from double IHC, we initially attempted to evaluate PD‐L1 TPS using single IHC. When we compared the results of TPS scoring from single and double IHC, notably, overestimation of TPS in single IHC was observed in 37 (16.0%) patients. Therefore, we consider that double IHC for PD‐L1 and macrophages is useful for adequate evaluation of PD‐L1 TPS in cases with high macrophage infiltration.
In the present study, PD‐L1‐positive cancer cells were observed in 26.8% of patients with lung adenocarcinoma. However, previous studies have shown PD‐L1 expression in 32%‐66% of patients with lung NSCLCs.16, 18, 19, 20 PD‐L1 positivity in cancer cells was reportedly higher (65%) in lung adenocarcinoma than that in squamous‐cell carcinoma (44%).21 Therefore, PD‐L1 positivity was higher in previous studies than in our present study, and we speculated that PD‐L1 expression in macrophages influenced this discrepancy.
Concerning PD‐L2 expression, Takamori et al21 recently published data from a large number of lung adenocarcinoma patients, in which they described that PD‐L2 expression was seen in 71% of patients and showed that PD‐L2 positivity was an independent prognostic factor for OS. In the present study, PD‐L2 positivity was seen in 46% of patients, and we found that PD‐L2 expression in macrophages seemed to be higher than that of cancer cells (unpublished data). Interestingly, PD‐L2 expression was also associated with better clinical course in the present study, which is inconsistent with the results from the study conducted by Takamori et al. This discrepancy might be due to differences in antibody clone used for IHC and IHC methods. We suggest that double IHC using anti‐macrophage antibody might be necessary for exact evaluation of PD‐L1 and PD‐L2 expression.
The mechanisms of PD‐L1 expression in cancer cells have been thoroughly investigated, and several intrinsic and extrinsic mechanisms have been clarified. JAK‐STAT1/3 pathways, NF‐κB pathways, AKT‐related pathways, and c‐myc‐related pathways, which are induced by various stimuli, are all associated with PD‐L1 expression.22 In addition to these extrinsic stimuli, intrinsic genetic alteration such as PD‐L1 gene amplification and deletion of the 3′‐UTR may influence PD‐L1 expression.23 We previously found that there was a significant correlation between PD‐L1 expression in cancer cells and macrophage infiltration in the tumor microenvironment, and macrophage‐derived tumor necrosis factor‐α was revealed to induce PD‐L1 overexpression via NF‐κB signal activation in pancreatic cancer.24 In the present study, macrophage infiltration was also detected by Iba‐1 IHC as described previously.25 Because it was difficult to count the macrophage density adequately in the sections, we could not evaluate the correlation between PD‐L1/2 TPS and macrophages. Further studies are necessary to clarify the involvement of macrophage‐derived factors in PD‐L1 TPS. In addition, Iba‐1 was also reported to be expressed on monocytic myeloid‐derived suppressor cells as well as CD33.26 PD‐L1/2 expression was also seen in Iba‐1‐positive cells in many patients in the present study, and further studies are necessary to evaluate the significance of PD‐L1/2 expression in myeloid cells in lung adenocarcinoma.
In conclusion, we evaluated PD‐L1 and PD‐L2 specifically expressed in cancer cells in pathological specimens of lung adenocarcinoma. PD‐L1 expression in cancer cells was a significant prognostic factor for PFS independently of PD‐L2 expression. Double IHC using anti‐macrophage antibody might be useful for evaluating PD‐L1 and PD‐L2 expression in cancer cells in paraffin‐embedded tissues.
DISCLOSURE STATEMENT
None of the authors have any conflicts of interest in association with this manuscript.
ACKNOWLEDGMENTS
We thank Takenobu Nakagawa for technical assistance. This work was supported by grants from the Ministry of Education, Culture, Sports, Science, and Technology of Japan (Nos. 16H05162 and 16K15503).
Shinchi Y, Komohara Y, Yonemitsu K, et al. Accurate expression of PD‐L1/L2 in lung adenocarcinoma cells: A retrospective study by double immunohistochemistry. Cancer Sci. 2019;110:2711–2721. 10.1111/cas.14128
REFERENCES
- 1. Poirier AE, Ruan Y, Walter SD, et al. ComPARe Study Team. The future burden of cancer in Canada: long‐term cancer incidence projections 2013‐2042. Cancer Epidemiol. 2019;59:199‐207. [DOI] [PubMed] [Google Scholar]
- 2. Siegel RL, Miller KD, Jemal A. Cancer statistics, 2019. CA Cancer J Clin. 2019;69:7‐34. [DOI] [PubMed] [Google Scholar]
- 3. Yamaguchi T, Nishiura H. Predicting the epidemiological dynamics of lung cancer in Japan. J Clin Med. 2019;8:326. [DOI] [PMC free article] [PubMed] [Google Scholar]
- 4. Fehrenbacher L, Spira A, Ballinger M, et al. Atezolizumab versus docetaxel for patients with previously treated non‐small‐cell lung cancer (POPLAR): a multicentre, open‐label, phase 2 randomised controlled trial. Lancet. 2016;387:1837‐1846. [DOI] [PubMed] [Google Scholar]
- 5. Borghaei H, Paz‐Ares L, Horn L, et al. Nivolumab versus docetaxel in advanced nonsquamous non‐small‐cell lung cancer. N Engl J Med. 2015;373:1627‐1639. [DOI] [PMC free article] [PubMed] [Google Scholar]
- 6. Mino‐Kenudson M. Programmed cell death ligand‐1 (PD‐L1) expression by immunohistochemistry: could it be predictive and/or prognostic in non‐small cell lung cancer? Cancer Biol Med. 2016;13:157‐170. [DOI] [PMC free article] [PubMed] [Google Scholar]
- 7. Martinez P, Peters S, Stammers T, Soria JC. Immunotherapy for the first‐line treatment of patients with metastatic non‐small cell lung cancer. Clin Cancer Res. 2019;25:2691‐2698. [DOI] [PubMed] [Google Scholar]
- 8. Vigliar E, Malapelle U, Iaccarino A, et al. PD‐L1 expression on routine samples of non‐small cell lung cancer: results and critical issues from a 1‐year experience of a centralised laboratory. J Clin Pathol. 2019;72:412‐417. [DOI] [PubMed] [Google Scholar]
- 9. Hersom M, Jørgensen JT. Companion and complementary diagnostics‐focus on PD‐L1 expression assays for PD‐1/PD‐L1 checkpoint inhibitors in non‐small cell lung cancer. Ther Drug Monit. 2018;40:9‐16. [DOI] [PubMed] [Google Scholar]
- 10. Pawelczyk K, Piotrowska A, Ciesielska U, et al. Role of PD‐L1 expression in non‐small cell lung cancer and their prognostic significance according to clinicopathological factors and diagnostic markers. Int J Mol Sci. 2019;20:824. [DOI] [PMC free article] [PubMed] [Google Scholar]
- 11. Horlad H, Ma C, Yano H, et al. An IL‐27/Stat3 axis induces expression of programmed cell death 1 ligands (PD‐L1/2) on infiltrating macrophages in lymphoma. Cancer Sci. 2016;107:1696‐1704. [DOI] [PMC free article] [PubMed] [Google Scholar]
- 12. McCord R, Bolen CR, Koeppen H, et al. PD‐L1 and tumor‐associated macrophages in de novo DLBCL. Blood Adv. 2019;3:531‐540. [DOI] [PMC free article] [PubMed] [Google Scholar]
- 13. Motoshima T, Komohara Y, Ma C, et al. PD‐L1 expression in papillary renal cell carcinoma. BMC Urol. 2017;17:8. [DOI] [PMC free article] [PubMed] [Google Scholar]
- 14. Scheel AH, Baenfer G, Baretton G, et al. Interlaboratory concordance of PD‐L1 immunohistochemistry for non‐small‐cell lung cancer. Histopathology. 2018;72:449‐459. [DOI] [PubMed] [Google Scholar]
- 15. Brahmer J, Reckamp KL, Baas P, et al. Nivolumab versus docetaxel in advanced squamous‐cell non‐small‐cell lung cancer. N Engl J Med. 2015;373:123‐135. [DOI] [PMC free article] [PubMed] [Google Scholar]
- 16. Herbst RS, Baas P, Kim DW, et al. Pembrolizumab versus docetaxel for previously treated, PD‐L1‐positive, advanced non‐small‐cell lung cancer (KEYNOTE‐010): a randomised controlled trial. Lancet. 2016;387:1540‐1550. [DOI] [PubMed] [Google Scholar]
- 17. Rittmeyer A, Barlesi F, Waterkamp D, et al. Atezolizumab versus docetaxel in patients with previously treated non‐small‐cell lung cancer (OAK): a phase 3, open‐label, multicentre randomised controlled trial. Lancet. 2017;389:255‐265. [DOI] [PMC free article] [PubMed] [Google Scholar]
- 18. Wu T, Zhou F, Soodeen‐Lalloo AK, et al. The association between imaging features of TSCT and the expression of PD‐L1 in patients with surgical resection of lung adenocarcinoma. Clin Lung Cancer. 2019;20:e195‐e207. [DOI] [PubMed] [Google Scholar]
- 19. Capizzi E, Ricci C, Giunchi F, et al. Validation of the immunohistochemical expression of programmed death ligand 1 (PD‐L1) on cytological smears in advanced non small cell lung cancer. Lung Cancer. 2018;126:9‐14. [DOI] [PubMed] [Google Scholar]
- 20. Hui R, Garon EB, Goldman JW, et al. Pembrolizumab as first‐line therapy for patients with PD‐L1‐positive advanced non‐small cell lung cancer: a phase 1 trial. Ann Oncol. 2017;28:874‐881. [DOI] [PMC free article] [PubMed] [Google Scholar]
- 21. Takamori S, Takada K, Azuma K, et al. Prognostic impact of programmed death‐Ligand 2 expression in primary lung adenocarcinoma patients. Ann Surg Oncol. 2019;26:1916‐1924. [DOI] [PubMed] [Google Scholar]
- 22. Kumar S, Sharawat SK. Epigenetic regulators of programmed death‐ligand 1 expression in human cancers. Transl Res. 2018;202:129‐145. [DOI] [PubMed] [Google Scholar]
- 23. Kogure Y, Kataoka K. Genetic alterations in adult T‐cell leukemia/lymphoma. Cancer Sci. 2017;108:1719‐1725. [DOI] [PMC free article] [PubMed] [Google Scholar]
- 24. Tsukamoto M, Imai K, Ishimoto T, et al. PD‐L1 expression enhancement by infiltrating macrophage‐derived tumor necrosis factor‐α leads to poor pancreatic cancer prognosis. Cancer Sci. 2019;110:310‐320. [DOI] [PMC free article] [PubMed] [Google Scholar]
- 25. Nakagawa T, Ohnishi K, Kosaki Y, et al. Optimum immunohistochemical procedures for analysis of macrophages in human and mouse formalin fixed paraffin‐embedded tissue samples. J Clin Exp Hematop. 2017;57:31‐36. [DOI] [PMC free article] [PubMed] [Google Scholar]
- 26. Alban TJ, Alvarado AG, Sorensen MD, et al. Global immune fingerprinting in glioblastoma patient peripheral blood reveals immune‐suppression signatures associated with prognosis. JCI Insight. 2018;3:Pii: 122264. [DOI] [PMC free article] [PubMed] [Google Scholar]