

Abstract
Every year, approximately 1.2 million cases of colorectal carcinoma (CRC) are newly diagnosed worldwide. Although metastases to distant organs are often fatal complications of CRC, little information is known as to how such metastatic lesions are formed. To reveal the genetic profiles for CRC metastasis, we conducted whole‐exome RNA sequencing on CRC tumors with liver metastasis (LM) (group A, n = 12) and clinical stage‐matched larger tumors without LM (group B, n = 16). While the somatic mutation profiles were similar among the primary tumors and LM lesions in group A and the tumors in group B, the A‐to‐C nucleotide change in the context of “AAG” was only enriched in the LM regions in group A, suggesting the presence of a DNA damage process specific to metastasis. Genes already known to be associated with CRC were mutated in all groups at a similar frequency, but we detected somatic nonsynonymous mutations in a total of 707 genes in the LM regions, but not in the tumors without LM. Signaling pathways linked to such “LM‐associated” genes were overrepresented for extracellular matrix‐receptor interaction or focal adhesion. Further, fusions of the ADAP1 (ArfGAP with dual PH domain 1) were newly identified in our cohort (3 out of 28 patients), which activated ARF6, an ADAP1‐substrate. Infrequently, mutated genes may play an important role in metastasis formation of CRC. Additionally, recurrent ADAP1 fusion genes were unexpectedly discovered. As these fusions activate small GTPase, further experiments are warranted to examine their contribution to CRC carcinogenesis.
Keywords: ADAP1, colorectal carcinoma, exome sequencing, gene fusion, liver metastasis
Abbreviations
- CNVs
copy number variations
- CRC
colorectal cancer
- ECM
extracellular matrix
- KEGG
Kyoto Encyclopedia of Genes and Genomes
- LM
liver metastasis
- LRR
log R ratio
- NGS
next‐generation sequencers
- RNA‐seq
RNA sequencing
- RT‐PCR
reverse transcriptase‐polymerase chain reaction
- SNP
single nucleotide polymorphisms
- TCGA
The Cancer Genome Atlas
- WES
whole‐exome sequencing
1. INTRODUCTION
Colorectal carcinoma is the 3rd most common morbidity and the 4th leading cause of cancer death in the world.1 Clinical stages of CRC are defined by the depth of local invasion of tumors and by the presence or absence of metastases to lymph nodes and distant organs (TNM classification). While surgical resection at early stages may lead to complete eradication of tumors, CRC at advanced stages requires systemic chemotherapy and/or irradiation.2 In addition to cytotoxic reagents, some molecularly targeted drugs such as angiogenesis inhibitors (bevacizumab and ramucirumab), anti‐EGFR antibodies (cetuximab and panitumumab) and multi‐kinase inhibitors (regorafenib) are currently used for CRC treatments.3
Despite a vast amount of effort, the molecular mechanisms underlying CRC carcinogenesis, especially those of metastasis, remain to be fully elucidated. Large‐scale genomic analyses for CRC specimens have been conducted to identify somatic mutations that may drive CRCs. The Cancer Genome Atlas project on CRC, for instance, revealed frequent somatic mutations in APC, TP53, SMAD4, PIK3CA, and KRAS.4 Expression of NAV2−TCF7L2, VTI1A−TCF7L2, and RAD51C−ATXN7 fusion genes has also been reported in CRC.4, 5, 6 An integrated analysis on genomic and transcriptome datasets classified CRC into four consensus molecular subtypes, but clinical utilization of these studies awaits further investigation.7Conversely, many genes responsible for hereditary tumor syndromes involving CRC, such as APC for familial adenomatous polyposis and genes in the mismatch repair system (MLH1, MSH2, MSH6 and others) for hereditary nonpolyposis colorectal cancer, have been identified.8, 9, 10
While metastases to distant organs are frequently fatal, detailed comparisons of genome profiles between primary CRCs and metastasized regions have been limited. Exome sequencing and chromosome copy number analysis of pairs (n = 15) of CRC and LM specimens revealed that both lesions often share driver genes, such as APC, KRAS, ARID1A, and PIK3CA.11 A similar study with 34 such pairs also revealed that most of the frequently mutated genes are shared between the primary and metastatic specimens, indicating the same clonal origin of both lesions.12
Importantly, approximately half of the CRCs do not generate LM, and large CRC tumors without LM may be frequently observed in a clinical setting.13 To gain insights into the key genetic events driving LM, we collected small CRC tumors with LM (group A) and large tumors without LM (group B), all of which were subjected to WES and RNA‐seq with NGS. We also conducted this extensive sequencing analysis on the corresponding LM specimens and tried to identify each group‐specific mutation and/or gene fusion.
2. MATERIALS AND METHODS
2.1. Specimens and next‐generation sequencing
The CRC primary specimens and their LM counterparts were collected after written informed consent was obtained from the individuals who underwent surgical resection at Yamaguchi University Hospital. We obtained the intramucosal part of each resected tumor and used these for genomic and expression analysis. The specimens were kept frozen until NGS analysis. This project was approved by the Research Ethics Committees of the University of Tokyo and Institutional Review Board of Yamaguchi University, Japan.
2.2. WES analyses
Genomic DNA was isolated from each specimen and subjected to WES with the use of a SureSelect Human All Exon Kit (Agilent Technologies, Santa Clara, CA, USA) and HiSeq 2500 platform (Illumina, San Diego, CA, USA) with the paired‐end option.
From the read data, nucleotides with a quality value of <20 were masked, and such reads were then mapped to the reference human genome sequence (hg38) with the use of the BWA (http://bio-bwa.sourceforge.net/), Bowtie2 (http://bowtie-bio.sourceforge.net/bowtie2/index.shtml) and NovoAlign (http://www.novocraft.com/products/novoalign/) pipelines.
We further extracted unique reads and identified somatic mutations by the MuTect (http://www.broadinstitute.org/cancer/cga/mutect), SomaticIndelDetector (http://www. broadinstitute.org/cancer/cga/node/87) and VarScan (http://varscan.sourceforge.net) algorithms.
Somatic mutations were discarded if: (i) total read depth for a given mutation position was <20 or the mutation allele frequency in the tumor was <0.1; (ii) they were supported by only one strand of the genome; and (iii) they were already present in the “1000 genomes” database (http://www.1000genomes.org) or in our in‐house database of normal human genome variations, and were further annotated by the SnpEff pipeline (http://snpeff.sourceforge.net). Driver mutations were predicted using MutSig software (http://archive.broadinstitute.org/cancer/cga/mutsig).14 Pathway analysis was conducted using the DAVID pipeline (https://david.ncifcrf.gov/home.jsp).
2.3. Copy number variations
The WES data were used to infer somatic CNVs of the tumor specimens. Briefly, variant allele frequencies of SNPs reported in the 1000 genomes database were used to calculate the LRR between the tumors and the paired peripheral blood mononuclear cells, which were further normalized by the GC content and a moving window of 1 Mbp.
2.4. RNA‐seq
Complementary DNAs were prepared from the tumor tissues with the use of an NEB Next Ultra Directional RNA Library Prep Kit (New England Biolabs, Ipswich, MA, USA) and were subjected to NGS for 133 bp with the paired‐end option. Sequence reads were mapped to the reference genome using the TopHat algorithm (https://ccb.jhu.edu/software/tophat/index.shtml). The expression level of each transcript was measured as fragments per kilobase of exon per million mapped fragments (FPKM), calculated using Cufflinks (http://cole-trapnell-lab.github.io/cufflinks), or reads per kilobase of exon per million mapped reads (RPKM), determined by our in‐house algorithm. Gene fusions were detected by deFuse (https://bitbucket.org/dranew/defuse).15 To validate gene fusions, reverse transcriptase‐polymerase chain reaction (RT‐PCR) was conducted with primers flanking each fusion point, and the resultant PCR products were sequenced using an ABI Prism 3130xl Genetic Analyzer (Applied Biosystems, Foster City, CA, USA).
2.5. ADAP1 functional assays
The wild‐type ADAP1, ADAP1−GET4 and ADAP1−SUN1 cDNAs were isolated from the KATO‐III gastric cancer cell line (American Type Culture Collection: ATCC, Manassas, VA, USA), #A09 specimen and #B03 specimen, respectively. These cDNAs and SMAP1 cDNA were then ligated to the pCX4bleo expression vector (KAN Research Institute) and individually transfected into HEK293T cells (ATCC) together with an expression vector for ARF6 using Lipofectamine 2000 reagent (Thermo Fisher Scientific, Waltham, MA, USA).16 At 48 h after transfection, the cells were lysed and GTP‐loaded ARF6 was specifically pulled down with the Arf6 Pull‐down Activation Assay Biochem Kit (Cytoskeleton, Inc. Denver, CO, USA). The precipitates and the total cell lysates were immunoblotted with the monoclonal antibody to Arf6 (Cytoskeleton, Inc.).
2.6. Focus formation assay
3T3 cells were infected with the ecotropic recombinant retroviruses with the use of hg/mL polybrene (Sigma‐Aldrich, St. Louis, MO, USA) for 24 h, and further cultured in DMEM‐F12 supplemented with 5% calf serum (Invitrogen) for up to 2 wk. Cell transformation was assessed either by phase‐contrast microscopy or by staining with Giemsa solution.
2.7. Accession codes
Raw sequencing data were deposited in the Japanese Genotype‐Phenotype Archive (JGA, http://trace.ddbj.nig.ac.jp/jga), which is hosted by the DNA Databank of Japan (DDBJ), under the accession number JGAS00000000128.
3. RESULTS
3.1. WES analyses
To exclude the possibility of LM simply due to an advanced CRC stage, we divided the specimens into two groups: group A (n = 12) with small primary tumors (surface area: 2237 ± 971 mm2, mean ± SD) with LM; and group B (n = 16) with large tumors (4221 ± 1595 mm2) without LM (P = 4.09 × 10⁻³, t test) (Tables S1 and S2). Although the sizes of the primary tumors in groups A and B were significantly different, the pathological staging was not different between the two groups; primary tumors at T3 staging were 11 out of 12 in group A and 15 of 16 in group B (P = 1.000, Fisher's exact test).
All primary tumors, the paired non‐cancerous tissues and the paired LM lesions (only in group A) were subjected to WES analysis. The mean sequencing depth was ×196, ×96.1, ×196, ×172 and ×96.1 for primary tumors, non‐cancerous tissues, LM in group A, primary tumors and non‐cancerous tissues in group B, respectively. In total, 6855 somatic mutations were detected in the cancer specimens, 5258 (76.7%) of which were nonsynonymous. As shown in Figure 1A, the profile of somatic genomic alterations was similar between primary tumors and paired LM in group A, but the proportion of somatic insertions/deletions (InDels) was substantially higher in group B. As depicted in Figure S1, however, the somatic mutation profile in group B without the B6 tumor was similar to that of the other groups.
Figure 1.
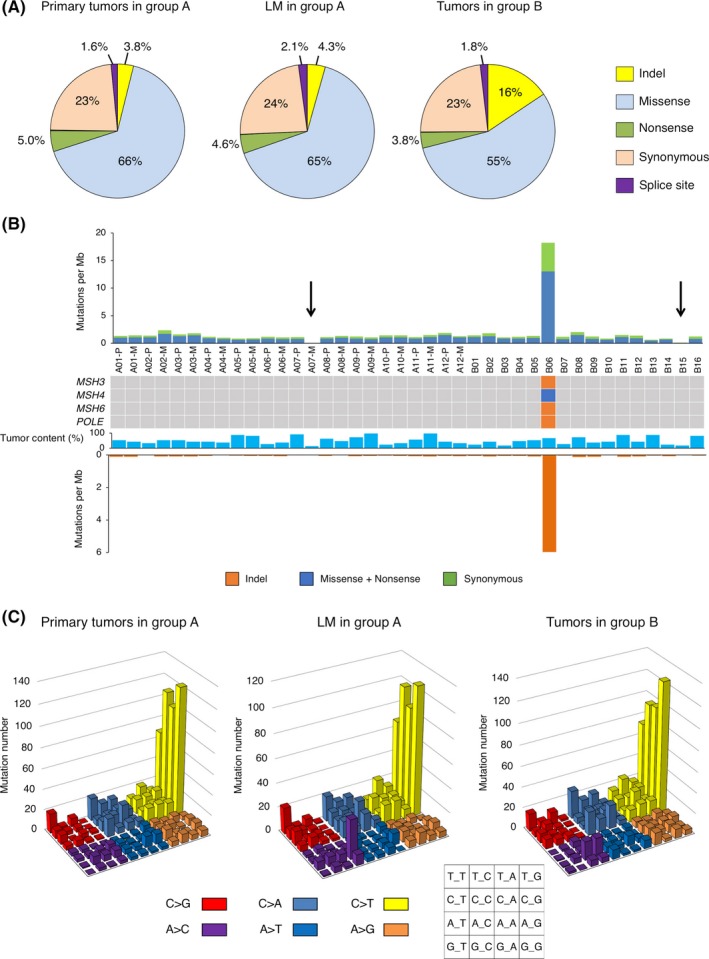
A, Pie charts showing the percentages of different somatic mutations in primary tumors and liver metastases (LM) in group A and tumors in group B. B, The frequency of synonymous or nonsynonymous substitutions and of InDels in each colorectal cancer (CRC) specimen is shown. Sample number, tumor content (%), and the presence of nonsynonymous mutations in MSH3,MSH4,MSH6 or POLE are indicated in the middle panel. Arrows denote the specimens with a low mutation burden (A07 and the B15). C, Number of base substitutions is shown for each triplet nucleotide, color‐coded as indicated at the bottom
As shown in Figure 1B, the B6 tumor is a hypermutator, with frequent InDels (5.96 per megabase), as well as frequent single nucleotide variations (SNVs) (18.22 per megabase). The nonsynonymous mutations in all of the mismatch repair genes MSH3, MSH4, and MSH6 and a frameshift mutation in POLE, which encodes the catalytic subunit of DNA polymerase ε, could account for this exceptional accumulation of mutations only in B06. In contrast, the metastatic region of A07 and the B15 tumor had a very low mutation burden, probably because of the low tumor contents of the specimens (12.5% and 17.5%, respectively). Aside from these three specimens, the other tumors had a similar mutation burden (on average, 1.31 SNVs and 0.061 InDels per megabase).
Figure 1C shows the nucleotide substitution profiles for every group of tumors. The C‐to‐T transition is the most predominant feature in every group, especially in the context of “NCG,” which may be related to the age of the patients at cancer diagnosis, as previously reported.12 Although the substitution profiles are similar among the three groups, the A‐to‐C change in the context of “AAG” increased only in the LM tumors.
3.2. Significantly mutated genes
Driver genes for carcinogenesis were predicted with the MutSig analysis of all tumors, leading to the identification of seven candidates with a Q‐value of <.05, all of which are already known to be associated with CRC (Figures 2A and S2). As reported previously, APC, TP53, and KRAS are frequently mutated, often at multiple positions in the case of the former two.4, 12, 14 PTEN mutations were shown to be more prevalent than was previously described.17 The frequencies of the gene mutations in Figure 2A were not significantly different between groups A and B (P > .27, Fisher's exact test).
Figure 2.
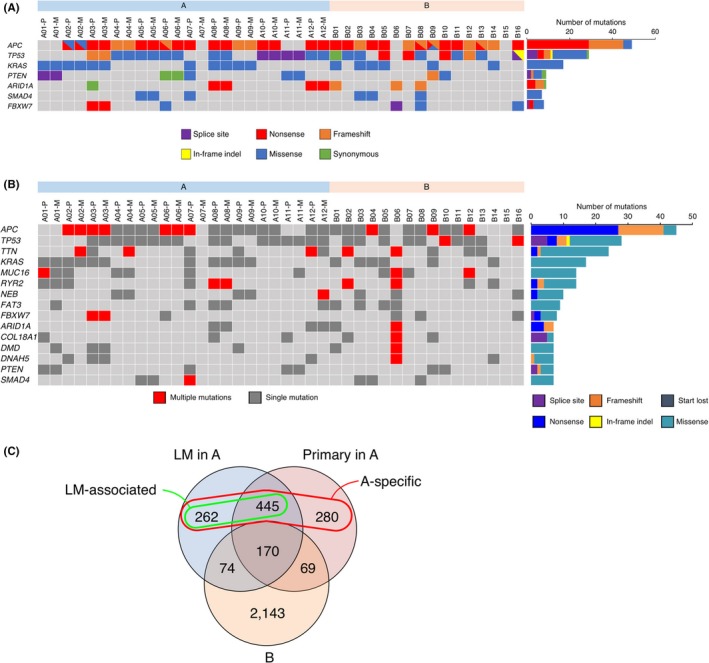
A, Presence of various somatic mutations is shown in each specimen for seven genes with a Q‐value of <.05 by MutSig analysis. Total number of somatic mutations for each gene is also indicated in the right histogram. B, The presence of single or multiple somatic mutations is indicated in each specimen for 15 frequently mutated genes. The total number of different types of somatic mutations for each gene is shown in the right histogram. C, Venn diagram of genes with somatic nonsynonymous mutations among the primary tumors and liver metastases (LM) in group A and the tumors in group B. Group A‐specific or LM‐associated genes are also indicated by a circle
Genes with frequent somatic, nonsynonymous mutations present in both (≥7 mutations) or each (≥5 specimens) group are listed in Figures 2B and S3, respectively. Known CRC‐related genes are included in the list, such as ARID1A and FBXW7(Figure 2B). They also included TTN, RYR2, DNAH5, NEB, which encode large (>4000 amino acids) proteins whose roles in the pathogenesis of cancer are controversial, and they are possibly “passenger genes,” although several papers in the literature have reported them as frequently mutated genes. Conversely, ADAMTS10,FAT3,FSIP2,NELL1,
RXFP3 were only included in group A (Figure S3). Among these genes, nonsynonymous mutations in ADAMTS10,NELL1,and RXFP3 were only detected in group A, but none in group B, suggesting their roles in LM.
We next attempted to extract somatic nonsynonymous mutations that were specifically found in three subgroups (primary tumors and LM in group A, and the tumors in group B). As shown in Figure 2C, 170 genes were commonly mutated in three groups. In contrast, 707 genes were mutated in the LM regions of group A but not in B (LM‐associated genes, green circle in Figure 2C). Interestingly, the pathways defined by the KEGG database (KEGG, http://www.genome.jp/kegg/) related to these genes were significantly enriched for the “Extracellular matrix (ECM)‐receptor interaction” and “Focal adhesion” pathways (Table 1), suggesting that alterations in these interactions may facilitate metastasis. Furthermore, 987 genes were mutated specifically in the tumors in group A (A‐specific genes, red circle in Figure 2C). The pathways for “ECM‐receptor interaction” and “Focal adhesion” were again enriched for these genes (Table 1). We also attempted to detect each group‐specific, somatic nonsynonymous nucleotide change (Figure S4). The shared mutations among all groups were only for KRAS and APC.
Table 1.
Over‐represented pathways in the KEGG pathway database
| LM‐associated | |
|---|---|
| KEGG pathway | P‐valuea |
| hsa04723:Retrograde endocannabinoid signaling | 6.16 × 10⁻⁴ |
| hsa04024:cAMP signaling pathway | 1.15 × 10⁻³ |
| hsa04512:ECM‐receptor interaction | 2.74 × 10⁻³ |
| hsa04510:Focal adhesion | 4.47 × 10⁻³ |
| hsa04924:Renin secretion | 5.87 × 10⁻³ |
| A‐specific | |
|---|---|
| KEGG pathway | P‐value |
| hsa04024:cAMP signaling pathway | 2.46 × 10⁻⁴ |
| hsa04512:ECM‐receptor interaction | 2.79 × 10⁻⁴ |
| hsa04510:Focal adhesion | 4.31 × 10⁻⁴ |
| hsa04924:Renin secretion | 9.80 × 10⁻⁴ |
| hsa04723:Retrograde endocannabinoid signaling | 1.20 × 10⁻⁴ |
Fisher's exact test.
3.3. CNVs
High coverage of the WES analysis allowed us to infer allele‐specific chromosome copy number. Figure 3 depicts the overall copy number gain in chromosomes 7, 8q, 13 and 20, and the copy number loss in chromosomes 8p, 15, 17p, and 18 in CRC, all in line with previous reports.4, 18 In general, primary and paired LM tumors share CNVs, suggesting that such alterations often become established in the early stages of carcinogenesis.
Figure 3.
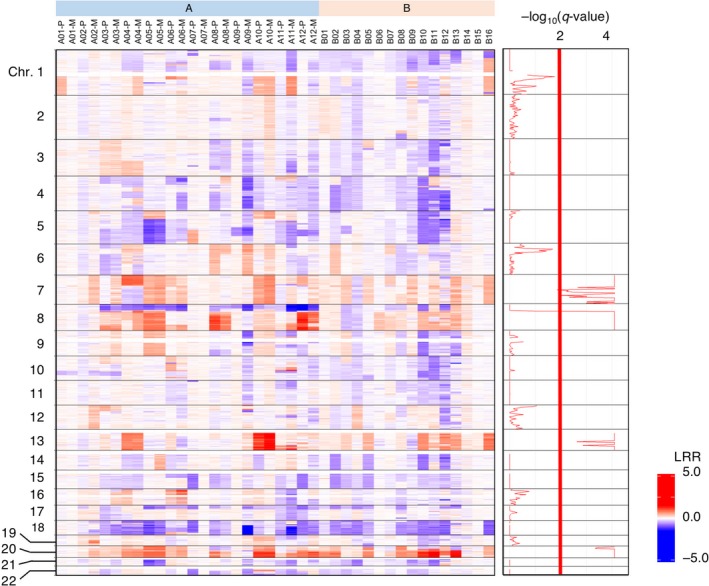
Chromosome copy number analysis of the colorectal cancer (CRC) specimens. Copy number status is color‐coded for chromosomes (Chr.) 1 to 22 (top to bottom) for the samples, as designated at the top. LRR, log R ratio. The false discovery rate (q) for every segment of chromosome is calculated and shown as −log10(q‐value) at the right
A detailed examination of CNVs, however, revealed many differences between primary and LM tumors in group A. The primary tumor of patient #A10, for instance, carries a focal amplification of chromosome 7p, including the EGFR locus (calculated copy number = 78.2), but the tumor cells in the LM region did not harbor this gene amplification, albeit the other CNV appears to be similar (Figure S5). These results suggested that LM is not a one‐way process, accumulating genetic aberrations sequentially, but rather a more dynamic process in which previously acquired aberrations would be lost or some minor clones without signature aberrations would become the majority to fit a new environment.
3.4. Fusion genes
By using the deFuse pipeline, we searched for fusion genes in our RNA‐seq dataset, and identified a total of nine gene fusions, including recurrent ones involving the ADAP1 gene, all of which were confirmed by RT‐PCR and nucleotide sequencing (Figure 4A and Table S3).15 An out‐of‐frame fusion of ADAP1 to GET4 or SUN1 was found in the LM region of the #A9 or #B3 tumors, respectively. In both cases, the ArfGAP domain of ADAP1 becomes fused to short amino acid sequences encoded by the genome sequences of the partners.
Figure 4.
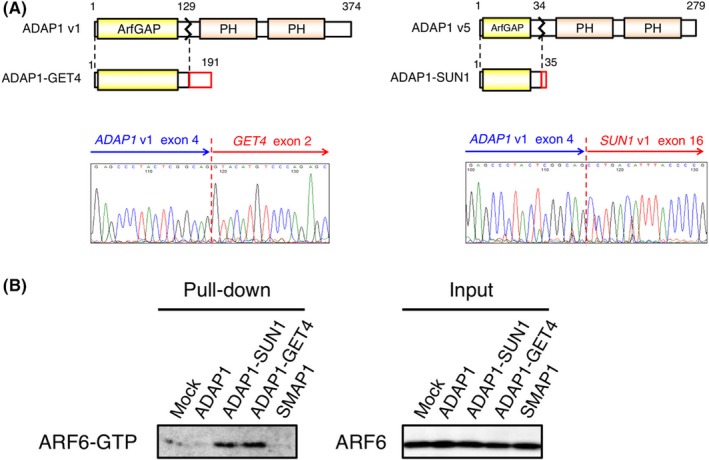
A, The domain structure of ADAP1 variant (v) 1 and 5 is schematically shown. In the fusion, a short amino acid stretch encoded by GET4 or SUN1 is ligated to the ArfGAP domain of ADAP1. The electrophoretogram for the fusion point of ADAP1−GET4 or ADAP1−SUN cDNA is shown at the bottom panel. B, HEK293T cells were transfected with the expression plasmid for wild‐type ADAP1,ADAP1−SUN1,ADAP1−GET4 or SMAP1; then green fluorescent protein (GTP)‐loaded ARF6 was pulled down from cell lysate and probed with the antibody to ARF6 (left panel). Mock‐transfected cells were similarly analyzed. Total cell lysates of the same set of cells were immunoblotted with the same antibody (right panel)
As ADAP1 fusions have not been described in any cancers, we further searched for fusion transcripts involving ADAP1 using our in‐house pipeline among the same RNA‐seq data. An additional three fusions of ADAP1 were detected (Figure S6 and Table S4). Notably, two of these were in‐frame fusions. Through this fusion event, the ArfGAP domain of ADAP1 was ligated to nearly the entire protein of GEMIN4 in LM of patient #A9 and to the carboxyl‐terminal three‐quarters of the TMEM8A protein in the #B3 tumor. In the LM region of patient #A4, ADAP1 is fused to NOC4L in an out‐of‐frame manner, resulting in the ligation of the ArfGAP domain to a short amino acid stretch encoded by the NOC4L locus. The frequency of ADAP1 fusions was not significantly different between the two groups.
In all of the in‐frame or out‐of‐frame fusions, only the ArfGAP domain of ADAP1 was ligated to the partner genes. Given that none of the other domains of ADAP1 are retained in the fusion products, the ADAP1 fusions may suppress wild ADAP1 in a dominant‐negative manner. By using human ARF6 (ADP‐ribosylation factor 6) protein as a substrate of ADAP1, we therefore examined whether the wild‐type and the fusion forms of ADAP1 differentially regulated GTP/GDP loading on ARF6. As shown in Figure 4B, the presence of wild‐type ADAP1 or SMAP1 (another ArfGAP protein of ARF6) decreased GTP‐loading of ARF6 compared with the mock‐infected cells. However, the fusions markedly enhanced GTP‐loading, indicating that ADAP1 fusions indeed inactivated their substrate small GTPases.
3.5. Focus formation assay
We did not observe the direct transforming ability of ADAP1−SUN1 or ADAP1−GET4 fusion protein in the focus formation assay with mouse 3T3 fibroblasts (data not shown).
4. DISCUSSION
In this study, we compared the genomic profiles of small CRCs with LM and relatively large CRCs without LM. Excluding the specimen of hypermutator (#B6) and low tumor contents (#A7‐M and B15), the number of somatic mutations was not significantly different among the primary tumors and LM in group A and the tumors in group B. Similarly, the proportion of missense or InDel alterations was similar among the subgroups. Interestingly, however, an A‐to‐C conversion in the context of “AAG” was enriched only in the LM group, suggesting the presence of a carcinogen that leads to liver metastasis.
As shown in Table 1, nonsynonymous mutations of the group A genome are enriched among the genes with “ECM‐receptor interaction” or “Focal adhesion” pathways. PTEN (Phosphatase and Tensin Homolog deleted from Chromosome 10) mutations are shown in Figure 2. PTEN is an enzyme that functions to dephosphorylate phosphatidylinositol (PI) (3,4,5)P 3 and convert it to PI (4,5)P 2. PTEN knockdown promoted the migration and invasion of cells by activation of the PI3K−AKT pathway.19 ADAMTS10,NELL1.RXFP3 were recurrently muted only in group A.(Figure S3). The ADAMTS family proteins are zinc‐dependent metalloproteases that are presumed to be involved in infiltration and metastasis of cancer cells by degrading extracellular matrix proteins.20 While mutations of ADAMTS family genes have been reported in several cancers, ADAMTS10 has not been reported as a recurrently mutated gene.21, 22 As we found ADAMTS10 (ADAM metallopeptidase with thrombospondin type 1 motif 10 gene) to be frequently mutated in metastatic CRC, and as mutated ADAMTS10 transcripts are actively expressed in the corresponding tumors (data not shown), further studies are warranted to clarify the role of ADAMTS10 in cancer metastasis. NELL1 (neural EGFR like 1) protein is an EGF‐like repeat protein that is presumed to be involved in cell proliferation and differentiation. It has been reported that NELL1 suppresses cell migration in renal cell carcinoma.23 Relaxins, receptor RXFP3 (Relaxin family peptide receptor 3), are known for their tissue remodeling capacity, which is also a hallmark of cancer progression. It is suggested that relaxin induces aggressive cell growth and invasiveness in several types of cancer, including endometrial cancer. Adherens junctions in cancer cells are weakened by the breakdown of the cadherin/catenin complex, which is induced by β‐catenin phosphorylation via RLN2/RXFP1 signaling.24 RXFP3 has not been reported and further studies are warranted to clarify the role of RXFP3 in cancer metastasis.
ADAP1 (ArfGAP with dual PH domains 1), also known as centaurin‐α1, is composed of one GTPase‐activating protein (GAP) domain for Arf and two PH domains in the protein structure. The ArfGAP domain likely functions in converting the GTP‐bound active form of ADP‐ribosylation factor (ARF) to the GDP‐bound inactive form. ADAP1 therefore inactivates ARF6, which has been reported to be involved in metastasis and invasion.25 The relationship of ADAP1 to carcinogenesis has been rarely examined, however. Hayashi et al showed that ADAP1 activates ERK1/2 in a phosphatidylinositol 3‐kinase‐dependent manner.26 ADAP1 has also been shown by ChIP sequencing to be the target of ERBB4, a receptor tyrosine kinase that is a member of the EGFR superfamily and overexpressed in colon cancers,; ERBB4 is also presumed to induce the expression of ADAP1 message.27 Here, we reveal for the 1st time that ADAP1 frequently becomes fused to partner genes in CRC.
To date, there have been no reports of gene fusions involving ADAP1. Among the ADAP1 fusions detected in this study, only GEMIN4 and TMEM8A are the in‐frame fusion partners. GEMIN4 is a member of the survival motor neuron complex, which plays an essential role in maturation of small nuclear ribonucleoproteins, but it does not have any known domains in the protein structure.28 TMEM8A stabilizes RAC1 at the plasma membrane, and thereby regulates RAC1 activity.29 As multiple transmembrane domains are located in the carboxyl terminus, the presumed ADAP1−TMEM8A fusion protein retains the transmembrane region (Figure S6B). Thus, the ADAP1−TMEM8A protein may be forced to be constitutively tethered to the plasma membrane, in contrast to the phosphatidylinositol‐dependent membrane localization of wild‐type ADAP1 through its PH domains. However, the other out‐of‐frame ADAP1 fusion genes are likely to encode only its entire ArfGAP domain.
The only shared domain among the ADAP1 fusions is, therefore, the ArfGAP domain. As demonstrated in Figure 4B, the ADAP1 fusions increased the GTP‐loading of ARF6 compared with the wild‐type ADAP1. It is therefore likely that ADAP1 fusions act on the wild ADAP1 in a dominant‐negative manner and therefore suppress the intrinsic GTPase‐activating potential of the latter, resulting in the activation of ADAP1 substrates, including ARF6. Although the negative results of focus formation assay of ADAP1 fusion genes may implicate that they have no role in the pathogenesis of CRC and are merely “passenger” alterations, another possibility is that tumor‐promoting features of ADAP1 fusion genes are cell‐context dependent and 3T3 fibroblast was not a suitable cell type to be assayed. Therefore, further investigation as to whether ADAP1 fusion genes contribute to the pathogenesis of CRC is warranted, by using other cells such as primary epithelial intestinal or colonic cells, especially under 3D organoid culture conditions.30, 31, 32
DISCLOSURE
Shoichi Hazama has conflicts of interest to disclose. This work was supported by two companies, toyokohan corporation and NEC corporation.
Supporting information
ACKNOWLEDGMENTS
This study was supported in part by grants for Leading Advanced Projects for Medical Innovation (LEAP) (JP17am0001001 to H.M.) and for the Project for Cancer Research and Therapeutic Evolution (P‐CREATE) (JP16 cm0106502 to M.K.) from the Japan Agency for Medical Research and Development.
Oga T, Yamashita Y, Soda M, et al. Genomic profiles of colorectal carcinoma with liver metastases and newly identified fusion genes. Cancer Sci. 2019;110:2973–2981. 10.1111/cas.14127
REFERENCES
- 1. Arnold M, Sierra MS, Laversanne M, Soerjomataram I, Jemal A, Bray F. Global patterns and trends in colorectal cancer incidence and mortality. Gut. 2017;66:683‐691. [DOI] [PubMed] [Google Scholar]
- 2. Simmonds PC. Palliative chemotherapy for advanced colorectal cancer: systematic review and meta‐analysis. Colorectal Cancer Collaborative Group. BMJ. 2000;321:531‐535. [DOI] [PMC free article] [PubMed] [Google Scholar]
- 3. McLean J, Rho YS, Kuruba G, et al. Clinical practice patterns in chemotherapeutic treatment regimens for metastatic colorectal cancer. Clin Colorectal Cancer. 2016;15:135‐140. [DOI] [PubMed] [Google Scholar]
- 4. Network CGA. Comprehensive molecular characterization of human colon and rectal cancer. Nature. 2012;487:330‐337. [DOI] [PMC free article] [PubMed] [Google Scholar]
- 5. Bass AJ, Lawrence MS, Brace LE, et al. Genomic sequencing of colorectal adenocarcinomas identifies a recurrent VTI1A‐TCF7L2 fusion. Nat Genet. 2011;43:964‐968. [DOI] [PMC free article] [PubMed] [Google Scholar]
- 6. Kalvala A, Gao L, Aguila B, et al. Rad51C‐ATXN7 fusion gene expression in colorectal tumors. Mol Cancer. 2016;15:47. [DOI] [PMC free article] [PubMed] [Google Scholar]
- 7. Guinney J, Dienstmann R, Wang X, et al. The consensus molecular subtypes of colorectal cancer. Nat Med. 2015;21:1350‐1356. [DOI] [PMC free article] [PubMed] [Google Scholar]
- 8. Miyoshi Y, Nagase H, Ando H, et al. Somatic mutations of the APC gene in colorectal tumors: mutation cluster region in the APC gene. Hum Mol Genet. 1992;1:229‐233. [DOI] [PubMed] [Google Scholar]
- 9. Fishel R, Kolodner RD. Identification of mismatch repair genes and their role in the development of cancer. Curr Opin Genet Dev. 1995;5:382‐395. [DOI] [PubMed] [Google Scholar]
- 10. Vasen HF, Boland CR. Progress in genetic testing, classification, and identification of Lynch syndrome. JAMA. 2005;293:2028‐2030. [DOI] [PubMed] [Google Scholar]
- 11. Lee SY, Haq F, Kim D, et al. Comparative genomic analysis of primary and synchronous metastatic colorectal cancers. PLoS ONE. 2014;9:e90459. [DOI] [PMC free article] [PubMed] [Google Scholar]
- 12. Lim B, Mun J, Kim JH, et al. Genome‐wide mutation profiles of colorectal tumors and associated liver metastases at the exome and transcriptome levels. Oncotarget. 2015;6:22179‐22190. [DOI] [PMC free article] [PubMed] [Google Scholar]
- 13. Van Cutsem E, Oliveira J, Group EGW . Advanced colorectal cancer: ESMO clinical recommendations for diagnosis, treatment and follow‐up. Ann Oncol 2009;20(Suppl 4):61‐63. [DOI] [PubMed] [Google Scholar]
- 14. Lawrence MS, Stojanov P, Polak P, et al. Mutational heterogeneity in cancer and the search for new cancer‐associated genes. Nature. 2013;499(7457):214‐218. [DOI] [PMC free article] [PubMed] [Google Scholar]
- 15. McPherson A, Hormozdiari F, Zayed A, et al. deFuse: an algorithm for gene fusion discovery in tumor RNA‐Seq data. PLoS Comput Biol. 2011;7:e1001138. [DOI] [PMC free article] [PubMed] [Google Scholar]
- 16. Akagi T, Sasai K, Hanafusa H. Refractory nature of normal human diploid fibroblasts with respect to oncogene‐mediated transformation. Proc Natl Acad Sci USA. 2003;100(23):13567‐13572. [DOI] [PMC free article] [PubMed] [Google Scholar]
- 17. Nassif NT, Lobo GP, Wu X, et al. PTEN mutations are common in sporadic microsatellite stable colorectal cancer. Oncogene. 2004;23:617‐628. [DOI] [PubMed] [Google Scholar]
- 18. Xie T, D′ Ario G, Lamb JR, et al. A comprehensive characterization of genome‐wide copy number aberrations in colorectal cancer reveals novel oncogenes and patterns of alterations. PLoS ONE. 2012;7:e42001. [DOI] [PMC free article] [PubMed] [Google Scholar]
- 19. Planchon SM, Waite KA, Eng C. The nuclear affairs of PTEN.Journal of cell . Science. 2008;121(Pt 3):249‐253. [DOI] [PubMed] [Google Scholar]
- 20. Egeblad M, Werb Z. New functions for the matrix metalloproteinases in cancer progression. Nat Rev Cancer. 2002;2:161‐174. [DOI] [PubMed] [Google Scholar]
- 21. Viloria CG, Obaya AJ, Moncada‐Pazos A, et al. Genetic inactivation of ADAMTS15 metalloprotease in human colorectal cancer. Cancer Res. 2009;69:4926‐4934. [DOI] [PubMed] [Google Scholar]
- 22. Wei X, Prickett TD, Viloria CG, et al. Mutational and functional analysis reveals ADAMTS18 metalloproteinase as a novel driver in melanoma. Mol Cancer Res. 2010;8:1513‐1525. [DOI] [PMC free article] [PubMed] [Google Scholar]
- 23. Nakamura R, Oyama T, Tajiri R, et al. Expression and regulatory effects on cancer cell behavior of NELL1 and NELL2 in human renal cell carcinoma. Cancer Sci. 2015;106(5):656‐664. [DOI] [PMC free article] [PubMed] [Google Scholar]
- 24. Fue M, Miki Y, Takagi K, et al. Relaxin 2/RXFP1 Signaling Induces Cell Invasion via the β‐Catenin pathway in Endometrial Cancer. Int J Mol Sci. 2018;19(8):2438.25. [DOI] [PMC free article] [PubMed] [Google Scholar]
- 25. Venkateswarlu K, Brandom KG, Lawrence JL. Centaurin‐alpha1 is an in vivo phosphatidylinositol 3,4,5‐trisphosphate‐dependent GTPase‐activating protein for ARF6 that is involved in actin cytoskeleton organization. J Biol Chem. 2004;279:6205‐6208. [DOI] [PubMed] [Google Scholar]
- 26. Hayashi H, Matsuzaki O, Muramatsu S, et al. Centaurin‐alpha1 is a phosphatidylinositol 3‐kinase‐dependent activator of ERK1/2 mitogen‐activated protein kinases. J Biol Chem. 2006;281:1332‐1337. [DOI] [PubMed] [Google Scholar]
- 27. Wali VB, Haskins JW, Gilmore‐Hebert M, Platt JT, Liu Z, Stern DF. Convergent and divergent cellular responses by ErbB4 isoforms in mammary epithelial cells. Mol Cancer Res. 2014;12:1140‐1155. [DOI] [PMC free article] [PubMed] [Google Scholar]
- 28. Meier ID, Walker MP, Matera AG. Gemin4 is an essential gene in mice, and its overexpression in human cells causes relocalization of the SMN complex to the nucleoplasm. Biol Open. 2018;7(2). 10.1242/bio.032409 [DOI] [PMC free article] [PubMed] [Google Scholar]
- 29. Castro‐Castro A, Muriel O, Del Pozo MA, Bustelo XR. Characterization of novel molecular mechanisms favoring Rac1 membrane translocation. PLoS ONE. 2016;11(11):e0166715. [DOI] [PMC free article] [PubMed] [Google Scholar]
- 30. Onuma K, Ochiai M, Orihashi K, et al. Genetic reconstitution of tumorigenesis in primary intestinal cells. Proc Natl Acad Sci USA. 2013;110(27):11127‐11132. [DOI] [PMC free article] [PubMed] [Google Scholar]
- 31. Ochiai M, Yoshihara Y, Maru Y, et al. Kras‐driven heterotopic tumor development from hepatobiliary organoids [published online ahead of print February 7, 2019]. Carcinogenesis 10.1093/carcin/bgz024 [DOI] [PubMed]
- 32. Maru Y, Onuma K, Ochiai M, Imai T, Hippo Y. Shortcuts to intestinal carcinogenesis by genetic engineering in organoids [published online ahead of print January 13, 2019]. Cancer Sci 10.1111/cas.13938 [DOI] [PMC free article] [PubMed]
Associated Data
This section collects any data citations, data availability statements, or supplementary materials included in this article.
Supplementary Materials