

Abstract
Oral cancer, a subtype of head and neck cancer, is characterized by increased infiltrating regulatory T cells (Treg); however, the pathological significance of the increase in Tregs in disease prognosis and progression and their underlying mechanism remain unestablished. C‐C motif chemokine ligand 22 (CCL22) has been implicated in the recruitment of Tregs. We used RT‐qPCR to determine CCL22 mRNA expression in clinical specimens and cultured cells. Loss‐of‐function and gain‐of‐function studies were carried out to analyze the effects of CCL22 modulations on cell proliferation, migration, invasion, and tumorigenesis and the mechanism involved in the deregulation of CCL22. In oral cancer specimens, CCL22 mRNA was upregulated. The increase was not only associated with reduced disease‐free survival but also strongly correlated with an increase in FOXP3 mRNA, a master regulator of Treg development and functions. Silencing CCL22 expression reduced cell proliferation, migration, and invasion, whereas ectopic overexpression showed opposite effects. Manipulation of CCL22 expression in cancer cells altered tumorigenesis in both immune‐compromised and ‐competent mice, supporting both autonomous and non‐autonomous actions of CCL22. Release of interleukin 1β (IL‐1β) from cancer‐associated fibroblasts (CAF) induces CCL22 mRNA expression in oral cancer cells by activating transcription factor nuclear factor kappa B (NF‐κB). Our data support a model in which CAF‐derived IL‐1β, CCL22, and its receptor CCR4 foster a protumor environment by promoting cell transformation and Treg infiltration. Intervention of the IL‐1β‐CCL22‐CCR4 signaling axis may offer a novel therapeutic strategy for oral cancer treatment.
Keywords: cancer‐associated fibroblast, CCL22, chemokine, IL‐1β, oral cancer
1. INTRODUCTION
Head and neck cancer accounts for approximately 4% of all malignancies worldwide and 5% mortality of all cancers.1 Notably, the incidence of oral cancer ranks among the top three cancer types in several Asia‐Pacific countries.2 More than 90% of head and neck cancer are squamous cell carcinomas, arising from the epithelial cells that line the mucosal surfaces of the head and neck regions, including the oral cavity.3 The main etiological factors include tobacco and alcohol abuse, betel quid chewing or human papillomavirus infection.4 Early diagnosis of head and neck cancer is relatively feasible, but presentation with advanced disease is not uncommon.5 The fact that few therapeutic options other than surgery, standard cytotoxic chemotherapy, and radiation are available significantly impede improvement of the 5‐year survival rate.6
Tumor stromal cells including cells of the immune system modulate cancer development and progression.7 Regulatory T (Treg) cells that express the transcription factor FOXP38 are often found at elevated levels in tumor lesions and are essential for the prevention of autoimmunity and the maintenance of immune homeostasis.9 Moreover, the density of tumor‐infiltrating Treg cells has prognostic value10, 11 and can be negatively or positively correlated with the outcome of several malignancies, depending on the cancer type.12
An increase in Treg has been reported not only in peripheral blood and draining lymph nodes but also in the primary tumor microenvironment.13 The phenotype and functions of Treg are modulated by the local milieu of cytokines, metabolites, and catabolites in their surrounding environment.14, 15 Among the 10 cancer types with the highest overall immune infiltration scores, head and neck cancer shows the highest score of Treg infiltration, therefore providing a strong rationale for the treatment of these tumors with immunotherapy modalities by targeting Tregs.16 Although Treg infiltration and accumulation correlate with cancer patient prognosis, it is not entirely understood how Tregs are recruited to tumor lesions and the microenvironment in head and neck cancer.
Chemokine‐mediated chemotaxis in the tumor milieu is one possible mechanism responsible for Treg trafficking.13 The C‐C chemokine receptor type 4 (CCR4) is expressed preferentially in human Tregs17 and neutralization of CCR4 selectively depletes Tregs and evokes antitumor immune responses.18 These observations suggest a potential strategy for treating cancer patients by targeting CCR4‐expressing Tregs in antitumor immunity. Thus, a better understanding of the conditions that favor Treg induction, recruitment, and function is essential for the development of new therapeutic interventions against head and neck cancer.
Although Treg activity is elevated in head and neck cancer, the prognostic value of Tregs in head and neck squamous cell carcinoma (HNSCC) remains controversial.19 HNSCC is a malignant tumor characterized by a substantially suppressed immune system. Tumor stroma is intimately involved in cancer initiation, progression, and metastasis. Several lines of evidence suggest the importance of stromal cells in the induction and recruitment of Tregs at tumor sites, possibly through cell contact‐dependent mechanisms and secretion of soluble mediators.20 In addition to stromal cells, tumor cells may participate in Treg recruitment to escape immune surveillance.21 For example, the tumor‐derived chemokine CCL22, also known as macrophage‐derived chemokine, stimulates the migration of Tregs through CCR4 and impairs antitumor immunity in ovarian cancer.22 The CCL22‐CCR4 signaling axis was later shown to promote lymph node metastasis among head and neck cancer patients.23 With the potential involvement of CCL22 both in the immune and tumor cells, we investigated the role of CCL22‐mediated signaling with emphasis on the crosstalk between cancer and stromal cells in oral carcinogenesis.
2. MATERIALS AND METHODS
2.1. Materials
Culture media, FBS, Lipofectamine 2000, TRIzol, and RT‐qPCR reagents were from Thermo Fisher Scientific. Oligonucleotide primers for sequencing and RT‐qPCR (Table S1) were from IDT. pLKO_AS2.zeo and plasmids bearing shRNAs (Table S2) were from National RNAi Core facility in Academia Sinica, Taiwan. Recombinant human IL‐1β was from PeproTech. Pyrrolidine dithiocarbamate (PDTC) was from Tocris Bioscience. Sources of antibodies are listed in Table S3.
2.2. Oral cancer patient samples
A total of 93 patients with pathological confirmation treated at National Cheng Kung University (NCKU) Hospital between 2004 and 2016 were retrospectively assessed. All patients underwent surgical resection and no patients received preoperative therapy. Written informed consent was obtained from all patients and the protocol was approved by the review board of the hospital. Clinicopathological characteristics of patients are summarized in Table 1.
Table 1.
Clinicopathological characteristics of 93 oral cancer patients recruited with informed consent from National Cheng Kung University Hospital
| No. of cases | % of total | |
|---|---|---|
| Agea (y) | ||
| <52 | 45 | 48.4 |
| ≥52 | 48 | 51.6 |
| Gender | ||
| Male | 84 | 90.3 |
| Female | 9 | 9.7 |
| Tumor site | ||
| Buccal + tongue | 75 | 80.6 |
| Other | 18 | 19.4 |
| Stage | ||
| I | 13 | 14.0 |
| II | 24 | 25.8 |
| III | 16 | 17.2 |
| IV | 40 | 43.0 |
| Stage | ||
| Early (I + II) | 37 | 39.8 |
| Late (III + IV) | 56 | 60.2 |
| Lymph node | ||
| Negative | 49 | 52.7 |
| Positive | 44 | 47.3 |
| Differentiation | ||
| Well | 51 | 54.8 |
| Moderate + poor | 42 | 45.2 |
| Recurrence | ||
| No | 68 | 73.1 |
| Yes | 25 | 26.9 |
Median age of patients was 52 years.
2.3. Mice
Male C57BL/6, NOD‐SCID, C3H/HeN or BALB/c athymic mice at 6‐8 weeks old were purchased from the National Laboratory Animal Center, housed with a 12‐hour light/dark cycle and fed sterilized diet and water ad libitum. Use of these animals and experimental protocols were reviewed and approved by the Institutional Animal Care and Use Committee (IACUC) at NCKU. All animal experiments complied with the ARRIVE guides and were carried out in accordance with the National Institutes of Health guide for care and use of laboratory animals (NIH publication No. 8023, revised 1978).
2.4. Animal cancer models
Vector or CCL22‐OE (2 × 10⁶ cells) Ca9‐22 cells together with 50 μL Matrigel were s.c. injected into male NOD/SCID mouse flanks (N = 5 per group). AT‐84 murine oral cancer cells bearing shLuc (control) or shCcl22 (106 cells) with 50 μL Matrigel were s.c. injected into male C3H/HeN and athymic mice for syngeneic or xenograft tumorigenesis, respectively. One week after injection, tumor size was measured every 2 days. Tumor tissues were harvested at the endpoint for weight measurement, histology, and RNA isolation.
2.5. Luciferase reporter assay
We cloned the proximal promoter spanning −1191 ~ +34 (transcription start site as +1) of the CCL22 gene into the pGL3 basic vector. Synthetic 2X‐NF‐κB‐Luc, a generous gift from Dr Michael Karin, was used to assay NF‐κB promoter activity. After seeding in 24‐well plates for 16‐18 hours, cells were seeded in triplicate and transiently transfected with the indicated plasmids for 6 hours by using Lipofectamine 2000. Forty‐eight hours after transfection, luciferase activity in lysates was measured by using Dual‐Luciferase reporter assay (Promega) and expressed as relative luciferase units (RLU). Renilla luciferase activity was used as an internal control for transfection efficiency. Normalized promoter activity is presented as the ratio of reporter activity over RLU with promoterless pGL3‐basic vector RLU. For IL‐1β treatment, Ca9‐22 cells transfected with CCL22 promoter reporter were treated with vehicle or IL‐1β at 50‐100 ng/mL for 24 hours followed by luciferase activity assays. HA‐p65, an NF‐κB subunit, was used as a positive control for NF‐κB activation. To examine the effects of p65 and IL‐1β on CCL22 promoter activity, we transfected Ca9‐22 cells with CCL22 promoter reporter followed by 24 hours of incubation with CAF‐conditioned media (CM) in the presence or absence of PDTC, a selective NF‐κB inhibitor, or CM collected from control shLuc or IL1B‐knockdown (shIL1B) CAF.
2.6. Statistical analyses
Survival time was calculated from surgical resection until the last follow‐up appointment of each patient (overall survival) or until the patient succumbed to the disease (disease‐free survival). Recurrence‐ and disease‐free survival of oral cancer patients were calculated by the Kaplan‐Meier method, and the comparison was carried out by the log‐rank test. Correlations were analyzed with Pearson's (N > 30) or Spearman's correlation (N ≤ 30). Two‐tailed Student's t‐test was used in cell and animal studies. Two to three independent experiments for cell studies and five mice per group for animal studies were analyzed unless indicated otherwise. Data represent mean ± SD or SEM of the experiments. Statistical significance was indicated as * (p < .05), ** (p < .01), or *** (p < .001).
2.7. Online supporting methods
Online Supporting Methods.
3. RESULTS
3.1. Increase in CCL22 expression is associated with poor prognosis in oral cancer patients
Neutralization of CCR4 receptors selectively depleted Tregs.18 Furthermore, CCL22 and CCL17 were reported to bind CCR424 and were involved in the recruitment of Tregs.25 We first analyzed the expression of both cytokines in the head and neck cancer patient cohorts in the ONCOMINE database26 and found that only CCL22 is statistically upregulated in the Estilo Head‐Neck cohort (Figure S1). As a result of the limited size in these patient cohorts, we next used RT‐qPCR to analyze CCL22 mRNA expression of 93 oral cancer patients recruited at NCKUH. As shown in Figure 1A, a statistically significant increase in CCL22 mRNA expression was observed. We then divided the patients into two groups, high (>median) and low (≤median), based on the median CCL22 mRNA expression in these patients. Kaplan‐Meier survival curve analysis was used to examine the correlation between CCL22 expression and overall patient survival, and recurrence‐ and disease‐free survival. We found that high CCL22 expression was found mostly in younger patients (62.2% vs 37.8% in Table 2) and that this high CCL22 expression showed no correlation with overall and recurrence‐free survival (Figure S2). Nonetheless, the data show a trend indicating that high CCL22 expression correlates with reduced disease‐free survival rates (Figure 1B), suggesting a role of CCL22 deregulation in oral cancer.
Figure 1.
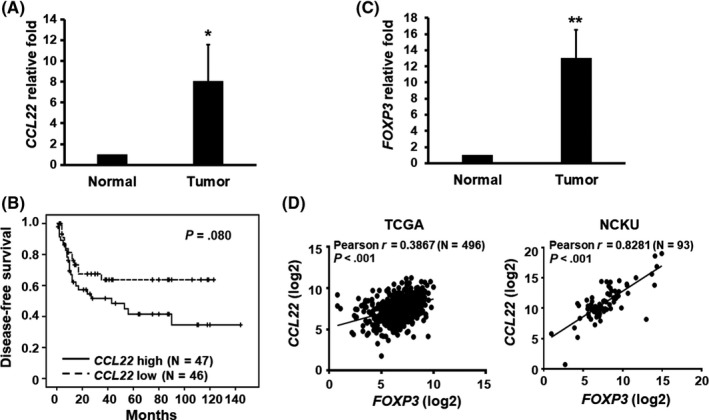
Increase in CCL22 expression is associated with a reduced disease‐free survival rate as well as an increase in FOXP3 expression in oral cancer patients. mRNA levels of CCL22 (A) or FOXP3 (C) in oral cancer tissues from patients were determined by RT‐qPCR. Data represent mean ± SEM (N = 93). *p < .05 or ** p < .01 vs normal tissues. B, Kaplan‐Meier survival curve analysis for disease‐free survival of 93 oral cancer patients at NCKUH was carried out following stratification into two groups based on median CCL22 mRNA expression levels. Patients expressing higher CCL22 mRNA had a reduced disease‐free survival rate when compared with those expressing lower CCL22 (p = .08). D, Pearson correlation shows a positive correlation between the expressions of CCL22 and FOXP3 mRNAs in The Cancer Genome Atlas (TCGA) head and neck cancer dataset. NCKU, National Cheng Kung University
Table 2.
Correlation between CCL22 expression and clinicopathological characteristics of oral cancer
| Total (N = 93) | Median CCL22 expression | P value | ||
|---|---|---|---|---|
| Low (≤1.11) | High (>1.11) | |||
| N = 46 (49.5%) | N = 47 (50.5%) | |||
| Median age (y) | ||||
| <52 | 45 | 17 (37.8) | 28 (62.2) | .029* |
| ≥52 | 48 | 29 (60.4) | 19 (39.6) | |
| Gender | ||||
| Male | 84 | 43 (51.2) | 41 (48.8) | .309 |
| Female | 9 | 3 (33.3) | 6 (66.7) | |
| Tumor site | ||||
| Buccal + tongue | 75 | 36 (48) | 39 (52) | .565 |
| Others | 18 | 10 (55.6) | 8 (44.4) | |
| Stage | ||||
| I | 13 | 6 (46.2) | 7 (53.8) | .359 |
| II | 24 | 12 (50) | 12 (50) | |
| III | 16 | 11 (68.8) | 5 (31.2) | |
| IV | 40 | 17 (42.5) | 23 (57.5) | |
| Stage | ||||
| Early (I + II) | 37 | 18 (48.6) | 19 (51.4) | .898 |
| Late (III + IV) | 56 | 28 (50) | 28 (50) | |
| Lymph node | ||||
| Negative | 49 | 27 (55.1) | 22 (44.9) | .251 |
| Positive | 44 | 19 (43.2) | 25 (56.8) | |
| Differentiation | ||||
| Well | 51 | 28 (54.9) | 23 (45.1) | .248 |
| Moderate + poor | 42 | 18 (42.9) | 24 (57.1) | |
| Recurrence | ||||
| No | 68 | 34 (50) | 34 (50) | .864 |
| Yes | 25 | 12 (48) | 13 (52) | |
Based on the median expression of CCL22 mRNA, the 93 oral cancer patients were divided into two groups, low (smaller or equal to median) and high (greater than median). Chi‐squared test was used to compare the clinicopathological characteristics between high and low groups (*p < .05).
3.2. Expression of CCL22 positively correlates with FOXP3 expression in oral cancer patients
CCL22 was previously shown to regulate Treg trafficking in ovarian cancer.22 To examine the clinical implication of CCL22 deregulation and its association with Treg recruitment in clinical specimens from oral cancer patients, we first analyzed mRNA expression of FOXP3, a marker for Tregs, in 93 oral cancer patients by using RT‐qPCR. We found that expression of FOXP3 was significantly elevated in oral cancer tissues relative to adjacent normal tissues (Figure 1C). Moreover, the expression of CCL22 mRNA was positively associated with that of FOXP3 mRNA in both The Cancer Genome Atlas (TCGA; N = 496, Pearson r = 0.3867; p < .001) and NCKU head and neck cancer cohorts (N = 93, Pearson r = 0.8281; p < .001) (Figure 1D). Based on these data, we hypothesize that CCL22 is a major chemokine involved in Treg recruitment in oral cancer patients.
3.3. Ectopic CCL22 expression increased migration and invasion of oral cancer cells
To address the role of CCL22 deregulation in oral cancer cells, we first carried out RT‐qPCR to quantify mRNA expression of CCL22 and its receptor, CCR4, in six oral cancer cell lines (Figure 2A). Following the validation of CCL22 protein expression in oral cancer lines (Figure S3), we decided to use CCL22 low‐expressing cells, OC‐3 and Ca9‐22, to generate stably overexpressed Flag‐CCL22 (CCL22‐OE) cells for the following studies. Flow cytometry validated the surface presence of CCR4 protein in these two cell lines (Figure 2B). As expected, Flag‐CCL22 was detected not only in the cell lysates (Figure 2C) but also in the CM (Figure 2D). Both control and CCL22‐OE cells were subjected to assays for proliferation, wound healing and Matrigel invasion. Interestingly, overexpression of Flag‐CCL22 differentially regulated proliferation of OC‐3 and Ca9‐22 cells (Figure 2E). However, cell migration and invasion were significantly increased in both oral cancer cell lines (Figure 2F,G).
Figure 2.
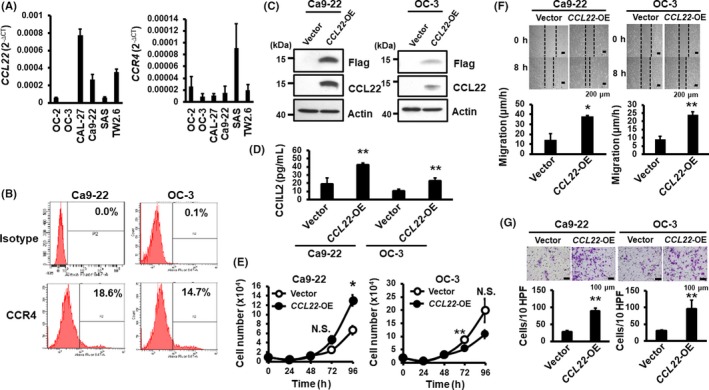
Overexpression of CCL22 increases CCR4‐expressing oral cancer cell migration and invasion. A, Quantification of CCL22 (left) and CCR4 (right) mRNAs in six oral cancer cell lines. B, Expression of surface CCR4 protein in Ca9‐22 and OC‐3 cells sorted by flow cytometry (N = 2). C, Western blot analyses of overexpressed Flag‐CCL22 in Ca9‐22 (left) and OC‐3 (right) cells. Actin was included as a loading control. D, Abundance of CCL22 protein in the culture medium was measured by ELISA. Data represent mean ± SD (N = 2). **p < .01 vs vector control. E‐G, Effects of CCL22 overexpression on the proliferation, migration, and invasion of Ca9‐22 and OC‐3 cells. E, Cell numbers were counted daily for 4 d. F, Migration rates were calculated 8 h after wound scratching. Pictures were taken under 40× magnification. Top: Representative image of wound healing at the indicated time Bottom: Quantification of cell migration rates expressed as mean ± SD (N = 2). G, Cell numbers were scored 24 h following Matrigel invasion assays. Top: Representative images of stained invasive cells. Bottom: Quantification of invaded cells per 10 high‐power fields (HPF) and expressed as mean ± SD (N = 2). *p < .05; **p < .01 vs vector control; N.S., not significant
3.4. Silencing CCL22 expression reduced oral cancer cell proliferation, migration, and invasion
We also used gene silencing to determine the impact of CCL22 depletion on proliferation, migration, and invasion in CCL22 high‐expressing oral cancer cells, TW2.6 and CAL‐27. Knockdown efficiency in two different clones (#1 and #2) was confirmed by the expression of CCL22 mRNA (Figure 3A) and released CCL22 into the CM (Figure S4). Although there was no obvious morphological change in CCL22‐knockdown cells (data not shown), CCL22 depletion significantly decreased cell proliferation, migration, and invasion (Figure 3B‐D). Collectively, we conclude that CCL22 promotes oral cancer cell proliferation, migration and invasion.
Figure 3.
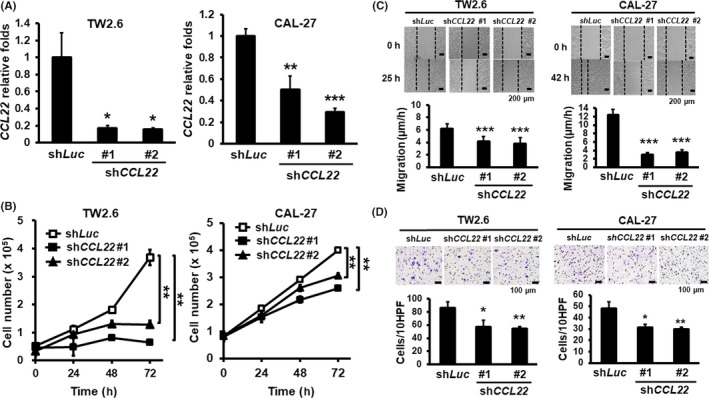
Effects of CCL22 knockdown on proliferation, migration, and invasion of oral cancer cells. A, Relative expression of CCL22 mRNA in the shLuc control and shCCL22 clones (#1 and #2) measured by RT‐qPCR analysis. B, Numbers of CCL22‐depleted TW‐2.6 and CAL‐27 cells were counted daily for 4 d. C, Migration rates of CCL22‐depleted TW‐2.6 or CAL‐27 cells at 8 h after wounding. Pictures were taken under 40× magnification. Top: Representative cell fields following wound repair at the indicated times. Bottom: Quantification of migration rates at the indicated time and expressed as mean ± SD (N = 2). D, Matrigel invasion was scored 24 h post‐seeding. Top: Representative images of invaded cells at the indicated times. Bottom: Quantification of invaded cells in each group and expressed as mean ± SD (N = 2). *p < .05; **p < .01; ***P < 0.001 vs shLuc or control. HPF, high‐power field
3.5. CCL22 manipulation altered in vivo xenograft tumorigenesis
To address the intratumoral role of CCL22 expression in tumorigenesis, we s.c. injected control or Ca9‐22‐CCL22‐OE cells in immunocompromised NOD‐SCID mice. Our data indicated that CCL22 overexpression significantly increased tumor volume and weight 28 days postinjection (Figure 4A,B) and that overexpression of CCL22 had little or no effect on Foxp3 or FOXP3 protein expression in the NOD‐SCID background (Figure 4C). We also injected NOD‐SCID mice with CAL‐27 oral cancer cells expressing a control shRNA, shLuc, or a shRNA targeting CCL22 (clone #1). Remarkably, knockdown of CCL22 completely abrogated tumorigenic capacity of the xenografts (Figure 4D,E). Together, we conclude that CCL22 promotes tumorigenesis in vivo.
Figure 4.
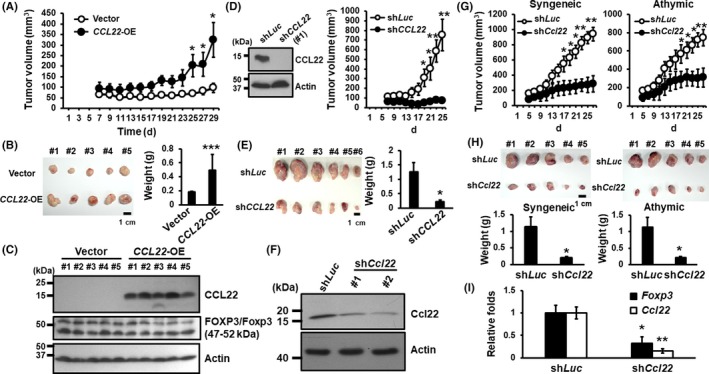
Genetic manipulation of CCL22 expression altered tumorigenic potency in both syngeneic and immunocompromised animal models. A, Subcutaneous tumor volume of Ca9‐22‐CCL22‐OE or control groups in male NOD/SCID mice, five mice per group. *p < .05 vs vector control. B, Tumor images and their weights from the control and Ca9‐22‐CCL22‐OE groups are shown. C, Western blot analyses of CCL22 and FOXP3/Foxp3 expression in the control and Ca9‐22‐CCL22‐OE xenograft tumors using the anti‐FOXP3 antibodies (Table S1). Actin is an internal loading control. D, Volume of shLuc‐ or shCCL22‐expressing (clone 1) xenografted tumors. *p < .05; **p < .01 vs shLuc. E, Images of control or shCCL22‐expressing tumors (left). Calculated weight of tumor burden in male NOD‐SCID mice (right). F, Western blot analysis of Ccl22 protein expression in the control and shCcl22‐bearing AT84 cell clones (#1 and #2). Tumor volume (G) and burden (H) of the control and shCcl22 (clone #2) expressing tumors in the syngeneic and athymic background. I, RT‐qPCR analyses of Ccl22 and Foxp3 mRNA expression in the syngeneic mouse tumors. *p < .05; **p < .01 vs shLuc control
3.6. Ccl22 silencing significantly impaired tumorigenesis regardless of the presence of T cells
To further determine whether the presence of T cells affects the ability of CCL22 to promote tumorigenesis, we s.c. injected murine oral cancer line AT84‐stably integrated with the shLuc or a shCcl22 into syngeneic C3H/HeN (immune‐competent) or athymic (immune‐deficient) male mice. Knockdown of Ccl22 in AT84 cells was confirmed by western blot analyses (Figure 4F). Clone #2 cells with a better Ccl22 knockdown efficiency were used for the s.c. injection. As shown in Figure 4G,H, Ccl22 depletion significantly impaired tumorigenesis in both syngeneic and athymic backgrounds. These data support the notion that the intratumoral role of Ccl22 is required for murine tumorigenesis regardless of the presence of T cells. Interestingly, knockdown of Ccl22 was accompanied by a concordant decrease in Foxp3 mRNA expression in tumor tissues of the immune‐competent syngeneic C3H/HeN mice (Figures 4I and S5). Together, Ccl22 not only functions autonomously as an oncogene but may also play a role in the recruitment of Fox3p+ immune cells such as Tregs to tumor lesions.
3.7. Treg‐associated Foxp3 expression was significantly induced and positively associated with Ccl22 expression during oral cancer induction in an oral carcinogenesis model
A well‐established oral cancer mouse model involving the cotreatment of mice with arecoline and 4‐NQO mimics the etiology of oral cancer among Southeast Asian and Taiwanese patients with the habit of chewing betel quid.27 In this animal model, tongue lesions from drug‐treated mice were noted following 7 months of treatment, as determined by gross examination and sectioned by H&E staining analysis. These squamous cell carcinoma‐like lesions with invasive fronts were detected only in drug‐treated but not in the control mice (Figure S6). As Foxp3 is considered to be a lineage‐specific transcription factor of CD4+CD25+ Treg cells specialized in the negative regulation of the immune response,28 coexpression of CD4, CD25, and Foxp3 is commonly used as a biomarker of Treg.29 To better understand the involvement of CD4+CD25+Foxp3+ Treg during the induction and progression of oral cancer, we first determined the percentage of this subset of Treg cells in murine PBMC, splenocytes and cervical lymph nodes (LN) 7 months post‐treatment as evaluated by flow cytometry. We observed a significant increase of Tregs in PBMC and cervical LN but not in splenocytes in treated animals (Figure 5A). We further examined the expression of Foxp3 and Ccl22 mRNAs in tongue lesions and found that the expression of both genes was dramatically increased (Figure 5B). Notably, the expression of Foxp3 shows a strong positive correlation with that of Ccl22 (Figure 5B,C). Together, these results support the notion that Ccl22 and Foxp3 play a pivotal role during oral cancer induction and progression.
Figure 5.
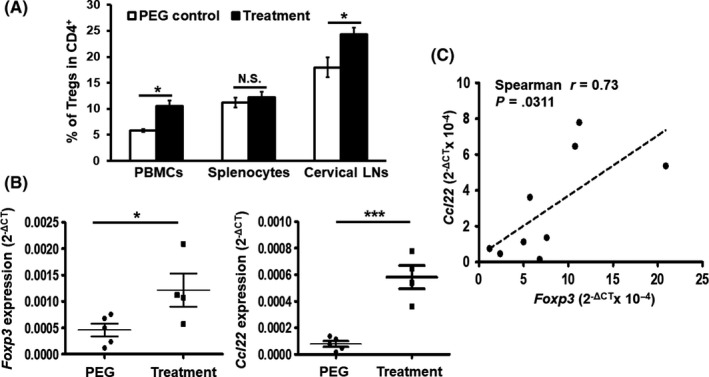
Tight, positive correlation between Foxp3 and Ccl22 expression that is induced during the progression of a model of oral cancer. A, Population of CD4+ CD25+Foxp3+ Treg in peripheral blood mononuclear cells, splenocytes or cervical lymph nodes (LN) harvested from control or drug‐treated mice were analyzed by flow cytometry and expressed as the percentage of Treg in CD4+ T cells in the indicated tissues. B, mRNA levels of Foxp3 and Ccl22 in mouse tongues harvested 7 mo after the induction of oral cancer. Data represent mean ± SEM (N = 4‐5 mice per group). *p < .05; ***p < .001 vs PEG control; N.S., not significant. C, Positive correlation of Ccl22 with Foxp3 mRNA expression in the tongue tissues (N = 9)
3.8. Cancer‐associated fibroblast‐derived IL‐1β induces CCL22 expression by NF‐κB activation
Cancer‐associated fibroblasts are one of the major components in tumor stroma and play an important role in maintaining an optimal microenvironment to support cancer cell survival and proliferation. In addition to the widely used biomarker, α‐smooth muscle actin (α‐SMA), fibroblast‐specific protein‐1 (FSP‐1) is also expressed in CAF.30 CAF produce cytokines or chemokines that foster tumor growth and the recruitment of immune cells.31 Following microscopy and Western blot validation of fibroblast markers in CAF and adjacent normal fibroblasts (NF) (Figure S7A), we first carried out in vitro Treg migration assays and detected a stimulatory effect of CAF‐CM‐treated oral cancer cells on the migration of human Treg cells relative to those treated with NF‐CM (Figure S7B), indicating the increasing presence of Treg recruiting factors in the CAF‐treated medium. As CCL22 expression could be induced by inflammation‐associated cytokines, including interferon (IFN)‐γ, IL‐1β, transforming growth factor (TGF)‐β, and CCL2/monocyte chemoattractant protein 1 (MCP‐1), in tumor tissues,12, 30, 32 we carried out RT‐qPCR to examine their expression in pairwise CAF and NF from 12 clinical specimens. Only IL1B, but not TGFB, IFNG nor MCP1, was significantly elevated in CAF compared to NF (Figures 6A and S7C). We also identified a positive correlation between the mRNA levels of IL1B and CCL22 expression in NCKU patient cohorts (Figure 6B, left) and those in mouse oral lesions (Figure 6B, right). These observations suggest a role of CAF‐derived IL‐1β in the increase of CCL22 mRNA expression in oral cancer.
Figure 6.
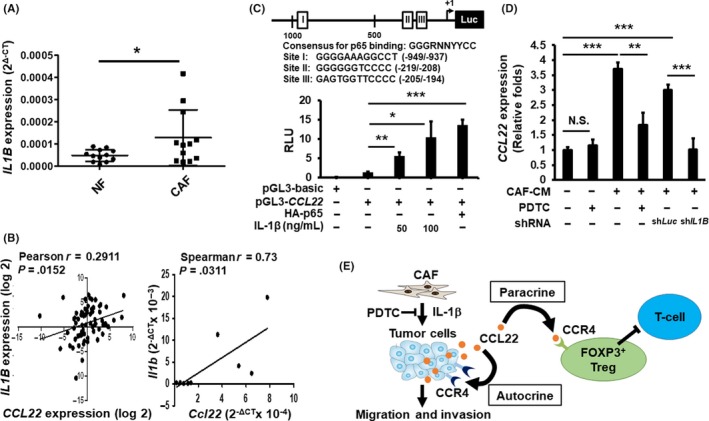
Effects of interleukin (IL)‐1β on CCL22 expression during oral cancer progression. A, Mean (±SEM) expression of IL1B mRNA in cancer‐associated fibroblasts (CAF) and normal fibroblasts (NF) (N = 12) as determined by RT‐qPCR. B, Left: Correlation between the expression of CCL22 and IL1B in human oral cancer specimens (N = 93). Right: Correlation between the expression of Ccl22 and Il1b in mouse tongue tissues (N = 9). C, Top: Schematic representation of the CCL22 reporter construct. The consensus p65 binding sequences are marked as I, II, and III with empty boxes. The consensus sequence and the putative p65 binding site sequences are shown. Bottom: Effects of IL‐1β or ectopic expression of HA‐p65 on CCL22 promoter reporter activity. D, Effects of pyrrolidine dithiocarbamate(PDTC), NF‐κB inhibitor, and IL1B knockdown (shLuc vs shIL1B) on the ability of CAF‐conditioned media (CM) to induce CCL22 promoter activity. Data represent mean ± SD. *p < .05, **p < .01, ***p < .001 vs control. E, Model depicting the autocrine and paracrine effects of CCL22 deregulation in oral cancer and tumor stroma
To further investigate the mechanism underlying transcriptional regulation of CCL22 expression, we cloned the proximal promoter spanning −1191 ~ +34 (transcription start site as +1) of the human CCL22 gene into the pGL3‐basic vector and determined the effects of IL‐1β on CCL22 promoter activity in Ca9‐22 oral cancer cells. Indeed, IL‐1β activated CCL22 promoter activity in a dose‐dependent way (Figure 6C, bottom, lanes 2‐4). We also confirmed the recombinant IL‐1β‐mediated increase of CCL22 mRNA in oral cancer cells by using RT‐qPCR analysis (Figure S8). Bioinformatics analyses predict three putative canonical binding sites for p65, a family member of the NF‐κB transcription factors (Figure 6C, top). Transient transfection reporter assays showed that ectopic overexpression of HA‐tagged p65 (HA‐p65) further induced CCL22 promoter activity (Figure 6C, bottom, lanes 2 vs 5, and Figure S9). Furthermore, CM collected from CAF potently activated CCL22 promoter activity. However, a selective inhibitor of NF‐κB, PDTC, or knocking down IL‐1B (shIL1B), significantly compromised the ability of CAF‐CM to transactivate CCL22 promoter activity (Figure 6D). Taken together, our results support the conclusion that CAF‐derived IL‐1β induces CCL22 expression in an NF‐κB‐dependent way in oral cancer.
4. DISCUSSION
In past decades, limited therapeutic options have impeded significant improvement of the 5‐year survival rate for head and neck cancer. Among 10 cancer types with the highest overall immune infiltration scores, head and neck cancer has the highest score for Treg infiltration, thereby providing a strong rationale for treating these tumors with immunotherapy modalities, especially targeting Tregs.16 Although the infiltration and accumulation of Tregs correlated with a poor prognosis in several cancer types,12 how Tregs are recruited to tumor lesions and their microenvironment remains elusive. In the present study, we discovered that CCL22 functions autonomously as an oncogene and plays a role in Treg infiltration.
CCL22 protein was initially identified as a secreted chemokine by dendritic cells and macrophages that elicits its effects on its target cells by interacting with CCR4 on the target cell surface.33 CCL22 mRNA expression is expressed at an elevated level in oral cancer patients compared to their normal cohorts, and this increase compromises its disease‐free survival.
We also observed an association with a borderline significance (p = .08) between an increase in CCL22 expression in patient tumorous tissues with reduced disease‐free survival. Despite that the immunopositivity of CCR4 and one of its ligands, CCL22, was previously shown to mediate lymph node metastasis in head and neck cancer,23 we were unable to detect any clinical association of CCL22 mRNA expression with patients’ clinicopathological characteristics, except age (Table 2). The different observations could be as a result of the methods used for measuring CCL22 expression, namely, RT‐qPCR analysis in our study and immunohistochemical staining in the study of Tsujikawa et al.23
Although chemokines and their receptors were initially appreciated as important mediators of immune cell migration, increasing evidence indicates that they also play critical roles in the biology of non‐immune cells important for tumor growth and progression.34 CCL22 is one such chemokine and frequently overexpressed in oral cancer cells. We showed that genetic manipulation of CCL22 expression in oral cancer cells expressing CCR4 significantly altered cancer cell migration and invasion in vitro (Figures 2 and 3). Although the reason for the differential effect of ectopic CCL22 expression on the proliferation of Ca9‐22 and OC‐3 cells was not clear, its depletion significantly reduced in vitro oral cancer cell proliferation (Figure 3B) and in vivo tumorigenesis (Figure 4D,G), suggesting the requirement of CCL22 to promote oral cancer cell proliferation. Notably, CCL22‐mediated xenograft tumor growth could occur independently of the functional immunity (Figure 4A,D,G). This result supports the role of CCL22 in cell‐autonomous action in oral cancer progression.
CCL22 regulates CCR4‐expressing Treg infiltration in various tumor types.35 Overexpression of CCL22 in oral cancer cells had a marginal impact on Foxp3/FOXP3 protein levels of xenografted tumors in mice lacking a functional immune system (Figure 4C). Interestingly, we observed a positive correlation for the expression of CCL22 and FOXP3 (Figure 1D), a Treg marker, in clinical specimens. This positive correlation was also recapitulated in a model of murine oral cancer (Figure 5C). Overall, these data lend strong support to the notion that an increase in CCL22 expression mediates the recruitment of FOXP3‐positive cells including Tregs in oral carcinogenesis. IL‐1β is predominantly expressed in CAFs, and its expression is associated with CCL22 deregulation in clinical specimens and murine oral lesions (Figure 6A,B). Collectively, we propose a model in which IL‐1β produced by CAFs induces CCL22 expression in oral cancer cells and enhances their oncogenic ability and subsequently increases FOXP3‐positive Treg infiltration, thus contributing to the progression of oral cancer (Figure 6E).
We observed a concordant mRNA increase in CCL22 and FOXP3 in clinical oral cancer specimens and in a drug‐induced oral cancer model (Figures 1 and 5, respectively). However, overexpression of CCL22 did not alter Foxp3/FOXP3 protein levels, indicating little or no effect of CCL22 alterations on Foxp3/FOXP3 expression in immune‐compromised mice (Figure 4C). Notably, silencing of Ccl22 in murine oral cancer line AT‐84 significantly impaired murine tumorigenesis as well as intratumor Foxp3+‐expressing cells in the syngeneic background (Figure 4G‐I). In Figure 4G, we also noted a marked reduction of Ccl2‐depleted AT84 tumor burden in the syngeneic background compared with that in the athymic background (4.5‐ vs 2.5‐fold), indicating the involvement of Ccl22 functions in tumor and host stroma. Taken together, we conclude that CCL22 exerts a protumor effect, in part, through the recruitment of FOXP3+ Treg infiltration to oral cancer lesions.
Oral cancer patients often have elevated levels of inflammatory cytokines such as IL‐1β or TGF‐β in their saliva, which are in close contact with cancer cells in the oral cavity.36, 37 These cytokines either alone or together enhanced CCL22 expression.32, 38 CAFs constitute a significant portion of the reactive tumor stroma and play a crucial role in tumor progression through direct cell‐cell contacts or by the secretion of cytokines, chemokines, and growth factors.39 Among these cytokines, IL‐1β was the most differentially expressed in CAFs isolated from oral cancer tissues (Figure 6A). Although MCP‐1 could also be induced by IL‐1β‐treated fibroblasts40 and mediated the crosstalk between fibroblasts and breast cancer cells,41 we failed to detect the differential expression of MCP1 in the pairwise comparison of NF and CAF (Figure S7C). Moreover, the expression of IL1B mRNA was positively associated with that of CCL22 mRNA in clinical specimens and drug‐induced oral cancer lesions (Figure 6B). Our promoter reporter assays further showed that CAF‐derived IL‐1β potently induces CCL22 reporter activity in a way that is dependent on NF‐κB activity (Figure 6C,D). Although ~58% of isolated CAF lines with activating phosphorylation of NF‐κB (Figure S10) and a borderline significance of increased IL‐1B expression in CAF relative to paired NF (Figure 6B, p = .047) were detected, we cannot rule out the possibility of losing the in vivo properties during in vitro propagation of proinflammatory CAFs 42 and the influence of tumor cells in the tumor microenvironment.41
Our study supports an oncogenic function of CCL22 in oral cancer through both autonomous and non‐autonomous actions, leading to a potential application of using serum CCL22 as a marker for oral cancer prognosis. Furthermore, we rationalize that a better understanding of the crosstalk between Tregs and oral cancer cells will be useful in justifying targeting the IL‐1β‐CCL22‐CCR4 axis as a viable option for treating oral cancer.
DISCLOSURE
Authors declare no conflicts of interest for this article.
Supporting information
ACKNOWLEDGMENTS
We thank Drs Lee‐Young Chau and Fang Liao for their helpful discussion during manuscript preparation. The grant was supported by Ministry of Science and Technology in Taiwan to Tsai ST (MOST‐102‐2314‐B‐006‐47; 105‐2314‐B‐006‐073; 108‐2314‐B‐006 ‐084) and Wu LW (MOST‐105‐2320‐B‐006‐035; 106‐2320‐B‐006‐059; 107‐2321‐B‐006‐007).
Huang Y‐H, Chang C‐Y, Kuo Y‐Z, et al. Cancer‐associated fibroblast‐derived interleukin‐1β activates protumor C‐C motif chemokine ligand 22 signaling in head and neck cancer. Cancer Sci. 2019;110:2783–2793. 10.1111/cas.14135
Huang and Chang contributed equally to this work.
Contributor Information
Sen‐Tien Tsai, Email: T602511@mail.ncku.edu.tw.
Li‐Wha Wu, Email: liwhawu@mail.ncku.edu.tw.
REFERENCES
- 1. Ferlay J, Shin HR, Bray F, Forman D, Mathers C, Parkin DM. Estimates of worldwide burden of cancer in 2008: GLOBOCAN 2008. Int J Cancer. 2010;127(12):2893‐2917. [DOI] [PubMed] [Google Scholar]
- 2. Fidler MM, Bray F, Soerjomataram I. The global cancer burden and human development: a review. Scand J Public Health. 2018;46(1):27‐36. [DOI] [PubMed] [Google Scholar]
- 3. Suh Y, Amelio I, Guerrero Urbano T, Tavassoli M. Clinical update on cancer: molecular oncology of head and neck cancer. Cell Death Dis. 2014;5:e1018. [DOI] [PMC free article] [PubMed] [Google Scholar]
- 4. Rodriguez CP, Adelstein DJ. Survival trends in head and neck cancer: opportunities for improving outcomes. Oncologist. 2010;15(9):921‐923. [DOI] [PMC free article] [PubMed] [Google Scholar]
- 5. Montero PH, Patel SG. Cancer of the oral cavity. Surg Oncol Clin N Am. 2015;24(3):491‐508. [DOI] [PMC free article] [PubMed] [Google Scholar]
- 6. Chen YJ, Chang JT, Liao CT, et al. Head and neck cancer in the betel quid chewing area: recent advances in molecular carcinogenesis. Cancer Sci. 2008;99(8):1507‐1514. [DOI] [PMC free article] [PubMed] [Google Scholar]
- 7. Hanahan D, Weinberg RA. Hallmarks of cancer: the next generation. Cell. 2011;144(5):646‐674. [DOI] [PubMed] [Google Scholar]
- 8. Curiel TJ. Tregs and rethinking cancer immunotherapy. J Clin Invest. 2007;117(5):1167‐1174. [DOI] [PMC free article] [PubMed] [Google Scholar]
- 9. Chao JL, Savage PA. Unlocking the complexities of tumor‐associated regulatory T cells. J Immunol. 2018;200(2):415‐421. [DOI] [PMC free article] [PubMed] [Google Scholar]
- 10. deLeeuw RJ, Kost SE, Kakal JA, Nelson BH. The prognostic value of FoxP3+ tumor‐infiltrating lymphocytes in cancer: a critical review of the literature. Clin Cancer Res. 2012;18(11):3022‐3029. [DOI] [PubMed] [Google Scholar]
- 11. Shang B, Liu Y, Jiang SJ, Liu Y. Prognostic value of tumor‐infiltrating FoxP3+ regulatory T cells in cancers: a systematic review and meta‐analysis. Sci Rep. 2015;5:15179. [DOI] [PMC free article] [PubMed] [Google Scholar]
- 12. Faget J, Biota C, Bachelot T, et al. Early detection of tumor cells by innate immune cells leads to T(reg) recruitment through CCL22 production by tumor cells. Cancer Res. 2011;71(19):6143‐6152. [DOI] [PubMed] [Google Scholar]
- 13. Chaudhary B, Elkord E. Regulatory T cells in the tumor microenvironment and cancer progression: role and therapeutic targeting. Vaccines (Basel). 2016;4(3):28‐52. [DOI] [PMC free article] [PubMed] [Google Scholar]
- 14. Pesenacker AM, Broady R, Levings MK. Control of tissue‐localized immune responses by human regulatory T cells. Eur J Immunol. 2015;45(2):333‐343. [DOI] [PubMed] [Google Scholar]
- 15. Hoeppli RE, Wu D, Cook L, Levings MK. The environment of regulatory T cell biology: cytokines, metabolites, and the microbiome. Front Immunol. 2015;6:61. [DOI] [PMC free article] [PubMed] [Google Scholar]
- 16. Mandal R, Senbabaoglu Y, Desrichard A, et al. The head and neck cancer immune landscape and its immunotherapeutic implications. JCI Insight. 2016;1(17):e89829. [DOI] [PMC free article] [PubMed] [Google Scholar]
- 17. Iellem A, Mariani M, Lang R, et al. Unique chemotactic response profile and specific expression of chemokine receptors CCR17 and CCR17 by CD4(+)CD25(+) regulatory T cells. J Exp Med. 2001;194(6):847‐853. [DOI] [PMC free article] [PubMed] [Google Scholar]
- 18. Sugiyama D, Nishikawa H, Maeda Y, et al. Anti‐CCR18 mAb selectively depletes effector‐type FoxP3+CD4+ regulatory T cells, evoking antitumor immune responses in humans. Proc Natl Acad Sci USA. 2013;110(44):17945‐17950. [DOI] [PMC free article] [PubMed] [Google Scholar]
- 19. Maggioni D, Pignataro L, Garavello W. T‐helper and T‐regulatory cells modulation in head and neck squamous cell carcinoma. Oncoimmunology. 2017;6(7):e1325066. [DOI] [PMC free article] [PubMed] [Google Scholar]
- 20. Burr SP, Dazzi F, Garden OA. Mesenchymal stromal cells and regulatory T cells: the Yin and Yang of peripheral tolerance? Immunol Cell Biol. 2013;91(1):12‐18. [DOI] [PubMed] [Google Scholar]
- 21. Clark RA, Huang SJ, Murphy GF, et al. Human squamous cell carcinomas evade the immune response by down‐regulation of vascular E‐selectin and recruitment of regulatory T cells. J Exp Med. 2008;205(10):2221‐2234. [DOI] [PMC free article] [PubMed] [Google Scholar]
- 22. Curiel TJ, Coukos G, Zou L, et al. Specific recruitment of regulatory T cells in ovarian carcinoma fosters immune privilege and predicts reduced survival. Nat Med. 2004;10(9):942‐949. [DOI] [PubMed] [Google Scholar]
- 23. Tsujikawa T, Yaguchi T, Ohmura G, et al. Autocrine and paracrine loops between cancer cells and macrophages promote lymph node metastasis via CCR23/CCL22 in head and neck squamous cell carcinoma. Int J Cancer. 2013;132(12):2755‐2766. [DOI] [PubMed] [Google Scholar]
- 24. Yoshie O, Matsushima K. CCR24 and its ligands: from bench to bedside. Int Immunol. 2015;27(1):11‐20. [DOI] [PubMed] [Google Scholar]
- 25. Mizukami Y, Kono K, Kawaguchi Y, et al. CCL17 and CCL22 chemokines within tumor microenvironment are related to accumulation of Foxp3+ regulatory T cells in gastric cancer. Int J Cancer. 2008;122(10):2286‐2293. [DOI] [PubMed] [Google Scholar]
- 26. Rhodes DR, Yu J, Shanker K, et al. ONCOMINE: a cancer microarray database and integrated data‐mining platform. Neoplasia. 2004;6(1):1‐6. [DOI] [PMC free article] [PubMed] [Google Scholar]
- 27. Chang NW, Pei RJ, Tseng HC, et al. Co‐treating with arecoline and 4‐nitroquinoline 1‐oxide to establish a mouse model mimicking oral tumorigenesis. Chem Biol Interact. 2010;183(1):231‐237. [DOI] [PubMed] [Google Scholar]
- 28. Campbell DJ, Koch MA. Phenotypical and functional specialization of FOXP3+ regulatory T cells. Nat Rev Immunol. 2011;11(2):119‐130. [DOI] [PMC free article] [PubMed] [Google Scholar]
- 29. Zhao J, Cao Y, Lei Z, Yang Z, Zhang B, Huang B. Selective depletion of CD4+CD25+Foxp3+ regulatory T cells by low‐dose cyclophosphamide is explained by reduced intracellular ATP levels. Cancer Res. 2010;70(12):4850‐4858. [DOI] [PubMed] [Google Scholar]
- 30. Tao L, Huang G, Song H, Chen Y, Chen L. Cancer associated fibroblasts: an essential role in the tumor microenvironment. Oncol Lett. 2017;14(3):2611‐2620. [DOI] [PMC free article] [PubMed] [Google Scholar]
- 31. Ostman A, Augsten M. Cancer‐associated fibroblasts and tumor growth–bystanders turning into key players. Curr Opin Genet Dev. 2009;19(1):67‐73. [DOI] [PubMed] [Google Scholar]
- 32. Yang P, Li QJ, Feng Y, et al. TGF‐beta‐miR‐34a‐CCL22 signaling‐induced Treg cell recruitment promotes venous metastases of HBV‐positive hepatocellular carcinoma. Cancer Cell. 2012;22(3):291‐303. [DOI] [PMC free article] [PubMed] [Google Scholar]
- 33. Vulcano M, Albanesi C, Stoppacciaro A, et al. Dendritic cells as a major source of macrophage‐derived chemokine/CCL22 in vitro and in vivo. Eur J Immunol. 2001;31(3):812‐822. [DOI] [PubMed] [Google Scholar]
- 34. Chow MT, Luster AD. Chemokines in cancer. Cancer Immunol Res. 2014;2(12):1125‐1131. [DOI] [PMC free article] [PubMed] [Google Scholar]
- 35. Nishikawa H, Sakaguchi S. Regulatory T cells in tumor immunity. Int J Cancer. 2010;127(4):759‐767. [DOI] [PubMed] [Google Scholar]
- 36. Brailo V, Vucicevic‐Boras V, Lukac J, et al. Salivary and serum interleukin 1 beta, interleukin 6 and tumor necrosis factor alpha in patients with leukoplakia and oral cancer. Med Oral Patol Oral Cir Bucal. 2012;17(1):e10‐e15. [DOI] [PMC free article] [PubMed] [Google Scholar]
- 37. Polz‐Dacewicz M, Strycharz‐Dudziak M, Dworzanski J, Stec A, Kocot J. Salivary and serum IL‐10, TNF‐alpha, TGF‐beta, VEGF levels in oropharyngeal squamous cell carcinoma and correlation with HPV and EBV infections. Infect Agent Cancer. 2016;11:45. [DOI] [PMC free article] [PubMed] [Google Scholar]
- 38. Rodriguez PC, Ochoa AC. Arginine regulation by myeloid derived suppressor cells and tolerance in cancer: mechanisms and therapeutic perspectives. Immunol Rev. 2008;222:180‐191. [DOI] [PMC free article] [PubMed] [Google Scholar]
- 39. Bremnes RM, Donnem T, Al‐Saad S, et al. The role of tumor stroma in cancer progression and prognosis: emphasis on carcinoma‐associated fibroblasts and non‐small cell lung cancer. J Thorac Oncol. 2011;6(1):209‐217. [DOI] [PubMed] [Google Scholar]
- 40. Strieter RM, Wiggins R, Phan SH, et al. Monocyte chemotactic protein gene expression by cytokine‐treated human fibroblasts and endothelial cells. Biochem Biophys Res Comm. 1989;162(2):694‐700. [DOI] [PubMed] [Google Scholar]
- 41. Tsuyada A, Chow A, Wu J, et al. CCL2 mediates cross‐talk between cancer cells and stromal fibroblasts that regulates breast cancer stem cells. Cancer Res. 2012;72(11):2768‐2779. [DOI] [PMC free article] [PubMed] [Google Scholar]
- 42. Erez N, Truitt M, Olson P, Arron ST, Hanahan D. Cancer‐associated fibroblasts are activated in incipient neoplasia to orchestrate tumor‐promoting inflammation in an NF‐kappaB‐dependent manner. Cancer Cell. 2010;17(2):135‐147. [DOI] [PubMed] [Google Scholar]
Associated Data
This section collects any data citations, data availability statements, or supplementary materials included in this article.
Supplementary Materials