Abstract
Lung cancer has the highest morbidity and mortality among all cancers. Discovery of early diagnostic and prognostic biomarkers of lung cancer can greatly facilitate the survival rate and reduce its mortality. In our study, by analyzing Gene Expression Omnibus and Oncomine databases, we found a novel potential oncogene uridine‐cytidine kinase 2 (UCK2), which was overexpressed in lung tumor tissues compared to adjacent nontumor tissues or normal lung. Then we confirmed this finding in clinical samples. Specifically, UCK2 was identified as highly expressed in stage IA lung cancer with a high diagnostic accuracy (area under the receiver operating characteristic curve > 0.9). We also found that high UCK2 expression was related to poorer clinicopathological features, such as higher T stage and N stage and higher probability of early recurrence. Furthermore, we found that patients with high UCK2 expression had poorer first progression survival and overall survival than patients with low UCK2 expression. Univariate and multivariate Cox regression analyses showed that UCK2 was an independent risk factor related with worse DFS and OS. By gene set enrichment analysis, tumor‐associated biological processes and signaling pathways were enriched in the UCK2 overexpression group, which indicated that UCK2 might play a vital role in lung cancer. Furthermore, in cytology experiments, we found that knockdown of UCK2 could suppress the proliferation and migration of lung cancer cells. In conclusion, our study indicated that UCK2 might be a potential early diagnostic and prognostic biomarker for lung cancer.
Keywords: biomarker, early diagnosis, lung cancer, prognosis, uridine‐cytidine kinase 2
Abbreviations
- ADC
adenocarcinoma
- AUC
area under the ROC curve
- CI
confidence interval
- DFS
disease‐free survival
- EGFR
epidermal growth factor receptor
- FDR
false discovery rate
- GEO
Gene Expression Omnibus
- GSEA
gene set enrichment analysis
- HR
hazard ratio
- IHC
immunohistochemistry
- LCC
large cell carcinoma
- NSCLC
non‐small cell lung cancer
- OS
overall survival
- ROC
receiver operating characteristic
- RT‐qPCR
real‐time quantitative PCR
- SCC
squamous cell carcinoma
- SCLC
small‐cell lung cancer
- UCK1
uridine‐cytidine kinase 1
- UCK2
uridine‐cytidine kinase 2
1. INTRODUCTION
Lung cancer is the most common type of cancer in the world and the leading cause of cancer‐related death.1 As lung cancer patients are mainly diagnosed at terminal stages, the 5‐year survival rate is very low (4%‐17%).2, 3 However, stage IA patients who undergo complete surgical resection of have the best prognostic evaluation, with the 5‐year survival rate reaching 70%.4 In addition, up to 40% of TNM classified early stage lung cancer recurred after surgical resection.5 Thus, developing effective biomarkers for early diagnosis and prognosis of lung cancer are urgently needed.6
Uridine‐cytidine kinase 2 is an enzyme encoded by the UCK2 gene located on chromosome 1q22‐23.2 and 1 of 2 human UCKs.7 The other UCK protein, UCK1, has 70% sequence homology with UCK2.8, 9 Both of them can catalyze the phosphorylation of uridine and cytidine to the monophosphate form, which plays a key role in the biosynthesis of the pyrimidine nucleotides that constitute DNA and RNA.9, 10, 11, 12, 13 The catalyzing efficiency of UCK2 for uridine and cytidine substrates is 15‐20 times higher than UCK1.11 The latter is expressed in various normal human tissues. including heart, liver, and skeletal muscle, whereas UCK2 is only expressed in normal human placenta and testis.7, 11 Although uridine and cytidine are the physiological substrates for UCK2, it has been documented to phosphorylate other nucleoside analogues and plays a vital part in chemical therapy against cancer.11, 14, 15, 16, 17, 18 This peculiarity could enable UCK2 as a significant activating agent of nucleoside prodrugs, such as cyclopentenyl cytidine.19 Current studies have found that UCK2 is overexpressed in several types of cancer tissues14, 20, 21, 22 and its upregulation is associated with poor progression and prognosis of breast cancer and hepatocellular carcinoma.22, 23, 24, 25, 26 Our study shows the high expression of UCK2 in lung cancer, especially in the early stages. Moreover, UCK2 overexpression closely related with the progression and poor prognosis of lung cancer, which indicates that UCK2 might serve as a potential diagnostic and therapeutic target for lung cancer in the future.
2. MATERIALS AND METHODS
2.1. Clinical samples
The fresh tumor tissues and adjacent nontumor tissues were procured from 37 newly diagnosed lung cancer patients who underwent surgical resection. Table S1 lists the patients’ clinical information. This study has been approved by the Ethics Committee of Medical School of Wuhan University (Wuhan, China).
2.2. Cell culture
Human lung cancer cell lines A549, H1299, and H661 and normal lung epithelial cell line BEAS‐2B were obtained from ATCC, cultured in RPMI‐1640 basal culture medium (Biological Industries), and supplemented with 10% FBS (Biological Industries). Cells were cultured in a humid condition with 5% CO2 at 37°C.
2.3. Quantitative real‐time PCR
The total RNA from the clinical samples was extracted using TRIzol (Invitrogen) following the instruction manual and then measured by NanoDrop 2000 (Thermo Fisher Scientific). The RevertAid RT Reverse Transcription Kit (Thermo Fisher Scientific) was used to reverse‐transcribe the total RNA (2.0 μg) to cDNA following the protocol. The ChamQ SYBR qPCR Master Mix Q311‐02/03 version 7.1 (Vazyme) was used to amplify the cDNAs using the QuantStudio 6 Flex Real‐Time PCR system (Life Technologies). A reference gene (β‐actin) was used to normalize the average CT value of target genes. We calculated the relative gene expression as 2−ΔΔCt. The sequences of primers were: β‐actin forward, 5′‐GAAGAGCTACGAGCTGCCTGA‐3′ and reverse, 5′‐CAGACAGCACTGTGTTGGCG‐3′); and UCK2 forward, 5′‐GCCCTTCCTTATAGGCGTCAG‐3′ and reverse, 5′‐CTTCTGGCGATAGTCCACCTC‐3′.
2.4. Immunohistochemistry assay
Two lung cancer tissue microarrays HLugA180Su03 and HLug‐Squ150Sur‐02 were purchased from Shanghai Outdo Biotech. HLugA180Su03 contained 88 carcinoma tissues and paired paracarcinoma tissues of patients who had been pathologically diagnosed with lung adenocarcinoma. HLug‐Squ150Sur‐02 contained 74 carcinoma tissues and paired paracarcinoma tissues of patients who had been pathologically diagnosed with lung squamous cell carcinoma. The basic clinical information of all patients is listed in Tables S2 and S3. The IHC of UCK2 were carried out using anti‐UCK2 Ab (ab60222; Abcam, Cambridge, UK). The tissue sections were dewaxed and the endogenous peroxidase was blocked by 1% hydrogen peroxide. After incubation with primary Ab against UCK2 overnight at 4°C and being washed, tissue sections were treated with biotinylated secondary Ab for 1 hour at room temperature. Finally, tissue sections were reacted with 3,3‐diaminobenzidine and counterstained with hematoxylin. The total score (values 0‐12) of protein expression was calculated by multiplying the percentage of immunopositive areas (0, 0%‐10%; 1, 11%‐25%; 2, 26%‐50%; 3, 51%‐75%; and 4, >75%) and immunostaining intensity (0, negative; 1, weak; 2, moderate; and 3, strong). A score of 4 or more defined high expression; a score less than 3 defined low expression.
2.5. Gene Expression Omnibus database analysis
The GEO database was used to analyze the UCK2 expression in carcinoma and noncarcinoma tissues. Table S4 lists the basic characteristics of the datasets and details of the analyses.
2.6. Oncomine database analysis
Five hundred thirty‐eight samples from 5 Oncomine datasets were used to analyze the UCK2 expression in lung cancer vs normal tissue. Two‐fold change, P‐value = .05, and top 10% gene rank was set as the threshold. Table 1 summarizes the details of the analyses.
Table 1.
Comparison of UCK2 expression across 12 analyses
| Legend | Dataset | 12 analyses | P value | Fold change |
|---|---|---|---|---|
| 1 | Hou et al, 201032 | LCC vs normal | 4.52E‐12 | 5.239 |
| 2 | ADC vs normal | 2.44E‐12 | 2.427 | |
| 3 | SCC vs normal | 1.21E‐18 | 4.289 | |
| 4 | Garber et al, 200133 | LCC vs normal | 3.27E‐4 | 3.494 |
| 5 | SCC vs normal | 1.25E‐4 | 3.952 | |
| 6 | ADC vs normal | 2.309 | 0.002 | |
| 7 | SCLC vs normal | 2.299 | 0.002 | |
| 8 | Bhattacharjee et al, 200129 | SCC vs normal | 1.82E‐5 | 7.715 |
| 9 | SCLC vs normal | .009 | 2.604 | |
| 10 | LCT vs normal | .002 | 2.324 | |
| 11 | Beer et al, 20025 | ADC vs Normal | 3.97E‐6 | 11.215 |
| 12 | Wachi et al, 200534 | SCC vs normal | 5.02E‐4 | 3.611 |
ADC, adenocarcinoma; LCC, large cell carcinoma; LCT, lung carcinoid tumor; SCC, squamous cell carcinoma; SCLC, small cell lung cancer.
2.7. Kaplan‐Meier plotter
The Kaplan‐Meier Plotter (http:www.kmplot.com) was used to assess the prognostic value of UCK2 in lung cancer. High (top 50%) and low (bottom 50%) UCK2 expression groups were divided according to the median expression of UCK2. The desired Affymetrix ID was valid: 209825_s_at (UCK2). Log rank P values and HR with 95% CI were calculated and extracted from the Kaplan‐Meier Plotter webpage, and shown in the plot.
2.8. Gene set enrichment analysis
The role of UCK2 in biological processes was investigated by GSEA using GSE33532 with functional gene set files (c5.all.v5.1.symbols.gmt) to obtain enriched gene sets. High (top 50%) and low (bottom 50%) UCK2 expression groups were divided according to the median expression of UCK2. Gene sets with nominal P value less than .05 and FDR less than .25 were considered of significance.
2.9. Lentivirus packaging and generation of stable cell lines
Lentiviral supernatants were generated by transient transfection of HEK293T cells with pLKO.1 plasmid and packaging plasmids pSPAX2 and pMD2G (kindly provided by Dr. Liu Hudan, Medical Research Institute, Wuhan University) and harvested 48 hours after transfection. Supernatants were filtered and used to infect cells with the addition of 10 μg/mL polybrene for 48 hours. Stable cell lines were selected with media containing 2 μg/mL puromycin and confirmed by RT‐qPCR.
2.10. Cell proliferation assay
The cell growth rate was detected by CCK‐8 cell proliferation assays. Cells were seeded in a 96‐well plate at the density of 1.0 × 10⁴ cells per well. The cell viability was detected at four selected time points (0, 12, 24 and 48 hours). CCK‐8 solution (10 μL) was added to each well at indicated times and incubated for another 3 hours. The absorbance of each well was obtained from the PerkinElmer 2030 Victor X multilabel plate reader (PerkinElmer) at 450 nm.
2.11. Wound healing assay
Cell migration was assessed using wound healing assays. Cells (1.0 × 10⁶/well) were seeded into 6‐well plates. After the cells reached 80%‐90% confluence, the cell monolayer was wounded using a sterile 10‐μL pipette tip and washed twice with PBS. Cells were allowed to migrate for the indicated times in the presence of 4 μg/mL mitomycin (Roche) to inhibit cell division. The wounds were observed and imaged. The gap widths were imaged at 0 and 24 hours after wounding and were measured from the photomicrographs. The changes in cell migration were determined by comparing the differences in wound healing in least 4 fields using ImageJ (NIH).
2.12. Statistical analysis
GraphPad Prism version 7.0 (GraphPad) and SPSS version 25.0 (SPSS) were used for statistical analysis. The UCK2 expression in different groups was compared using 2‐tailed t test and one‐way ANOVA followed by Dunnett's test. The diagnostic value of UCK2 in lung cancer was assessed using ROC curves and AUC. The association between UCK2 expression and clinicopathological features was explored using the χ2 test. Univariate and multivariate survival analyses were executed using the Cox proportional hazards regression model. Factors with prognostic significance in the univariate analysis were included in the subsequent multivariate survival analysis. P values less than .05 were considered statistically significant.
3. RESULTS
3.1. UCK2 upregulated in multiple tumors as well as in leukemia
To assess the UCK2 expression in malignant and their corresponding nonmalignant tissues, we analyzed 12 GEO datasets and found UCK2 was overexpressed in multiple carcinomas, such as lung, esophageal, liver, pancreatic, gastric, renal, gastric, nasopharyngeal, and colorectal cancer, and as well as in pediatric T‐cell acute lymphatic leukemia (Figure 1, Table S4). UCK2 was upregulated in various cancers, which indicates it might participate in tumorigenesis.
Figure 1.
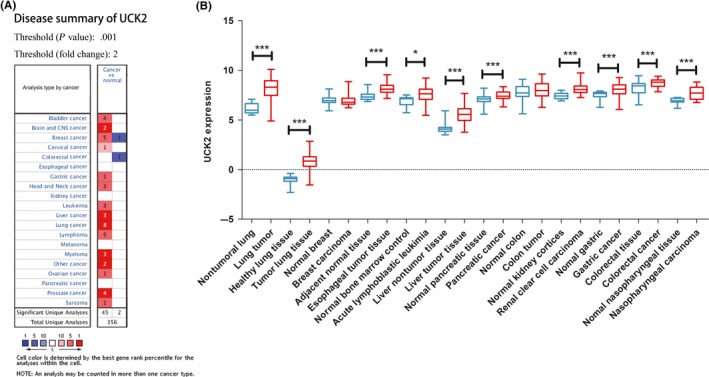
Uridine‐cytidine kinase 2 (UCK2) was upregulated in various cancers. A, The Oncomine database was used to explore UCK2 expression in cancer and normal tissues. Two‐fold change, top 10% gene rank, and P value <.001 was set as the threshold. Red and blue indicates UCK2 upregulation and downregulation, respectively. B, 12 GEO datasets were used to explore UCK2 expression. Expression was transformed into log2 (probe intensities) and showed as the mean ± SE. *P < .05; ***P < .001
3.2. Overexpression of UCK2 in lung cancer
The GEO datasets and Oncomine database were used to explore the UCK2 expression in cancer and normal tissues. As shown in Figure 2A, UCK2 was overexpressed in NSCLC compared with nontumoral lung tissues in GSE33532. Figure 2B shows that UCK2 was upregulated in multiple pathologic subtypes, such as lung ADC, SCLC, SCC, LCC, large cell neuroendocrine carcinoma, and carcinoid tumor compared to normal lung in GSE30219. Similarly, UCK2 was overexpressed in ADC, SCC, and LCC in GSE19188 (Figure 2C). Furthermore, the Oncomine database analysis showed the same result in SCLC and NSCLC (Figure 2D, Table 1). To corroborate these results, we collected 37 lung cancer samples from Renmin Hospital of Wuhan University and undertook RT‐qPCR to detect the UCK2 expression level. As expected, the results showed that UCK2 was overexpressed in lung tumor tissues compared to adjacent nontumor tissues (P < .001) (Figure 2E,F). In addition, UCK2 was overexpressed in lung cancer cell lines (A549, H1299, and H661) compared to human bronchial epithelial cell BEAS‐2B (Figure 2G). UCK2 was also overexpressed in smokers vs nonsmokers (Figure 2H). In addition, by analyzing patients from GSE30219, patients with or without EGFR mutations all have higher UCK2 expression than normal lung and UCK2 expression was lower in patients with EGFR mutations than in those without (Figure 2I). Furthermore, we undertook IHC staining for UCK2 in cancerous and adjacent tissues of 88 patients with ADC and 74 patients with SCC using tissue microarray. The IHC staining results showed in most patients (ADC and SCC) that UCK2 is overexpressed in lung cancer tissues compared with adjacent tissues (P < .0001) (Figure 3A‐D). For ADC, UCK2 expression levels were high in 79.5% (70/88) tumor samples, whereas only 20.4% (18/88) adjacent tissues showed high expression of UCK2 (Figure 3E). For SCC, UCK2 expression levels were high in 85.1% (63/74) tumor samples, whereas only 14.8% (11/74) adjacent tissues showed high expression of UCK2 (Figure 3F).
Figure 2.
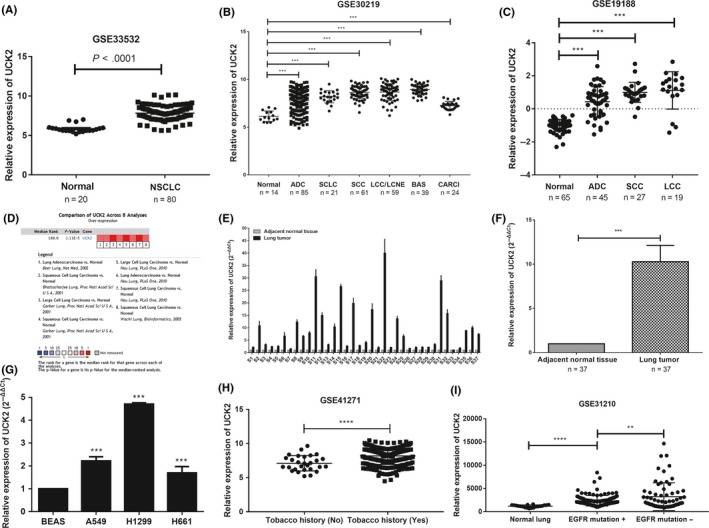
Uridine‐cytidine kinase 2 (UCK2) is overexpressed in lung cancer. A, Analysis of UCK2 expression in normal lung and non‐small cell lung cancer (NSCLC) in GSE33532. ****P < .0001, unpaired t test. B,C, Analysis of UCK2 expression in normal lung and different pathological subtypes of lung cancer in GSE30219. ***P < .001, one‐way ANOVA followed by Dunnett's test. D, Oncomine datasets showing UCK2 expression in lung cancer; red denotes significant overexpression. E,F, UCK2 mRNA expression in 37 lung cancer tissues and adjacent nontumor tissues were explored by real‐time PCR. ***P < .001. G, UCK2 mRNA expression in human bronchial epithelial cell BEAS‐2B and lung cancer cell lines. ***P < .001. H, UCK2 expression in lung cancer patients with and without tobacco smoking history. ****P < .0001. I, UCK2 expression in EGFR‐mutated and EGFR nonmutated lung cancer tissue. **P < .01; ****P < .0001. ADC, adenocarcinoma; BAS, basaloid; CARCI, carcinoid tumor; LCC, large cell carcinoma; LCNE, large cell neuroendocrine tumor; SCC, squamous cell carcinoma; SCLC, small cell lung cancer
Figure 3.
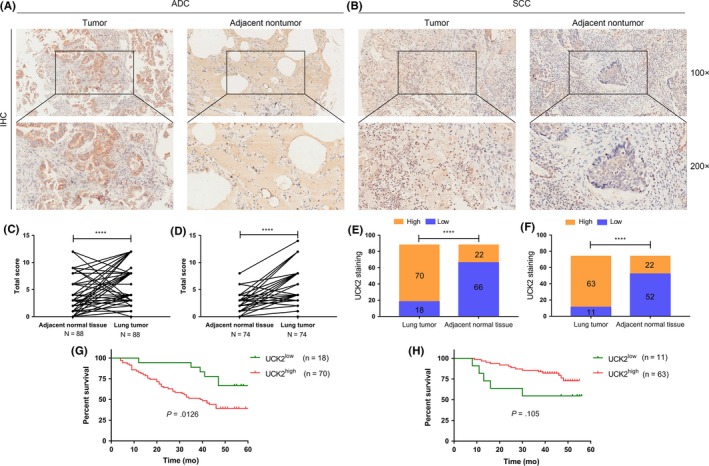
Immunohistochemistry of lung cancer tissues. A,B, Representative images of lung cancer patients by immunohistochemistry (magnification, 100×; 200×). C, Total scores of lung cancer and adjacent nontumor tissues of adenocarcinoma (ADC) patients. D, Total score of lung cancer and adjacent nontumor tissues of squamous cell carcinoma (SCC) patients. E, Plot of the distribution of uridine‐cytidine kinase 2 (UCK2) expression in tumor tissues and adjacent nontumor tissues of ADC patients. F, Plot of the distribution of UCK2 expression in tumor tissues and adjacent non‐tumor tissues of SCC patients. G, Overall survival curves for ADC patients with high (n = 70) and low (n = 18) UCK2 expression. H, Overall survival curves for SCC patients with high (n = 63) and low (n = 11) UCK2 expression. ****P < .0001. IHC, immunohistochemistry
3.3. Diagnostic value of UCK2 in lung cancer
The GEO datasets were used to explore the diagnostic potential of UCK2 in lung cancer. Significant diagnostic accuracy was shown in GSE33532 with AUC = 0.965 (95% CI = 0.9326‐0.9974; P < .0001) (Figure 4A) and GSE30219 with AUC = 0.923 (95% CI = 0.8874‐0.9585; P < .0001) (Figure 4B), which indicated that UCK2 has a high prognostic performance in differentiating lung cancer patients from normal individuals. Furthermore, UCK2 was identified as significantly overexpressed in stage IA lung cancer patients (Figure 4C,D). We isolated the stage IA patients and analyzed the diagnostic value of UCK2. As shown in Figure 4E,F, UCK2 also showed a high diagnostic accuracy in GSE33532 with AUC = 0.9281 (95% CI = 0.8411‐1.015; P < .0001) (Figure 4E) and GSE30219 with AUC = 0.868 (95% CI = 0.8097‐0.9262; P < .0001) (Figure 4F). These results revealed that UCK2 possesses a robust diagnostic potential in early stages of lung cancer.
Figure 4.
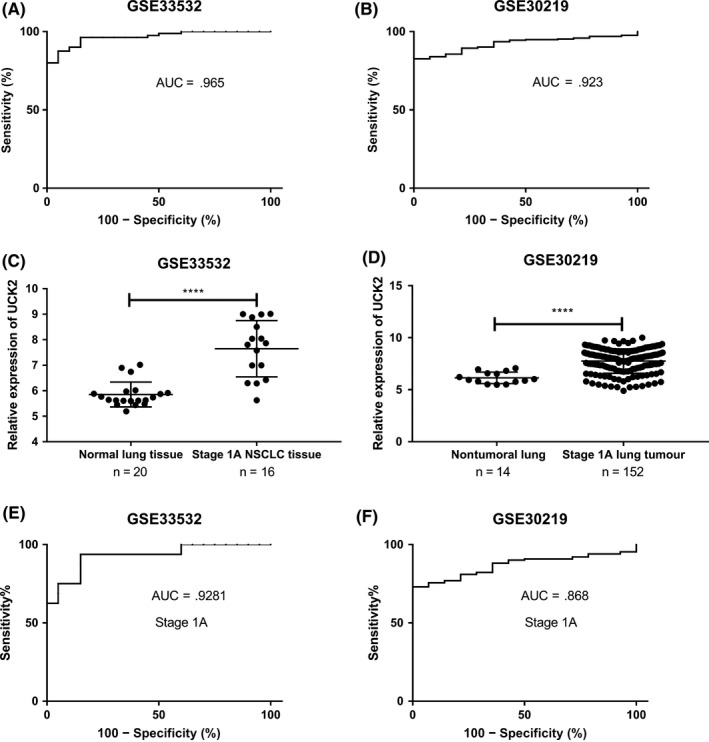
Diagnostic value of uridine‐cytidine kinase 2 (UCK2) in lung cancer. A,B, Receiver operating characteristic plots for all lung cancer patients in GSE33532 (A) and all lung cancer patients in GSE30219 (B). C,D, UCK2 expression in normal lung and stage IA lung cancer in GSE33532 (C) and GSE30219 (D). E,F, Stage IA lung cancer patients in GSE33532 (E) and GSE30219 (F). AUC, area under the receiver operating characteristic curve; NSCLC, non‐small cell lung cancer
3.4. Overexpressed UCK2 was associated with more aggressive clinicopathological features of lung cancer
GSE30219 and GSE41271 were used to investigate whether UCK2 expression was correlated with clinicopathological features of lung cancer. We found higher expression levels of UCK2 significantly contributed to T stage (P = .000), N stage (P = .000), pathological stage (P < .000), and early relapse (all P < .05) (Tables 2 and 3). Moreover, UCK2 was overexpressed in smokers vs non‐smokers (Table 3). These results confirm the correlation between UCK2 and clinicopathological features of lung cancer. To further explore whether different pathological types of lung cancer have the same effect of high UCK2 expression on advanced stage and smoking, we analyzed the association between high UCK2 expression and advanced stage or smoking in ADS and SCC. The results show that high UCK2 expression is closely related to advanced stage and smoking of patients with ADC but not SCC (Tables S5,S6 and Figure S1).
Table 2.
Correlation of uridine‐cytidine kinase 2 (UCK2) expression and clinicopathological characteristics of patients with lung cancer in GSE30219
| Characteristic | No. of patients | UCK2 expression | χ2 value | P value | |
|---|---|---|---|---|---|
| High | Low | ||||
| Age, years | |||||
| ≤55 | 79 | 37 | 42 | 0.481 | .488 |
| >55 | 214 | 110 | 104 | ||
| Gender | |||||
| Male | 250 | 131 | 119 | 3.387 | .066 |
| Female | 43 | 16 | 27 | ||
| T stage | |||||
| IA‐IB | 166 | 63 | 103 | 23.973 | .000 |
| IIA‐IIB | 69 | 42 | 27 | ||
| IIIA‐IIIB, IV | 52 | 38 | 14 | ||
| N stage | |||||
| Negative | 198 | 80 | 118 | 18.922 | .000 |
| Positive | 93 | 63 | 30 | ||
| M stage | |||||
| 0 | 282 | 141 | 141 | 0.115 | .735 |
| 1 | 8 | 5 | 3 | ||
| Early recurrencea | |||||
| No | 164 | 71 | 93 | 7.103 | .008 |
| Yes | 96 | 58 | 38 | ||
| Later recurrencea | |||||
| No | 164 | 71 | 93 | 0.988 | .320 |
| Yes | 18 | 10 | 8 | ||
Using 2 y as the cut‐off, tumor recurrence was classified as either early recurrence or late recurrence.
Table 3.
Correlation of uridine‐cytidine kinase 2 (UCK2) expression and clinicopathological characteristics of patients with lung cancer in GSE41271
| Characteristic | No. of patients | UCK2 expression | χ2 value | P value | |
|---|---|---|---|---|---|
| High | Low | ||||
| Age, years | |||||
| ≤55 | 46 | 22 | 24 | 0.105 | .746 |
| >55 | 228 | 115 | 113 | ||
| Gender | |||||
| Male | 148 | 84 | 64 | 6.172 | .013 |
| Female | 127 | 53 | 74 | ||
| Smoker | |||||
| Non | 28 | 5 | 23 | 12.607 | .000 |
| Yes | 244 | 130 | 114 | ||
| Final stage | |||||
| IA‐IB | 133 | 52 | 81 | 19.883 | .000 |
| IIA‐IIB | 50 | 38 | 12 | ||
| IIIA‐IIIB, IV | 92 | 47 | 45 | ||
| Early recurrencea | |||||
| No | 153 | 69 | 84 | 6.426 | .011 |
| Yes | 94 | 58 | 36 | ||
| Later recurrencea | |||||
| No | 153 | 69 | 84 | 0.606 | .436 |
| Yes | 27 | 10 | 17 | ||
Using 2 y as the cut‐off, tumor recurrence was classified as either early recurrence or late recurrence.
3.5. Higher UCK2 expression predicted poorer survival in lung cancer patients
The Kaplan‐Meier Plotter database was used to explore the prognostic potential of UCK2 in lung cancer. High (top 50%) and low (bottom 50%) UCK2 expression groups were divided according to the median expression of UCK2. We found higher UCK2 expression was closely related to shorter progression free survival for all lung cancer patients (n = 982, HR 1.73 [1.42‐2.1], log rank P = 2.2e‐08) (Figure 5A), especially for ADC patients (n = 461, HR 2.202 [1.47‐2.79], P = 1.1e‐05) (Figure 5B), but not for SCC patients (n = 141, HR 0.9 [0.54‐1.49], P = .67) (Figure 5C). In addition, higher UCK2 expression also predicted a worse OS for all lung cancer patients (n = 1926, HR 1.88 [1.65‐2.14], P < 1e‐16) (Figure 6A), especially for ADC patients (n = 720, HR 2.2 [1.72‐2.81], P = 8.4e‐11) (Figure 6B), but not for SCC patients (n = 524, HR 1.19 [0.94‐1.5], P = .15) (Figure 6C). Furthermore, we found the UCK2 overexpression group showed a poorer OS than the low expression group by analyzing the patients of AJCC T1N0M0 stage (n = 244) (HR 1.81 [1.21‐2.7], P = .0032) (Figure 6D). These findings showed that UCK2 played a crucial role in predicting the prognosis of lung cancer. To confirm this, we undertook a survival analysis of 88 ADC patients and 74 SCC patients and found that high UCK2 expression was associated with poor prognosis of patients with ADC (P = .0126) (Figure 3G) but not SCC (P = .105) (Figure 3H).
Figure 5.
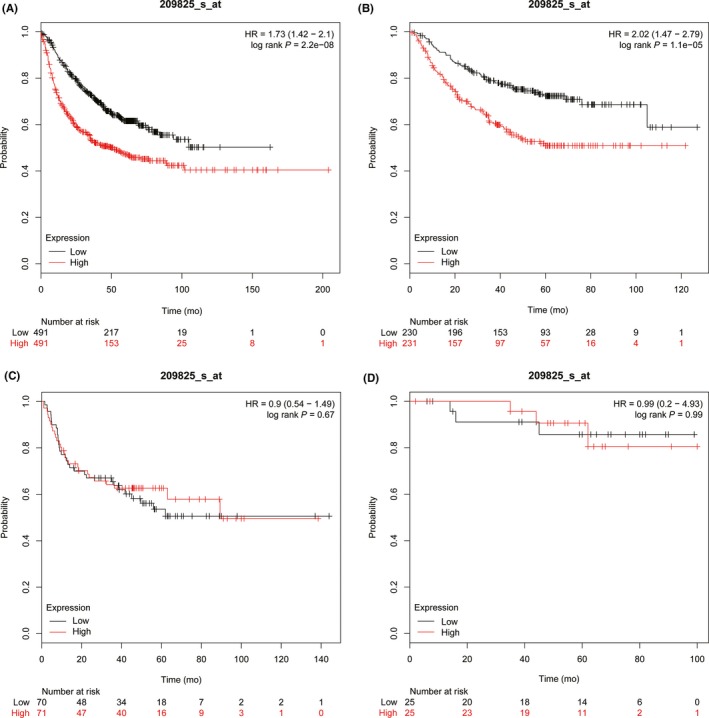
Higher uridine‐cytidine kinase 2 (UCK2) expression predicted poorer first progression survival in lung cancer patients. A, All lung cancer patients (n = 982). B, Adenocarcinoma patients (n = 461). C, Squamous cell carcinoma patients (n = 141). D, AJCC T1N0M0 stage lung cancer patients (n = 50). HR, hazard ratio
Figure 6.
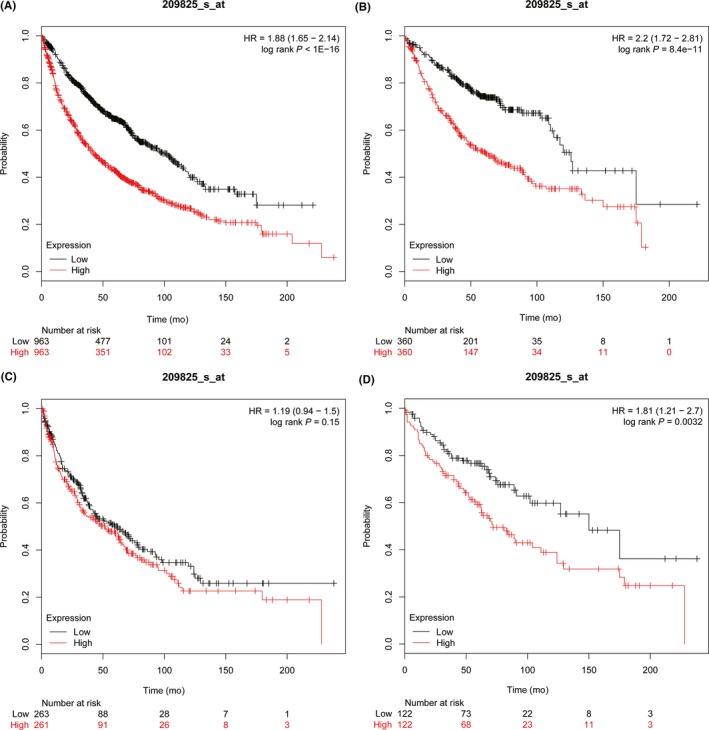
Higher uridine‐cytidine kinase 2 (UCK2) expression predicted poorer overall survival in lung cancer patients. A, All lung cancer patients (n = 1926). B, Adenocarcinoma patients (n = 720). C, Squamous cell carcinoma patients (n = 524). D, AJCC T1N0M0 stage lung cancer patients (n = 244). HR, hazard ratio
3.6. UCK2 expression is an independent predictor for both OS and DFS of lung cancer patients
To investigate whether UCK2 expression could be an independent predictor for OS and DFS of lung cancer patients, univariate and multivariate Cox regression models were established on GSE30219. We found that high expression of UCK2 (HR, 1.819; 95% CI, 1.683‐1.966, P = .000) as well as T stage (HR, 1.787; 95% CI, 1.699‐1.880, P = .000), N stage (HR, 1.858; 95% CI, 1.748‐1.974, P = .000), and M stage (HR, 8.985; 95% CI, 7.505‐10.758, P = .000) were independent predictors for DFS of lung cancer patients (Table 4). In addition, high expression of UCK2 (HR, 1.269; 95% CI, 1.216‐1.325, P = .000) as well as T stage (HR, 1.676; 95% CI, 1.625‐1.730, P = .000) and M stage (HR, 4.926; 95% CI, 4.207‐5.768, P = .000) were independent predictors for OS of lung cancer patients (Table 5).
Table 4.
Univariate and multivariate analyses of clinicopathological parameters and UCK2 expression on disease‐free survival for lung cancer patients in the GSE30219 dataset
| Variable | Univariate analysis | Multivariate analysis | ||
|---|---|---|---|---|
| HR (95% CI) | P value | HR (95% CI) | P value | |
| T stage | ||||
| T1 vs T2 vs T3 vs T4 | 2.564 (2.469‐2.663) | .000 | 1.787 (1.699‐1.880) | .000 |
| N status | ||||
| N0 vs N1 vs N2 vs N3 | 2.537 (2.432‐2.647) | .000 | 1.858 (1.748‐1.974) | .000 |
| M stage | ||||
| M0 vs M1 | 11.746 (9.966‐13.844) | .000 | 8.985 (7.505‐10.758) | .000 |
| UCK2 expression | ||||
| High vs low | 2.267 (2.112‐2.434) | .000 | 1.819 (1.683‐1.966) | .000 |
Abbreviations: CI, confidence interval; HR, hazard ratio.
Table 5.
Univariate and multivariate analyses of clinicopathological parameters and UCK2 expression on overall survival for lung patients in the GSE30219 dataset
| Variables | Univariate analysis | Multivariate analysis | ||
|---|---|---|---|---|
| HR (95% CI) | P value | HR (95% CI) | P value | |
| T stage | ||||
| T1 vs T2 vs T3 vs T4 | 1.759 (1.718‐1.800) | .000 | 1.676 (1.625‐1.730) | .000 |
| N status | ||||
| N0 vs N1 vs N2 vs N3 | 1.544 (1.496‐1.593) | .000 | 1.024 (0.981‐1.069) | .276 |
| M stage | ||||
| M0 vs M1 | 6.883 (5.960‐7.949) | .000 | 4.926 (4.207‐5.768) | .000 |
| UCK2 expression | ||||
| High vs low | 1.508 (1.447‐1.572) | .000 | 1.269 (1.216‐1.325) | .000 |
Abbreviations: CI, confidence interval; HR, hazard ratio.
3.7. Knockdown of UCK2 suppressed proliferation and migration of lung cancer cells
To explore the effect of UCK2 on the function of lung cancer cells, we constructed UCK2 stable knockdown lung cancer cell lines A549 ShRNA UCK2‐1 and A549 ShRNA UCK2‐2. We then used CCK‐8 and wound healing assays to investigate the effect of UCK2 on the proliferative and migratory function of lung cancer cells. The results show that knockdown of UCK2 can suppress the proliferation and migration ability of lung cancer cells (Figure 7).
Figure 7.
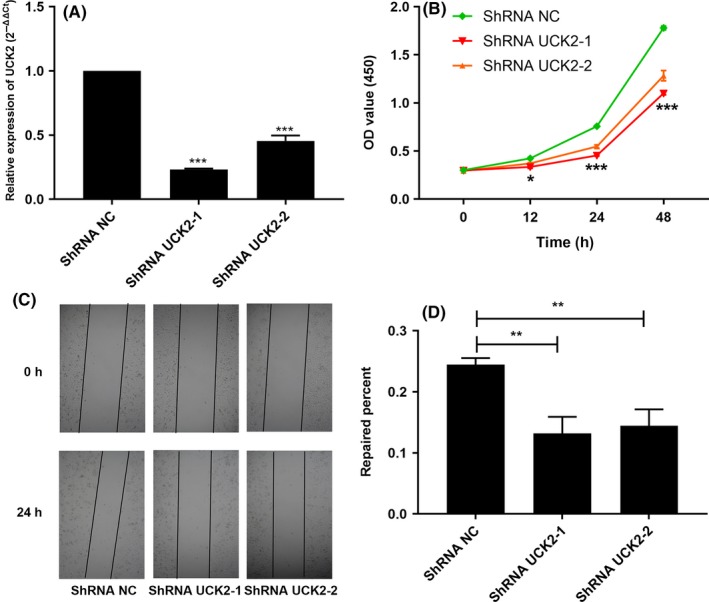
Knockdown of uridine‐cytidine kinase 2 (UCK2) suppressed proliferation and migration of lung cancer cells. A, RT‐qPCR analysis of cells with UCK2 knockdown. B, Knockdown of UCK2 suppressed proliferation of lung cancer cells indicated by CCK‐8 assay. C,D, Knockdown of UCK2 suppressed migration of lung cancer cells as indicated by wound healing assays. **P < .01, ***P < .001. NC, normal control; OD, optical density
3.8. Molecular mechanisms of UCK2 in lung cancer
Gene set enrichment analysis on the GSE33532 dataset was used to gain mechanistic insights of UCK2 in lung cancer. Table 6 listed the top 20 relevant biological processes (nominal P value less than .05 and FDR less than .25). High (top 50%) and low (bottom 50%) UCK2 expression groups were divided according to the median expression of UCK2. The results showed that cell cycle G2/M checkpoint, DNA repair, and mitotic spindle process as well as MTOR1 signaling, MYC, and E2F targets were enriched in the UCK2 highly expressed group, which indicated that UCK2 might participate in the proliferation of lung cancer cells and be targeted by MYC and E2F genes (Figure 8, Table 6).
Table 6.
Enrichment of biological processes in the UCK2 high expression group
| No. | GS details | Size | ES | NES | NOM P‐val | FDR q‐val |
|---|---|---|---|---|---|---|
| 1 | UNFOLDED_PROTEIN_RESPONSE | 103 | 0.504 | 1.707 | .002 | .101 |
| 2 | MYC_TARGETS_V1 | 171 | 0.608 | 1.663 | .004 | .089 |
| 3 | MTORC1_SIGNALING | 181 | 0.543 | 1.644 | .009 | .074 |
| 4 | MYC_TARGETS_V2 | 46 | 0.682 | 1.611 | .008 | .079 |
| 5 | MITOTIC_SPINDLE | 181 | 0.514 | 1.607 | .006 | .066 |
| 6 | DNA_REPAIR | 139 | 0.419 | 1.543 | .048 | .099 |
| 7 | G2M_CHECKPOINT | 170 | 0.756 | 1.521 | .000 | .106 |
| 8 | E2F_TARGETS | 166 | 0.766 | 1.466 | .008 | .149 |
| 9 | SPERMATOGENESIS | 80 | 0.574 | 1.455 | .019 | .144 |
| 10 | GLYCOLYSIS | 173 | 0.483 | 1.325 | .125 | .312 |
| 11 | PI3K_AKT_MTOR_SIGNALING | 94 | 0.313 | 1.273 | .182 | .373 |
| 12 | ESTROGEN_RESPONSE_LATE | 185 | 0.394 | 1.248 | .074 | .385 |
| 13 | UV_RESPONSE_UP | 142 | 0.290 | 1.000 | .448 | .839 |
| 14 | KRAS_SIGNALING_DN | 111 | 0.330 | 0.947 | .556 | .894 |
| 15 | OXIDATIVE_PHOSPHORYLATION | 183 | 0.231 | 0.942 | .517 | .847 |
| 16 | REACTIVE_OXIGEN_SPECIES_PATHWAY | 44 | 0.303 | 0.893 | .573 | .898 |
| 17 | P53_PATHWAY | 177 | 0.239 | 0.811 | .744 | 1.000 |
| 18 | PEROXISOME | 83 | 0.214 | 0.797 | .865 | .978 |
| 19 | HYPOXIA | 171 | 0.236 | 0.743 | .882 | 1.000 |
| 20 | EPITHELIAL_MESENCHYMAL_TRANSITION | 188 | 0.330 | 0.743 | .762 | .966 |
Statistical data were performed by GSEA software.
Abbreviations: ES, enrichment score; FDR q‐val, false discovery rate q value; NES, normal enrichment score; NOM p‐val, nominal P‐value.
Figure 8.

Uridine‐cytidine kinase 2 (UCK2) enriched cell cycle G2/M checkpoint, DNA repair, mitotic spindle process, MTOR1 signaling, MYC, and E2F targets in lung cancer. The role of UCK2 in biological processes was investigated by gene set enrichment analysis on the GSE33532 dataset with functional gene set files (c5.all.v5.1.symbols.gmt). UCK2 high expression enriched (A) G2/M checkpoint, (B) DNA repair, (C) mitotic spindle, (D) MTOR1 signaling, (E) MYC targets, (F) E2F targets. FDR, false discovery rate; NES, normal enrichment score
4. DISCUSSION
Lung cancer is a major cause of cancer‐related deaths globally.27, 28 Diagnosis at an advanced stage reduces the chances of complete surgical resection. Therefore, early detection of lung cancer is considered a potential solution.
In the current study, we documented the elevated expression of UCK2 in lung cancer, especially in lung cancer tissue of stage IA vs normal lung tissue. According to the ROC curve results, UCK2 possesses promising diagnostic potential in distinguishing lung cancer patients from healthy individuals, revealing the potential of UCK2 for the early diagnosis of lung cancer.
Lung cancer prognosis assessment is widely based on the TNM staging system, but clinical outcomes indicate that early stage lung cancer patients receiving surgical management are still at high risk of recurrence.5 While analyzing AJCC T1N0M0 stage patients, we observed that the upregulation of UCK2 resulted in poorer OS and DFS, indicating the significant role of UCK2 in the prognosis of lung cancer patients, which was confirmed by microarray assay. Moreover, the elevated expression of UCK2 was closely related with higher T stage and N stage and a higher likelihood of relapse of lung cancer, which implied that UCK2 has significant potential for prognosis monitoring. In addition, Zhou et al26 found that UCK2 could promote metastasis of hepatocellular carcinoma cells, speculating the implication of UCK2 in lung cancer metastasis. GEO31210 analysis showed a higher UCK2 expression level in EGFR‐nonmutated group compared to the EGFR‐mutated group. Lung ADC with EGFR‐activating mutations responded well to gefitinib.29 UCK2 could act as a candidate drug target site in EGFR‐nonmutated lung cancer patients. Long‐term smoking contributes to approximately 85% of lung cancer30; approximately 10%‐15% of cases are found in non‐smokers.31 Patients with smoking history had higher UCK2 expression than those with no smoking history, revealed by analysis of GEO41271, thus predicting that smoking could facilitate the expression of UCK2. Further analysis of the effect of high expression of UCK2 on smoking in lung ADC and lung SCC showed that high UCK2 expression was closely related to smoking in ADC patients but not SCC patients.
Gene set enrichment analysis results based on GEO33532 found that UCK2 overexpression augmented cellular processes, such as the cell cycle G2/M checkpoint, DNA repair, and mitotic spindle process, deciphering the proliferative role of UCK2 in lung cancer. Moreover, the UCK2 overexpression group also showed enrichment of MTOR1 signaling, MYC, and E2F target, showing that UCK2 might work by participating in the MTOR1 signaling pathway or being targeted by MYC or E2F genes.
In cytology experiments, we found that knockdown of UCK2 could suppress the proliferation and migration of lung cancer cells.
In conclusion, this study indicates the promising potential of UCK2 in the diagnosis and prognosis of lung cancer. At present, we do not know the molecular mechanism by which the high expression of UCK2 results in the pathogenesis of lung cancer. To this end, detailed pathway analysis would reveal the function of UCK2 in lung cancer.
DISCLOSURE
The authors have no conflict of interest.
Supporting information
ACKNOWLEDGMENTS
This study was supported by the National Natural Science Foundation of China (Grant Nos. 81770180 and 81801954) and Hubei Provincial Natural Science Fund for Creative Research Groups (2018CFA018).
Wu Y, Jamal M, Xie T, et al. Uridine‐cytidine kinase 2 (UCK2): A potential diagnostic and prognostic biomarker for lung cancer. Cancer Sci. 2019;110:2734–2747. 10.1111/cas.14125
Contributor Information
Songping Xie, Email: songping0428@126.com.
Qiuping Zhang, Email: qpzhang@whu.edu.cn.
REFERENCES
- 1. Chen W, Zheng R, Baade PD, et al. Cancer statistics in China, 2015. CA Cancer J Clin. 2016;66:115‐132. [DOI] [PubMed] [Google Scholar]
- 2. Hirsch FR, Scagliotti GV, Mulshine JL, et al. Lung cancer: current therapies and new targeted treatments. Lancet. 2017;389:299‐311. [DOI] [PubMed] [Google Scholar]
- 3. Siegel RL, Miller KD, Jemal A. Cancer statistics, 2017. CA Cancer J Clin. 2017;67:7‐30. [DOI] [PubMed] [Google Scholar]
- 4. Konings R, van Gool MH, Bard MP, et al. Prognostic value of pre‐operative glucose‐corrected maximum standardized uptake value in patients with non‐small cell lung cancer after complete surgical resection and 5‐year follow‐up. Ann Nucl Med. 2016;30:362‐368. [DOI] [PubMed] [Google Scholar]
- 5. Beer DG, Kardia SL, Huang CC, et al. Gene‐expression profiles predict survival of patients with lung adenocarcinoma. Nat Med. 2002;8:816‐824. [DOI] [PubMed] [Google Scholar]
- 6. Niu L, Song X, Wang N, Xue L, Song X, Xie L. Tumor‐derived exosomal proteins as diagnostic biomarkers in non‐small cell lung cancer. Cancer Sci. 2019;110:433‐442. [DOI] [PMC free article] [PubMed] [Google Scholar]
- 7. Schumacher FR, Wang Z, Skotheim RI, et al. Testicular germ cell tumor susceptibility associated with the UCK2 locus on chromosome 1q23. Hum Mol Genet. 2013;22:2748‐2753. [DOI] [PMC free article] [PubMed] [Google Scholar]
- 8. Appleby TC, Larson G, Cheney IW, et al. Structure of human uridine‐cytidine kinase 2 determined by SIRAS using a rotating‐anode X‐ray generator and a single samarium derivative. Acta Crystallogr D Biol Crystallogr. 2005;61:278‐284. [DOI] [PubMed] [Google Scholar]
- 9. Tomoike F, Nakagawa N, Fukui K, Yano T, Kuramitsu S, Masui R. Indispensable residue for uridine binding in the uridine‐cytidine kinase family. Biochem Biophys Rep. 2017;11:93‐98. [DOI] [PMC free article] [PubMed] [Google Scholar]
- 10. Connolly GP, Duley JA. Uridine and its nucleotides: biological actions, therapeutic potentials. Trends Pharmacol Sci. 1999;20:218‐225. [DOI] [PubMed] [Google Scholar]
- 11. Van Rompay AR, Norda A, Linden K, Johansson M, Karlsson A. Phosphorylation of uridine and cytidine nucleoside analogs by two human uridine‐cytidine kinases. Mol Pharmacol. 2001;59:1181‐1186. [DOI] [PubMed] [Google Scholar]
- 12. Anderson EP, Brockman RW. Feedback inhibition of uridine kinase by cytidine triphosphate and uridine triphosphate. Biochem Biophys Acta. 1964;91:380‐386. [DOI] [PubMed] [Google Scholar]
- 13. Lane AN, Fan TW. Regulation of mammalian nucleotide metabolism and biosynthesis. Nucleic Acids Res. 2015;43:2466‐2485. [DOI] [PMC free article] [PubMed] [Google Scholar]
- 14. Shimamoto Y, Koizumi K, Okabe H, et al. Sensitivity of human cancer cells to the new anticancer ribo‐nucleoside TAS‐106 is correlated with expression of uridine‐cytidine kinase 2. Jpn J Cancer Res. 2002;93:825‐833. [DOI] [PMC free article] [PubMed] [Google Scholar]
- 15. Muhale FA, Wetmore BA, Thomas RS, McLeod HL. Systems pharmacology assessment of the 5‐fluorouracil pathway. Pharmacogenomics. 2011;12:341‐350. [DOI] [PMC free article] [PubMed] [Google Scholar]
- 16. Murata D, Endo Y, Obata T, et al. A crucial role of uridine/cytidine kinase 2 in antitumor activity of 3′‐ethynyl nucleosides. Drug Metab Dispos. 2004;32:1178‐1182. [DOI] [PubMed] [Google Scholar]
- 17. Koizumi K, Shimamoto Y, Azuma A, et al. Cloning and expression of uridine/cytidine kinase cDNA from human fibrosarcoma cells. Int J Mol Med. 2001;8:273‐278. [PubMed] [Google Scholar]
- 18. Sato A, Takano T, Hiramoto A, et al. Role of the uridine/cytidine kinase 2 mutation in cellular sensitiveness toward 3′‐ethynylcytidine treatment of human cancer cells. Anticancer Drugs. 2017;28:781‐786. [DOI] [PubMed] [Google Scholar]
- 19. Kang GJ, Cooney DA, Moyer JD, et al. Cyclopentenylcytosine triphosphate. Formation and inhibition of CTP synthetase. J Biol Chem. 1989;264:713‐718. [PubMed] [Google Scholar]
- 20. Malami I, Abdul AB, Abdullah R, et al. Correction: crude extracts, flavokawain B and alpinetin compounds from the rhizome of alpinia mutica induce cell death via UCK2 enzyme inhibition and in turn reduce 18S rRNA biosynthesis in HT‐29 cells. PLoS ONE. 2017;12:e0173651. [DOI] [PMC free article] [PubMed] [Google Scholar]
- 21. van Kuilenburg AB, Meinsma R. The pivotal role of uridine‐cytidine kinases in pyrimidine metabolism and activation of cytotoxic nucleoside analogues in neuroblastoma. Biochem Biophys Acta. 2016;1862:1504‐1512. [DOI] [PubMed] [Google Scholar]
- 22. Xu SG, Yan PJ, Shao ZM. Differential proteomic analysis of a highly metastatic variant of human breast cancer cells using two‐dimensional differential gel electrophoresis. J Cancer Res Clin Oncol. 2010;136:1545‐1556. [DOI] [PMC free article] [PubMed] [Google Scholar]
- 23. Shen G, He P, Mao Y, et al. Overexpression of uridine‐cytidine kinase 2 correlates with breast cancer progression and poor prognosis. J Breast Cancer. 2017;20:132‐141. [DOI] [PMC free article] [PubMed] [Google Scholar]
- 24. Yu S, Li X, Guo X, Zhang H, Qin R, Wang M. UCK2 upregulation might serve as an indicator of unfavorable prognosis of hepatocellular carcinoma. IUBMB Life. 2019;71:105‐112. [DOI] [PubMed] [Google Scholar]
- 25. Huang S, Li J, Tam NL, et al. Uridine‐cytidine kinase 2 upregulation predicts poor prognosis of hepatocellular carcinoma and is associated with cancer aggressiveness. Mol Carcinog. 2019;58:603‐615. [DOI] [PubMed] [Google Scholar]
- 26. Zhou Q, Jiang H, Zhang J, et al. Uridine‐cytidine kinase 2 promotes metastasis of hepatocellular carcinoma cells via the Stat3 pathway. Cancer Manag Res. 2018;10:6339‐6355. [DOI] [PMC free article] [PubMed] [Google Scholar]
- 27. Jemal A, Siegel R, Xu J, Ward E. Cancer statistics, 2010. CA Cancer J Clin. 2010;60:277‐300. [DOI] [PubMed] [Google Scholar]
- 28. Jemal A, Bray F, Center MM, Ferlay J, Ward E, Forman D. Global cancer statistics. CA Cancer J Clin. 2011;61:69‐90. [DOI] [PubMed] [Google Scholar]
- 29. Bhattacharjee A, Richards WG, Staunton J, et al. Classification of human lung carcinomas by mRNA expression profiling reveals distinct adenocarcinoma subclasses. Proc Natl Acad Sci USA. 2001;98:13790‐13795. [DOI] [PMC free article] [PubMed] [Google Scholar]
- 30. Rahal Z, El Nemr S, Sinjab A, Chami H, Tfayli A, Kadara H. Smoking and lung cancer: a geo‐regional perspective. Front Oncol. 2017;7:194. [DOI] [PMC free article] [PubMed] [Google Scholar]
- 31. Thun MJ, Hannan LM, Adams‐Campbell LL, et al. Lung cancer occurrence in never‐smokers: an analysis of 13 cohorts and 22 cancer registry studies. PLoS Med. 2008;5:e185. [DOI] [PMC free article] [PubMed] [Google Scholar]
- 32. Hou J, Aerts J, den Hamer B, et al. Gene expression-based classification of non-small cell lung carcinomas and survival prediction. PloS one. 2010;5:e10312. [DOI] [PMC free article] [PubMed] [Google Scholar]
- 33. Garber ME, Troyanskaya OG, Schluens K, et al. Diversity of gene expression in adenocarcinoma of the lung. Proc Natl Acad Sci USA. 2001;98:13784–13789. [DOI] [PMC free article] [PubMed] [Google Scholar]
- 34. Wachi S, Yoneda K, Wu R. Interactome-transcriptome analysis reveals the high centrality of genes differentially expressed in lung cancer tissues. Bioinformatics (Oxford, England). 2005;21:4205–4208. [DOI] [PMC free article] [PubMed] [Google Scholar]
Associated Data
This section collects any data citations, data availability statements, or supplementary materials included in this article.
Supplementary Materials


