Abstract
4‐Hydroxynonenal (HNE) is an important product of plasma membrane lipid peroxidation, which is a cause of cell and tissue injury. Mitochondrial DNA (mtDNA)‐depleted ρ0 cells were established using human cervical cancer and oral squamous cell carcinoma cell lines. We investigated the effect of reactive oxygen species in ρ0 cells, especially the mechanism of hydrogen peroxide (H2O2)‐mediated cell death. These cell were subjected to high oxidative stress and, compared with their parental cells, showed greater sensitivity to H2O2 and high lipid peroxidation. Upregulation of HNE in the plasma membrane was observed prior to the increase in intracellular H2O2. The amount of oxidized lipid present changed H2O2 permeability and administration of oxidized lipid led to further cell death after treatment with H2O2. Expression levels of lipoxygenase ALOX genes (ie ALOX5, ALOX12, and ALOX15) were upregulated in ρ0 cells, as were expression levels of ALOX12 and ALOX15 proteins. ALOX5 protein was mainly distributed in the nucleus, while ALOX12 and ALOX15 proteins were distributed in the nucleus and the cytoplasm. Although expression of COX2 gene was upregulated, its protein expression did not increase. ALOX (especially ALOX15) may be involved in the sensitivity of cancer cells to treatment. These data offer promise for the development of novel anticancer agents by altering the oxidation state of the plasma membrane. Our results showed that lipid peroxidation status is important for H2O2 sensitivity and that ALOX15 is involved in lipid peroxidation status.
Keywords: cell membrane, hydrogen peroxide, lipid peroxidation, mitochondria, oxidative stress
Abbreviations
- •OH
hydroxyl radical
- ALOX
lipoxygenase
- COX
cyclooxygenase
- DOPC
1,2‐dioleoyl‐sn‐glycero‐3‐phosphocholine
- H2O2
hydrogen peroxide
- HNE
4‐Hydroxynonenal
- HPF
Hydroxyphenyl fluorescein
- MIC
microscope observation
- NDGA
nordihydroguaiaretic acid
- PINK1
PTEN‐induced kinase 1
- POVPC
1‐palmitoyl‐2‐(5′‐oxo‐valeroyl)‐sn‐glycero‐3‐phosphocholine
- ROS
Reactive oxygen species
- RT
radiation therapy
1. INTRODUCTION
ROS are defined as chemically reactive species containing oxygen, some of which are peroxidases or hydroxyl radicals. ROS production is effective in the chemotherapy and RT of cancer.1, 2, 3 Numerous chemicals can produce ROS than affect cancer cells4, 5, 6, 7, 8 and some of these are under investigation in clinical trials.9 Some ROS, for example H2O2, are used as sensitizers of cancer cells by producing reactive oxygen during RT.10, 11 Similarly, ROS are produced by nicotinamide adenine dinucleotide phosphate (NADPH) oxidase in the cytoplasm.12 However, the main source of ROS may be the mitochondrial electron transport chain through oxidative phosphorylation.13, 14 Mitochondrial DNA (mtDNA) encodes 13 proteins that are components of the mitochondrial electron transport chain. Damage to mtDNA results in increased production of ROS, conversely causing neurodegenerative diseases and various types of cancer.15, 16 Therefore, these mtDNA‐damaged cells may be valuable models for studying ROS‐related disease. Mitochondrial DNA devoid ρ0 cells were established from a human cervical cancer cell line (HeLa) and from an oral squamous cell carcinoma (SAS). These ρ0 cells were sensitive to ROS, in particular H2O2.17 Notably, yeast ρ0 cells have also shown sensitivity to treatment with H2O2.18 Recently, ρ0 cells from osteosarcoma and lung carcinoma have shown sensitivity to X‐ray irradiation related to oxidative stress.19 Conversely, there are several studies reporting that ρ0 cells are resistant to oxidative stress, especially to radiation. ρ0 cells from human fibroblasts have shown resistance to γ‐irradiation by decreasing apoptosis.20 In addition, ρ0 cells from the human pancreatic tumor MiaPaCa‐2 cell line showed resistance to X‐ray irradiation via activation of cyclin B1.21 Moreover, ρ0 cells from healthy human bronchial epithelial cells have shown resistance to oxidative stress. At present, the sensitivity or resistance of ρ0 cells to oxidative stress and the stress response mechanism involved in these processes have not been fully elucidated.
ROS react with polyunsaturated fatty acids in the lipid membranes, inducing lipid peroxidation that leads to cell death. HNE, the end product of lipid peroxidation reacts with low‐molecular‐weight compounds (eg, glutathione, proteins, and DNA), and is considered a second messenger of oxidative stress.22, 23 Notably, HNE production occurs through the ROS generation and an enzymatic process.24 The key enzyme in the production of HNE is ALOX15. The relationship between the level of HNE and ALOX15 has been previously reported.25 It has also been reported HNE induces expression of the COX2 gene.26 However, so far, the relationship between ρ0 cells and ALOXs and/or COX2 has not been investigated.
Moreover, the mechanism of sensitivity to H2O2 in ρ0 cells via oxidation of the plasma membrane has not been elucidated. In this study, we investigated the oxidation state of the plasma membrane in ρ0 cells, and identified factors that control this process.
2. MATERIALS AND METHODS
2.1. Cell culture
Human cancer cell lines HeLa and SAS were obtained from the Cell Resource Center for Biomedical Research, Institute of Development, Aging and Cancer, Tohoku University (Sendai, Japan). ρ0 cells were established through culture in RPMI1640 (Wako Pure Chemical Industries Ltd., Osaka, Japan) containing 5% FBS (Gibco Invitrogen Corp., Carlsbad, CA, USA), 50 ng/mL ethidium bromide (Nacalai Tesque Inc., Kyoto, Japan), 50 μg/mL uridine (Sigma‐Aldrich, St Louis, MO, USA), and 110 μg/mL sodium pyruvate (Sigma‐Aldrich) for 3‐4 wk.17 Cells were maintained in RPMI 1640 supplemented with 10% FBS, 50 μg/mL uridine, and 110 μg/mL sodium pyruvate in a humidified atmosphere at 37°C with 5% carbon dioxide. Exponentially growing cells were used in all experiments.
2.2. Relative levels of internal H2O2
Internal H2O2 was visualized using HYDROP™ (Goryo Chemical Inc., Hokkaido, Japan) as previously described.17 Briefly, cells in glass‐bottomed dishes (Matsunami Glass Ind., Ltd., Osaka, Japan) were cultured in RPMI 1640 with or without 50 μmol/L H2O2 for 10 min, 30 min, 1 h, and 2 h. The cultured cells were washed with noncontaining H2O2 RPMI 1640 twice to remove the H2O2 from the medium, and subjected to treatment with 2.5 μmol/L HYDROP™ in RPMI 1640 at 37ºC for 20 min. Subsequently, the cells were washed with RPMI 1640 twice, and fluorescence images were obtained using a BZ‐8000 fluorescence microscope (Keyence Corporation, Osaka, Japan). The ImageJ software (Rasband, W.S., ImageJ, U.S. National Institutes of Health, Bethesda, Maryland, USA, http://rsb.info.nih.gov/ij/, 1997‐2012) was used to measure fluorescence intensity.
2.3. Intracellular intake of H2O2 using a stable isotope
A H2O2 18O2 solution (Sigma‐Aldrich) was used to measure the intracellular intake of H2O2. Cells were subjected to treatment with 50 μmol/L H2O2 18O2 solution for 1 h. After treatment, the cells were washed with phosphate‐buffered saline (PBS) three times. Following the wash, the cells were collected and dried using an FDU‐2200 freeze dryer (Tokyo Rikakikai Co. Ltd., Tokyo, Japan) for 3 h. Dried samples were sent for analysis to Taiyo Nippon Sanso Corporation (Tokyo, Japan). The levels of 18O2 in treated cells were measured using stable isotope‐ratio mass spectrometry. The results are shown as delta ‰ compared with the standard mean ocean water (18Oδ SMOW ‰).
2.4. Immunofluorescence
Cells were cultured in glass‐bottomed dishes using RPMI 1640 with or without 50 μmol/L H2O2 for 1 and 2 h. Subsequently, the cells were fixed with 4% formaldehyde in PBS for 30 min, and rinsed three times with PBS. Plasma membranes were permeabilized by incubation in 95% ethanol with 5% acetic acid for 10 min. After washing five times with PBS, cells were incubated for 30 min in blocking solution (5% skimmed milk in PBS‐T; PBS with 0.05% Tween 20). The primary antibodies (incubated at 4°C overnight) were mouse anti‐HNE (1:200 dilution; Japan institute for the control of aging, Shizuoka, Japan), rabbit anti‐PINK1, anti‐aquaporin11, anti‐ALOX5, anti‐ALOX12, and anti‐ALOX15 antibodies (Novus Biologicals, Centennial, CO, USA: BC100‐494; ABGENT San Diego, CA, USA: AP58056; Abcam, Cambridge, UK: ab169755, ab211506, and ab80221; 1:1000 dilution), mouse anti‐COX1 (Abcam: ab695; 1:500 dilution), and rabbit anti‐COX2 (Abcam: ab15191; 1:100 dilution). The secondary antibodies (1:200 dilution, incubated at room temperature for 1 h) were the Alexa Fluor 488 goat anti‐mouse IgG and Alexa Fluor 568 goat anti‐rabbit IgG (Thermo Fisher Scientific, Waltham, MA, USA: A11001, and A11011). For staining the nuclei, cells were incubated with DAPI (0.5 μg/mL) at room temperature for 10 min. A BZ‐8000 fluorescence microscope was used to obtain fluorescence images, and the ImageJ software was used to measure fluorescence intensity.
2.5. Liposome assay
Liposomes containing luminol and horseradish peroxidase (HRP) were prepared as follows: DOPC (Avanti Polar Lipids Inc., Albaster, AL, USA) and POVPC (Avanti Polar Lipids Inc.) were dissolved in chloroform (1 mg/mL) and mixed together. The dissolved lipids were dried to remove the chloroform. Subsequently, the mixture was added to 50 mmol/L Tris‐HCl (pH 8.6) buffer containing 10 mmol/L luminol (Nacalai Tesque Inc.: 20751‐34) and 100 μmol/L HRP (Wako Pure Chemical Industries Ltd.: 169‐10791) and was then sonicated The diameter of the prepared liposomes was calculated via the Dynamic Light Scattering method using ELS‐Z2M (Otsuka Electronics Co. Ltd., Osaka, Japan). Subsequently, 8.8 mmol/L H2O2 were administered to the liposomes, and luminescence was observed using a luminometer (JASCO, Tokyo, Japan: FP‐6300). Passage of H2O2 through the liposome membrane resulted in luminol reaction, producing blue luminescence.
2.6. Administration of oxidized lipid
POVPC (12.5‐50 μmol/L) was administered to the cultured medium using the ethanol injection method.27, 28 This lipid has been shown to localize to the plasma membrane.27, 28 After 10 min (SAS) or 30 min (HeLa) of treatment, POVPC was removed, and the cells were treated with 25 μmol/L H2O2 for 48 h. After administration of POVPC and H2O2, cell survival was analyzed using the CCK‐8 assay kit (Dojindo Molecular Technologies, Inc., Kumamoto, Japan), as previously described.17
2.7. Quantitative PCR
Total RNA was extracted using ISOGEN (Nippon Gene, Toyama, Japan), and reverse transcription was performed as previously described.17 cDNA equivalent to 1 ng of total RNA was used for the Quantitative PCR (qPCR). The reactions were performed with Step One Plus (Applied Biosystems; Foster City, CA, USA) using THUNDERBIRD® qPCR Mix (TOYOBO, Osaka, Japan). β‐actin was used as the loading control. For the amplification of genes, one cycle of denaturation (95°C for 10 min) was performed, followed by 40 cycles of amplification (95°C for 10 s and 60°C for 60 s). Each experiment was performed in triplicate. Table 1 lists the primer sequences used in this experiment.
Table 1.
Primer sequences
| Primer name | Primer sequence |
|---|---|
| ALOX5 F | 5′‐CTGGGCATGTACCCAGAAGAGCATTTTAT‐3′ |
| ALOX5 R | 5′‐ACAAGTAGTAATATGGCAGCTGCTTCTTCT‐3′ |
| ALOX12 F | 5′‐TTCAAATGGCCATCTCATGGCATCTGAGT‐3′ |
| ALOX12 R | 5′‐ATCTGTTCGGAATTGGTTTAGCACAGCTTT‐3′ |
| ALOX15 F | 5′‐ATCTATCGGTATGTGGAAGGAATCGTGAGT‐3′ |
| ALOX15 R | 5′‐TAAAGAGACAGGAAACCCTCGGTCCT‐3′ |
| COX1 F | 5′‐AATCCCATCTGTTCTCCGGAGTACTG‐3′ |
| COX1 R | 5′‐GAAACGTAGGGACAGGTCTTGGTGTT‐3′ |
| COX2 F | 5′‐TGGAGCACCATTCTCCTTGAAAGGACTTAT‐3′ |
| COX2 R | 5′‐GACTGTTTTAATGAGCTCTGGATCTGGAAC‐3′ |
| β‐Actin F | 5′‐AGAGCTACGAGCTGCCTGAC‐3′ |
| β‐Actin R | 5′‐AGCACTGTGTTGGCGTACAG‐3′ |
2.8. Western blotting
Each cell lysate (30 μg per lane) was subjected to SDS‐PAGE under reduced conditions using a 10% or 15% polyacrylamide gel. The proteins were subsequently blotted on a PVDF membrane. After blocking with blocking buffer (3% skimmed milk in TBS‐T; TBS with 0.05% Tween 20, for ALOX12 antibody and 5% skimmed milk in PBS‐T for the other primary antibodies), the blotted membranes were incubated with primary antibodies (rabbit anti‐ALOX5, anti‐ALOX12, anti‐ALOX15, mouse anti‐COX1, rabbit anti‐COX2; Abcam: ab169755, ab211506, ab80221, ab695, and ab15191, rabbit anti‐Akt, pAktT308, pAktS473, FOXO1, pGSK3βS9: Cell Signaling Technology, Danvers, MA, USA: #4691, #13038, #4060, #2880, #5558, mouse anti‐BCL2, Bax; Santa Cruz Biotechnology, San Diego, CA, USA: SC‐7382, SC‐7480) in blocking buffer at 4ºC overnight. After five washes with TBS‐T (ALOX12 antibody) or PBS‐T (other antibodies), the membranes were incubated with peroxidase‐conjugated anti‐rabbit IgG antibody or anti‐mouse IgG antibodies (GE Healthcare UK Ltd., Amersham Place, England) at room temperature for 2 h. Immunoreactive proteins were visualized with ECL prime (GE Healthcare) using ChemiDoc XRS Plus (BIO‐RAD Laboratories, Inc., Hercules, CA, USA). An anti‐β‐actin antibody (Novus Biologicals LLC, Centennial, CO, USA; NB100‐56874) was used as loading control. The dilution factor for all antibodies was 1:1000. Table 2 represents the mean and standard error of the mean (SEM) of three independent ρ0/parent intensity ratios after normalization against β‐actin.
Table 2.
Relative levels of protein expression in HeLa and SAS ρ0/parent cells (n = 3)
| ρ0/parent | SEM | |
|---|---|---|
| ALOX5 | ||
| HeLa | 0.61 | .16 |
| SAS | 0.61 | .01 |
| ALOX12 | ||
| HeLa | 1.51 | .14 |
| SAS | 1.24 | .05 |
| ALOX15 | ||
| HeLa | 1.42 | .04 |
| SAS | 1.24 | .05 |
| COX1 | ||
| HeLa | 1.14 | .01 |
| SAS | 1.08 | .05 |
| COX2 | ||
| HeLa | 0.53 | .14 |
| SAS | 0.36 | .05 |
| Akt | ||
| HeLa | 0.87 | .07 |
| SAS | 1.00 | .01 |
| pAktT308 | ||
| HeLa | 0.64 | .13 |
| SAS | 0.49 | .20 |
| pAktS473 | ||
| HeLa | 0.52 | .17 |
| SAS | 0.63 | .14 |
| FOXO1 | ||
| HeLa | 1.44 | .17 |
| SAS | 1.28 | .07 |
| GSK3βS9 | ||
| HeLa | 0.71 | .11 |
| SAS | 0.72 | .16 |
| BCL2 | ||
| HeLa | 0.78 | .00 |
| SAS | 0.67 | .11 |
| Bax | ||
| HeLa | 1.88 | .04 |
| SAS | 1.31 | .01 |
2.9. ALOX inhibitor assay
Cells were treated with 10 μmol/L caffeic acid (Nacalai Tesque Inc.), the ALOX5 inhibitor, or 10 μmol/L NDGA (Sigma‐Aldrich), the nonspecific ALOXs inhibitor, at 37ºC for 10 min. After removal of the inhibitor‐containing medium, the cells were treated with 50 μmol/L H2O2 for 1 h. HYDROP™ and HNE antibody were used as described above to detect internal H2O2 or HNE.
2.10. Detection of OH using HPF
Internal levels of ・OH were detected using HPF (Goryo Chemical Inc.) according to the protocol provided by the manufacturer with slight modification. HPF (10 μmol/L) with MIC buffer (130 mmol/L sodium chloride, 5.3 mmol/L potassium chloride, 0.8 mmol/L magnesium sulfate, 1 mmol/L disodium phosphate, 2 mmol/L glucose, 20 mmol/L HEPES, 1 mmol/L sodium pyruvate, 2.5 mmol/L sodium bicarbonate, 1 mmol/L ascorbic acid, 1.5 mmol/L calcium chloride, and 1.5 mg/mL bovine serum albumin (BSA)) was added to the cells in glass‐bottomed dishes. After incubation at 37°C for 15 min, the HPF with MIC buffer was replaced with new MIC buffer. Images were obtained using a BZ‐8000 fluorescence microscope. Nuclei were counterstained with DAPI as described above.
2.11. Statistical analysis
One‐way analysis of variance with Scheffe's F test was performed for the water‐soluble tetrazolium assay and ALOX inhibitor experiment. All other statistical analyses were performed using Student's t test. A P < .05 denoted statistical significance. The results were expressed as means ± SEM.
3. RESULTS
3.1. Relative levels of internal H2O2 and intake of H2O2
After treatment for 1 h, the internal levels of H2O2 were increased only in ρ0 vs parental cells (Figure 1A). The results obtained from the treatment with 18O2‐labeled H2O2 showed that the intake of H2O2 in ρ0 cells was significantly higher than that observed in parental cells after treatment with H2O2 for 1 h (Figure 1B).
Figure 1.
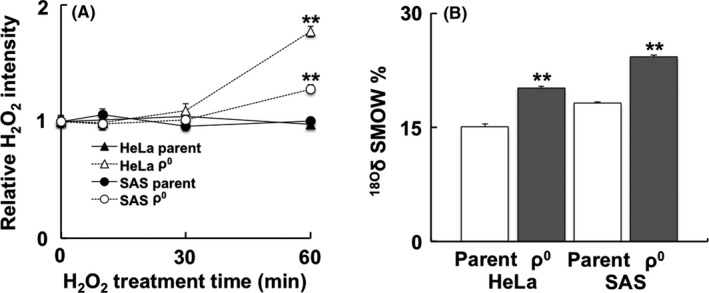
Internal levels of H2O2 and intracellular intake of H2O2 in ρ0 cells. A, Temporal change of H2O2 after treatment with H2O2 in ρ0 and parental cells using HYDROP™. In ρ0 cells, the relative H2O2 intensity was increased after treatment with H2O2 for 1 h. B, The intracellular intake of H2O2 was detected using a stable isotope. Cells were subjected to 50 μmol/L of H2O2 18O2 solution, and the content of 18O2 was measured using stable isotope‐ratio mass spectrometry. In ρ0 cells, the intake of H2O2 was significantly higher than that observed in parental cells after treatment. The results are expressed as the mean ± SEM. **P < .01 using Student's t test
3.2. Timing of increase in lipid peroxidation and internal levels of H2O2
Significantly higher intensity was observed in ρ0 cells (Figure 2A, B). Co‐staining with PINK1 (localized in mitochondria) and aquaporin 11 (localized in the plasma membrane) revealed that HNE was mainly localized in the plasma membrane (Figure 2C, D). Moreover, temporal change of lipid peroxidation was observed to investigate the timing of this process after treatment with H2O2 (Figure 2E). Lipid peroxidation was increased 1 h after treatment (Figure 2E, F), whereas the internal levels of H2O2 were increased in parental cells 2 h after treatment (Figure 2F).
Figure 2.
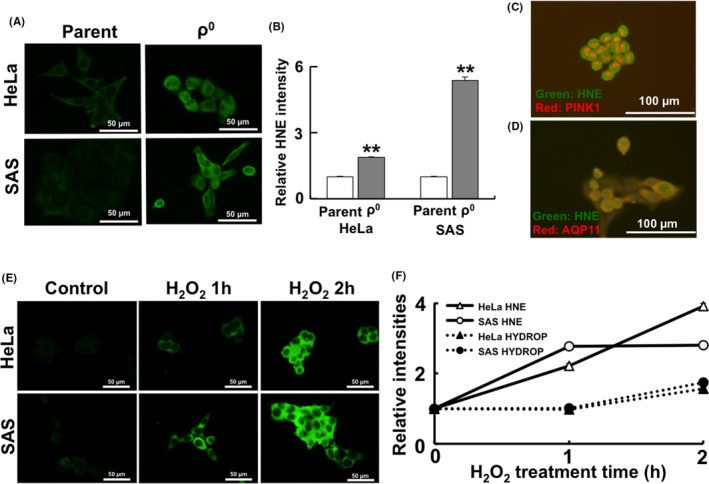
Timing of increase in lipid peroxidation and internal H2O2 levels. A, Immunofluorescence images of 4‐hydroxynonenal (HNE). B, Relative HNE intensity. (C, D) HNE staining with PINK1 (localized in the mitochondria, C) and AQP11 (localized in the plasma membrane, D). HNE was mainly co‐localized with AQP11 that is present in the plasma membrane. E, Immunofluorescence images of HNE in HeLa and SAS parental cells after treatment with H2O2. F, Timing of lipid peroxidation and internal H2O2 levels. The results are expressed as the mean ± SEM. **P < .01 using Student's t test
3.3. H2O2 permeability using liposome and administration of oxidized lipid
We prepared liposomes encapsulating luminol and HRP to quantify the permeation of H2O2. Representative phospholipids of the plasma membrane (ie, DOPC and oxidized lipid POVPC) were used in this model. Internal levels of H2O2 can be detected as luminescence of luminol catalyzed by HRP (Figure 3A). The intensity of luminescence was increased following the administration of H2O2. Differential DOPC/POVPC ratio liposomes were prepared to investigate changes in H2O2 permeability. Maximum H2O2 transport appeared in the presence of several (2‐4) mol% of POVPC (Figure 3B). The POVPC administration experiment was conducted to confirm whether administration of this oxidized lipid led to cell death. The results showed that the administration of 12.5 μmol/L POVPC significantly increased the sensitivity of HeLa and SAS parental cells to H2O2. However, a higher concentration of POVPC did not induce a similar increase in sensitivity to H2O2 (Figure 3C). Furthermore, administration of different concentrations of POVPC revealed that the relationship between cell viability and POVPC concentration did not show a linear concentration‐dependent pattern. However, it showed a reverse bell shape, with the lowest viability in HeLa and SAS parental cells observed after the administration of 12.5 μmol/L POVPC (Figure 3D). In contrast, administration of 12.5 μmol/L POVPC did not increase sensitivity to H2O2. The relationship between cell viability and the concentration of POVPC showed a linear concentration‐dependent pattern in HeLa and SAS ρ0 cells that contained more oxidized lipid before treatment (Figure 3E, F).
Figure 3.
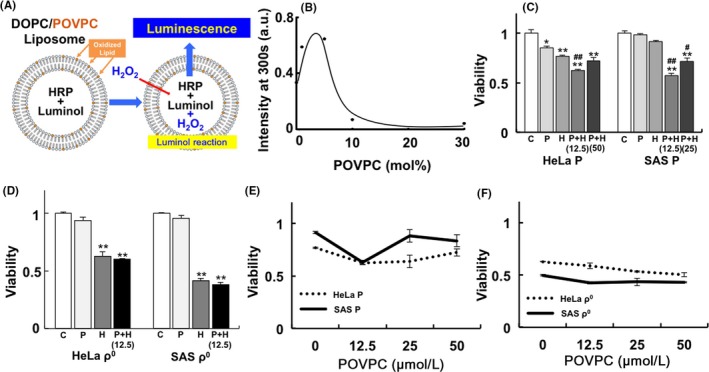
H2O2 permeability using liposome and administration of oxidized lipid. A, Structure of the liposome. The representative phospholipids of the plasma membrane (ie, 1,2‐dioleoyl‐sn‐glycero‐3‐phosphocholine (DOPC) and oxidized lipid 1‐palmitoyl‐2‐(5′‐oxo‐valeroyl)‐sn‐glycero‐3‐phosphocholine (POVPC)) were used. B, Effect of the oxidized lipid ratio to the H2O2 permeability of the liposome. Up to several (2‐4) mol%, the administration of oxidized lipid increased H2O2 permeability. C, D, Administration of oxidized lipid in HeLa and SAS parental (C) or ρ0 (D) cells before H2O2 treatment. The numbers in parentheses represent the concentration of POVPC (μmol/L). E, F, Effect of the concentration of POVPC on the viability of HeLa and SAS parental (E) or ρ0 (F) cells before H2O2 treatment (25 μmol/L). The results are expressed as the mean ± SEM. *P < .05, **P < .01 using Scheffe's F test (vs control), # P < .05, ## P < .01 using Scheffe's F test (vs treatment with H2O2). C: control, P: treatment with POVPC (12.5 μmol/L), H: treatment with H2O2 (25 μmol/L for 48 h), P+H: treatment with H2O2 after treatment with POVPC
3.4. Gene expression and protein expression of ALOX
Gene expression of ALOX5, ALOX12, and ALOX15 – involved in lipid peroxidation of the plasma membrane – was upregulated in ρ0 cells (Figure 4A: ALOX5, 4B: ALOX12, and 4C: ALOX15). In addition, protein expression of ALOX12 and ALOX15, unlike that of ALOX5, was upregulated in both HeLa and SAS ρ0 cells (Figure 4D and Table 2). Investigation of spatial distribution showed that the ALOX12 and ALOX15 proteins were distributed in the nucleus and cytoplasm. Conversely, the ALOX5 protein was distributed only in the nucleus (Figure S1). A semiquantitative analysis of immunofluorescence revealed that the relative expression of the ALOX12 and ALOX15 proteins was upregulated in ρ0 cells (Figure 5A, C: ALOX12, Figure 5B, D: ALOX15).
Figure 4.
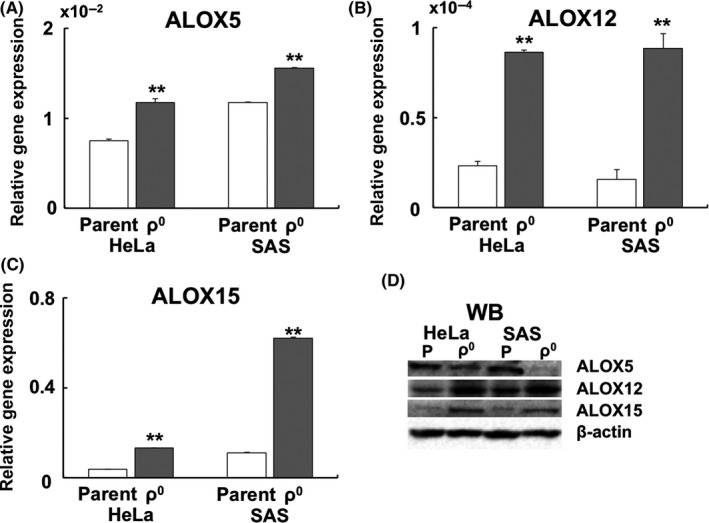
Expression of the ALOX gene and protein in ρ0 cells. A, Expression of the ALOX5 gene. B, Expression of the ALOX12 gene. C, Expression of the ALOX15 gene. The results are expressed as the mean ± SEM. **P < .01 using Student's t test. D, Western blotting of ALOX5, ALOX12, and ALOX15. Unlike ALOX5, the expression of ALOX12 and ALOX15 was upregulated in HeLa and SAS ρ0 cells
Figure 5.
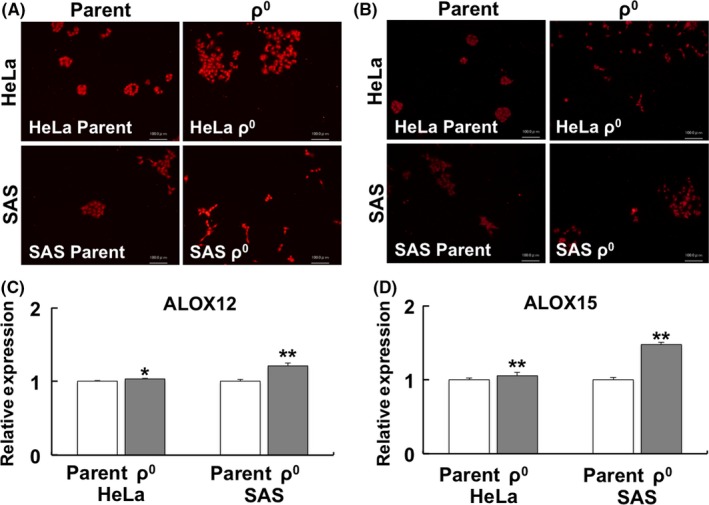
Immunofluorescence of ALOX12 and ALOX15. A, B, Spatial distribution of ALOX12 (A) and ALOX15 (B). C, D, Relative expression of ALOX12 (C) and ALOX15 (D). The results are expressed as the mean ± SEM. *P < .05, **P < .01 using Student's t test
3.5. Inhibition of ALOX
Treatment with 10 μmol/L caffeic acid (ALOX‐5 inhibitor) or 10 μmol/L NDGA (universal ALOX inhibitor) was performed before treatment with H2O2 to investigate the effect of ALOX on the levels of internal H2O2 or HNE. The results showed that, unlike caffeic acid, NDGA significantly inhibited the levels of internal H2O2 and lipid peroxidation (Figure 6).
Figure 6.
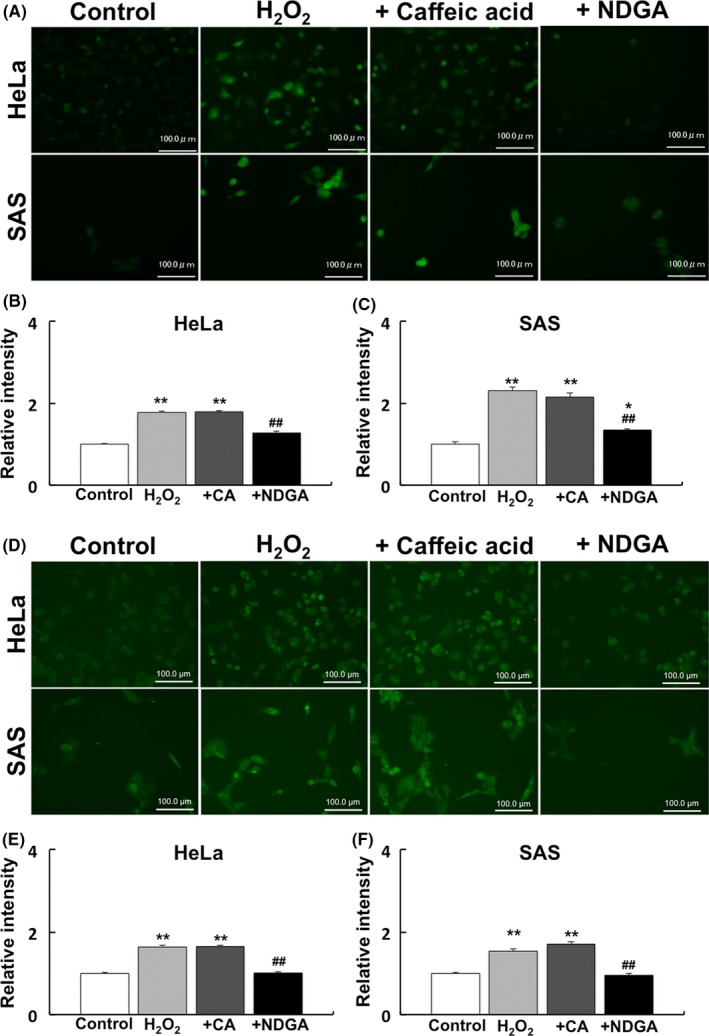
Effect of ALOX inhibitor on internal H2O2 and lipid peroxidation. Treatment with 10 μmol/L caffeic acid (ALOX‐5 inhibitor) or 10 μmol/L nordihydroguaiaretic acid (NDGA) (universal ALOX inhibitor) was performed to investigate their effect on internal H2O2 and lipid peroxidation. A, Immunofluorescence images of internal H2O2. B, C, Relative intensity of internal H2O2 in HeLa (B) and SAS cells (C). D, Immunofluorescence images of 4‐hydroxynonenal (HNE). E, F, Relative intensity of internal H2O2 in HeLa (E) and SAS (F) cells. Control: no treatment. H2O2: treatment with 50 μmol/L H2O2. +CA: treatment with 10 μmol/L caffeic acid before treatment with 50 μmol/L H2O2. +NDGA: treatment with 10 μmol/L NDGA before treatment with 50 μmol/L H2O2. The results are expressed as the mean ± SEM.*P < .05, **P < .01 using Scheffe's F test (vs control), ## P < .01 using Scheffe's F test (vs treatment with H2O2)
3.6. Gene and protein expressions of COX
Expression of the COX1 gene was downregulated in SAS ρ0 cells (Figure 7A). Conversely, expression of the COX2 gene was significantly upregulated in HeLa and SAS ρ0 cells (Figure 7B). Protein expression of COX1 did not change significantly between parental and ρ0 cells, whereas that of COX2 was downregulated in ρ0 cells (Figure 7C and Table 2). Immunofluorescence of COX revealed that COX1 was mainly localized in the nucleus, whereas COX2 was mainly localized in the cytoplasm (Figure 7D).
Figure 7.
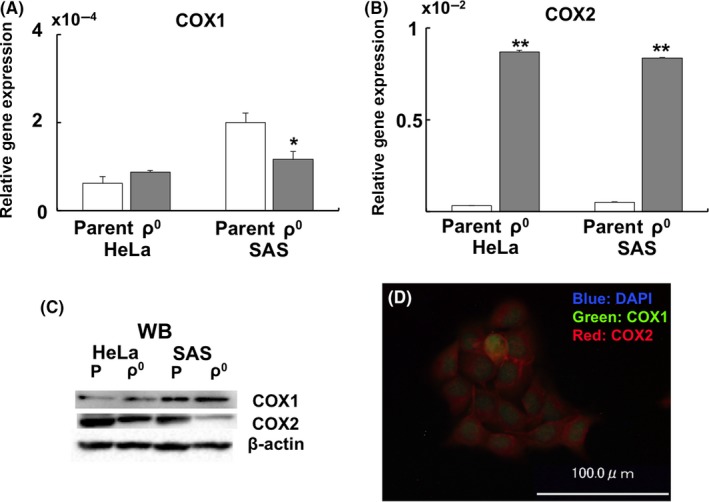
Gene and protein expression of COX. A, Relative gene expression of COX1. B, Relative gene expression of COX2. C, Western blotting of COX1 and COX2. D, Spatial distribution of COX1 (green) and COX2 (red) in SAS parent cells. The results are expressed as the mean ± SEM. *P < .05, **P < .01 using Student's t test
3.7. Phosphorylation of Akt and protein expressions involved in apoptosis
Phosphorylation of Akt, which inhibits apoptosis and regulates cell proliferation, was investigated using western blotting. This analysis revealed a marked decrease in Akt phosphorylation in ρ0 cells (Figure 8 and Table 2). Expression of Akt downstream proteins was also investigated. Expression of FOXO1, which is downregulated by Akt phosphorylation and inhibited apoptosis, was increased. Moreover, pGSK3βS9, which is the inactivated form of GSK3β, was decreased in ρ0 cells. Expression of the anti‐apoptotic protein BCL2 was decreased, whereas expression of the apoptosis‐inducing protein Bax was increased in ρ0 cells (Figure 8 and Table 2).
Figure 8.
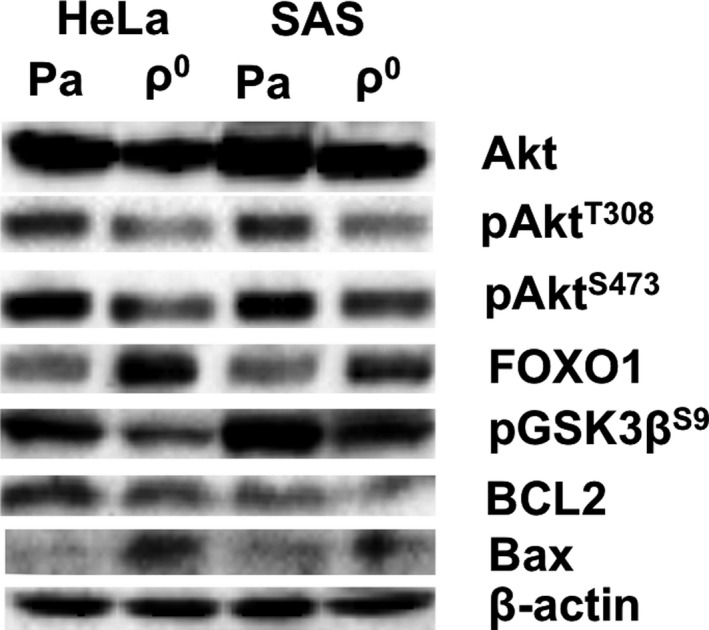
Downregulation of Akt phosphorylation and promotion of apoptosis signaling in ρ0 cells. Western blots of Akt, pAktT308, pAktS473, FOXO1, pGSK3βS9, BCL2, Bax, and β‐actin are shown. Downregulation of Akt phosphorylation was observed in both HeLa and SAS ρ0 cells. The expression of apoptosis‐promoting proteins (FOXO1 and Bax) was upregulated, whereas that of apoptosis‐inhibiting proteins (pGSK3βS9 and BCL2) was downregulated
4. DISCUSSION
The present results indicated that the susceptibility of ρ0 cells to H2O2 may be attributed to an increase in the levels of intracellular ROS due to peroxidation of the plasma membrane. ρ0 cells from osteosarcomas have previously shown sensitivity to X‐ray irradiation and produced more ROS from mitochondria than their parental cells.14, 19 Similarly, lung carcinoma ρ0 cells have shown sensitivity to X‐ray irradiation by decreasing the expression of CuZn‐SOD.19 Conversely, ρ0 cells may be resistant to oxidative stress; and ρ0 cells from GM701 and BEAS‐2B have shown resistance to irradiation.19, 20 Additionally, GM701 ρ0 and BEAS‐2B ρ0 cells have shown resistance through inhibition of apoptosis and reduction of DNA damage, respectively. However, in these cell lines, intracellular levels of ROS were not determined. Therefore, it remained unknown whether ρ0 cells exhibited resistance to ROS, such as H2O2. Collectively, the increased production of internal ROS via oxidative stress may lead to increased cell death in ρ0 cells.
In our study, liposome membrane experiments showed that the content of oxidized lipid in liposomes increased H2O2 permeability by at least several (2‐4) mol% (Figure 3A, B). Administration of oxidized lipid to HeLa and SAS parent cells produced a decrease in cell viability following treatment with H2O2 (Figure 3C, D). The reduced cell viability induced by 12.5 μmol/L POVPC may reflect the results of the liposome experiments. As shown in Figure 3B, the highest uptake of H2O2 was caused at a POVPC concentration of several (2‐4) mol%, and administration of 12.5 μmol/L POVPC (Figure 3D) induced marked cell damage. In contrast, the administration of oxidized lipid did not affect cell viability following treatment with H2O2 in ρ0 cells, in which lipid peroxidation was enhanced (Figure 3E, F). From these results, the concentration of the oxidized lipids was thought to influence H2O2 permeability and viability. However, administration of oxidized lipids to parental cells whose plasma membrane was not highly oxidized, is effective in inducing cell death after treatment with H2O2. Recently, it was reported that the density of phospholipids in the plasma membrane is involved in the efficiency of membrane permeability (ie, uptake of ions or low‐molecular‐weight substances, such as H2O2).29 The results of our liposome experiment are in accordance with those findings reported by a recent study,29 suggesting that different densities of POVPC influence H2O2 membrane permeability. Uptake of H2O2 may be largely related to changes in the plasma membrane itself, rather than the presence of functional proteins on the membrane (ie, aquaporins) that are involved in the permeation of H2O2 into the cell.30, 31, 32, 33
In HeLa and SAS ρ0 cells, lipid peroxidation in the plasma membrane was higher than that observed in parental cells. The following three factors may be involved in lipid peroxidation and cell death: (a) downregulation of the antioxidant enzymes; (b) upregulation of the endogenous levels of ROS; and (c) upregulation of intracellular oxidase. It has been reported that catalase activity and expression of the Mn‐SOD gene were upregulated in ρ0 cells. In addition, expression of the GPx1 gene was downregulated in SAS ρ0 cells, whereas it was upregulated in HeLa ρ0 cells.17 In osteosarcoma, rhabdomyosarcoma, and lung ρ0 cells, glutathione peroxidase activity and the expression levels of the Mn‐SOD and CuZn‐SOD genes were upregulated. However, expression of the CuZn‐SOD protein in osteosarcoma ρ0 cells was downregulated.34 These results suggested that antioxidant enzymes are not the main factors involved in lipid peroxidation in ρ0 cells. It has been reported that the levels of superoxide from the mitochondria are decreased in ρ0 cells.35
Moreover, it has been reported that the administration of HNE leads to increased levels of internal ROS using 2′,7′‐dichlorodihydrofluorescein diacetate in parental cells. However, the levels of internal ROS in ρ0 cells did not increase significantly.36 Our data showed that the levels of HNE and ・OH were increased in ρ0 cells (Figures 2 and S2). Currently, the involvement of mitochondria‐derived ROS in lipid peroxidation of the plasma membrane in ρ0 cells remains unknown. It has been reported that an increase in ・OH from the mitochondria was detected in osteosarcoma ρ0 cells.14 Additionally, it has been reported that ・OH in cells was involved in the initiation of lipid peroxidation.37 Moreover, H2O2 reportedly produced ・OH in the presence of ferrous ion, leading to lipid peroxidation and cell death.38 These results indicated a positive correlation between the levels of ・OH and lipid peroxidation of the plasma membrane in ρ0 cells.
The expression of ALOX12 and ALOX15 (mRNA and protein levels) and COX2 was upregulated in ρ0 cells (Figure 4, 5, 6, 7). ALOX15 produces 13‐hydroxyoctadecadienoic acid, which is a precursor of HNE from linoleic acid.39 Inhibition of ALOX 12 and 15, unlike ALOX5, resulted in the downregulation of HNE and H2O2 permeability in ρ0 cells (Figure 6). Moreover, overexpression of ALOX15 enhanced erastin and RAS‐selective lethal compound 3‐induced ferroptosis, an iron‐dependent cell death via activation of the HNE.40 Furthermore, LOX15 reportedly plays a central role in the initiation and execution of ferroptosis.41 These results suggested that the expression of internal oxidative enzymes is more important than that of antioxidative enzymes for lipid oxidation in ρ0 cells. Additionally, ALOX15 plays an important role in the peroxidation of the plasma membrane in ρ0 cells. To date, there is no evidence showing that COX2 directly peroxidizes lipids and produces HNE. However, it has been reported that HNE induces the expression of the COX2 gene, and that this expression is stabilized by the p38 mitogen‐activated protein kinase.42 In addition, COX2 has been reported to be involved in PI3K/Akt signaling.43 Recently, it was reported that administration of HNE decreased Akt phosphorylation and induced apoptosis in an osteosarcoma cell line.44 These findings indicated a strong relationship between lipid peroxidation and intracellular signal pathways (eg, Akt signaling). It has been shown that phosphorylation of Akt was downregulated in HeLa ρ0 cells.45 Our results showed that Akt phosphorylation was downregulated in both types of ρ0 cells (Figure 8). Moreover, an apoptosis‐promoting signal was activated in ρ0 cells (Figure 8 and Table 2). These results indicated that the downregulation of Akt phosphorylation promoted cell death (ie, apoptosis and/or ferroptosis) in ρ0 cells via upregulation of COX2.
In conclusion, the sensitivity of ρ0 cells to treatment with H2O2 may be due to peroxidation of the plasma membrane, leading to increases in H2O2 permeability and cell death. Moreover, alterations in the state of the membrane may change the susceptibility of cells to drugs. These findings offer promise for the development of novel anticancer drugs, altering the oxidation state of the plasma membrane. Such drugs may be helpful in overcoming resistance to RT and drug therapy in cells.
CONFLICT OF INTEREST
The authors declare that there is no conflict of interest.
Supporting information
ACKNOWLEDGMENTS
This work was supported by a Grant from the Kodama Memorial Fund for Medical Research to KT and JSPS KAKENHI (Grant‐in Aid for Scientific Research C: no. 16K11513 to KT; 16K00538 to YK). The authors would like to thank Enago (www.enago.jp) for English language review.
Tomita K, Takashi Y, Ouchi Y, et al. Lipid peroxidation increases hydrogen peroxide permeability leading to cell death in cancer cell lines that lack mtDNA. Cancer Sci. 2019;110:2856–2866. 10.1111/cas.14132
Tomita and Takashi are contributed equally to this work.
REFERENCES
- 1. Zou Z, Chang H, Li H, et al. Induction of reactive oxygen species: an emerging approach for cancer therapy. Apoptosis. 2017;22:1321‐1335. [DOI] [PubMed] [Google Scholar]
- 2. Dong J, Liu B, Zhu R. Targeting ROS for cancer therapy. Chemo Open Access. 2016;5:2. [Google Scholar]
- 3. Tarlovsky VF. Role of antioxidants in cancer therapy. Nutrition. 2013;29:15‐21. [DOI] [PubMed] [Google Scholar]
- 4. Tada‐Oikawa S, Oikawa S, Kawanishi M, et al. Generation of hydrogen peroxide precedes loss of mitochondrial membrane potential during DNA alkylation‐induced apoptosis. FEBS Lett. 1999;442:65‐69. [DOI] [PubMed] [Google Scholar]
- 5. Varbiro G, Veres B, Gallyas F Jr, et al. Direct effect of Taxol on free radical formation and mitochondrial permeability transition. Free Radic Biol Med. 2001;31:548‐558. [DOI] [PubMed] [Google Scholar]
- 6. Murata M, Suzuki T, Midorikawa K, et al. Oxidative DNA damage induced by a hydroperoxide derivative of cyclophosphamide. Free Radic Biol Med. 2004;37:793‐802. [DOI] [PubMed] [Google Scholar]
- 7. Magda D, Miller RA. Motexafin gadolinium: a novel redox active drug for cancer therapy. Semin Cancer Biol. 2006;16:466‐476. [DOI] [PubMed] [Google Scholar]
- 8. Alexandre J, Nicco C, Chéreau C, et al. Improvement of the therapeutic index of anticancer drugs by the superoxide dismutase mimics mangafodipir. J Natl Cancer Inst. 2006;98:236‐244. [DOI] [PubMed] [Google Scholar]
- 9. Trachootham D, Alexandre J, Huang P. Targeting cancer cells by ROS‐mediated mechanisms: a radical therapeutic approach? Nat Rev Drug Discov. 2009;8:579‐591. [DOI] [PubMed] [Google Scholar]
- 10. Fang Y, Moore BJ, Bai Q, et al. Hydrogen peroxide enhances radiation‐induced apoptosis and inhibition of melanoma cell proliferation. Anticancer Res. 2013;33:1799‐1807. [PubMed] [Google Scholar]
- 11. Kariya S, Sawada K, Kobayashi T, et al. Combination treatment of hydrogen peroxide and X‐rays induces apoptosis in human prostate cancer PC‐3 cells. Int J Radiat Oncol Biol Phys. 2009;75:449‐454. [DOI] [PubMed] [Google Scholar]
- 12. Forman HJ, Torres M. Reactive oxygen species and cell signaling: respiratory burst in macrophage signaling. Am J Respir Crit Care Med. 2002;166:S4‐S8. [DOI] [PubMed] [Google Scholar]
- 13. Ogura A, Oowada S, Kon Y, et al. Redox regulation in radiation‐induced cytochrome c release from mitochondria of human lung carcinoma A549 cells. Cancer Lett. 2009;277:64e71. [DOI] [PubMed] [Google Scholar]
- 14. Indo HP, Davidson M, Yen H‐C, et al. Evidence of ROS generation by mitochondria in cells with impaired electron transport chain and mitochondrial DNA damage. Mitochondrion. 2007;7:106‐118. [DOI] [PubMed] [Google Scholar]
- 15. Chatterjee A, Mambo E, Sidransky D. Mitochondrial DNA mutations in human cancer. Oncogene. 2006;25:4663‐4674. [DOI] [PubMed] [Google Scholar]
- 16. Lin MT, Beal MF. Mitochondrial dysfunction and oxidative stress in neurodegenerative diseases. Nature. 2006;443:787‐795. [DOI] [PubMed] [Google Scholar]
- 17. Tomita K, Kuwahara Y, Takashi Y, et al. Sensitivity of mitochondrial DNA depleted ρ0 cells to H2O2 depends on the plasma membrane status. Biochem Biophys Res Commun. 2017;490:330‐335. [DOI] [PubMed] [Google Scholar]
- 18. Grant CM, MacIver FH, Dawes IW. Mitochondrial function is required for resistance to oxidative stress in the yeast Saccharomyces cerevisiae. FEBS Lett. 1997;410:219‐222. [DOI] [PubMed] [Google Scholar]
- 19. van Gisbergen MW, Voets AM, Biemans R, et al. Distinct radiation responses after in vitro mtDNA depletion are potentially related to oxidative stress. PLoS ONE. 2017;12:e0182508. [DOI] [PMC free article] [PubMed] [Google Scholar]
- 20. Tang JT, Yamazaki H, Inoue T, et al. Mitochondrial DNA influences radiation sensitivity and induction of apoptosis in human fibroblasts. Anticancer Res. 1999;19:4959‐4964. [PubMed] [Google Scholar]
- 21. Cloos CR, Daniels DH, Kalen A, et al. Mitochondrial DNA depletion induces radioresistance by suppressing G2 checkpoint activation in human pancreatic cancer cells. Radiat Res. 2009;171:581‐587. [DOI] [PMC free article] [PubMed] [Google Scholar]
- 22. Esterbauer H, Schaur RJ, Zollner H. Chemistry and biochemistry of 4‐hydroxynonenal, malonaldehyde and related aldehydes. Free Radic Biol Med. 1991;11:81‐128. [DOI] [PubMed] [Google Scholar]
- 23. Uchida K. 4‐Hydroxy‐2‐nonenal: a product and mediator of oxidative stress. Progress Lipid Res. 2003;42:318‐343. [DOI] [PubMed] [Google Scholar]
- 24. Ayala A, Muñoz MF, Argüelles S. Lipid peroxidation: production, metabolism, and signaling mechanisms of malondialdehyde and 4‐hydroxy‐2‐nonenal. Oxid Med Cell Longev. 2014;2014:360438. [DOI] [PMC free article] [PubMed] [Google Scholar]
- 25. Bromfield EG, Mihalas BP, Dun MD, et al. Inhibition of arachidonate 15‐lipoxygenase prevents 4‐hydroxynonenal‐induced protein damage in male germ cells. Biol Reprod. 2017;96:598‐609. [DOI] [PubMed] [Google Scholar]
- 26. Shi Q, Vaillancourt F, Côté V, et al. Alterations of metabolic activity in human osteoarthritic osteoblasts by lipid peroxidation end product 4‐hydroxynonenal. Arthritis Res Ther. 2006;8:R159. [DOI] [PMC free article] [PubMed] [Google Scholar]
- 27. Tomita K, Kuwahara Y, Takashi Y, et al. Clinically relevant radioresistant cells exhibit resistance to H2O2 by decreasing internal H2O2 and lipid peroxidation. Tumor Biol. 2018;40:1010428318799250. [DOI] [PubMed] [Google Scholar]
- 28. Batzri S, Korn ED. Single bilayer liposomes prepared without sonication. Biochim Biophys Acta. 1973;298:1015‐1019. [DOI] [PubMed] [Google Scholar]
- 29. Kobayashi D, Nakahara H, Shibata O, et al. Interplay of hydrophobic and electrostatic interactions between polyoxometalates and lipid molecules. J Phys Chem C. 2017;121:12895‐12902. [Google Scholar]
- 30. Miller EW, Dickinson BC, Chang CJ. Aquaporin‐3 mediates hydrogen peroxide uptake to regulate downstream intracellular signaling. Proc Natl Acad Sci USA. 2010;107:15681‐15686. [DOI] [PMC free article] [PubMed] [Google Scholar]
- 31. Medraño‐Fernandez I, Bestetti S, Bertolotti M, et al. Stress regulates aquaporin‐8 permeability to impact cell growth and survival. Antioxid Redox Signal. 2016;24:1031‐1044. [DOI] [PMC free article] [PubMed] [Google Scholar]
- 32. Al Ghouleh I, Frazziano G, Rodriguez AI, et al. Aquaporin 1, Nox1, and Ask1 mediate oxidant‐induced smooth muscle cell hypertrophy. Cardiovasc Res. 2012;97:134‐142. [DOI] [PMC free article] [PubMed] [Google Scholar]
- 33. Bienert GP, Møller AL, Kristiansen KA, et al. Specific aquaporins facilitate the diffusion of hydrogen peroxide across membranes. J Biol Chem. 2007;282:1183‐1192. [DOI] [PubMed] [Google Scholar]
- 34. Vergani L, Floreani M, Russell A, et al. Antioxidant defences and homeostasis of reactive oxygen species in different human mitochondrial DNA‐depleted cell lines. Eur J Biochem. 2004;271:3646‐3656. [DOI] [PubMed] [Google Scholar]
- 35. Kuwahara Y, Roudkenar MH, Suzuki M, et al. The involvement of mitochondrial membrane potential in cross‐resistance between radiation and docetaxel. Int J Radiat Oncol Biol Phys. 2016;96:556‐565. [DOI] [PubMed] [Google Scholar]
- 36. Lee JY, Jung GY, Heo HJ, et al. 4‐Hydroxynonenal induces vascular smooth muscle cell apoptosis through mitochondrial generation of reactive oxygen species. Toxicol Lett. 2006;166:212‐221. [DOI] [PubMed] [Google Scholar]
- 37. Aikens J, Dix TA. Hydrodioxyl (perhydroxyl), peroxyl, and hydroxyl radical‐initiated lipid peroxidation of large unilamellar vesicles (liposomes): comparative and mechanistic studies. Arch Biochem Biophys. 1993;305:516‐525. [DOI] [PubMed] [Google Scholar]
- 38. Gaschler MM, Stockwell BR. Lipid peroxidation in cell death. Biochem Biophys Res Commun. 2017;482:419‐425. [DOI] [PMC free article] [PubMed] [Google Scholar]
- 39. Zhang W, Zhong W, Sun Q, et al. Hepatic overproduction of 13‐HODE due to ALOX15 upregulation contributes to alcohol‐induced liver injury in mice. Sci Rep. 2017;7:8976. [DOI] [PMC free article] [PubMed] [Google Scholar]
- 40. Shintoku R, Takigawa Y, Yamada K, et al. Lipoxygenase‐mediated generation of lipid peroxides enhances ferroptosis induced by erastin and RSL3. Cancer Sci. 2017;108:2187‐2194. [DOI] [PMC free article] [PubMed] [Google Scholar]
- 41. Shah R, Shchepinov MS, Pratt DA. Resolving the role of lipoxygenases in the initiation and execution of ferroptosis. ACS Cent Sci. 2018;4:387‐396. [DOI] [PMC free article] [PubMed] [Google Scholar]
- 42. Uchida K. HNE as an inducer of COX‐2. Free Radic Biol Med. 2017;111:169‐172. [DOI] [PubMed] [Google Scholar]
- 43. Fang Q, Zhu Y, Wang Q, et al. Suppression of cyclooxygenase 2 increases chemosensitivity to sesamin through the Akt‐PI3K signaling pathway in lung cancer cells. Int J Mol Med. 2019;43:507‐516. [DOI] [PubMed] [Google Scholar]
- 44. Ji GR, Yu NC, Xue X, et al. 4‐Hydroxy‐2‐nonenal induces apoptosis by inhibiting AKT signaling in human osteosarcoma cells. Sci World J. 2014;2014:873525. [DOI] [PMC free article] [PubMed] [Google Scholar]
- 45. Schauen M, Spitkovsky D, Schubert J, et al. Respiratory chain deficiency slows down cell‐cycle progression via reduced ROS generation and is associated with a reduction of p21CIP1/WAF1. J Cell Physiol. 2006;209:103‐112. [DOI] [PubMed] [Google Scholar]
Associated Data
This section collects any data citations, data availability statements, or supplementary materials included in this article.
Supplementary Materials


