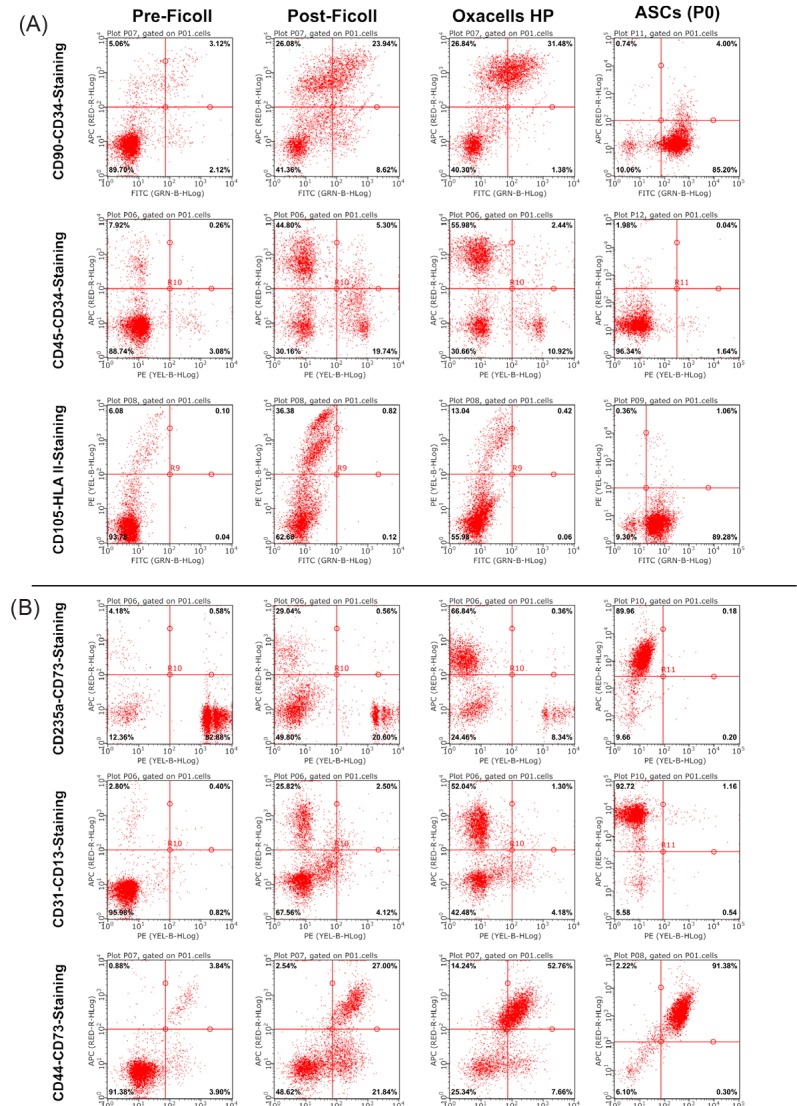
Fig. 2.

Immune phenotypic characterization of the purified cell populations. Representative dot plots of double-stained cells from the 4 different purification steps (before Ficoll density centrifugation, after density centrifugation, after short-term incubation (Oxacells HP) and after cultivation to passage 0). Shown is data from two donors (A and B). For donor A, the antibody combinations CD90-FITC / CD34-APC, CD45-PE / CD34-APC and CD105-FITC / HLA II (HLA-DR, DP, DQ)-PE were selected. For the second subset the combinations of anti-CD235a-PE / -CD73-APC, anti-CD-31-PE / -CD13-APC and anti-CD44-FITC / -CD73-APC were taken. The percentage of the positive single-stained cells is shown in the lower right and upper left corner, the percentage of double positive cells is shown in the upper right corner. The cells in the lower left corner are negative for the corresponding marker combination.
