

Abstract
The protein p62/Sequestosome 1 (p62) has been described as a selective autophagy receptor and independently as a platform for pro‐inflammatory and other intracellular signaling. How these seemingly disparate functional roles of p62 are coordinated has not been resolved. Here, we show that TAK1, a kinase involved in immune signaling, negatively regulates p62 action in autophagy. TAK1 reduces p62 localization to autophagosomes, dampening the autophagic degradation of both p62 and p62‐directed autophagy substrates. TAK1 also relocalizes p62 into dynamic cytoplasmic bodies, a phenomenon that accompanies the stabilization of TAK1 complex components. On the other hand, p62 facilitates the assembly and activation of TAK1 complexes, suggesting a connection between p62's signaling functions and p62 body formation. Thus, TAK1 governs p62 action, switching it from an autophagy receptor to a signaling platform. This ability of TAK1 to disable p62 as an autophagy receptor may allow certain autophagic substrates to accumulate when needed for cellular functions.
Keywords: anti‐inflammatory, HIV‐1, TLR3, TRIM5α, tripartite motif
Subject Categories: Autophagy & Cell Death, Signal Transduction
Introduction
Activation of the macroautophagy pathway frequently accompanies a wide variety of cellular hazards including nutrient limitation, proteotoxic stress, damage to endolysosomal membranes, and detection of pathogens or pathogen‐associated molecular patterns (PAMPs) 1, 2, 3, 4, 5. Macroautophagy (hereafter referred to as autophagy) is a mechanism of cellular waste management and quality control in which cytoplasmic contents are packaged in a double membranous vesicle termed an autophagosome 6. Typically, autophagosomes fuse with lysosomes resulting in the degradation of vesicular contents 6. Several dozen proteins have been identified to have roles in autophagy in yeast. Higher organisms have a substantially larger repertoire of autophagy factors 7, possibly owing to the expanded physiological roles of autophagy in multicellular organisms.
There are numerous connections between the autophagy machinery and other cellular stress response pathways. For example, activation of components of the NF‐κB pathway can promote autophagy through several mechanisms 8, 9, 10, 11. TBK‐1, a kinase required for activation of IRF‐3 in response to viral infection, promotes autophagosome formation, maturation, and selective cargo recognition by the autophagy apparatus 12, 13, 14, 15. Furthermore, oxidative stress induces autophagy and promotes the expression of autophagy factors through activation of Nrf2‐dependent transcription 16. One reason for the overlap between autophagy and these or other cell stress pathways is that autophagy can serve as an effector to eliminate the danger. For instance, damaged mitochondria, the source of oxidative stress, are eliminated by autophagy 17. In contrast, certain components of the autophagy machinery can also promote inflammatory processes such as scaffolding the activation of RIPK1 and RIPK3 18.
The intersections between cell stress pathways and autophagy are perhaps best illustrated by the protein p62/SQSTM1 (p62) 19, 20. On the one hand, p62 can act as a signaling hub with effects on PKC‐zeta, PKC‐iota, mTOR, caspase‐8, Nrf2, and NF‐κB signaling 21, 22, 23, 24, 25, 26, 27, 28. On the other hand, p62 is an autophagic adaptor that mediates the selective recognition and degradation of specific autophagy substrates including protein aggregates 29, 30, intracellular bacteria 31, or specific proteins such as the Nrf2 inhibitor Keap1 28. Many of these substrates are flagged for autophagic degradation by an ubiquitin tag 32, 33. p62 recognizes these tags via a C‐terminal ubiquitin‐binding domain (UBA) and bridges the substrate with LC3 proteins associated with the nascent autophagosome membrane 30, 31, 34. Following delivery to the lysosome, p62 is codegraded with its substrates 34. The factors controlling how p62 carries out its contrasting functions in inflammation and autophagy are not known.
Interestingly, a variety of stress conditions are known to trigger a change in the localization of p62 from an overall diffuse cytoplasmic pattern to a punctate pattern 30, 35. Whereas p62 can self‐assemble into coalesced structures in vitro 36, the fact that p62 bodies in cells primarily assemble in response to stress suggests that their formation is regulated in vivo. The factors which control p62 relocalization are not fully understood, nor is the physiological significance of p62 body formation to p62's roles in autophagy or signaling. In this study, we sought to determine how p62 relocalizes to cytoplasmic bodies in response to cellular stress. We found that the inflammation‐related protein TGF‐β‐activated kinase 1 (TAK1, also MAP3K7) is required for p62 body formation under stress conditions that also induce autophagy. Nevertheless, p62 in these TAK1‐generated bodies is resistant to autophagic degradation and thus is disabled in a key aspect of its role as an autophagy receptor. Indeed, while TAK1 complexes are substrates of p62‐directed selective autophagy, p62 body forming conditions spare TAK1 from degradation. Furthermore, under these conditions p62 acts as a platform assembling and activating TAK1 complexes. Thus, TAK1 tilts the balance of p62 activities away from degradative roles in autophagy toward roles in signal transduction.
Results
TAK1 is required for p62 body formation in response to stress conditions
We developed a high content imaging‐based assay to measure p62 body formation in cells. This assay involves the automatic imaging and unbiased analysis of thousands of cells, and thus confers substantial statistical power. We found that treatment of HeLa cells with the mTOR inhibitor pp242 for 1 h increased both the number of p62 bodies (average surface area, 3.2 ± 0.2 μm2) and the total area of p62 bodies per cell (Fig EV1A). We did not observe any effect of pp242 treatment on the abundance of polyubiquitin containing structures in cells (Fig EV1B), suggesting that ubiquitin binding is unlikely to explain pp242‐stimulated p62 relocalization. We considered a model in which phosphorylation of p62 could account for its relocalization to punctate structures. Because p62 is a known substrate for TBK1 13, 15 and ULK1 37, we considered whether either of these kinases are required for p62 body formation. However, neither treatment of cells with the TBK1 inhibitor BX‐795 nor knockdown of ULK1 prevented the pp242‐induced formation of p62 bodies, with ULK1 knockdown increasing their abundance (Fig EV1C and D). The finding that p62 body formation is independent of ULK1 indicates that the pp242‐induced p62 bodies are not autophagosomes, the formation of which requires ULK1. As a third candidate, we tested the ubiquitin‐sensing kinase TAK1 38. TAK1 is a serine/threonine kinase with key roles in inflammatory signaling cascades triggered by engagement of certain cytokine receptors or detection of pathogen‐associated molecular patterns such as lipopolysaccharide (LPS) 39. Interestingly, LPS stimulation of dendritic cells has previously been shown to induce the formation of cytoplasmic structures called DALIS that morphologically resemble p62 bodies and contain p62 40, 41. We found that TAK1 knockdown by siRNA eliminated or substantially delayed p62 body formation in response to pp242 relative to cells transfected with control siRNA (Fig 1A). TAK1 knockdown had no effect on p62 abundance under unstimulated conditions when autophagy is operating at a basal level (Fig EV1E). p62 bodies are also formed in response to other autophagy‐inducing stressors including endolysosomal membrane damage induced by calcium phosphate precipitates (CPP) 3 or proteotoxic stress induced by the protein synthesis inhibitor puromycin 29. As we observed with pp242, TAK1 knockdown also dramatically reduced the abundance of p62 bodies following CPP or puromycin treatment of HeLa cells (Fig EV1F and G), indicating a general role for TAK1 in p62 body formation. Puromycin treatment promotes the p62‐dependent formation of ubiquitin‐rich cytoplasmic puncta 29, 40, a process substantially reduced by TAK1 knockdown (Fig 1B–D). Together, these data show that TAK1 contributes to the formation of p62 bodies and to the ability of p62 to organize ubiquitylated targets in response to several cellular stresses.
Figure EV1. TAK1 promotes p62 body formation.

- High content imaging of the effects of pp242 treatment on the number of p62 bodies per cell under basal and pp242‐induced conditions. HeLa cells were treated with pp242 for 1 h prior to fixation and staining with anti‐p62. White mask, cell boundary. Yellow mask, automatically identified p62 bodies. Scale bar, 10 μm. Plots show two readouts of the abundance of p62 bodies per cell: the number of p62 bodies and the total cross‐sectional area of coalesced p62 (body area).
- High content imaging of the effects of pp242 treatment on the area of ubiquitin puncta per cell. HeLa cells were treated or not for 1 h with pp242 and stained with anti‐multi‐ubiquitin (red) and anti‐p62 (green). White mask, cell boundary. Red mask, automatically identified ubiquitin puncta; green mask, p62 bodies; scale bar, 10 μm. Plots, quantitation of images for the number of ubiquitin (left) or p62 (right) puncta per cell.
- The effect of TBK1 inhibitor BX795 (BX) on pp242‐induced p62 bodies as determined by high content imaging.
- The effect of ULK1 knockdown on the ability of pp242 to induce p62 bodies. Immunoblot shows ULK1 knockdown efficiency.
- Top, immunoblot showing TAK1 knockdown efficiency in HeLa cells corresponding to Fig 1A. Bottom, plot showing the effect of TAK1 knockdown on p62 protein levels in HeLa cells under basal (full media) conditions. Data points represent independent biological replicates.
- The effect of TAK1 knockdown on p62 bodies formed in HeLa cells in response to a 4 h treatment with calcium phosphate precipitates (CPP) or puromycin (Puro.). White mask, cell boundary. Yellow mask, automatically identified p62 bodies. Scale bar, 10 μm.
- Analysis of images as in (F).
- Immunoblot showing ATG7, UBC13, and TRAF6 knockdown efficiency in HeLa cells corresponding to Fig 1E.
- The effect of knocking down the indicated proteins on p62 body formation. HeLa cells were subjected to the indicated siRNA and treated with pp242 for 1 h prior to fixation and anti‐p62 staining. p62 body formation was observed via high content imaging and the average area of p62 bodies per cell shown in the graph.
Figure 1. TAK1 enhances p62 phosphorylation and promotes the formation of p62 bodies.

-
AHigh content imaging of p62 in HeLa cells subjected to control or TAK1 siRNA and stimulated or not with pp242 for 1 h. White mask, cell boundary. Yellow mask, automatically identified p62 bodies. Scale bar, 10 μm. Immunoblots showing knockdown efficiency are shown in Fig EV1E.
-
B–DHigh content microscopic analysis of the effect of TAK1 or p62 knockdown on the formation of ubiquitin puncta in response to puromycin treatment. HeLa cells were subjected to control or TAK1 knockdown prior to being treated for 2 h with puromycin. Cells were then stained with anti‐multi‐ubiquitin (green) and anti‐p62 (red), and imaged with the abundance of ubiquitin puncta and p62 bodies per cell determined by automated image analysis. Scale bar, 10 μm. The number of ubiquitin puncta (C) and p62 bodies (D) per cell was determined by image analysis.
-
EThe effect of knocking down TAK1 upstream factors UBC13 and TRAF6 on p62 body formation in HeLa cells under basal conditions. Cells were subjected to the indicated knockdowns, stained with anti‐p62, and images acquired by high content microscopy. Scale bar, 10 μm. Quantitation of analyzed images is shown in the plot to the right. Immunoblots showing knockdown efficiency are shown in Fig EV1H.
-
FThe effect of selective TAK1 inhibitor (5Z)‐7‐oxozeaenol (5Z) on the abundance of p62 bodies in HeLa cells treated or not with pp242 for 1 h as determined by high content imaging and analysis.
-
GThe effect of GFP‐TAK1 expression on the abundance of p62 bodies in HeLa cells. Cells were transfected with GFP‐TAK1 or GFP alone, stained with anti‐p62, and the abundance of p62 bodies was determined by high content imaging. Scale bar, 10 μm.
-
HImmunoblot analysis of the effect of TAK1 knockdown on the abundance of p62 phosphorylated at serine 403. Numbers indicate the relative abundance of phospho‐p62 normalized to actin loading control.
-
I, JPhospho‐proteomic analysis of immunoprecipitated FLAG‐p62 from lysates of HEK293T cells expressing GFP‐TAK1 or GFP alone. Data shown indicate the intensity of phospho‐peptide peaks at p62 Ser24 (I) or Ser226 (J). The total abundance of p62 in the samples was determined to be equivalent (see Materials and Methods); thus, no further normalization was needed.
In order to be a functional kinase, TAK1 must interact with its essential cofactors TAB1 and TAB2 (or TAB3). While TAK1 constitutively interacts with TAB1, binding with TAB2 is conditional with TAB2 recruited to TAK1 via K63‐linked polyubiquitin chains 38. K63‐linked ubiquitin chains are generated by the E2 ubiquitin‐conjugating enzyme UBC13/UBE2N and can be directly conjugated to targets or released as free chains by a number of E3 ligases including TRAF6. We tested whether components of the TAK1 signaling pathway in addition to TAK1 itself were involved in p62 body formation. Knockdown of UBC13, TRAF6, and TAB2 all reduced the abundance of p62 bodies, suggesting that factors upstream of TAK1 contribute to p62 localization (Figs 1E, and EV1H and I). In these experiments, we also knocked down the autophagy factor ATG7, which as expected did not affect p62's localization to bodies nor did knockdown of TBK1. We next tested whether TAK1 activity is required for p62 body formation using the specific TAK1 inhibitor (5Z)‐7‐oxozeaenol (hereafter referred to as 5Z). Although 5Z treatment did not affect the abundance of p62 bodies under non‐induced conditions, 5Z dampened the ability of pp242 to induce p62 bodies (Fig 1F). Expression of GFP‐tagged TAK1 increased the abundance of p62 bodies in HeLa cells relative to cells expressing GFP alone (Fig 1G). In these experiments, we observed substantial colocalization between GFP‐TAK1 and p62 signals (Fig EV2A), a result that we confirmed by confocal microscopy (Fig EV2B). The ability of TAK1 expression to promote p62 body formation required TAK1 enzymatic activity, as expression of kinase‐dead TAK1 (K63W) did not increase p62 bodies (Fig EV2C and D) and GFP‐TAK1 (K63W)‐positive structures showed less colocalization with p62 than did GFP‐TAK1 WT (Fig EV2C and E). Together, these data show that the TAK1 signaling pathway and TAK1 activity are important for the formation of p62 bodies.
Figure EV2. TAK1 activity is required for p62 body formation.

-
AHigh content image analysis of colocalization between GFP‐TAK1 and endogenous p62 in HeLa cells. White mask, cell boundary. Yellow mask, automatically identified regions showing overlap between GFP‐TAK1 and p62 puncta. Scale bar, 10 μm.
-
BConfocal microscopic analysis of colocalization between GFP‐TAK1 and endogenous p62 in HeLa cells. A zoomed‐in view of the contents of the boxed region is shown in the inset. Scale bar, 5 μm.
-
C–EHigh content imaging‐based analysis of the abundance of p62 bodies (D) and their colocalization with GFP‐positive profiles (E) in HeLa cells transfected as indicated and showing positivity for GFP signal. Representative images (C) show automatically identified cells showing GFP positivity (white mask). Left panels show p62 localization, right panels show p62 (red), GFP (green), and DNA (blue). Scale bar, 10 μm.
-
FThe effect of GFP‐TAK1 expression on the abundance of phospho‐p62. Lysates from HEK293T cells expressing FLAG‐p62 and GFP‐TAK1 or GFP alone were subjected to immunoblotting with the indicated antibodies. Plot shows the fold increase in phospho‐p62 levels relative to what is seen in cells expressing GFP alone.
-
GThe effect of WT or kinase‐dead (K63W) GFP‐TAK1 expression on the abundance of phospho‐p62 (pThr269/pSer272) in transfected HEK293T cells. Plot shows the abundance of phospho‐p62 relative to actin loading control.
-
HRepresentative peptide spectrum from mass spectroscopy showing double phosphorylation of p62 between amino acids 266 and 277.
-
IThe effect of TAK1 knockdown on the ability of FLAG‐p62 to immunoprecipitate mCherry‐p62 in HEK293T cells.
-
JThe effect of TAK1 knockdown on the ability of HA‐ubiquitin (UBQ) to immunoprecipitate mCherry‐p62 in transfected HEK293T cells.
TAK1 expression increases p62 phosphorylation
Since phosphomimetic mutants of p62 at Ser403 are reported to enhance p62 body formation 42 and ubiquitin binding 37, we next tested whether TAK1 could influence phosphorylation at that site. TAK1 knockdown reduced the amount of p62 phosphorylated at Ser403 (Fig 1H) while expression of GFP‐TAK1 had the opposite effect and also increased p62 phosphorylation at two other previously described sites (Thr269/Ser272 and Ser349; Fig EV2F). We next took a phospho‐proteomic approach to determine whether TAK1 increased p62 phosphorylation at additional sites. These experiments revealed that p62 phosphorylation was increased at Ser24 and at Ser226 in cells expressing GFP‐TAK1 relative to cells expressing GFP alone (Fig 1I and J; Table 1). Phosphorylation of p62 at Thr269/Ser272 was detected in both GFP and GFP‐TAK1 expressing cells, but the multiple phosphorylation events at this locus interfered with quantitative analysis (Fig EV2H; Table 1). Phospho‐peptides containing Ser349 or Ser403 were not detected in either sample. Unlike wild type, expression of K63W mutant TAK1 did not increase, and in fact decreased, phospho‐p62 abundance (Fig EV2G). TAK1 knockdown did not affect the ability of p62 to oligomerize (Fig EV2I) or to bind ubiquitin (Fig EV2J) in co‐immunoprecipitation experiments, suggesting that TAK1 promotes p62 bodies through other mechanisms. These data indicate that TAK1 expression promotes phosphorylation of p62 at several sites including one previously implicated in body formation.
Table 1.
p62 peptides containing at least one high confidence (probability ≥ 0.95) phosphorylated residue as determined by mass spectroscopy
| Position in p62 | Reported in UniProt DB | Peptide sequence with localization probability | Mean peak intensity ± SEM (n = 3) | P‐value (t‐test) | |
|---|---|---|---|---|---|
| GFP alone | GFP‐TAK1 | ||||
| S24 | Yes | RFS(0.999)FCCS(0.001)PEPEAEAEAAAGPGPCER | 1.5e7 ± 2.1e6 | 3.0e7 ± 3.0e6 | 0.02 |
| S226 | No | AGEARPGPTAES(0.009)AS(0.991)GPS(0.001)EDPSVNFLK | N.D. | 4.7e6 ± 1.0e5 | 0.008 |
| S272 | Yes | LTPVS(1)PESSSTEEK | 7.7e7 ± 1.6e7 | 5.9e7 ± 1.6e8 | 0.3 |
| T269; S275 | Yes; No | SRLT(1)PVS(0.047)PES(0.951)S(0.002)STEEK | N.D. | 1.5e7 ± 1.5e7 | 0.4 |
| S332 | Yes | KIALESEGRPEEQMES(0.008)DNCS(0.991)GGDDDWTHLSSK | 1.4e6 ± 1.4e6 | 3.9e6 ± 2.0e6 | 0.3 |
N.D., not detected.
TAK1 inhibits the autophagic degradation of p62
We anticipated that TAK1 likely plays a role in promoting the autophagic degradation of p62. However, we found the opposite, as p62 levels were reduced in cells subjected to TAK1 knockdown following autophagy induction by amino acid starvation (Fig 2A and B). These reduced levels of p62 were rescued by treatment with the autophagy inhibitor bafilomycin A1, indicative of enhanced autolysosomal degradation of p62 in the absence of TAK1. In contrast, we did not see effects of TAK1 knockdown on NBR1, a p62 homologue that is also an autophagic substrate 5. Whereas TAK1 knockdown promoted the autophagic degradation of p62, TAK1 expression had a protective effect on p62 levels in cells under amino acid starvation conditions (Figs 2C and D, and EV3A). This effect was not seen in bafilomycin A1‐treated cells. Interestingly, a kinase‐dead mutant of TAK1 (K63W) protected p62 from autophagic degradation similarly to WT TAK1 (Fig 2C and D), suggesting that the p62‐protective function of TAK1 is independent of its p62 body forming function, the latter of which we found to require TAK1 activity (Fig 1). Transient expression of TAK1 did not affect the abundance of p62 mRNA, suggesting a post‐translational role of TAK1 in p62 protection (Fig EV3B).
Figure 2. TAK1 protects p62 from autophagic degradation.

-
A, BThe effect of TAK1 knockdown on the abundance of autophagy substrates p62 and NBR1 under induced autophagy conditions. HeLa cells were subjected to control or TAK1 knockdown and subjected to amino acid starvation for 4 h in the presence or absence of autophagy inhibitor bafilomycin A1 (BafA1) prior to lysis and immunoblotting with the indicated antibodies. The relative abundance of p62 or NBR1 following normalization to an actin loading control is shown in (B), and points show data from independent biological replicates.
-
C, DThe effect of WT or kinase‐dead TAK1 expression on the autophagic degradation of p62. HEK293T cells were transfected with the indicated plasmids and then treated or not with bafilomycin A1 (BafA1) for 3 h under amino acid starvation conditions. Relative p62 levels were normalized to actin loading control and plotted in (D). Data points show results from independent biological replicates.
-
ECo‐immunoprecipitation analysis of interactions between FLAG‐p62 and LC3B from lysates of transfected HEK293T cells.
-
FHigh content imaging‐based analysis of LC3B positivity of cytoplasmic structures identified as p62+GFP‐TAK1+ or p62+GFP‐TAK1negative in transfected HeLa cells. See also Fig EV3D and E.
Figure EV3. TAK1 reduces LC3‐p62 interaction and p62 localization to autophagosomes.

-
AThe effect of TAK1 over‐expression on p62 protein levels in HEK293T cells. Cells were transfected with GFP‐p62 and either FLAG‐TAK1 or empty vector prior to lysis and immunoblotting with anti‐GFP and anti‐FLAG. Plot, quantitation of the abundance of GFP‐p62 relative to actin as determined by densitometry.
-
BqPCR analysis of the effect of TAK1 expression on the abundance of p62 mRNA. Total RNA was harvested from HEK293T cells transfected with GFP‐TAK1 or GFP alone and subjected to amino acid starvation for 3 h.
-
CCo‐IP analysis of the effect of WT or kinase‐dead (K63W) TAK1 expression on p62‐LC3B complex formation in HEK293T cells.
-
D, EConfocal microscopic analysis GFP‐TAK1, p62, and LC3B in HeLa cells. Panel (E) shows the fluorescence intensity profile along the transect (red arrow) of the cell shown in (D). Notably, extensive colocalization is seen between red (p62) and green (GFP‐TAK1) profiles and between red and blue (LC3B) profiles, but not between green and red profiles. Scale bar in panel (D), 5 μm.
-
F, GTime course of the effects of pp242 treatment on the abundance of LC3B puncta (F) and either punctate or total p62 (G) showing the fold increase in signal relative to what was seen in unstimulated control cells. HeLa cells were treated with pp242 or DMSO vehicle for the indicated times prior to fixation, staining, and high content imaging. Total p62 was determined by measuring the total fluorescent anti‐p62 signal per cell.
p62 delivery to the autophagosome is mediated through its interaction with the autophagosomal membrane‐associated protein LC3B 30. TAK1 expression reduced the abundance of LC3B in p62 protein complexes (Fig 2E). As above, TAK1 kinase activity was dispensable for the ability of TAK1 to disrupt p62‐LC3B interactions (Fig EV3C). TAK1 expression also reduced the localization of p62 to autophagosomes, with GFP‐TAK1‐positive p62 structures showing much reduced positivity for LC3B relative to GFP‐TAK1‐negative p62 structures as determined by confocal microscopy (Fig EV3D and E) and by high content imaging (Fig 2F). These data suggested a model in which the TAK1‐dependent p62 bodies are less susceptible to autophagy than other pools of p62. To test this model, we used high content imaging to compare the effects of autophagy induction on the abundance of p62 bodies relative to the abundance of total p62, the latter determined by measuring the total anti‐p62 signal per cell. In these experiments, both autophagy (Fig EV3F) and p62 bodies (Fig EV3G) were induced with pp242. Treatment of HeLa cells with pp242 rapidly induced p62 bodies, which showed a threefold induction by 15 min after treatment and became maximally induced (5–6 fold) by 30 min following treatment (Fig EV3G). The number of p62 bodies remained at this elevated level for the duration of the experiment (200 min). To quantitate the total abundance of p62, we measured the total above‐background fluorescence of anti‐p62 signal per cell (Fig EV3G). As expected, pp242 treatment resulted in a reduction of p62 signal, first detectable at 90 min following treatment—long after maximal induction of p62 bodies. Importantly, although the total abundance of p62 continued to decline thereafter, the number of p62 bodies remained high. This result suggested p62 bodies (coalesced structures > 3 μm2) are more resistant to autophagic degradation than is the total pool of p62. Together, these results indicate that TAK1 prevents p62 from acting in selective autophagy by reducing its interaction with LC3B and by relocalizing it to cytoplasmic bodies.
p62 interacts with TAK1 complexes
Since the effects of TAK1 on p62 are most pronounced under conditions promoting p62 body formation (for example, following puromycin treatment or mTOR inhibition), we determined whether mTOR inhibitor pp242 treatment affected interactions between p62 and the TAK1 complex. Because p62 and TAK1 have already been reported to exist in protein complexes in cells 43, we focused first on the TAK1 cofactor TAB2. While we did not detect TAB2 in co‐immunoprecipitates with p62 under basal conditions, treatment of cells with pp242 strongly enhanced the abundance of TAB2 in complexes with p62 (Fig 3A). In confocal microscopy studies, we found that GFP‐TAB2 colocalized with endogenous p62 in cells treated pp242 (Fig EV4A). These results suggest that p62 may bind to active TAK1 complexes consisting of both TAK1 and TAB2. The assembly of active TAK1 complexes requires K63‐linked polyubiquitin chains produced by the ubiquitin‐conjugating enzyme UBC13 39. Knockdown of UBC13 reduced the interaction between p62 and TAB2 (Figs 3B and EV4B) or TAK1 (Fig EV4C) in co‐immunoprecipitation experiments. We next mapped the region of p62 responsible for its interactions with TAK1 complexes by assessing the ability of p62 deletion mutants to immunoprecipitate TAK1 or TAB2 (Figs 3C and D, and EV4D and E). In these experiments, we used the following three p62 deletion constructs: (i) ▵PB1, an N‐terminal deletion which disrupts p62's ability to oligomerize and form puncta; (ii) ▵UBA, a C‐terminal deletion that eliminates p62's ubiquitin‐binding activity; and (iii) ▵PB1▵UBA, encompassing the middle of p62 and including motifs required for binding to LC3, TRAF6, and KEAP1 (Fig 3C). As expected, GFP‐tagged WT p62 immunoprecipitated TAK1 (Fig 3D) and TAB2 (Fig EV4E), as did GFP‐p62▵UBA. Deletion of the PB1 domain of p62 strongly reduced p62's interaction with TAK1 (Fig 3D) and TAB2 (Fig EV4E), although we still observed above‐background binding of both TAK1 and TAB2 to ▵PB1. This residual binding was lost when both the PB1 and UBA domains of p62 were deleted. In separate experiments, we found that p62's PB1 domain on its own was not sufficient to immunoprecipitate TAK1 (Fig EV4D). Together, these data suggest that p62 interacts with TAK1 complex components in a manner requiring its PB1 domain with contributions from the C‐terminal UBA domain (Fig 3C). Confocal microscopy experiments indicated that the interaction between TAK1 complex components and p62 most likely occurs in the context of coalesced p62 bodies, as we observed strong colocalization of tagged TAK1 and TAB2 with punctate p62 (Fig 3E). FRAP experiments indicate that these structures allow substantial exchange with the surrounding cytoplasm (Fig EV4F). In these experiments, we observed a rapid, albeit partial, recovery in GFP‐TAK1 signal following bleaching that is characteristic of structures referred to as signalosomes 44.
Figure 3. TAK1 complex components interact with p62 under p62 body forming conditions.

-
ACo‐immunoprecipitation analysis of interactions between mCherry‐p62 and GFP‐TAB2 from lysates of transfected HEK293T cells treated or not with pp242 for 1 h.
-
BCo‐immunoprecipitation analysis of interactions between mCherry‐p62 and GFP‐TAB2 from lysates of transfected HEK293T cells subjected to either control or UBC13 siRNA and treated with pp242 for 1 h.
-
C, DCo‐immunoprecipitation analysis of the p62 domains required for binding to TAK1. HEK293T cells were transfected with GFP alone, GFP‐p62 WT, or domain deletions (C, left) and FLAG‐TAK1 and treated with pp242 for 1 h prior to cell lysis and immunoprecipitation with anti‐GFP (D). GFP‐p62 constructs showing robust binding to TAK1 or TAB2 are indicated with a “+”, marginal binding is indicated with “+/−”, and no binding indicated with “−” (C, right).
-
EConfocal microscopic analysis of colocalization between GFP‐TAK1, mCherry‐TAB2, and endogenous p62 in HeLa cells. Inset shows a zoomed‐in image of the region inside the dash‐lined box. Scale bar, 5 μm.
Figure EV4. TAK1 complex components interact with p62 under p62 body forming conditions.

- HeLa cells were transfected with GFP‐tagged TAB2 and treated with pp242 for 40 min prior to fixation and immunostaining with anti‐p62 and confocal microscopy. Inset shows magnified images of the boxed region. Scale bar, 5 μm.
- Effect of UBC13 knockdown on the interaction between endogenous p62 and TAB2 from HeLa cell lysates.
- Effect of UBC13 knockdown on the interaction between GFP‐TAK1 and mCherry‐p62 as determined by co‐immunoprecipitation using anti‐GFP from transfected HEK293T cell lysates treated with pp242 for 40 min.
- Co‐immunoprecipitation analysis of interactions between FLAG‐tagged TAK1 and GFP‐tagged p62, p62 PB1 domain, or GFP alone from lysates of transfected HEK293T cells treated with pp242 for 40 min.
- Co‐immunoprecipitation analysis of p62 domains involved in binding to TAB2 from cell lysates of transiently transfected HEK293T cells treated with pp242 for 1 h.
- FRAP analysis of GFP‐TAK1 puncta in HeLa cells. Micrographs show two representative regions of interest containing GFP‐TAK1 puncta prior to photobleaching and during the recovery period. Plot shows the relative fluorescence intensity of GFP‐TAK1 puncta (N = 134) at different time points before and after bleaching. Scale bar, 5 μm. Data, mean ± SEM.
p62 targets TAK1 complex components for autophagic degradation
We next asked whether p62 contributes to the functions of TAK1 or TAB2. The finding that some TAK1‐p62 double‐positive structures in cells were also positive for LC3B (Figs 2F and EV5A) suggested that p62 may act as an autophagy receptor removing TAK1 complex components from cells. In accordance with this model, GFP‐labeled TAB2 colocalized with LC3B‐positive structures when expressed in HeLa cells (Fig 4A). Furthermore, we detected TAK1‐TAB2 double‐positive structures that colocalized with LC3B in HeLa cells (Fig 4B). We next used the tandem fluorescence approach 30 to determine whether TAK1 and TAB2 are found within acidified compartments (lysosomes). To do this, we generated mCherry‐eGFP‐tagged TAK1 or TAB2. Whereas eGFP fluorescence is lost under low pH conditions, mCherry fluorescence is retained. When expressed in HeLa cells, we found puncta from both TAK1 and TAB2 fusion proteins showing only red fluorescence under both full media and amino acid starvation conditions (Figs 4C and EV5B), suggesting that some of the TAK1 or TAB2 fusion proteins were within lysosomes. Treatment with bafilomycin A1 increased the abundance of TAK1, TAB2, and p62 under amino acid starvation‐induced autophagy conditions (Fig 4D). These data demonstrate that TAK1 and TAB2 are targets of autophagy. Autophagic targeting of TAK1 and TAB2 required p62, as p62 knockdown increased their relative abundance (Fig 4E). Importantly, inhibition of autophagic flux by bafilomycin A1 abrogated the effect of p62 knockdown (Fig 4E), suggesting that p62 promotes the selective autophagic degradation of TAK1 and TAB2. In these experiments, we also saw that knockdown of UBC13, which contributes to p62‐TAK1 complex interactions, protected TAK1 and TAB2 from autophagic degradation (Fig 4E). TLR3 is a double‐stranded RNA (dsRNA) sensor that transduces signals via TAK1 to activate NF‐κB‐ and AP1‐driven gene expression 45. We used a TLR3 reporter cell line to test how autophagic degradation of TAK1 complexes affects TLR3 signaling and found that inhibition of autophagy by knockdown of Beclin 1 enhanced these cells’ responsiveness to the dsRNA analogue poly(I:C) 46 (Fig 4F). Beclin 1 knockdown also increased protein levels of TAB2 (Fig EV5C). Taken together, these data demonstrate that TAK1 complexes are substrates of p62‐directed selective autophagy and that autophagy attenuates TAK1 signaling.
Figure EV5. Autophagy‐dependent and autophagy‐independent roles of p62 in TAK1 signaling.

- Confocal microscopic analysis of colocalization between GFP‐TAK1, p62, and LC3B in HeLa cells. Inset shows an enlarged image of the region bounded by the dashed lines. Arrow, punctum showing positivity for GFP‐TAK1, p62, and LC3B signals. Scale bar, 5 μm.
- Tandem fluorescence analysis of TAK1 localization to acidified compartments in cells. mCherry‐eGFP‐TAK1 was expressed in HeLa cells and analyzed by confocal microscopy. Intensity profile shows the “red” and “green” intensity of each pixel in the image. Lassoed area shows pixels with high red but low green pixel intensities, suggesting lysosomal localization. Scale bar, 5 μm.
- The effect of the indicated knockdowns on TAK1 and TAB2 abundance in HeLa cells. Following knockdown, cells were cultured under amino acid starvation conditions in the presence or absence of bafilomycin A1 (BafA1) for 3 h. Plots indicate the abundance of TAK1 and TAB2 relative to actin with data points representing independent biological replicates.
- HeLa cells were transfected with GFP‐p62 or GFP alone, fixed, and stained with anti‐p62. Left, representative image of cells expressing GFP or GFP‐p62. Blue mask, cell outline. Yellow mask, p62 bodies. Scale bar, 10 μm. Plot, high content imaging and analysis were used to determine the fluorescence intensity specifically from coalesced p62 (bodies) or the total anti‐p62 fluorescence intensity, which is the sum of anti‐p62 intensity from diffuse and coalesced p62. Whereas coalesced p62 contributes ˜50% of the anti‐p62 intensity in GFP expressing cells, coalesced p62 contributes ˜80% of the anti‐p62 signal in GFP‐p62 expressing cells.
- Effect of p62 over‐expression on the abundance of FLAG‐tagged TAK1 in HEK293T cells.
- Representative confocal microscopic images of the localization pattern of WT GFP‐p62 and of ΔPB1 GFP‐p62. Scale bar, 5 μm.
- Co‐immunoprecipitation analysis of the effect of p62 knockdown on the interaction between TAK1 or TAB2 and ubiquitin in HEK293T cell lysates.
Figure 4. TAK1 complex components are substrates of p62‐dependent selective autophagy.
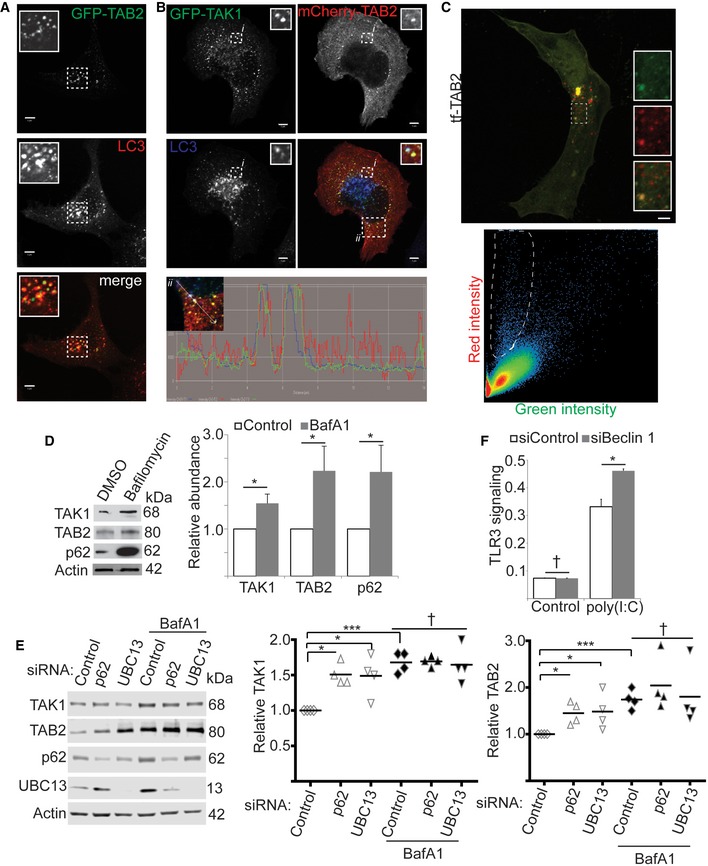
- Confocal microscopic analysis of colocalization between GFP‐TAB2 and autophagosome marker LC3B in HeLa cells treated with pp242 for 1 h. Inset shows a zoomed‐in image of the region inside the dash‐lined box. Scale bar, 5 μm.
- Triple colocalization analysis of GFP‐TAK1, mCherry‐TAB2, and LC3B in HeLa cells treated with pp242 for 1 h. Boxed region ii is shown in intensity profile below. A zoomed‐in view of the contents of boxed region i is shown in the inset. Scale bar, 5 μm.
- Tandem fluorescence analysis of TAB2 localization to acidified compartments in cells under basal autophagy conditions. mCherry‐eGFP‐TAB2 was expressed in HeLa cells and analyzed by confocal microscopy (top). Bottom, the “red” and “green” intensity of each pixel in the image are plotted. Lassoed area shows pixels with high red but low green pixel intensities, suggesting lysosomal localization. Scale bar, 5 μm.
- Effect of bafilomycin A1 (BafA1) treatment on the levels of the indicated proteins. HeLa cells were treated with Baf A1 or DMSO vehicle for 4 h under amino acid starvation conditions prior to cell lysis and immunoblotting. Graph indicates the relative abundance of each protein as determined by densitometry using actin as a loading control and normalizing to DMSO.
- The effect of p62 or UBC13 knockdown on the abundance of TAK1 and TAB2 in HeLa cells subjected to amino acid starvation and treated or not with bafilomycin A1 (BafA1) for 4 h. Graphs indicate the relative abundance of TAK1 or TAB2 as determined by densitometry with data points representing independent biological replicates.
- The effect of autophagy inhibition by Beclin 1 knockdown on signaling through the TLR3/TAK1 axis. TLR3 reporter cells were transfected with control siRNA or siRNA targeting Beclin 1 and treated or not with 1 μg ml−1 poly(I:C) overnight prior to determining the abundance of a chromogenic substrate. Shown, one representative experiment out of five.
p62 body formation protects TAK1 complexes from autophagy
The data above indicate that p62 is an autophagic receptor for TAK1 complexes, yet our findings also demonstrate that TAK1 promotes the formation of autophagy‐resistant p62 bodies and antagonizes the activities of p62 in selective autophagy. Thus, we tested how p62 body formation affects the autophagic degradation of TAK1. In these experiments, we used p62 over‐expression as a surrogate for p62 body formation because we found that p62 over‐expression increases the abundance of p62 bodies and that over‐expressed p62 is preferentially localized to coalesced structures (Fig EV5D). Increasing body formation by p62 over‐expression corresponded with increased abundance of endogenous and over‐expressed TAK1 in cells (Figs 5A and EV5E). However, expression of a mutant form of p62 that cannot form p62 bodies (▵PB1; Fig EV5F) does not have this effect on TAK1 abundance (Fig 5B). These data suggest that conditions favoring p62 body formation serve to spare TAK1 complexes from autophagic degradation.
Figure 5. TAK1 protects itself from autophagic degradation by driving p62 body formation.

-
AThe effect of p62 over‐expression on endogenous TAK1 protein levels in HEK293T cells. Cells were transfected with either mCherry‐p62 or mCherry alone prior to lysis and immunoblotting with the indicated antibodies. Graph shows the relative abundance of TAK1 relative to actin loading control.
-
BThe effect of p62 body‐deficient mutant ΔPB1 on the abundance of TAK1 in transiently transfected HEK293T cells. Plot, quantitation of the abundance of FLAG‐TAK1 as determined by densitometry relative to actin, data points each represent independent biological replicates.
-
CsiRNA screen of TRIM E3 ligases for roles in pp242‐induced p62 body formation in HeLa cells. Numbers indicate TRIM knockdowns that changed the abundance of p62 bodies by > 3 SD (black lines) from cells transfected with control siRNA (black diamonds, left) in two out of two experiments. LC3B, knockdown of LC3B. Shown, one representative experiment out of two. All “hits” shown were also “hits” in the other experiment.
-
DHigh content imaging and analysis of p62 bodies in HeLa cells subjected to control or TRIM5α knockdown under pp242‐induced (1 h) conditions. White mask, cell outline; yellow mask, p62 bodies. Scale bar, 10 μm.
-
EThe effect of TRIM5α knockdown on the abundance of the indicated proteins. Following control or TRIM5α knockdown, cells were starved and treated or not with bafilomycin A1 (BafA1) for 4 h prior to lysis and immunoblotting. Plot shows the abundance of the indicated proteins relative to actin.
-
F, GThe effect of HIV‐1 capsid on p62 coalescence and the abundance of TAK1, TAB2, and p62 in HeLa cells stably expressing RhTRIM5α‐HA. Cells were exposed to VSV‐G‐pseudotyped HIV‐1 (NL43 strain) for 1 h at 4°C and then 3 h at 37°C prior to being fixed and prepared for high content imaging of p62 bodies (F) or lysis and immunoblotting with the indicated antibodies (G).
Antiviral factor TRIM5α stimulates p62 body formation and prevents autophagic degradation of TAK1 complexes in response to retroviral capsid
We next considered factors that could influence p62 body formation and thereby promote TAK1 signaling. We focused on the tripartite motif (TRIM) family of proteins as candidates. Like p62, TRIMs have important roles in both transducing immune activating signals 47 and selective autophagy 48. Moreover, several TRIMs are reported to interact with p62 49, and TRIM21 is reported to inhibit p62 body formation under conditions of proteotoxic stress 50 while TRIM17 increases the abundance of p62 bodies under basal conditions 51. We performed an siRNA screen of human TRIMs to see whether knockdown of any TRIM could reduce the abundance of p62 bodies in HeLa cells (Fig 5C). In addition to TRIM17, we identified 5 TRIMs which when knocked down reduced the abundance of p62 bodies and an additional 6 TRIMs whose knockdown had the opposite effect. Of the TRIM “hits” where we saw a reduction in the number of p62 bodies upon knockdown, we chose to focus on TRIM5α since it has previously been reported to localize to p62 bodies 52 as well as interact with and activate TAK1 53, 54 and positively regulate autophagy 49. In follow‐up experiments, we confirmed that knocking down TRIM5α reduced the number of p62 bodies (Fig 5D). We next tested how TRIM5α knockdown affected the autophagic degradation of p62, TAK1, and TAB2 (Fig 5E) and found that protein levels of p62, TAK1, and TAB2 were all reduced in TRIM5α siRNA‐transfected cells under starvation‐induced autophagy conditions. These experiments found that the effect of TRIM5 knockdown was partially autophagy‐dependent as demonstrated by bafilomycin A1 protection, but also indicate that additional mechanisms (e.g., transcriptional and/or proteasomal) also contribute to TRIM5's ability to increase the protein levels of p62, TAK1, and TAB2. TRIM5α is well known as an anti‐retroviral restriction factor with rhesus macaque TRIM5α (RhTRIM5α) binding to the capsid of HIV‐1 and disabling the virus at a stage prior to integration of the viral genome 55. In conjunction with this antiviral activity, recognition of HIV‐1 capsid by RhTRIM5α potentiates TRIM5α's ubiquitin ligase activity, leading to the production of unattached K63‐linked polyubiquitin chains that activate TAK1 53. We found that infection of HeLa cells stably expressing RhTRIM5α with VSV‐G‐pseudotyped HIV‐1 modestly increased the abundance of both p62 bodies (Fig 5F) and the protein levels of TAK1 and TAB2 (Fig 5G). Thus, our data show that HIV‐1 detection by RhTRIM5α promotes p62 coalescence and the protection of TAK1 complexes from degradation. Together, these results support a model in which p62 localization to cytoplasmic bodies spares TAK1 from autophagic degradation under conditions favoring TAK1 signaling.
p62 promotes the assembly of active TAK1 complexes
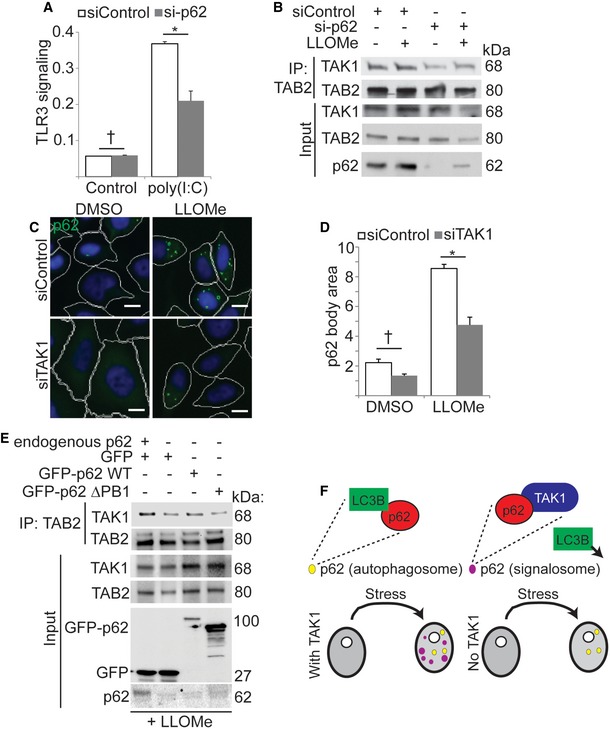
Given our findings that p62 promotes the autophagic degradation of TAK1 complexes and that inhibition of autophagy by Beclin 1 knockdown enhances signaling through the TLR3‐TAK1 axis, we expected that p62 knockdown would also enhance the responsiveness of TLR3 reporter cells to poly(I:C). However, we found that p62 knockdown reduced the activation of NF‐κB/AP1 transcriptional activity upon stimulation (Fig 6A). This hinted that p62 may also play a positive role in TAK1 signaling in addition to the inhibitory role described above. Accordingly, we found that p62 knockdown prevented the formation of TAK1/TAB2 complexes (Fig 6B). For these experiments, we used the lysosomotropic compound L‐leucyl‐L‐leucine methyl ester (LLOMe) since it potently activates both autophagy 56 and inflammation 57 by inducing lysosomal damage. LLOMe treatment also strongly induces p62 bodies in a TAK1‐dependent manner (Fig 6C and D). The assembly of TAK1/TAB2 complexes is promoted by LLOMe treatment in cells subjected to control knockdown (Fig 6B). However, in p62 knockdown cells, TAB2 is less efficient at immunoprecipitating TAK1 under both control and LLOMe conditions, demonstrating a role for p62 in TAK1 complex formation and activation. We also saw a reduction of TAK1‐TAB2 complex formation in HEK293T cells in which p62 had been deleted by CRISPR/Cas9 (Fig 6E). Restoration of wild‐type p62, but not of body‐deficient PB1‐deleted p62, restored the assembly of TAK1‐TAB2 complex formation in these cells. Assembly of active TAK1 complexes requires TAK1 and TAB2 binding to ubiquitin. We found that knocking down p62 slightly reduced the interaction between ubiquitin and both TAK1 and TAB2 in co‐immunoprecipitation studies (Fig EV5G). These results demonstrate that p62 promotes the assembly of active TAK1 complexes, thus playing a positive role in TAK1 signaling in addition to its autophagy‐dependent role in TAK1 degradation.
Figure 6. p62 promotes TAK1 activation.
-
AThe effect of p62 knockdown on signaling through the TLR3/TAK1 axis. TLR3 reporter cells were transfected with p62 or non‐targeting control siRNA and treated or not with 1 μg ml−1 poly(I:C) overnight prior to determining the abundance of a chromogenic substrate. Shown, one representative experiment out of four.
-
BCo‐immunoprecipitation analysis of the effect of p62 knockdown on the formation of active TAK1 complexes in control HEK293T cells and in cells treated with LLOMe for 1 h.
-
C, DHigh content imaging‐based analysis of the effect of TAK1 knockdown on LLOMe‐induced p62 bodies. HeLa cells were transfected with control or TAK1 siRNA prior to 1 h treatment with LLOMe. White mask, cell outline; green mask, p62 body; scale bar, 10 μm.
-
ECo‐immunoprecipitation analysis of the effect of wild type or ΔPB1 p62 expression on the interaction between TAK1 and TAB2. Control or p62 knockout HEK293T was transfected with GFP or GFP‐tagged p62 as indicated and treated with LLOMe for 1 h prior to lysis and immunoprecipitation with anti‐TAB2.
-
FModel of p62 and TAK1 coregulation. Top: p62 puncta in cells include autophagosomes (LC3B‐positive) and signalosomes (TAK1‐positive). TAK1 interferes with p62‐LC3B interactions. Bottom: under stress conditions, p62 signalosomes form in a TAK1‐dependent manner.
Discussion
In this study, we have shown that TAK1 controls the activities of p62, transitioning it away from functioning as a selective autophagy receptor and instead directing it toward promoting cellular signaling. Under stress conditions, TAK1 promotes p62 phosphorylation and drives its coalescence into cytoplasmic bodies, sparing it from autophagic degradation. This antagonizes p62's activities as an autophagy receptor, reducing the selective elimination of TAK1 complex components. When not acting as an autophagy receptor, p62 facilitates the formation of active TAK1 complexes. The requirement for p62 in TAK1 activation is in line with previous reports of p62 enhancing NF‐κB activation in response to a variety of stimuli 21, 25, 26, as TAK1 is upstream of NF‐κB. Overall, our findings mirror the results of a recent report in which p62 is switched from autophagy action to a signaling role, albeit by a different mechanism involving caspase 8‐dependent cleavage 58.
On the surface, our data may seem counterintuitive. For instance, the conditions that induce p62 body formation (e.g., mTOR inhibition with pp242 and lysosomal damage) also induce autophagy and consequent lysosomal degradation of p62. Furthermore, while we show here that TAK1 and TRIM5α protect p62 from autophagic degradation, it is known that both of these factors promote autophagy initiation 8, 9, 49, 59. We argue that our findings are consistent with a model in which TAK1 and upstream factors like TRIM5α both activate autophagy while simultaneously protecting a subset of substrates that otherwise would be depleted from the cell by induced autophagy. This mechanism, which we refer to as “deselective autophagy”, likely confers a negative selection capacity to the autophagy machinery beyond the positive selection carried out by autophagy receptors and allows the cell more precise control over which substrates are subject to degradation at a given time.
A recent study suggests that yeast may protect key enzymes from proteolysis during stress conditions by a mechanism analogous to what we propose here for TAK1 complexes 60. In this system, the yeast pyruvate kinase (Cdc19) forms degradation‐resistant coalesced structures in response to glucose starvation. Re‐supplementation of glucose disassembles these structures, yielding functional Cdc19 enzyme. The inability of yeast cells to generate these structures during stress depletes the cells of Cdc19, delaying their re‐entry into the cell cycle after being returned to favorable growth conditions. Here, we see coalesced structures (bodies) containing p62, TAK1, and TAB2 forming in response to a number of stresses. Assembly of these structures correlates with protection of their constituent proteins from degradation. Given our finding that p62 contributes to TAK1 activation, we speculate that p62 bodies are the sites where signal transduction takes place in a manner analogous to ASC specks involved in inflammasome function. This notion is further supported by the fact that the PB1 domain of p62, which we found to be required for its interactions with TAK1 and TAB2, is also required for p62 body formation 34 and for p62 signaling activities 61. Further study is required to determine how p62 bodies are resolved after being formed, as it is not known if they disassemble analogously to what is seen with Cdc19 or if they are somehow “licensed” to undergo autophagic removal.
The relationships seen here between TAK1 signaling, selective autophagy, and p62 are likely relevant to the large number of important biological processes that require TAK1 including T‐cell activation, inflammatory cytokine signaling, and pathogen detection; the latter exemplified here with the retroviral sensing factor RhTRIM5α and HIV‐1. In this case, TRIM5α was found to contribute to p62 body formation in response to pp242 and to protect p62, TAK1, and TAB2 from starvation‐induced autophagic degradation. Activation of RhTRIM5α by HIV‐1 capsid increased the abundance of p62 bodies and of cellular TAK1 and TAB2. TAK1 signaling contributes to HIV‐1 capsid‐specific restriction by RhTRIM5α 53, a process that is partly p62‐dependent 52. One important question is why pro‐autophagy and pro‐inflammatory pathways are so tightly linked with p62 at the intersection of the two. A possible explanation for the circuitry identified here is that it could help the cell prevent aberrant inflammatory signaling under normal conditions by the constitutive degradation of signaling factors such as TAK1 through basal autophagy while maintaining the cell's ability to mount a robust response under stress conditions that also activate autophagy. Further studies will be necessary to determine whether p62 body formation protects other immunity‐related signaling factors in addition to TAK1 (e.g., RIPK1).
Our study raises a number of mechanistic questions. Foremost among these is how TAK1 drives p62 body formation. Our studies demonstrated that TAK1 kinase activity is required for p62 body formation and that TAK1 increases p62 phosphorylation at several sites. Among these, phosphorylation of Ser‐403 has previously been implicated in promoting p62 body formation 42. TAK1 also mediates phosphorylation of Ser‐349 43. This will recruit KEAP1 and Cul3, which may increase p62 body formation by promoting ubiquitination of p62 at lysine 420 and consequently disrupting the inhibitory dimerization of the p62 UBA domain 62. However, TAK1 may also affect p62 body formation through additional modifications since we found that another kinase (TBK1), known to phosphorylate p62 at both Ser‐349 and Ser‐403 13, 15, is dispensable for p62 body formation in response to pp242 treatment. It remains unclear whether TAK1 is the kinase directly responsible for p62 phosphorylation or whether it is carried out by kinases acting downstream of TAK1 (such as p38 MAP kinases 63, 64). Further study will also be necessary to determine how p62 scaffolds TAK1 activation. However, since p62 interacts with a wide variety of ubiquitin ligases including TRAF6 22, members of the TRIM and Cullin families 28, 49, and SMURF1 65, a likely explanation is that p62 may stabilize interactions between TAK1 and upstream ubiquitin E3 ligases that promote TAK1 activation.
In conclusion, our study demonstrates that TAK1 governs p62 localization and affects the balance between p62's autophagy‐ and signaling‐related functions (Fig 6F). These actions may underlie the ability of the cell to optimize inflammatory signaling responses and reveal a novel approach to autophagy substrate specificity.
Materials and Methods
Cells and viruses
HeLa and HEK293T were obtained from ATCC and were cultured in DMEM containing 10% fetal calf serum and 100 U ml−1 penicillin and streptomycin. HeLa cells stably expressing HA‐tagged RhTRIM5α were obtained from NIH AIDS reagents and were maintained in the above media supplemented with puromycin (1 μg ml−1). ULK1/ULK2 knockout MEFs (gift from Sharon Tooze) and TAB2 knockout MEFs (gift from Shizuo Akira) along with corresponding wild‐type MEFs were cultured in DMEM containing 10% fetal calf serum supplemented with sodium pyruvate and non‐essential amino acids. HEK‐Blue hTLR3 cells (InvivoGen) were cultured according to the manufacturer's recommendations. Detection of TLR3 signaling in these cells was performed using the HEK‐Blue assay according to the manufacturer's protocol (InvivoGen). VSV‐G‐pseudotyped HIV‐1 (NL43 strain) was collected from the supernatants of HEK293T cells transfected with plasmids encoding VSV‐G and HIV‐1 lacking the Env gene. p62 knockout cells were generated in a HEK293T background by transfection with Sqstm1 CRISPR/Cas9 plasmid and a Sqstm1 homology‐directed DNA‐repair plasmid (Santa Cruz Biotechnology) that inserts RFP and puromycin resistance genes into the Cas9 cut site in Sqstm1. RFP‐positive cells were sorted and then maintained in the presence of puromycin (1 μg ml−1) and tested for loss of p62 expression by immunoblot.
Plasmids, siRNA, and transfection
TAK1 and TAB2 were PCR amplified from commercially available cDNA clones and recombined into pDONR221 using the BP reaction (Life Tech) prior to being recombined into pDest expression plasmids by LR cloning. All other plasmids have been previously published 66. All siRNA smart pools were from Dharmacon. With the exception of the siRNA transfections for the TRIM screen (with siRNA pre‐printed into the 96‐well plates and transfected using DharmaFECT reagent), siRNA was delivered to cells using Lipofectamine 2000 (Life Tech). Plasmid transfections were performed by either CaPO4 or Lipofectamine 2000. Samples were prepared for analysis the day after DNA transfection. For siRNA experiments, samples were prepared 48 h after siRNA transfection.
Treatments, inhibitors, and HIV‐1 infections
Amino acid starvation was performed using EBSS for 4 h at 37°C. Working concentrations for inhibitors were as follows: pp242 (LC labs), 10 μg ml−1; bafilomycin A1 (InvivoGen), 60 ng ml−1; puromycin (Sigma), 5 μg ml−1; LLOMe (MP Biomedicals), 1 mM; BX‐795 (Sigma), 10 nM; (5Z)‐7‐Oxozeaenol (Tocris); 10 μM; poly(I:C) high molecular weight (InvivoGen), 1 μg ml−1; MG132 (Selleckchem), 20 μM. Infections with pseudotyped HIV‐1 were performed as previously described 49. Briefly, RhTRIM5α expressing cells were incubated with pseudovirus (1.5 ng HIV‐1 p24 ml−1 in complete media) for 1 h at 4°C to allow virus to bind. Free virus was then removed by washing, and cells were incubated for 3 h in complete media prior to fixation or harvest. For mock infections, cell culture supernatant from untransfected HEK293T was diluted in complete media instead of pseudovirus‐containing supernatants. For imaging experiments with HIV‐1 infection, the virus‐containing media were supplemented with DAEA‐dextran 10 μg ml−1).
Co‐immunoprecipitation and immunoblotting
Most immunoprecipitation, immunofluorescent labeling, and immunoblots were as described 49, 67. For whole cell lysates, cell lysis was performed with a modified RIPA buffer containing 0.5% NP‐40, 1% Triton X‐100, and 0.5% SDS. For immunoprecipitation, cell lysis was performed with a buffer containing 1% NP‐40. Lysis buffers contained protease inhibitor cocktails (Roche), phosphatase inhibitor cocktails (Roche), and phenylmethylsulfonyl fluoride (PMSF; 1 mM). Primary antibodies used were as follows: Flag (Sigma), p62 (BD or Cell Signaling), GFP (Abcam), mCherry (Abcam), actin (Santa Cruz), ubiquitin (MBL), LC3B (MBL), NBR1 (Santa Cruz), TAK1 (Cell Signaling), TAB2 (Cell Signaling), phospho‐TAK1 (Cell Signaling and Invitrogen), UBC13 (Abcam), ATG7 (Cell Signaling), Beclin 1 (Santa Cruz and Cell Signaling), HA (Abcam), and phospho‐p62 (Cell Signaling). Secondary antibodies used were HRP‐conjugated goat anti‐mouse and goat anti‐rabbit (Bio‐Rad), fluorescently conjugated goat anti‐mouse and goat anti‐rabbit (LI‐COR), or Clean‐Blot HRP (Thermo Fisher). All densitometric quantitation of immunoblot signals were normalized to actin.
High content imaging
All high content experiments were performed on HeLa cells in 96‐well plate format. Following the indicated treatments, cells were fixed with 4% paraformaldehyde, permeabilized with saponin (0.2%), and immunofluorescently labeled. High content imaging and analysis were performed using a Cellomics HCS scanner and iDEV software (Thermo) > 500 cells were analyzed per treatment in quadruplicate per experiment. Cell outlines were automatically determined based on background nuclear staining with Hoechst 33342. The Colocalization BioApp was used for assays involving the quantitation of defined puncta/bodies (e.g., p62, ubiquitin) and for evaluating colocalization (Pearson's coefficient). Results are presented either as the mean number of puncta/bodies per cell or the total cross‐sectional area (in μm2) of puncta per cell. The SpotDetector BioApp was used for measuring the total anti‐p62 fluorescence per cell.
siRNA screen of TRIMs for roles in p62 body formation
HeLa cells were cultured in 96‐well plates containing siRNA smart pools against a subset of human TRIMs (or control siRNAs) and transfection reagent (Dharmacon) as described 51. Forty‐eight hours after plating, the cells were treated with pp242 for 30 min prior to fixation with paraformaldehyde. Cells were stained with Hoechst 33342 and antibodies as indicated. High content imaging was performed as described above. TRIMs whose knockdowns increased or decreased the number of p62 body per cell by > 3 SD from the mean of non‐targeting siRNA controls in two out of two experiments were considered hits.
Confocal microscopy
Cells were cultured on glass coverslips prior to being subjected to the indicated treatment. Samples were fixed with paraformaldehyde and permeabilized with saponin prior to labeling with the indicated antibodies. Images were acquired using a LSM510 Meta confocal microscope (Zeiss). For FRAP experiments, we used a Zeiss LSM800 microscope outfitted with live cell imaging capabilities and analyzed using Zen2 software (Zeiss).
Mass spectroscopy
HEK293T cells were transiently transfected with FLAG‐p62 and either GFP‐TAK1 or GFP alone. Cells were lysed and subjected to immunoprecipitation with anti‐FLAG. Immunoprecipitated material was then separated by SDS–PAGE and detected by colloidal blue staining (Thermo Fisher). The ~65 kDa FLAG‐p62 band was excised from the gels and proteolytically digested in‐gel with trypsin as described 68. Digested peptides were analyzed by LC‐MS/MS on a Thermo Scientific Q Exactive Plus Orbitrap Mass Spectrometer in conjunction with an EASY‐nLC 1200 UHPLC and Proxeon nanospray source operating in positive ionization mode. Peptides were loaded on a 100 μm × 25 mm Magic C18 100Å 5U reverse phase trap before being separated using a 75 μm × 150 mm Magic C18 200Å 3U reverse phase column. Peptides were eluted with an increasing percentage of acetonitrile over the course of a 90‐min gradient with a flow rate of 300 nl/min. An MS survey scan was obtained for the m/z range 350–1,600 and acquired with a resolution of 70,000 and a target of 1 × 10⁶ ions or a maximum injection time of 30 ms. MS/MS spectra were acquired using a top 15 method where the top 15 ions in the MS spectra were subjected to HCD (high‐energy collisional dissociation). MS/MS spectra were acquired with a resolution of 17,500 and a target of 5 × 10⁴ ions or a maximum injection time of 50 ms. An isolation mass window of 1.6 m/z was used for precursor ion selection, charge states 2–4 were accepted, and a normalized collision energy of 27% was used for fragmentation. A 20‐s duration was used for dynamic exclusion.
Raw DDA files were searched with Andromeda in MaxQuant (version 1.6.2.3) using default Orbitrap settings. Briefly, a target‐decoy search strategy was utilized against a human protein sequence database (downloaded March 4, 2019, from Uniprot.org) consisting of 73,948 protein sequences amended with 49 potential contaminants from the cRAP database of common laboratory contaminants (www.thegpm.org/crap) and an equal number of reverse decoys. Identifications were made at 1% protein, peptide, and site FDR with match between runs and second peptides enabled. Searches were configured for trypsin allowing for two missed cleavages and carbamidomethylation of Cys as a fixed modification. Up to five variable modifications were allowed per peptide including oxidation of Met and Trp, n‐terminal acetylation, and phosphorylation of Ser, Thr, and Tyr. Instrument parameters and match tolerances were set to Orbitrap defaults. Protein level label‐free quantitation was performed with the fast MaxLFQ algorithm using unique and razor peptides (not containing variable modifications) with a requirement for one shared peptide and large LFQ ratio stabilization enabled.
For total protein level differences, MaxQuant data output was loaded into Perseus version 1.6.0.2 for further processing and statistics. Proteins designated as reverse, contaminant, or only identified through a post‐translational modification site were removed from further processing. For identification, proteins required identification by at least one non‐redundant peptide (unique or razor) with MS/MS identification or matching. For quantitation, normalized LFQ protein intensities were used allowing for matching with a minimum of three non‐zero values from at least one group required to be considered valid. Intensity values were log base 2 transformed and remaining missing values imputed. For differential protein abundance between groups (TAK1 vs. GFP control), a Student's t‐test was performed with Benjamini–Hochberg (BH) FDR multiple testing correction using a significance threshold of 0.05. Utilizing this testing for total protein level differences, we determined that (as expected) only TAK1 and not p62 (SQSTM1) protein levels were statistically different between our two sample populations.
For peptide level phosphorylation site identification, site specificity required a localization probability of at least 95%. For quantitation, phospho‐site intensities were averaged (requiring at least three valid values in at least one group) and significance tested with a one‐ or two‐sample t‐test with a significance threshold of 0.05. Scaffold (version 4.8.4, Proteome Software Inc., Portland, OR) was used to manually validate MS/MS‐based phospho‐peptide identifications and neutral losses.
Quantitative RT–PCR
Total RNA was isolated from transfected cells using the TRIzol method (Life Technologies) and reverse transcribed into cDNA using random hexamers as primers (High‐Capacity cDNA Reverse Transcriptase Kit, Thermo Fisher). qPCR was performed using a StepOne Plus instrument (Applied Biosystems) relative to 18S rRNA as a housekeeping gene control for normalization. The qPCR assays used were obtained from Thermo Fisher (18S, Fn0464250_s1; SQSTM1 (p62), Hs01061917_g1; MAP3K7 (TAK1), Hs00177373_m1).
Statistical analysis
Two‐tailed t‐tests or ANOVA with Bonferroni post hoc analysis was used to test for statistical significance, which is determined by P < 0.05 from three or more independent experiments.
Author contributions
SRK, B‐LAS, BS, SWC, AWH, and MAM performed research; SRK, TJ, and MAM designed research and analyzed data, and SRK and MAM wrote the paper.
Conflict of interest
The authors declare that they have no conflict of interest.
Supporting information
Expanded View Figures PDF
Review Process File
Acknowledgements
M.A.M. supported by P20GM121176 and R21AI131964 from NIH. S.R.K. was supported by the Stephanie Ruby Predoctoral Travel Award. We thank Trond Lamark, Suresh Kumar, Aurore Claude‐Taupin, and Steven Bradfute for critically reading the manuscript and for suggestions.
EMBO Reports (2019) 20: e46238
Data availability
The mass spectroscopy data generated in the course of this study have been deposited in the MassIVE database (massive.ucsd.edu) and assigned the identifier MassIVE MSV000083679.
References
- 1. Baba M, Osumi M, Scott SV, Klionsky DJ, Ohsumi Y (1997) Two distinct pathways for targeting proteins from the cytoplasm to the vacuole/lysosome. J Cell Biol 139: 1687–1695 [DOI] [PMC free article] [PubMed] [Google Scholar]
- 2. Ravikumar B, Vacher C, Berger Z, Davies JE, Luo S, Oroz LG, Scaravilli F, Easton DF, Duden R, O'Kane CJ, et al (2004) Inhibition of mTOR induces autophagy and reduces toxicity of polyglutamine expansions in fly and mouse models of Huntington disease. Nat Genet 36: 585–595 [DOI] [PubMed] [Google Scholar]
- 3. Chen X, Khambu B, Zhang H, Gao W, Li M, Chen X, Yoshimori T, Yin XM (2014) Autophagy induced by calcium phosphate precipitates targets damaged endosomes. J Biol Chem 289: 11162–11174 [DOI] [PMC free article] [PubMed] [Google Scholar]
- 4. Xu Y, Jagannath C, Liu XD, Sharafkhaneh A, Kolodziejska KE, Eissa NT (2007) Toll‐like receptor 4 is a sensor for autophagy associated with innate immunity. Immunity 27: 135–144 [DOI] [PMC free article] [PubMed] [Google Scholar]
- 5. Deretic V, Saitoh T, Akira S (2013) Autophagy in infection, inflammation and immunity. Nat Rev Immunol 13: 722–737 [DOI] [PMC free article] [PubMed] [Google Scholar]
- 6. Mizushima N, Komatsu M (2011) Autophagy: renovation of cells and tissues. Cell 147: 728–741 [DOI] [PubMed] [Google Scholar]
- 7. Yang Z, Klionsky DJ (2010) Mammalian autophagy: core molecular machinery and signaling regulation. Curr Opin Cell Biol 22: 124–131 [DOI] [PMC free article] [PubMed] [Google Scholar]
- 8. Criollo A, Niso‐Santano M, Malik SA, Michaud M, Morselli E, Marino G, Lachkar S, Arkhipenko AV, Harper F, Pierron G, et al (2011) Inhibition of autophagy by TAB2 and TAB3. EMBO J 30: 4908–4920 [DOI] [PMC free article] [PubMed] [Google Scholar]
- 9. Takaesu G, Kobayashi T, Yoshimura A (2012) TGFbeta‐activated kinase 1 (TAK1)‐binding proteins (TAB) 2 and 3 negatively regulate autophagy. J Biochem 151: 157–166 [DOI] [PubMed] [Google Scholar]
- 10. Shi CS, Kehrl JH (2010) TRAF6 and A20 regulate lysine 63‐linked ubiquitination of Beclin‐1 to control TLR4‐induced autophagy. Sci Signal 3: ra42 [DOI] [PMC free article] [PubMed] [Google Scholar]
- 11. Nazio F, Strappazzon F, Antonioli M, Bielli P, Cianfanelli V, Bordi M, Gretzmeier C, Dengjel J, Piacentini M, Fimia GM, et al (2013) mTOR inhibits autophagy by controlling ULK1 ubiquitylation, self‐association and function through AMBRA1 and TRAF6. Nat Cell Biol 15: 406–416 [DOI] [PubMed] [Google Scholar]
- 12. Thurston TL, Boyle KB, Allen M, Ravenhill BJ, Karpiyevich M, Bloor S, Kaul A, Noad J, Foeglein A, Matthews SA, et al (2016) Recruitment of TBK1 to cytosol‐invading Salmonella induces WIPI2‐dependent antibacterial autophagy. EMBO J 35: 1779–1792 [DOI] [PMC free article] [PubMed] [Google Scholar]
- 13. Richter B, Sliter DA, Herhaus L, Stolz A, Wang C, Beli P, Zaffagnini G, Wild P, Martens S, Wagner SA, et al (2016) Phosphorylation of OPTN by TBK1 enhances its binding to Ub chains and promotes selective autophagy of damaged mitochondria. Proc Natl Acad Sci USA 113: 4039–4044 [DOI] [PMC free article] [PubMed] [Google Scholar]
- 14. Thurston TL, Ryzhakov G, Bloor S, von Muhlinen N, Randow F (2009) The TBK1 adaptor and autophagy receptor NDP52 restricts the proliferation of ubiquitin‐coated bacteria. Nat Immunol 10: 1215–1221 [DOI] [PubMed] [Google Scholar]
- 15. Pilli M, Arko‐Mensah J, Ponpuak M, Roberts E, Master S, Mandell MA, Dupont N, Ornatowski W, Jiang S, Bradfute SB, et al (2012) TBK‐1 promotes autophagy‐mediated antimicrobial defense by controlling autophagosome maturation. Immunity 37: 223–234 [DOI] [PMC free article] [PubMed] [Google Scholar]
- 16. Filomeni G, De Zio D, Cecconi F (2015) Oxidative stress and autophagy: the clash between damage and metabolic needs. Cell Death Differ 22: 377–388 [DOI] [PMC free article] [PubMed] [Google Scholar]
- 17. Sun N, Youle RJ, Finkel T (2016) The mitochondrial basis of aging. Mol Cell 61: 654–666 [DOI] [PMC free article] [PubMed] [Google Scholar]
- 18. Goodall ML, Fitzwalter BE, Zahedi S, Wu M, Rodriguez D, Mulcahy‐Levy JM, Green DR, Morgan M, Cramer SD, Thorburn A (2016) The autophagy machinery controls cell death switching between apoptosis and necroptosis. Dev Cell 37: 337–349 [DOI] [PMC free article] [PubMed] [Google Scholar]
- 19. Katsuragi Y, Ichimura Y, Komatsu M (2015) p62/SQSTM1 functions as a signaling hub and an autophagy adaptor. FEBS J 282: 4672–4678 [DOI] [PubMed] [Google Scholar]
- 20. Moscat J, Karin M, Diaz‐Meco MT (2016) p62 in cancer: signaling adaptor beyond autophagy. Cell 167: 606–609 [DOI] [PMC free article] [PubMed] [Google Scholar]
- 21. Sanz L, Diaz‐Meco MT, Nakano H, Moscat J (2000) The atypical PKC‐interacting protein p62 channels NF‐kappaB activation by the IL‐1‐TRAF6 pathway. EMBO J 19: 1576–1586 [DOI] [PMC free article] [PubMed] [Google Scholar]
- 22. Linares JF, Duran A, Yajima T, Pasparakis M, Moscat J, Diaz‐Meco MT (2013) K63 polyubiquitination and activation of mTOR by the p62‐TRAF6 complex in nutrient‐activated cells. Mol Cell 51: 283–296 [DOI] [PMC free article] [PubMed] [Google Scholar]
- 23. Duran A, Amanchy R, Linares JF, Joshi J, Abu‐Baker S, Porollo A, Hansen M, Moscat J, Diaz‐Meco MT (2011) p62 is a key regulator of nutrient sensing in the mTORC1 pathway. Mol Cell 44: 134–146 [DOI] [PMC free article] [PubMed] [Google Scholar]
- 24. Jin Z, Li Y, Pitti R, Lawrence D, Pham VC, Lill JR, Ashkenazi A (2009) Cullin3‐based polyubiquitination and p62‐dependent aggregation of caspase‐8 mediate extrinsic apoptosis signaling. Cell 137: 721–735 [DOI] [PubMed] [Google Scholar]
- 25. Paul S, Traver MK, Kashyap AK, Washington MA, Latoche JR, Schaefer BC (2014) T cell receptor signals to NF‐kappaB are transmitted by a cytosolic p62‐Bcl10‐Malt1‐IKK signalosome. Sci Signal 7: ra45 [DOI] [PMC free article] [PubMed] [Google Scholar]
- 26. Duran A, Linares JF, Galvez AS, Wikenheiser K, Flores JM, Diaz‐Meco MT, Moscat J (2008) The signaling adaptor p62 is an important NF‐kappaB mediator in tumorigenesis. Cancer Cell 13: 343–354 [DOI] [PubMed] [Google Scholar]
- 27. Jain A, Lamark T, Sjottem E, Larsen KB, Awuh JA, Overvatn A, McMahon M, Hayes JD, Johansen T (2010) p62/SQSTM1 is a target gene for transcription factor NRF2 and creates a positive feedback loop by inducing antioxidant response element‐driven gene transcription. J Biol Chem 285: 22576–22591 [DOI] [PMC free article] [PubMed] [Google Scholar]
- 28. Komatsu M, Kurokawa H, Waguri S, Taguchi K, Kobayashi A, Ichimura Y, Sou YS, Ueno I, Sakamoto A, Tong KI, et al (2010) The selective autophagy substrate p62 activates the stress responsive transcription factor Nrf2 through inactivation of Keap1. Nat Cell Biol 12: 213–223 [DOI] [PubMed] [Google Scholar]
- 29. Clausen TH, Lamark T, Isakson P, Finley K, Larsen KB, Brech A, Overvatn A, Stenmark H, Bjorkoy G, Simonsen A, et al (2010) p62/SQSTM1 and ALFY interact to facilitate the formation of p62 bodies/ALIS and their degradation by autophagy. Autophagy 6: 330–344 [DOI] [PubMed] [Google Scholar]
- 30. Pankiv S, Clausen TH, Lamark T, Brech A, Bruun JA, Outzen H, Overvatn A, Bjorkoy G, Johansen T (2007) p62/SQSTM1 binds directly to Atg8/LC3 to facilitate degradation of ubiquitinated protein aggregates by autophagy. J Biol Chem 282: 24131–24145 [DOI] [PubMed] [Google Scholar]
- 31. Zheng YT, Shahnazari S, Brech A, Lamark T, Johansen T, Brumell JH (2009) The adaptor protein p62/SQSTM1 targets invading bacteria to the autophagy pathway. J Immunol 183: 5909–5916 [DOI] [PubMed] [Google Scholar]
- 32. Stolz A, Ernst A, Dikic I (2014) Cargo recognition and trafficking in selective autophagy. Nat Cell Biol 16: 495–501 [DOI] [PubMed] [Google Scholar]
- 33. Rogov V, Dotsch V, Johansen T, Kirkin V (2014) Interactions between autophagy receptors and ubiquitin‐like proteins form the molecular basis for selective autophagy. Mol Cell 53: 167–178 [DOI] [PubMed] [Google Scholar]
- 34. Bjorkoy G, Lamark T, Brech A, Outzen H, Perander M, Overvatn A, Stenmark H, Johansen T (2005) p62/SQSTM1 forms protein aggregates degraded by autophagy and has a protective effect on huntingtin‐induced cell death. J Cell Biol 171: 603–614 [DOI] [PMC free article] [PubMed] [Google Scholar]
- 35. Itakura E, Mizushima N (2011) p62 Targeting to the autophagosome formation site requires self‐oligomerization but not LC3 binding. J Cell Biol 192: 17–27 [DOI] [PMC free article] [PubMed] [Google Scholar]
- 36. Zaffagnini G, Savova A, Danieli A, Romanov J, Tremel S, Ebner M, Peterbauer T, Sztacho M, Trapannone R, Tarafder AK, et al (2018) p62 filaments capture and present ubiquitinated cargos for autophagy. EMBO J 37: e98308 [DOI] [PMC free article] [PubMed] [Google Scholar]
- 37. Lim J, Lachenmayer ML, Wu S, Liu W, Kundu M, Wang R, Komatsu M, Oh YJ, Zhao Y, Yue Z (2015) Proteotoxic stress induces phosphorylation of p62/SQSTM1 by ULK1 to regulate selective autophagic clearance of protein aggregates. PLoS Genet 11: e1004987 [DOI] [PMC free article] [PubMed] [Google Scholar]
- 38. Wang C, Deng L, Hong M, Akkaraju GR, Inoue J, Chen ZJ (2001) TAK1 is a ubiquitin‐dependent kinase of MKK and IKK. Nature 412: 346–351 [DOI] [PubMed] [Google Scholar]
- 39. Delaney JR, Mlodzik M (2006) TGF‐beta activated kinase‐1: new insights into the diverse roles of TAK1 in development and immunity. Cell Cycle 5: 2852–2855 [DOI] [PubMed] [Google Scholar]
- 40. Lelouard H, Ferrand V, Marguet D, Bania J, Camosseto V, David A, Gatti E, Pierre P (2004) Dendritic cell aggresome‐like induced structures are dedicated areas for ubiquitination and storage of newly synthesized defective proteins. J Cell Biol 164: 667–675 [DOI] [PMC free article] [PubMed] [Google Scholar]
- 41. Lelouard H, Gatti E, Cappello F, Gresser O, Camosseto V, Pierre P (2002) Transient aggregation of ubiquitinated proteins during dendritic cell maturation. Nature 417: 177–182 [DOI] [PubMed] [Google Scholar]
- 42. Sun D, Wu R, Zheng J, Li P, Yu L (2018) Polyubiquitin chain‐induced p62 phase separation drives autophagic cargo segregation. Cell Res 28: 405–415 [DOI] [PMC free article] [PubMed] [Google Scholar]
- 43. Hashimoto K, Simmons AN, Kajino‐Sakamoto R, Tsuji Y, Ninomiya‐Tsuji J (2016) TAK1 regulates the Nrf2 antioxidant system through modulating p62/SQSTM1. Antioxid Redox Signal 25: 953–964 [DOI] [PMC free article] [PubMed] [Google Scholar]
- 44. Wu H, Fuxreiter M (2016) The structure and dynamics of higher‐order assemblies: amyloids, signalosomes, and granules. Cell 165: 1055–1066 [DOI] [PMC free article] [PubMed] [Google Scholar]
- 45. Kawai T, Akira S (2007) Antiviral signaling through pattern recognition receptors. J Biochem 141: 137–145 [DOI] [PubMed] [Google Scholar]
- 46. Jiang Z, Zamanian‐Daryoush M, Nie H, Silva AM, Williams BR, Li X (2003) Poly(I‐C)‐induced Toll‐like receptor 3 (TLR3)‐mediated activation of NFkappa B and MAP kinase is through an interleukin‐1 receptor‐associated kinase (IRAK)‐independent pathway employing the signaling components TLR3‐TRAF6‐TAK1‐TAB2‐PKR. J Biol Chem 278: 16713–16719 [DOI] [PubMed] [Google Scholar]
- 47. Jefferies C, Wynne C, Higgs R (2011) Antiviral TRIMs: friend or foe in autoimmune and autoinflammatory disease? Nat Rev Immunol 11: 617–625 [DOI] [PubMed] [Google Scholar]
- 48. Kimura T, Mandell M, Deretic V (2016) Precision autophagy directed by receptor regulators ‐ emerging examples within the TRIM family. J Cell Sci 129: 881–891 [DOI] [PMC free article] [PubMed] [Google Scholar]
- 49. Mandell MA, Jain A, Arko‐Mensah J, Chauhan S, Kimura T, Dinkins C, Silvestri G, Munch J, Kirchhoff F, Simonsen A, et al (2014) TRIM proteins regulate autophagy and can target autophagic substrates by direct recognition. Dev Cell 30: 394–409 [DOI] [PMC free article] [PubMed] [Google Scholar]
- 50. Pan JA, Sun Y, Jiang YP, Bott AJ, Jaber N, Dou Z, Yang B, Chen JS, Catanzaro JM, Du C, et al (2016) TRIM21 ubiquitylates SQSTM1/p62 and suppresses protein sequestration to regulate redox homeostasis. Mol Cell 61: 720–733 [DOI] [PMC free article] [PubMed] [Google Scholar]
- 51. Mandell MA, Jain A, Kumar S, Castleman MJ, Anwar T, Eskelinen EL, Johansen T, Prekeris R, Deretic V (2016) TRIM17 contributes to autophagy of midbodies while actively sparing other targets from degradation. J Cell Sci 129: 3562–3573 [DOI] [PMC free article] [PubMed] [Google Scholar]
- 52. O'Connor C, Pertel T, Gray S, Robia SL, Bakowska JC, Luban J, Campbell EM (2010) p62/sequestosome‐1 associates with and sustains the expression of retroviral restriction factor TRIM5alpha. J Virol 84: 5997–6006 [DOI] [PMC free article] [PubMed] [Google Scholar]
- 53. Pertel T, Hausmann S, Morger D, Zuger S, Guerra J, Lascano J, Reinhard C, Santoni FA, Uchil PD, Chatel L, et al (2011) TRIM5 is an innate immune sensor for the retrovirus capsid lattice. Nature 472: 361–365 [DOI] [PMC free article] [PubMed] [Google Scholar]
- 54. Tareen SU, Emerman M (2011) Human Trim5 alpha has additional activities that are uncoupled from retroviral capsid recognition. Virology 409: 113–120 [DOI] [PMC free article] [PubMed] [Google Scholar]
- 55. Stremlau M, Owens CM, Perron MJ, Kiessling M, Autissier P, Sodroski J (2004) The cytoplasmic body component TRIM5alpha restricts HIV‐1 infection in Old World monkeys. Nature 427: 848–853 [DOI] [PubMed] [Google Scholar]
- 56. Maejima I, Takahashi A, Omori H, Kimura T, Takabatake Y, Saitoh T, Yamamoto A, Hamasaki M, Noda T, Isaka Y, et al (2013) Autophagy sequesters damaged lysosomes to control lysosomal biogenesis and kidney injury. EMBO J 32: 2336–2347 [DOI] [PMC free article] [PubMed] [Google Scholar]
- 57. Lima H Jr, Jacobson LS, Goldberg MF, Chandran K, Diaz‐Griffero F, Lisanti MP, Brojatsch J (2013) Role of lysosome rupture in controlling Nlrp3 signaling and necrotic cell death. Cell Cycle 12: 1868–1878 [DOI] [PMC free article] [PubMed] [Google Scholar]
- 58. Sanchez‐Garrido J, Sancho‐Shimizu V, Shenoy AR (2018) Regulated proteolysis of p62/SQSTM1 enables differential control of autophagy and nutrient sensing. Sci Signal 11: eaat6903 [DOI] [PubMed] [Google Scholar]
- 59. Herrero‐Martin G, Hoyer‐Hansen M, Garcia‐Garcia C, Fumarola C, Farkas T, Lopez‐Rivas A, Jaattela M (2009) TAK1 activates AMPK‐dependent cytoprotective autophagy in TRAIL‐treated epithelial cells. EMBO J 28: 677–685 [DOI] [PMC free article] [PubMed] [Google Scholar]
- 60. Saad S, Cereghetti G, Feng Y, Picotti P, Peter M, Dechant R (2017) Reversible protein aggregation is a protective mechanism to ensure cell cycle restart after stress. Nat Cell Biol 19: 1202–1213 [DOI] [PubMed] [Google Scholar]
- 61. Moscat J, Diaz‐Meco MT, Wooten MW (2009) Of the atypical PKCs, Par‐4 and p62: recent understandings of the biology and pathology of a PB1‐dominated complex. Cell Death Differ 16: 1426–1437 [DOI] [PMC free article] [PubMed] [Google Scholar]
- 62. Lee Y, Chou TF, Pittman SK, Keith AL, Razani B, Weihl CC (2017) Keap1/Cullin3 modulates p62/SQSTM1 activity via UBA domain ubiquitination. Cell Rep 19: 188–202 [DOI] [PMC free article] [PubMed] [Google Scholar]
- 63. Zhang C, Gao J, Li M, Deng Y, Jiang C (2018) p38delta MAPK regulates aggresome biogenesis by phosphorylating SQSTM1 in response to proteasomal stress. J Cell Sci 131: jcs216671 [DOI] [PubMed] [Google Scholar]
- 64. Linares JF, Duran A, Reina‐Campos M, Aza‐Blanc P, Campos A, Moscat J, Diaz‐Meco MT (2015) Amino acid activation of mTORC1 by a PB1‐domain‐driven kinase complex cascade. Cell Rep 12: 1339–1352 [DOI] [PMC free article] [PubMed] [Google Scholar]
- 65. Barrios‐Rodiles M, Brown KR, Ozdamar B, Bose R, Liu Z, Donovan RS, Shinjo F, Liu Y, Dembowy J, Taylor IW, et al (2005) High‐throughput mapping of a dynamic signaling network in mammalian cells. Science 307: 1621–1625 [DOI] [PubMed] [Google Scholar]
- 66. Lamark T, Perander M, Outzen H, Kristiansen K, Overvatn A, Michaelsen E, Bjorkoy G, Johansen T (2003) Interaction codes within the family of mammalian Phox and Bem1p domain‐containing proteins. J Biol Chem 278: 34568–34581 [DOI] [PubMed] [Google Scholar]
- 67. Chauhan S, Ahmed Z, Bradfute SB, Arko‐Mensah J, Mandell MA, Won Choi S, Kimura T, Blanchet F, Waller A, Mudd MH, et al (2015) Pharmaceutical screen identifies novel target processes for activation of autophagy with a broad translational potential. Nat Commun 6: 8620 [DOI] [PMC free article] [PubMed] [Google Scholar]
- 68. Herren AW, Weber DM, Rigor RR, Margulies KB, Phinney BS, Bers DM (2015) CaMKII phosphorylation of Na(V)1.5: novel in vitro sites identified by mass spectrometry and reduced S516 phosphorylation in human heart failure. J Proteome Res 14: 2298–2311 [DOI] [PMC free article] [PubMed] [Google Scholar]
Associated Data
This section collects any data citations, data availability statements, or supplementary materials included in this article.
Supplementary Materials
Expanded View Figures PDF
Review Process File
Data Availability Statement
The mass spectroscopy data generated in the course of this study have been deposited in the MassIVE database (massive.ucsd.edu) and assigned the identifier MassIVE MSV000083679.