Abstract
Breast cancer (BC) is the most common malignancy in women and is one of the leading causes of cancer-associated deaths. The analysis of data obtained from online databases revealed that RILPL2 expression in BC tissues is lower than that in normal tissues, and that RILPL2 upregulation is correlated with prolonged recurrence-free survival (RFS), overall survival (OS), and distant metastasis-free survival (DMFS). However, the function of RILPL2 in tumor proliferation and metastasis remains unclear. In this study, we demonstrated that RILPL2 had lower expression in BC tissues than in adjacent normal tissues, and that RILPL2 expression was significantly negatively correlated with tumor size, histological grade, and lymph node metastasis. Univariate analysis showed a positive correlation between RILPL2 and estrogen receptor (ER) expression and a negative correlation between RILPL2 and human epidermal growth factor receptor 2 (HER2) expression. Overexpression of RILPL2 inhibited BC cell proliferation and metastasis in vitro and in vivo. In addition, the interaction of exogenous RILPL2 with TUBB3 resulted in the downregulation of BC cell proliferation and migration and upregulation of PTEN expression by promoting destabilization of TUBB3. Furthermore, RILPL2 could reverse BC cell resistance to taxotere-mediated apoptosis by regulating the TUBB3/PTEN/AKT pathway. In conclusion, these results suggest that RILPL2 could be a novel biomarker for the diagnosis and treatment of BC.
Keywords: Breast cancer, RILPL2, TUBB3, metastasis, chemoresistance, prognosis
Introduction
Breast cancer is one of the most common cancers in women, accounting for approximately 522,000 deaths worldwide in 2012 [1]. The comprehensive treatment of BC can significantly improve its prognosis. However, owing to the biological complexity of BC, the most widely used clinicopathological markers (estrogen receptor [ER], progesterone receptor [PR], human epidermal growth factor receptor 2 [HER2], and Ki-67) are not sufficient to fully evaluate the treatment response, metastasis pattern, and clinical outcome [2]. Therefore, the identification of novel and effective biomarkers may improve BC prognosis and provide new therapeutic strategies.
The Rab-interacting lysosomal protein-like 2 (RILPL2) gene encodes a protein that contains a Rab-interacting lysosomal protein-like domain similar to that of RILP. The formation of the Rab7/Rab34 complex promotes the interaction between RILP and dynein-dynactin to guide late endosome and lysosome movement towards microtubules [3]. Unlike RILP, RILPL2 does not consist of a Rab7 junction region, which prevents its ectopic expression from the lysosomal compartment [4]. Although RILPL2 does not affect lysosomal trafficking, it may still act as a functional Rab effector due to its interaction with activated Rab34 and Rab36 [5,6]. Lise et al. [7] used reduced RILPL2 mutation or inhibited MyoVa function to show that disruption of the RILPL2-MyoVa interaction inhibits the activity of RILPL2 and subsequent activation of Rac1. Therefore, MyoVa-mediated transport is important for RILPL2 function in neuronal regulation. Furthermore, RILPL2 plays a role in viral replication and can serve as a potential target for HCV treatment [8]. We recently analyzed genes that differ in expression between cancer and adjacent normal tissues using the ONCOMINE database, which contains considerable data for clinical BC samples. We observed that RILPL2 mRNA expression is significantly reduced in the majority of BC samples. However, the functional mechanism of RILPL2 in BC has not been studied before. Therefore, in this study, we have examined the expression pattern of RILPL2 in BC, investigated its biological functions, and correlated obtained results with BC patient treatment.
Materials and methods
Human specimens
A total of 180 pathologically confirmed BC patients at the Affiliated Hospital of Hebei University of Engineering were recruited between January 2012 and December 2014, and a further 7 patients between January 2018 and February 2018. The selection criteria were as described previously [9,10]. The study was conducted in accordance with the Declaration of Helsinki, and the Ethics Committee of the Affiliated Hospital of Hebei University of Engineering approved the protocol.
Human BC cell lines and plasmids
MCF-7, MDA-MB-231, HCC1937, T-47D, and SKBR-3 cell lines were purchased from American Type Culture Collection (USA) and were cultured in RPMI-1640 supplemented with 10% fetal calf serum (FCS). MCF-10A cells were cultured in DMEM/F12 (Invitrogen) supplemented with 5% horse serum and incubated in an atmosphere containing 5% CO2 at 37°C. Recombinant retroviruses carrying PLNCX2, PLNCX2-RILPL2, or TUBB3 vectors were synthesized based on relevant instructions (Clontech). MDA-MB-231 or T-47D cells treated with polybrene [8 mM (Sigma-Aldrich)] were infected with these retroviruses and were subsequently selected with G418 [750 mM (Calbiochem)].
RNA interference
Recombinant lentiviruses encoding short-hairpin RNAs (shRNAs) specific for human RILPL2 or TUBB3 were designed and prepared by GeneChem (Shanghai, China). RILPL2 target sequence (RILPL2-shRNA#1) used here was: 5’-GCTGCAGGAACGCAACAAACT-3’; RILPL2-shRNA#2 used here was: 5’-GGCCTGATTCCACCAAGAGAA-3’; TUBB3-shRNA used here was: 5’-GCACGTTGCTCATCAGCAAGG-3’, and scrambled (scr)-shRNA, used as a negative control, target sequence was: 5’-TTCTCCGAACGTGTCACGTTT-3’. Lentiviruses were transfected into cells based on relevant instructions. The efficiency of RILPL2 and TUBB3 knockdown was assessed using real-time quantitative PCR or western blotting. A transfection efficiency greater than 80% was considered stable.
IHC analyses
All antibodies, including rabbit polyclonal anti-human RILPL2 antibody and mouse monoclonal anti-human ER, PR, and HER2 antibodies, were purchased from AbCam. After staining, the protein levels of RILPL2, ER, and HER2 were examined according to the criteria described previously [9,10]. Two independent pathologists performed the analyses.
Real-time PCR
For reverse transcription, total RNA was extracted with Trizol reagent according to manufacturer’s instructions (Invitrogen). Real-time PCR was performed using the following primers to examine RILPL2 expression levels: RILPL2, forward: 5’-GGTCTCTTAGTTACGATGGTA-3’, reverse: 5’-GCAGCCTCATTAGTTCCTT-3’; GAPDH (control), forward: 5’-TGACTTCAACAGCGACACCCA-3’, reverse: 5’-CACCCTGTTGCTGTAGCCAAA-3’.
Co-immunoprecipitation and immunoblotting
Cells were collected and lysed with lysis buffer containing 20 mM Tris-HCl pH 7.4, 150 mM NaCl, 1% TritonX-100, and protease inhibitors. Total protein concentration was determined using a BCA Protein Assay Kit (Pierce). Cell extracts (2-3 mg) were incubated with the rabbit anti-human RILPL2 antibody for 2 h at 4°C, followed by incubation with protein G Plus-agarose for 2 h. The resultant immunoprecipitates were washed five times with lysis buffer, subjected to 10% SDS-PAGE, and transferred to PVDF membranes for immunoblotting. The membranes were blocked in 5% milk/TBS-Tween for 1 h at room temperature, followed by overnight incubation with the primary antibody at 4°C and subsequent incubation with the secondary antibody for 2 h at room temperature. Proteins were visualized by enhanced chemiluminescence (Amersham) and the results were quantified using Image-J (NIH). The rabbit antibodies used to detect RILPL2 and TUBB3 were obtained from AbCam (Cambridge, UK). The rabbit antibodies used to detect XIAP, cleaved caspase 9, AKT, p-AKT, and PTEN were obtained from Cell Signaling (Beverly, MA, USA).
MTT assay
Cells (1.5 × 10⁴ cells/mL) were plated in 96-well plates and were allowed to grow for 2 to 5 days. Cell proliferation rates were determined using the MTT assay. For each time point, 10 mL MTT (5 M) was added per well and the samples were incubated for 4 h. Subsequently, 100 µL DMSO was added per well and the reaction was measured using a microplate reader at 490 nm. Three replicate wells were used for each sample.
Wound healing assay
A marker pen was used to draw uniform horizontal lines on the back of the 6-well plate. Approximately 2 × 10⁵ cells were added and the gun head was scratched the following day. Cells were washed with PBS for three times and were incubated with serum-free medium in an atmosphere containing 5% CO2 at 37°C. Samples were collected at 0, 8, and 24 h, and images were captured.
Invasion assay
Chambers were placed in a 24-well plate and 500 μL serum-free medium was added to the upper and lower chambers. A serum-free cell suspension containing 5 × 10⁴ cells/well (500 μL) was added to the upper chamber and 750 μL of 30% FBS medium was added to the lower chamber. The cells were incubated at 37°C for 24 h and were stained with hematoxylin and eosin (H&E). Cell images were captured under a microscope.
Transwell assay
A serum-free cell suspension containing 5 × 10⁴ cells/well (24-well plate) was prepared. Culture medium was removed from the upper chamber and was replaced with 100 μL cell suspension, and in the lower chamber, 600 μL of 30% FBS medium was added. The cells were incubated at 37°C for 24 h. Subsequently, the chamber was fixed in 4% paraformaldehyde for 30 min. A staining solution (1-2 drops) was used to stain cells for 1-3 min. Cell images were captured under a microscope.
Caspase-3 activity assay
The RIPA buffer was used to lyse cells and BCA protein analysis (Pierce) was used to quantify the protein concentration. Caspase-3 activity was measured using AC-DEVD PNA (Beyotime) after incubating 200 µg of cell lysate at 37°C for 2 h. Absorption was measured at 405 nm using a fluorescent star Optima microplate reader (BMG Labtech, Cary, NC, USA).
Cell apoptosis analysis
The cells collected after PBS washing were stained with annexin V and propidium iodide (PI) using the annexin V-PI detection kit (Roche, Mannheim, Germany). Apoptosis was measured by flow cytometry (BD Biosciences, San Jose, California, USA).
Tumor growth and metastasis in nude mice
Four- to six-week-old female nude mice were obtained from Shanghai Lingchang Biological Technology Ltd. (Shanghai, China). RILPL2-overexpressing MDA-MB-231 cells were injected into the flanks of BALB/c female nude mice (8 mice/group). All mice were monitored every 7 days and were sacrificed after 7 weeks, following which tumor volume and weight were quantified.
For the in vivo metastasis experiment, RILPL2-overexpressing cells were injected into the caudal vein. Nude mice were anesthetized by isoflurane gas using an in vivo imaging instrument with a gas anesthesia system. The mice were sacrificed at 10 weeks after treatment, and metastatic lung nodules were counted.
For the in vivo chemoresistance experiment, RILPL2-overexpressing MDA-MB-231 cells were injected into the flanks of BALB/c female nude mice (10 mice/group). Each group was randomly divided into the following two subgroups in the second week: mice that were left untreated and mice who received intraperitoneal injections of taxotere (10 mg kg-1) (for 3 cycles), as previously described by Ghebeh et al. [11] and Zhang et al. [12]. Animal handling and research protocols were approved by the Animal Care and Use Committee of the Affiliated Hospital of Hebei University of Engineering.
ONCOMINE analysis
RILPL2 mRNA expression in BCs was determined by analyzing data from the ONCOMINE database (www.oncomine.org). In our study, BC specimen data were compared with control datasets using the Student’s t-test to determine the p-value. Fold change was defined as 2, and the p value was set at 0.01.
CCLE analysis
RILPL2 mRNA levels in breast cancer were analyzed based on the CCLE database (https://portals.broardinstitute.org/ccle/home), which is an online data set containing 947 sequencing data of human cancer cell lines to help identify genes associated with cancer or drug sensitivity.
Kaplan-Meier survival analysis plotter
The prognostic values of RILPL2 expression levels in BC samples were examined by determining the RFS, OS, and DMFS using the Kaplan-Meier plotter (http://kmplot.com/analysis/) [13]. Kaplan-Meier survival curve, log-rank p-value, and HR with 95% confidence intervals were calculated and plotted in R using Bio-conductor packages.
Statistical analysis
The SPSS 23.0 software was used for statistical analyses. Categorical variables were compared using the Student’s t-test, Wilcoxon rank sum, and Pearson’s correlation tests. A P value of < 0.05 was considered significant.
Results
RILPL2 expression is reduced in BC
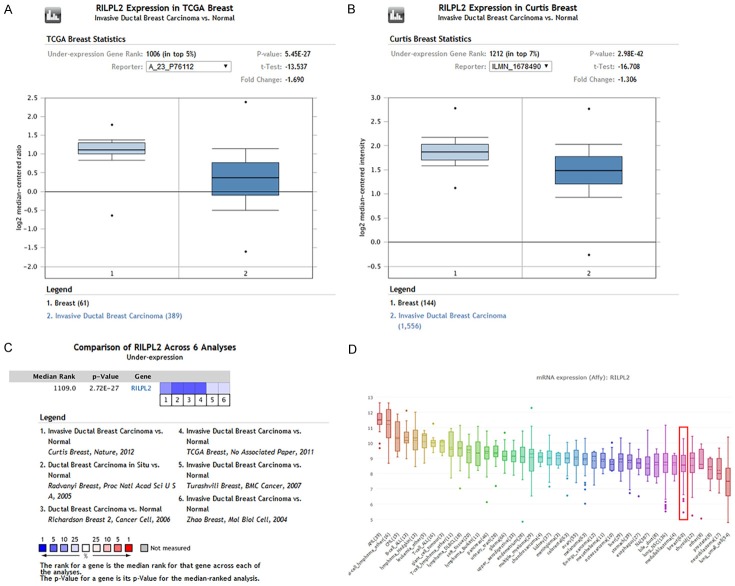
RILPL2 mRNA expression was significantly lower in BC samples than in normal samples, both of which were obtained from a large number of data sets by ONCOMINE analysis. RILPL2 mRNA expression in BC tissue was reduced by 1.690-fold and 1.306-fold compared to that in normal tissue from 450 samples and in another dataset of 1700 samples obtained from TCGA and Curtis database, respectively (Figure 1A, 1B). The pooled results of the six clinical cohorts showed a significant decrease in RILPL2 expression in BC (P = 2.72E-27; Figure 1C). In addition, we performed CCLE analysis to compare RILPL2 mRNA expression in tumor tissues from other organs. We found that RILPL2 mRNA expression was low in the BC cell lines (Figure 1D).
Figure 1.
Analysis of RILPL2 mRNA expression in breast cancer. Boxed plots from the ONCOMINE database were used to compare the expression of RIPL2 mRNA in normal tissues and BC tissues. The p value was set to 0.01. A. RILPL2 mRNA expression from TCGA database. B. RILPL2 mRNA expression from Curtis database. C. Meta-analysis of gene expression profiling for RILPL2 in BC using ONCOMINE, with P < 0.05 and fold change > 1.5. The colored squares indicate the median rank for RILPL2 across each analysis comparing BC with normal tissue. D. CCLE analysis showed that the expression level of RILPL2 mRNA was lower in BC cell lines (shown in red frame).
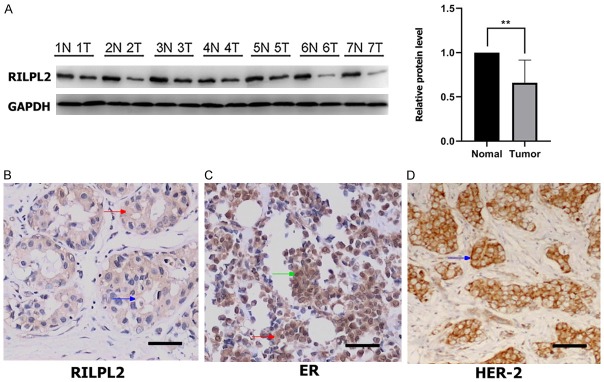
RILPL2 protein expression in seven BC tissues and seven adjacent non-tumor tissues was assessed using western blotting. As shown in Figure 2A, RILPL2 protein expression was significantly lower in BC tissues than in the adjacent normal breast tissues (P < 0.01).
Figure 2.
Low expression of RILPL2 in human breast cancer. (A) Western blotting was used to verify the expression of RIPL2 protein in the matched normal (N) and cancer (T) regions in BC patients. The expression of RILPL2, ER, and HER2 as assessed by immunohistochemical staining was shown in (B-D), respectively. Green arrows indicated nuclear staining; red arrows indicated cytoplasmic staining; blue arrows indicated membrane staining. Results were showed as means ± SD. The statistical significance was assessed by Student’s t-test; **P < 0.01.
IHC was performed to confirm this finding and to investigate the localization of RILPL2 in BC tissues. RILPL2 was primarily stained in the cytoplasm and membranes of BC tissues. ER staining occurred mainly in the nucleus and to a lesser extent in the cytoplasm, while HER2 staining was localized to the cellular membrane. Examples of the upregulated expression of RILPL2, ER, and HER2 are shown in Figure 2B-D, respectively.
IHC revealed a RILPL2-positive expression rate of 32.78% (59/180) in BC tissues, which was significantly lower than 66.7% (60/90), observed in the adjacent normal breast tissues (P = 0.000). Moreover, the positive expression of RILPL2 protein was negatively correlated with tumor size, histological grade, and lymph node metastasis of BC (P = 0.001, P = 0.014, and P = 0.021, respectively; Table 1).
Table 1.
The relationship between RILPL2 expression and the clinicopathological factors (n = 180)
| Varible | n | RILPL2- | RILPL2+ | p varible |
|---|---|---|---|---|
| Tissue | 0.000 | |||
| Cancer tissue | 180 | 121 | 59 | |
| Adjacent tissue | 90 | 30 | 60 | |
| Age | 0.343 | |||
| ≥ 40 | 152 | 100 | 52 | |
| < 40 | 28 | 21 | 7 | |
| Tumor size | 0.001 | |||
| T1 | 38 | 18 | 20 | |
| T2 | 112 | 78 | 34 | |
| T3, 4 | 30 | 25 | 5 | |
| Histological grades | 0.014 | |||
| I | 20 | 11 | 9 | |
| II | 65 | 38 | 27 | |
| III | 95 | 72 | 23 | |
| Lymph node metastasis | 0.021 | |||
| Negative | 67 | 38 | 29 | |
| Positive | 113 | 83 | 30 |
“+”, positive; “-”, negative.
RILPL2 expression correlates with molecular subtypes and clinical IHC markers
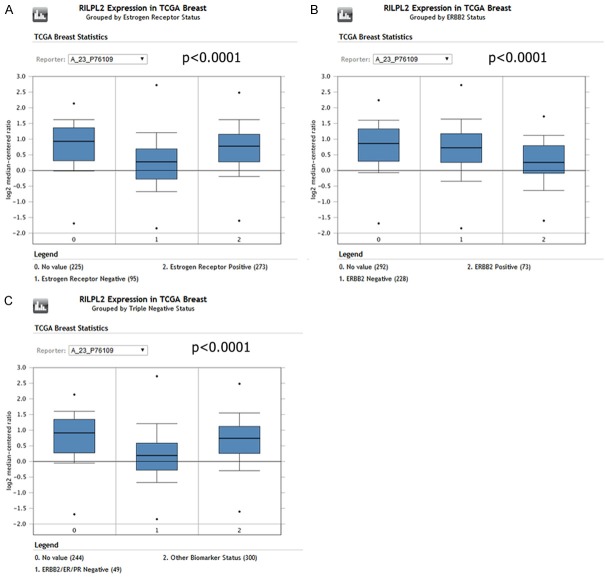
ONCOMINE analysis of TCGA data showed that RILPL2 mRNA expression is significantly higher in ER-positive (ER+) BC patients than in ER-negative (ER-) BC patients (P < 0.0001; Figure 3A). In addition, RILPL2 expression in the HER2+ and TNBC (triple-negative BC) subtypes was significantly lower than in the HER2- and other subtypes of BC in the TCGA database (P < 0.0001; Figure 3B, 3C).
Figure 3.
RILPL2 mRNA expression in different molecular subtypes of breast cancer. A. RILPL2 expression in 95 ER-negative and 273 ER-positive breast cancer tissues using ONCOMINE analysis (P < 0.0001). B. RILPL2 expression in 228 HER2-negative and 73 HER2-positive breast cancer tissues using ONCOMINE analysis (P < 0.0001). C. RILPL2 expression in 49 TNBC and 300 other subtype breast cancer tissues using ONCOMINE analysis (P < 0.0001).
Furthermore, univariate analysis showed that RILPL2 expression was high in ER+ cases (P = 0.002; Table 2) and low in HER2+ cases (P = 0.023; Table 2).
Table 2.
Correlations between RILPL2 expression and immunohistochemical markers
| Varible | n | RILPL2- | RILPL2+ | p varible |
|---|---|---|---|---|
| ER | 0.002 | |||
| - | 58 | 48 | 10 | |
| + | 122 | 73 | 49 | |
| PR | 0.1 | |||
| - | 64 | 48 | 16 | |
| + | 116 | 73 | 43 | |
| HER2 | 0.023 | |||
| - | 137 | 86 | 51 | |
| + | 43 | 35 | 8 |
“+”, positive; “-”, negative. ER, estrogen receptor; HER2, human epidermal growth factor receptor 2; PR, progesterone receptor.
RILPL2 expression correlates with favorable prognosis in BC
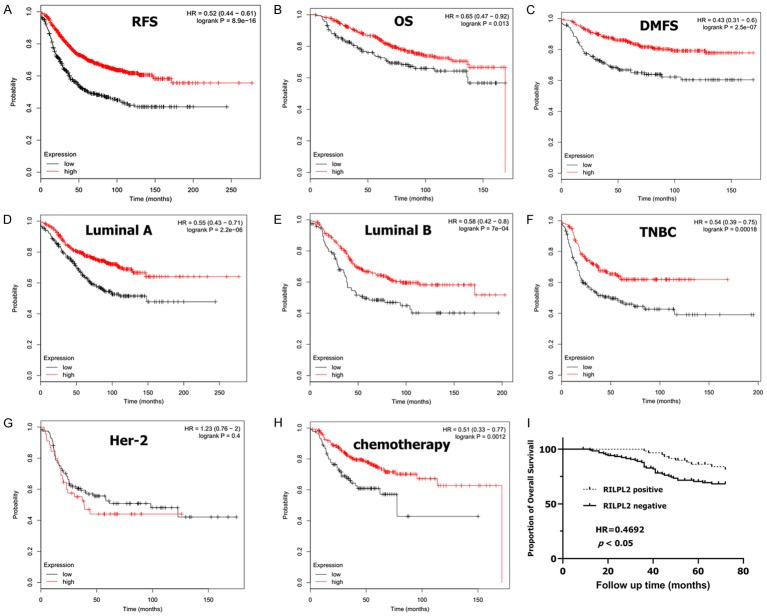
We then estimated the prognostic value of RILPL2 in BC using the Kaplan-Meier survival analysis plotter. High expression of RILPL2 mRNA correlated with increased RFS, OS, and DMFS in BC patients (HR = 0.52, P = 8.9e-16; HR = 0.65, P = 0.013; HR = 0.43, P = 2.5e-07; Figure 4A-C). Sub-analysis showed that high expression of RILPL2 mRNA was significantly correlated with better RFS in luminal A, luminal B, and TNBC subtypes of BC (HR = 0.55, P = 2.2e-06; HR = 0.58, P = 7e-04; HR = 0.54, P = 0.00018). However, no significant correlation was found between high RILPL2 expression and better RFS in the HER2 subtype of BC (HR = 1.23, P = 0.4; Figure 4D-G). Notably, we also found that elevated RILPL2 mRNA expression was significantly associated with better RFS in patients receiving chemotherapy (HR = 0.51, P = 0.0012), suggesting that RILPL2 may possess functions in the chemosensitivity of BC cells (Figure 4H).
Figure 4.
The prognostic values of RILPL2 in breast cancer. (A-C) High mRNA level of RILPL2 was associated with increases in (A) RFS, (B) OS, and (C) DMFS in BC patients. (D-G) High RILPL2 mRNA level was associated with increased RFS in luminal A, luminal B and TNBC subtype BC patients, but not in HER2 subtype BC patients. (H) High RILPL2 mRNA level was associated with increased RFS in BC patients who had received chemotherapy. (I) Kaplan-Meier survival curves showed the OS in 180 BC patients in relation to RILPL2 expression.
Furthermore, we obtained patient follow-up data and found that 45 out of 180 patients had died, with a 6-year OS rate of 85.0%. Of the 45 patients that had died, RILPL2 expression was downregulated in 35, while only 10 patients died with upregulated RILPL2 expression. As shown in Table 1, 59 out of 180 BC samples exhibited RILPL2 positive expression and 121 exhibited RILPL2 negative expression. Kaplan-Meier analysis showed that the OS of patients with RILPL2 positive expression was significantly higher than that of patients with RILPL2 negative expression in their BC samples (log-rank test, P < 0.05, Hazard Ratio = 0.4692, 95% CI of ratio = 0.2569-0.8570; Figure 4I).
RILPL2 regulates BC cell proliferation and migration in vitro
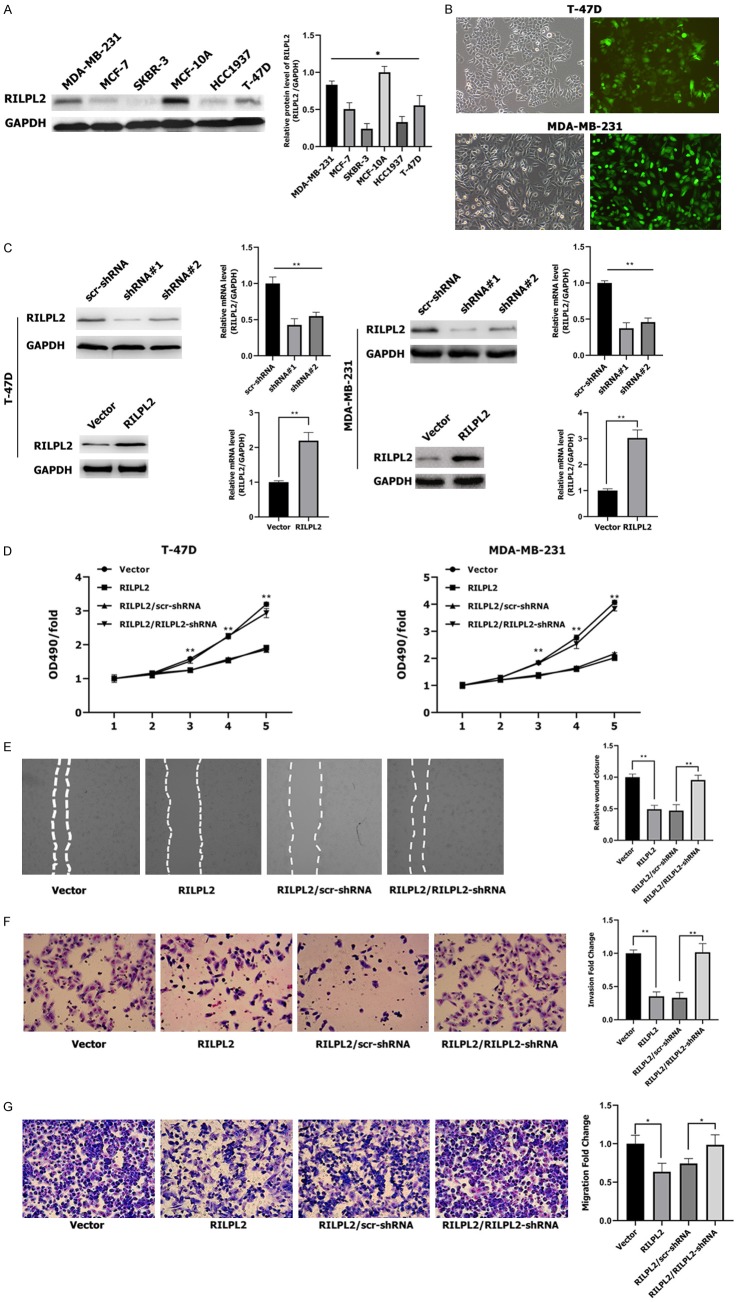
Western blotting results revealed that RILPL2 protein expression levels were lower in the five BC cell lines-MDA-MB-231, T-47D, HCC1937, MCF-7, and SKBR-3-than in the non-tumorigenic breast epithelial cell line MCF-10A (p < 0.05; Figure 5A). In addition, RILPL2 protein expression levels were higher in MDA-MB-231 and T-47D cell lines than in the other three BC cell lines (P < 0.05; Figure 5A). Therefore, we selected MDA-MB-231 and T-47D cell lines for subsequent knockdown or overexpression studies.
Figure 5.
Effects of RILPL2 on BC cell proliferation, migration, and invasiveness in vitro. (A) Levels of RILPL2 protein were analyzed by western blotting in five breast cancer cell lines and one untransformed breast cell line. (B) T-47D and MDA-MB-231 cells infected with RILPL2-shRNA lentivirus were examined by fluorescence microscopy 3 days post-infection. (C) RILPL2 protein and mRNA expression levels were examined by western blotting and qPCR in T-47D and MDA-MB-231 cells after infection with lentivirus containing RILPL2-shRNA or pLNCX2-RILPL2. (D-G) RILPL2-shRNA or scr-shRNA were transfected into RILPL2-overexpressing T-47D and MDA-MB-231 cells. Cell growth rate monitored by MTT assay (D) in T-47D and MDA-MB-231 cells. Cell wound (E), invasiveness, (F) and migration (G) were monitored in MDA-MB-231 cells (n = 3). The statistical significance was assessed by Student’s t-test; *P < 0.05, **P < 0.01.
We performed RILPL2 knockdown or overexpression in T-47D and MDA-MB-231 cells, and the infection efficiency was above 80% at 72 h post-infection with RILPL2-shRNA (Figure 5B). Immunoblotting and qPCR analysis revealed that RILPL2 protein and mRNA expression were both significantly decreased upon RILPL2-shRNA transfection compared to scr-shRNA transfection. However, RILPL2 protein and mRNA expression significantly increased upon RILPL2 overexpression in T-47D and MDA-MB-231 cells (P < 0.01; Figure 5C). RILPL2 overexpression significantly inhibited cell proliferation, as assessed by the MTT assay in both T-47D and MDA-MB-231 cell lines (P < 0.01; Figure 5D). However, co-transfection of RILPL2-shRNA into the two RILPL2-overexpressing BC cell lines completely restored cell proliferation levels (P < 0.01; Figure 5D). Next, wound healing assays, invasion assays, and transwell assays were performed to evaluate the role of RILPL2 in BC cell migration. MDA-MB-231 cells overexpressing RILPL2 migrated much slower than the control cells, whereas co-transfection of RILPL2-shRNA into the RILPL2-overexpressing MDA-MB-231 cells completely restored cell migration ability (P < 0.05, Figure 5E-G). These results indicate that RILPL2 controls the growth and migratory ability of BC cells in vitro.
RILPL2 regulates BC cell proliferation and migration in vivo
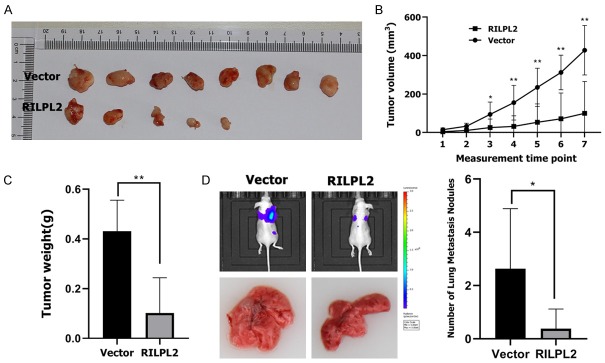
We next studied whether RILPL2 could control the proliferation and migration of BC cells in vivo. RILPL2-overexpressing MDA-MB-231 cells and their corresponding control cells were injected into nude mice, and tumor growth was recorded for seven weeks before the mice were sacrificed. The volume of RILPL2-overexpressing MDA-MB-231 tumors over the duration of the experiment was significantly smaller than that in the control group (P < 0.05; Figure 6A, 6B). Consistent with these data, RILPL2-overexpressing MDA-MB-231 tumors weighed significantly less than the control tumors at the end of the experiment (P < 0.01; Figure 6C). To investigate the potential role of RILPL2 in metastasis in vivo, RILPL2-overexpressing MDA-MB-231 cells were injected into the caudal vein of nude mice, observed for 10 weeks, and quantified in the metastatic lung nodules. We found that RILPL2 overexpression in MDA-MB-231 cells could significantly reduce lung metastatic nodules (P < 0.05; Figure 6D). In conclusion, these results show that RILPL2 may regulate the growth and metastasis of BC cells in vivo.
Figure 6.
Effects of RILPL2 on BC cell proliferation and metastasis in vivo. (A-C) RILPL2-overexpressing MDA-MB-231 cells were injected into the flanks of nude mice. Tumor growth (A) and tumor volume (B) were measured on the indicated days. (C) Tumor weights were measured after mice were sacrificed. (D) RILPL2-overexpressing MDA-MB-231 cells were injected into the caudal vein of the nude mice. The mice were sacrificed 10 weeks later, and their metastatic lung nodules were quantified. Results are presented as means ± SD. The statistical significance was assessed by Student’s t-test; *P < 0.05, **P < 0.01.
RILPL2 inhibits BC cell proliferation and migration by downregulating TUBB3 stability
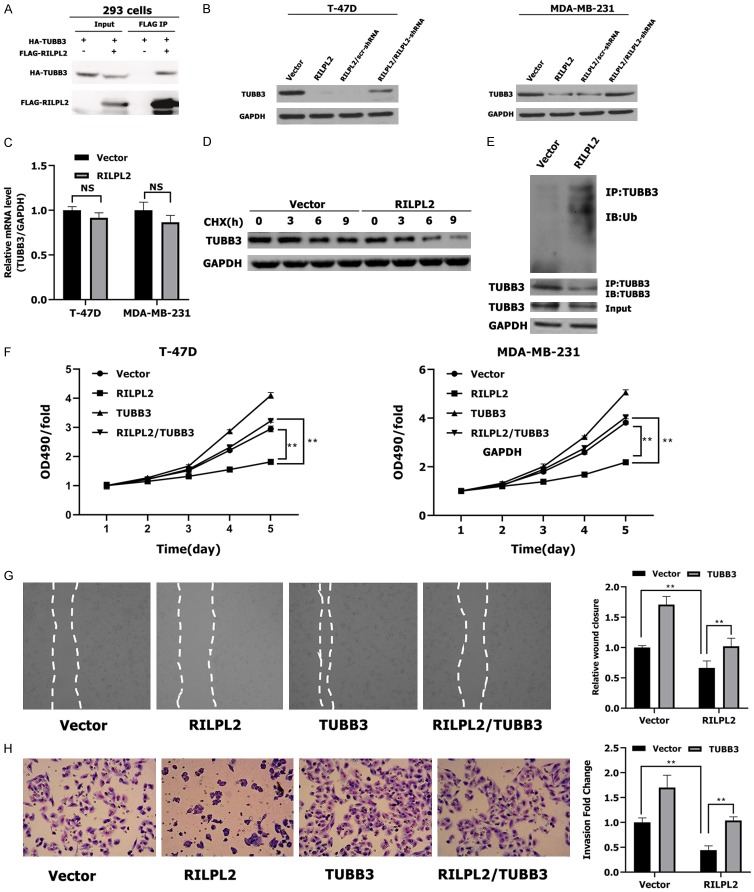
To identify target proteins downstream of RILPL2, we used the Pathway Commons Protein-Protein Interactions dataset (http://amp.pharm.mssm.edu/Harmonizome/). This dataset identified CAND1, HEXDC, TUBB4A, and Class III-tubulin (III-tubulin, TUBB3) as potential interactors of RILPL2 [14]. On further investigation, we could not measure the interaction of RILPL2 with CAND1, HEXDC, or TUBB4A in BC cells (data not shown). However, we performed the co-immunoprecipitation assay and found that exogenous RILPL2 interacted with TUBB3 in 293 cells (Figure 7A). Moreover, RILPL2 overexpression inhibited protein expression of TUBB3 in T-47D and MDA-MB-231 BC cells (P < 0.01; Figure 7B). Co-transfection of RILPL2-shRNA into the RILPL2-overexpressing MDA-MB-231 cells completely restored TUBB3 expression (P < 0.01; Figure 7B). In addition, RILPL2 overexpression did not alter TUBB3 mRNA expression (Figure 7C). Therefore, RILPL2 may regulate TUBB3 protein expression on a posttranslational level. To test this hypothesis, we determined whether RILPL2 altered TUBB3 stability by treating MDA-MB-231 cells with cycloheximide (CHX) to inhibit protein synthesis. The overexpression of RILPL2 induced TUBB3 degradation in MDA-MB-231 cells (Figure 7D), which suggests that RILPL2 destabilizes TUBB3 in BC cells. In support of this notion, RILPL2 overexpression promoted TUBB3 ubiquitination (Figure 7E).
Figure 7.
RILPL2 inhibits BC cell proliferation and migration by down-regulating TUBB3 stability. (A) Exogenous interaction between RILPL2 and TUBB3 in 293 cells by co-immunoprecipitation. (B) RILPL2-shRNA or scr-shRNA were transfected into RILPL2-overexpressing T-47D and MDA-MB-231 cells. TUBB3 expression was examined by western blotting (n = 3). (C) Level of TUBB3 mRNA was examined by qPCR in RILPL2-overexpressing T-47D and MDA-MB-231 cells. (D) RILPL2 mediated TUBB3 stabilization in BC cells. RILPL2-expressing MDA-MB-231 cells were treated with CHX (50 μM) for the indicated times and analyzed for endogenous TUBB3 by western blotting. (E) RILPL2 overexpression increased TUBB3 ubiquitination in breast cancer cells. HA-Ubiquitin was electroporated into Vector- or RILPL2-overexpressing MDA-MB-231 cells. Cells were treated with MG132 (20 μM) for 2 h. TUBB3 complex in resulting lysates was examined using an antibody against Ubiquitin (Ub). (F-H) Vector or TUBB3 were transfected into RILPL2-expressing T-47D and MDA-MB-231 cells. Cell growth rate (F) monitored by MTT assay in T-47D and MDA-MB-231 cells. Cell wound (G) and invasiveness (H) were monitored in MDA-MB-231 cells (n = 3). Results are presented as means ± SD. The statistical significance was assessed by Student’s t-test; *P < 0.05, **P < 0.01.
To investigate whether TUBB3 is a primary target of RILPL2 in regulating BC cell proliferation and migration, endogenous TUBB3 was overexpressed in RILPL2-transfected T-47D and MDA-MB-231 cells. We observed that the RILPL2-induced inhibition of cell proliferation and migration was reversed by TUBB3 overexpression in T-47D and MDA-MB-231 cells, as assessed by MTT, invasion and wound assays in MDA-MB-231 cells (P < 0.01; Figure 7F-H). These results reveal that RILPL2 inhibits the proliferation and migration of BC cells by downregulating TUBB3 stability.
RILPL2 positively regulates PTEN expression by destabilizing TUBB3
Loss of PTEN is observed in many primary cancers, including BC, and often leads to activation of the PI3K/AKT pathway [15,16]. Joshua et al. [17] have reported that TUBB3 can inhibit PTEN expression and activate the AKT pathway in non-small cell lung cancer. Therefore, we tested whether TUBB3 could regulate PTEN expression in BC cells. First, we confirmed that TUBB3 protein expression was significantly downregulated in TUBB3-shRNA-T47D and -MDA-MB-231 cells, and that re-expression of TUBB3 in TUBB3-shRNA-T47D and -MDA-MB-231 cells restored its protein levels (Figure 8A). Strikingly, BC cells with stable TUBB3 knockdown displayed significantly increased PTEN expression (Figure 8A). Moreover, restoration of TUBB3 expression abolished the increase in PTEN expression, thus confirming that TUBB3 can regulate the expression of PTEN in BC cells (Figure 8A).
Figure 8.
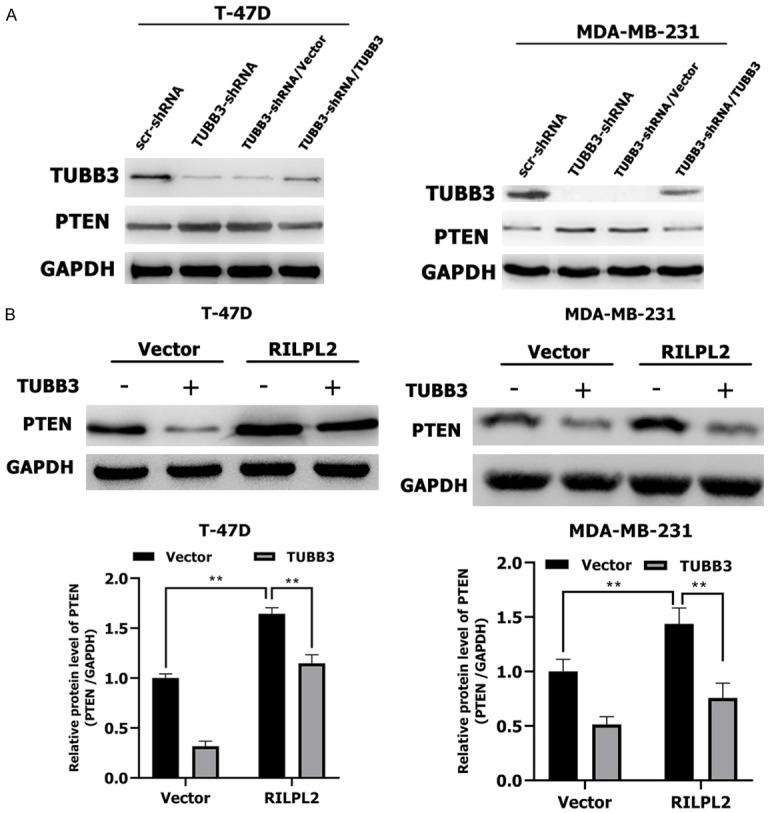
RILPL2 positively regulates PTEN expression by down-regulating TUBB3 protein. A. Vector or TUBB3 were transfected into TUBB3-shRNA-expressing T-47D and MDA-MB-231 cells. TUBB3 and PTEN expression were examined by western blotting (n = 3). B. Vector or TUBB3 were transfected into RILPL2-overexpressing T-47D and MDA-MB-231 cells. PTEN expression was examined by western blotting (n = 3). Results are presented as means ± SD. The statistical significance was assessed by Student’s t-test; *P < 0.05, **P < 0.01.
Our previous results revealed that RILPL2 expression negatively correlates with HER2 expression in BC. The HER2/PTEN/AKT pathway is critical in the carcinogenesis of BC [18]. However, some studies have also demonstrated the importance of the PTEN/PI3K/AKT pathway in ER+ HER2- and TNBC subtypes of BC [19-21]. To identify the relationship between RILPL2 and this pathway, we overexpressed TUBB3 in RILPL2-overexpressing T-47D and MDA-MB-231 cells. Cells transfected with nonfunctional vector served as controls. Strikingly, we found that RILPL2 could promote protein expression of PTEN in BC cells (p < 0.01; Figure 8B). However, PTEN expression was significantly decreased by overexpression of TUBB3 (P < 0.01; Figure 8B). These results suggest that RILPL2 may positively regulate PTEN expression by destabilizing TUBB3.
RILPL2 reverses BC cell resistance to taxotere-mediated apoptosis by downregulating the TUBB3/PTEN/AKT pathway
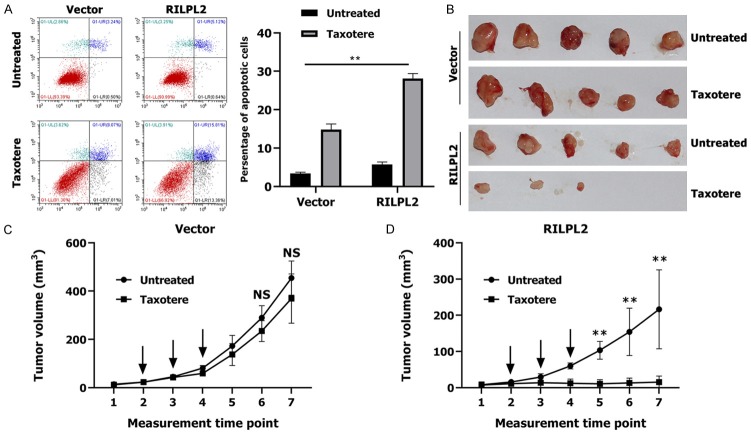
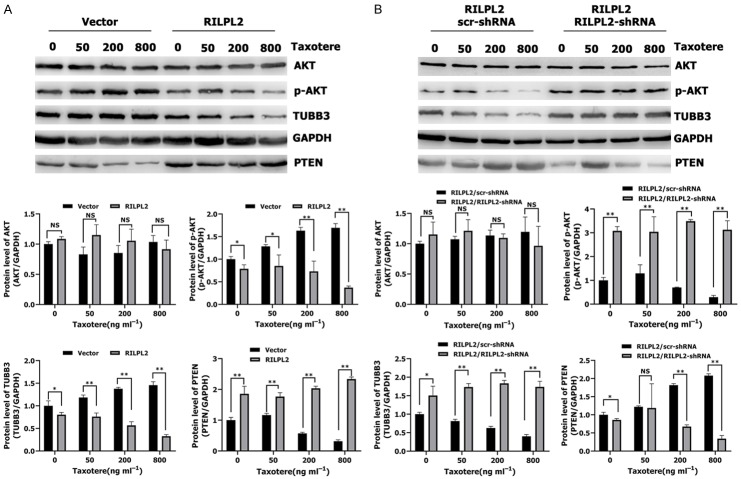
Triple-negative breast cancer (TNBC) has poorer clinical characteristics than other subtypes of BC. TNBC tumors proliferate faster, relapse earlier, metastasize easily, and are therefore associated with poorer prognosis [22-24]. There is currently no effective target drug available for TNBCs; cytotoxic chemotherapy remains the main adjuvant therapy for TNBCs [25]. A few studies have found that TUBB3 plays an important role in conferring resistance to paclitaxel-based chemotherapy [26-28]. We have demonstrated that elevated RILPL2 mRNA expression is significantly associated with better RFS in patients receiving chemotherapy, suggesting that RILPL2 may possess some functions in the chemosensitivity of BC cells (Figure 4H). To evaluate whether RILPL2 can directly alleviate resistance to chemotherapy in TNBC cells, we treated RILPL2-overexpressing MDA-MB-231 cells with the common microtubule-targeting chemotherapeutic agent taxotere (docetaxel). Apoptosis rate was significantly higher in RILPL2-overexpressing MDA-MB-231 cells than in control cells following treatment with 200 ng/mL taxotere (P < 0.01; Figure 9A). Then, we used RILPL2-overexpressing MDA-MB-231 cells (or control MDA-MB-231 cells) in a xenograft tumor model (Figure 9B). The size of tumors formed by the control cells was slightly reduced upon taxotere treatment (P > 0.05, Figure 9C); however, the size of the tumors formed by RILPL2-overexpressing cells was significantly reduced upon taxotere treatment (P < 0.05, Figure 9D). These results indicate that RILPL2 expression is directly related to the decrease in chemoresistance. Meanwhile, treatment of RILPL2-overexpressing MDA-MB-231 cells with taxotere induced a decrease in TUBB3 and p-AKT expression levels and an increase in PTEN expression levels in a dose-dependent manner (Figure 10A). The protein levels of TUBB3 and p-AKT in RILPL2-overexpressing cells were significantly lower than in control cells following treatment with various doses of taxotere (P < 0.05; Figure 10A). In contrast, the protein levels of PTEN were significantly higher in RILPL2-overexpressing cells than in control cells following treatment with various doses of taxotere (P < 0.01; Figure 10A). However, co-transfection of RILPL2-shRNA into the RILPL2-overexpressing MDA-MB-231 cells completely restored TUBB3 and p-AKT expression, and reduced PTEN expression in a dose-dependent manner (P < 0.05; Figure 10B). In addition, no change was detected in total AKT expression (P > 0.05; Figure 10A, 10B). These results show a significant correlation between RILPL2 expression and inhibition of TUBB3/PTEN/AKT signaling for chemotherapy by the increased expression of PTEN and decreased AKT phosphorylation in response to RILPL2 overexpression upon taxotere treatment.
Figure 9.
RILPL2 overexpression sensitised BC cells to chemotherapy. (A) The dot map of double dyeing was displayed after treatment of vector- and RILPL2-expressing MDA-MB-231 cells without or with 200 ng ml-1 of Taxotere for 24 h. (B-D) vector- or RILPL2-expressing MDA-MB-231 cells were injected into mice as described previously. Tumor growth (B) and tumor volume (C, D) were measured on the indicated days. The arrows showed the time of Taxotere injection. Results are presented as means ± SD. The statistical significance was assessed by Student’s t-test; *P < 0.05, **P < 0.01.
Figure 10.
RILPL2 reverses BC cell resistance to Taxotere by downregulating the TUBB3/PTEN/AKT pathway. A, B. RILPL2-shRNA or scr-shRNA were transfected into RILPL2-overexpressing MDA-MB-231 cells following treatment with various doses of Taxotere for 24 h. Levels of TUBB3, AKT, p-AKT and PTEN were examined by western blotting in MDA-MB-231 cells (n = 3). Results are presented as means ± SD. The statistical significance was assessed by Student’s t-test; *P < 0.05, **P < 0.01.
X-linked apoptotic protein inhibitor (XIAP) is a member of the apoptotic protein inhibitor (IAP) family and its expression is regulated by upstream AKT [11,29]. We therefore tested whether RILPL2-mediated inhibition of AKT signaling resulted in decreased expression of XIAP. Treatment of RILPL2-overexpressing MDA-MB-231 cells with taxotere decreased XIAP levels in a dose-dependent manner (P < 0.01; Figure 11A). However, co-transfection of RILPL2-shRNA into the RILPL2-overexpressing MDA-MB-231 cells completely restored XIAP expression in a dose-dependent manner (P < 0.01; Figure 11B). Studies have shown that XIAP can act on caspase 9 and caspase 3. Caspase 9 directly regulates the intrinsic apoptosis pathway, while caspase 3 is important for apoptosis and activation of poly (ADP ribose) polymerase (PARP), which is major protein involved in cellular death [11,29]. In contrast to decreased XIAP expression, the active levels of caspase 9 (P < 0.01; Figure 11B) and caspase 3 (P < 0.01; Figure 11C) were significantly increased in RILPL2-overexpressing cells upon taxotere treatment. Therefore, our results show that RILPL2-mediated chemosensitivity in BC cells is correlated with downregulation of TUBB3/PTEN/AKT signaling and concurrent upregulation of proapoptotic factors.
Figure 11.
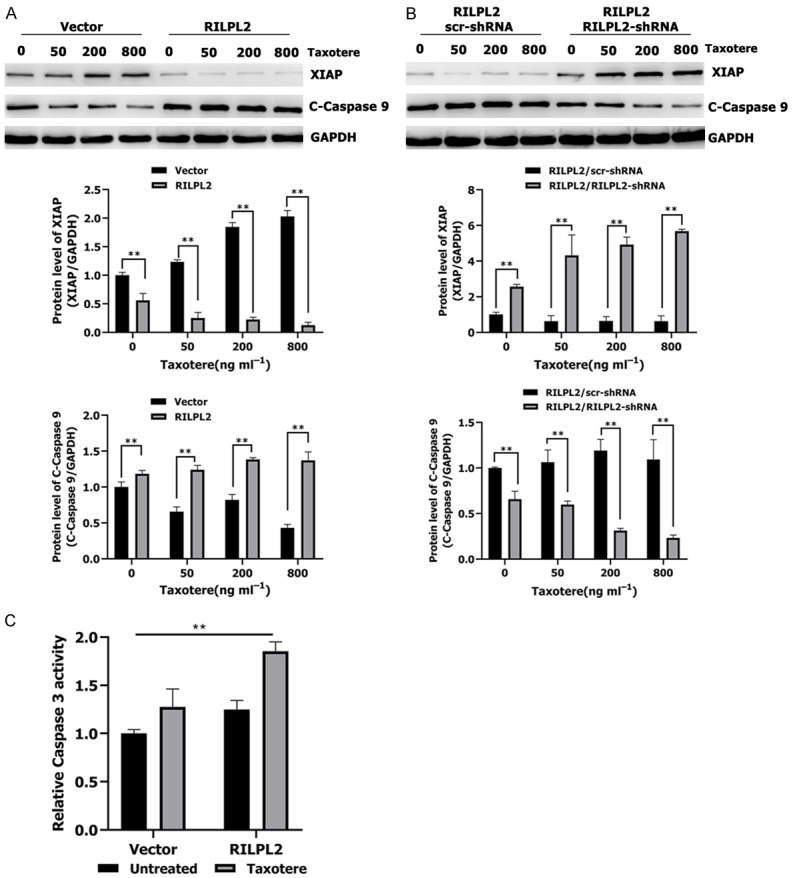
RILPL2 reverses BC cell resistance to Taxotere by regulating the XIAP/caspase 9 pathway. A, B. RILPL2-shRNA or scr-shRNA were transfected into RILPL2-overexpressing MDA-MB-231 cells following treatment with various doses of Taxotere for 24 h. Levels of XIAP and active caspase 9 were examined by western blotting in MDA-MB-231 cells (n = 3). C. Active caspase 3 level was examined by caspase-3 activity assay in Vector- or RILPL2-expressing MDA-MB-231 cells in the presence or absence of 200 ng/mL Taxotere for 24 h (n = 3). Results are presented as means ± SD. The statistical significance was assessed by Student’s t-test; *P < 0.05, **P < 0.01.
Discussion
To our knowledge, this is the first systematic study on the functional mechanism of RILPL2-mediated proliferation and metastasis in BC. ONCOMINE and CCLE analyses showed that RILPL2 mRNA expression was significantly lower in BC samples than in normal samples, which was consistent with our protein expression data obtained by western blotting and IHC. The tumor size, histological grade, and lymph node metastasis are indicators to evaluate the proliferation, metastasis, and prognosis of BC [30,31]. We found that low RILPL2 expression is positively correlated with tumor size, histological grade, and lymph node metastasis, and high RILPL2 expression is correlated with increased RFS, OS, and DMFS in BC patients. Interestingly, subgroup analysis showed that high RILPL2 expression indicates better RFS in luminal A, luminal B, and TNBC subtypes of BC, indicating that RILPL2 may be a tumor suppressor to regulate BC tumorigenesis, and a favorable prognostic factor for BC.
BC is a heterogeneous disease, not only because of its clinical and pathological characteristics, but also because of different molecular characteristics observed between different BC subtypes [32,33]. It is believed that the prognosis of luminal-type BC is better than that of other subtypes, because the HER2 and TNBC subtypes of BC are prone to recurrence and metastasis after treatment [33-35]. Therefore, understanding the molecular subtypes plays an important role in designing appropriate BC treatments [34-36]. The online database showed that RILPL2 mRNA expression was significantly higher in ER+ tumors and lower in HER2+ and TNBC subtype tumors. Furthermore, univariate analysis showed that RILPL2 expression was positively associated with ER expression and negatively associated with HER2 expression. These results revealed that RILPL2 expression is correlated with the molecular subtypes of BC and is positively associated with the subtype with better prognosis. RILPL2 may therefore be a novel clinicopathological biomarker to assess the risk of recurrence and metastasis, and guide BC treatment. However, the relationship between RILPL2 and other pathological markers needs further experimental verification.
Next, we explored the effects of RILPL2 on BC cell behavior both in vitro and in vivo, and the underlying potential mechanisms. Western blotting revealed that RILPL2 expression in BC cells was lower than that in normal breast epithelial cells, and this result was consistent with our results from clinical samples. Surprisingly, RILPL2 expression in ER+ cells (MCF-7 and T-47D) was higher than that in HER2+ cells (SKBR-3), but lower than that in TNBC cells (MDA-MB-231). These results were not consistent with our clinical sample results, suggesting that RILPL2 expression in BC cells cannot completely reflect the behavior of BC with different molecular and clinicopathological subtypes. Although RILPL2 expression was low in all of the tested BC cell lines, MDA-MB-231 and T-47D BC cells exhibited slightly high RILPL2 expression; therefore, these cells were selected for subsequent knockdown and overexpression analyses. Our results revealed that upregulated RILPL2 expression could inhibit BC growth and metastasis. However, this effect was reversed when RILPL2-shRNA was transfected into RILPL2-overexpressing BC cells. Overall, these results underlie how the aberrant regulation of RILPL2 can contribute to the inhibition of BC tumorigenesis and metastasis.
Microtubules consist of α- and β-tubulin monomers that associate with one another to form heterodimers [37]. Tubb3-a β-tubulin homotype-plays an important role in cancer progression [38-40]. Lebok et al. [41] found that high expression of TUBB3 in BC was correlated with high tumor grade, lack of ER and PR, and HER2 upregulation. TUBB3 upregulation is also associated with poor prognosis of BC patients. Our results revealed that the newly identified tumor suppressor RILPL2 could directly interact with TUBB3 and downregulate TUBB3 protein expression. We also found that RILPL2 does not affect TUBB3 mRNA expression, suggesting that RILPL2 may regulate TUBB3 protein expression by a posttranslational mechanism. TUBB3 expression is regulated in a cell cycle-dependent manner, and its protein levels are controlled by the ubiquitin-proteasome system [42]. We found that RILPL2 decreases the protein expression of TUBB3 by promoting TUBB3 ubiquitination. These results demonstrate that RILPL2 regulates TUBB3 protein expression, at least in part, by the ubiquitin-proteasome system in BC cells. However, as regulatory interactions between proteins are complex, the pathways related to RILPL2 and its effects on TUBB3 require detailed study in the future.
Constitutive activation of the PI3K/AKT pathway, which regulates cell growth and migration, has been reported in many types of cancer, including BC. PTEN negatively regulates the PI3K/Akt pathway [11,15,16]. Joshua et al. [17] have reported that TUBB3 could inhibit PTEN expression and activate the AKT pathway in non-small cell lung cancer. Meanwhile, several studies have revealed that TUBB3 is a candidate biomarker for microtubule-targeted chemoresistance in BC [26,43-46]. Hence, we hypothesized that RILPL2 may reduce TUBB3-induced BC resistance to chemotherapy. First, we observed that the levels of apoptosis in RILPL2-overexpressing cells were significantly higher than those in control cells that were treated with taxotere. We found that RILPL2 overexpression is associated with decreased TUBB3 expression, increased PTEN expression, and impaired AKT activation upon taxotere treatment, potentially explaining the lack of resistance of RILPL2-overexpressing cells to chemotherapy. These results strongly suggest that RILPL2 inhibits TUBB3-mediated anti-apoptotic effects, at least in part, via the PTEN/AKT pathway in BC cells.
Several studies have confirmed that AKT produces anti-apoptotic effects by phosphorylating different downstream substrates [11,47-49]. AKT can phosphorylate XIAP to protect it from degradation by cisplatin, doxorubicin, and taxotere, and inhibits apoptosis [11,29,50]. In agreement with this finding, we have revealed that the reversal of chemoresistance mediated by RILPL2 in BC cells is associated with decreased levels of XIAP. It is important to note that XIAP is the most effective caspase inhibitor [11,51]. This is consistent with our finding that caspase-3 and -9 are activated in RILPL2-overexpressing BC cells. Our data clearly demonstrate that RILPL2 overexpression in BC cells leads to decreased expression of TUBB3, p-AKT, and XIAP, and a concurrent increase in the expression of PTEN and apoptotic factors.
Acknowledgements
This research was supported in part by the Science and Technology Research and Development Project of Handan (Grant No. 1823208029ZC), the Key Science and Technology Research Program of Hebei Provincial Department of Health (Grant No. 20190962) and the National Natural Science Foundation of China (Grant No. 31601142).
Disclosure of conflict of interest
None.
References
- 1.Torre LA, Bray F, Siegel RL, Ferlay J, Lortet-Tieulent J, Jemal A. Global cancer statistics, 2012. CA Cancer J Clin. 2015;65:87–108. doi: 10.3322/caac.21262. [DOI] [PubMed] [Google Scholar]
- 2.Prat A, Perou CM. Deconstructing the molecular portraits of breast cancer. Mol Oncol. 2011;5:5–23. doi: 10.1016/j.molonc.2010.11.003. [DOI] [PMC free article] [PubMed] [Google Scholar]
- 3.Johansson M, Rocha N, Zwart W, Jordens I, Janssen L, Kuijl C, Olkkonen VM, Neefjes J. Activation of endosomal dynein motors by stepwise assembly of Rab7-RILP-p150Glued, ORP1L, and the receptor betalll spectrin. J Cell Biol. 2007;176:459–71. doi: 10.1083/jcb.200606077. [DOI] [PMC free article] [PubMed] [Google Scholar]
- 4.Wang T, Wong KK, Hong W. A unique region of RILP distinguishes it from its related proteins in its regulation of lysosomal morphology and interaction with Rab7 and Rab34. Mol Biol Cell. 2004;15:815–26. doi: 10.1091/mbc.E03-06-0413. [DOI] [PMC free article] [PubMed] [Google Scholar]
- 5.Fukuda M, Kanno E, Ishibashi K, Itoh T. Large scale screening for novel rab effectors reveals unexpected broad Rab binding specificity. Mol Cell Proteomics. 2008;7:1031–42. doi: 10.1074/mcp.M700569-MCP200. [DOI] [PubMed] [Google Scholar]
- 6.Matsui T, Ohbayashi N, Fukuda M. The Rab interacting lysosomal protein (RILP) homology domain functions as a novel effector domain for small GTPase Rab36: Rab36 regulates retrograde melanosome transport in melanocytes. J Biol Chem. 2012;287:28619–31. doi: 10.1074/jbc.M112.370544. [DOI] [PMC free article] [PubMed] [Google Scholar]
- 7.Lise MF, Srivastava DP, Arstikaitis P, Lett RL, Sheta R, Viswanathan V, Penzes P, O’Connor TP, El-Husseini A. Myosin-Va-interacting protein, RILPL2, controls cell shape and neuronal morphogenesis via Rac signaling. J Cell Sci. 2009;122:3810–21. doi: 10.1242/jcs.050344. [DOI] [PMC free article] [PubMed] [Google Scholar]
- 8.Dolan PT, Zhang C, Khadka S, Arumugaswami V, Vangeloff AD, Heaton NS, Sahasrabudhe S, Randall G, Sun R, LaCount DJ. Identification and comparative analysis of hepatitis C virus-host cell protein interactions. Mol Biosyst. 2013;9:3199–209. doi: 10.1039/c3mb70343f. [DOI] [PMC free article] [PubMed] [Google Scholar]
- 9.Liu W, Zhang L, Jin Z, Zhao M, Li Z, Chen G, Sun L, Chen B. TUFT1 is expressed in breast cancer and involved in cancer cell proliferation and survival. Oncotarget. 2017;8:74962–74. doi: 10.18632/oncotarget.20472. [DOI] [PMC free article] [PubMed] [Google Scholar]
- 10.Liu WG, Zhao M, Zhang L, Jin ZN, Chen B. Clinical implications of TUFT1 protein expression and correlation with RelA protein in breast cancer. Int J Clin Exp Pathol. 2017;10:6544–51. [Google Scholar]
- 11.Ghebeh H, Al-Khaldi S, Olabi S, Al-Dhfyan A, Al-Mohanna F, Barnawi R, Tulbah A, Al-Tweigeri T, Ajarim D, Al-Alwan M. Fascin is involved in the chemotherapeutic resistance of breast cancer cells predominantly via the PI3K/Akt pathway. Br J Cancer. 2014;111:1552–61. doi: 10.1038/bjc.2014.453. [DOI] [PMC free article] [PubMed] [Google Scholar]
- 12.Zhang Y, Wang Y, Wei Y, Li M, Yu S, Ye M, Zhang H, Chen S, Liu W, Zhang J. MiR-129-3p promotes docetaxel resistance of breast cancer cells via CP110 inhibition. Sci Rep. 2015;5:15424. doi: 10.1038/srep15424. [DOI] [PMC free article] [PubMed] [Google Scholar]
- 13.Gyorffy B, Lanczky A, Eklund AC, Denkert C, Budczies J, Li Q, Szallasi Z. An online survival analysis tool to rapidly assess the effect of 22,277 genes on breast cancer prognosis using microarray data of 1,809 patients. Breast Cancer Res Treat. 2010;123:725–31. doi: 10.1007/s10549-009-0674-9. [DOI] [PubMed] [Google Scholar]
- 14.Rouillard AD, Gundersen GW, Fernandez NF, Wang Z, Monteiro CD, McDermott MG, Ma’ayan A. The harmonizome: a collection of processed datasets gathered to serve and mine knowledge about genes and proteins. Database (Oxford) 2016:2016. doi: 10.1093/database/baw100. [DOI] [PMC free article] [PubMed] [Google Scholar]
- 15.Stambolic V, Suzuki A, de la Pompa JL, Brothers GM, Mirtsos C, Sasaki T, Ruland J, Penninger JM, Siderovski DP, Mak TW. Negative regulation of PKB/Akt-dependent cell survival by the tumor suppressor PTEN. Cell. 1998;95:29–39. doi: 10.1016/s0092-8674(00)81780-8. [DOI] [PubMed] [Google Scholar]
- 16.Zhou XJ, Wu J, Shi L, Li XX, Zhu L, Sun X, Qian JY, Wang Y, Wei JF, Ding Q. PTEN expression is upregulated by a RNA-binding protein RBM38 via enhancing its mRNA stability in breast cancer. J Exp Clin Cancer Res. 2017;36:149. doi: 10.1186/s13046-017-0620-3. [DOI] [PMC free article] [PubMed] [Google Scholar]
- 17.McCarroll JA, Gan PP, Erlich RB, Liu M, Dwarte T, Sagnella SS, Akerfeldt MC, Yang L, Parker AL, Chang MH, Shum MS, Byrne FL, Kavallaris M. TUBB3/betaIII-tubulin acts through the PTEN/AKT signaling axis to promote tumorigenesis and anoikis resistance in non-small cell lung cancer. Cancer Res. 2015;75:415–25. doi: 10.1158/0008-5472.CAN-14-2740. [DOI] [PubMed] [Google Scholar]
- 18.Rimawi MF, De Angelis C, Contreras A, Pareja F, Geyer FC, Burke KA, Herrera S, Wang T, Mayer IA, Forero A, Nanda R, Goetz MP, Chang JC, Krop IE, Wolff AC, Pavlick AC, Fuqua SAW, Gutierrez C, Hilsenbeck SG, Li MM, Weigelt B, Reis-Filho JS, Kent Osborne C, Schiff R. Low PTEN levels and PIK3CA mutations predict resistance to neoadjuvant lapatinib and trastuzumab without chemotherapy in patients with HER2 over-expressing breast cancer. Breast Cancer Res Treat. 2018;167:731–40. doi: 10.1007/s10549-017-4533-9. [DOI] [PMC free article] [PubMed] [Google Scholar]
- 19.Park YH, Jung HH, Ahn JS, Im YH. Statin induces inhibition of triple negative breast cancer (TNBC) cells via PI3K pathway. Biochem Biophys Res Commun. 2013;439:275–9. doi: 10.1016/j.bbrc.2013.08.043. [DOI] [PubMed] [Google Scholar]
- 20.Reed DE, Shokat KM. INPP4B and PTEN loss leads to PI-3, 4-P2 accumulation and inhibition of PI3K in TNBC. Mol Cancer Res. 2017;15:765–75. doi: 10.1158/1541-7786.MCR-16-0183. [DOI] [PMC free article] [PubMed] [Google Scholar]
- 21.Araki K, Miyoshi Y. Mechanism of resistance to endocrine therapy in breast cancer: the important role of PI3K/Akt/mTOR in estrogen receptor-positive, HER2-negative breast cancer. Breast Cancer. 2018;25:392–401. doi: 10.1007/s12282-017-0812-x. [DOI] [PubMed] [Google Scholar]
- 22.Kast K, Link T, Friedrich K, Petzold A, Niedostatek A, Schoffer O, Werner C, Klug SJ, Werner A, Gatzweiler A, Richter B, Baretton G, Wimberger P. Impact of breast cancer subtypes and patterns of metastasis on outcome. Breast Cancer Res Treat. 2015;150:621–9. doi: 10.1007/s10549-015-3341-3. [DOI] [PubMed] [Google Scholar]
- 23.Kennecke H, Yerushalmi R, Woods R, Cheang MC, Voduc D, Speers CH, Nielsen TO, Gelmon K. Metastatic behavior of breast cancer subtypes. J. Clin. Oncol. 2010;28:3271–7. doi: 10.1200/JCO.2009.25.9820. [DOI] [PubMed] [Google Scholar]
- 24.Dent R, Trudeau M, Pritchard KI, Hanna WM, Kahn HK, Sawka CA, Lickley LA, Rawlinson E, Sun P, Narod SA. Triple-negative breast cancer: clinical features and patterns of recurrence. Clin Cancer Res. 2007;13:4429–34. doi: 10.1158/1078-0432.CCR-06-3045. [DOI] [PubMed] [Google Scholar]
- 25.Bayraktar S, Gluck S. Molecularly targeted therapies for metastatic triple-negative breast cancer. Breast Cancer Res Treat. 2013;138:21–35. doi: 10.1007/s10549-013-2421-5. [DOI] [PubMed] [Google Scholar]
- 26.Aldonza MB, Hong JY, Alinsug MV, Song J, Lee SK. Multiplicity of acquired cross-resistance in paclitaxel-resistant cancer cells is associated with feedback control of TUBB3 via FOXO3a-mediated ABCB1 regulation. Oncotarget. 2016;7:34395–419. doi: 10.18632/oncotarget.9118. [DOI] [PMC free article] [PubMed] [Google Scholar]
- 27.Marczak A, Rogalska A. [TUBB3 role in the response of tumor cells to epothilones and taxanes] . Postepy Hig Med Dosw (Online) 2015;69:158–64. [PubMed] [Google Scholar]
- 28.Li Z, Qing Y, Guan W, Li M, Peng Y, Zhang S, Xiong Y, Wang D. Predictive value of APE1, BRCA1, ERCC1 and TUBB3 expression in patients with advanced non-small cell lung cancer (NSCLC) receiving first-line platinum-paclitaxel chemotherapy. Cancer Chemother Pharmacol. 2014;74:777–86. doi: 10.1007/s00280-014-2562-1. [DOI] [PubMed] [Google Scholar]
- 29.Dan HC, Sun M, Kaneko S, Feldman RI, Nicosia SV, Wang HG, Tsang BK, Cheng JQ. Akt phosphorylation and stabilization of X-linked inhibitor of apoptosis protein (XIAP) J Biol Chem. 2016;291:22846. doi: 10.1074/jbc.A116.312044. [DOI] [PMC free article] [PubMed] [Google Scholar]
- 30.Masood S. Prognostic/predictive factors in breast cancer. Clin Lab Med. 2005;25:809–25. viii. doi: 10.1016/j.cll.2005.08.012. [DOI] [PubMed] [Google Scholar]
- 31.Christgen M, Langer F, Kreipe H. [Histological grading of breast cancer] . Pathologe. 2016;37:328–36. doi: 10.1007/s00292-016-0182-8. [DOI] [PubMed] [Google Scholar]
- 32.Masood S. Breast cancer subtypes: morphologic and biologic characterization. Womens Health (Lond) 2016;12:103–19. doi: 10.2217/whe.15.99. [DOI] [PMC free article] [PubMed] [Google Scholar]
- 33.Metzger-Filho O, Tutt A, de Azambuja E, Saini KS, Viale G, Loi S, Bradbury I, Bliss JM, Azim HA Jr, Ellis P, Di Leo A, Baselga J, Sotiriou C, Piccart-Gebhart M. Dissecting the heterogeneity of triple-negative breast cancer. J. Clin. Oncol. 2012;30:1879–87. doi: 10.1200/JCO.2011.38.2010. [DOI] [PubMed] [Google Scholar]
- 34.Berry DA, Cirrincione C, Henderson IC, Citron ML, Budman DR, Goldstein LJ, Martino S, Perez EA, Muss HB, Norton L, Hudis C, Winer EP. Estrogen-receptor status and outcomes of modern chemotherapy for patients with node-positive breast cancer. JAMA. 2006;295:1658–67. doi: 10.1001/jama.295.14.1658. [DOI] [PMC free article] [PubMed] [Google Scholar]
- 35.Early Breast Cancer Trialists’ Collaborative Group (EBCTCG) Effects of chemotherapy and hormonal therapy for early breast cancer on recurrence and 15-year survival: an overview of the randomised trials. Lancet. 2005;365:1687–717. doi: 10.1016/S0140-6736(05)66544-0. [DOI] [PubMed] [Google Scholar]
- 36.Wilkinson NW, Shahryarinejad A, Winston JS, Watroba N, Edge SB. Concordance with breast cancer pathology reporting practice guidelines. J Am Coll Surg. 2003;196:38–43. doi: 10.1016/s1072-7515(02)01627-7. [DOI] [PubMed] [Google Scholar]
- 37.Orr GA, Verdier-Pinard P, McDaid H, Horwitz SB. Mechanisms of taxol resistance related to microtubules. Oncogene. 2003;22:7280–95. doi: 10.1038/sj.onc.1206934. [DOI] [PMC free article] [PubMed] [Google Scholar]
- 38.Katsetos CD, Herman MM, Mork SJ. Class III beta-tubulin in human development and cancer. Cell Motil Cytoskeleton. 2003;55:77–96. doi: 10.1002/cm.10116. [DOI] [PubMed] [Google Scholar]
- 39.Person F, Wilczak W, Hube-Magg C, Burdelski C, Moller-Koop C, Simon R, Noriega M, Sauter G, Steurer S, Burdak-Rothkamm S, Jacobsen F. Prevalence of betaIII-tubulin (TUBB3) expression in human normal tissues and cancers. Tumour Biol. 2017;39:1010428317712166. doi: 10.1177/1010428317712166. [DOI] [PubMed] [Google Scholar]
- 40.Mariani M, Karki R, Spennato M, Pandya D, He S, Andreoli M, Fiedler P, Ferlini C. Class III beta-tubulin in normal and cancer tissues. Gene. 2015;563:109–14. doi: 10.1016/j.gene.2015.03.061. [DOI] [PMC free article] [PubMed] [Google Scholar]
- 41.Lebok P, Ozturk M, Heilenkotter U, Jaenicke F, Muller V, Paluchowski P, Geist S, Wilke C, Burandt E, Lebeau A, Wilczak W, Krech T, Simon R, Sauter G, Quaas A. High levels of class III beta-tubulin expression are associated with aggressive tumor features in breast cancer. Oncol Lett. 2016;11:1987–94. doi: 10.3892/ol.2016.4206. [DOI] [PMC free article] [PubMed] [Google Scholar]
- 42.Shibazaki M, Maesawa C, Akasaka K, Kasai S, Yasuhira S, Kanno K, Nakayama I, Sugiyama T, Wakabayasi G, Masuda T, Mori N. Transcriptional and post-transcriptional regulation of betaIII-tubulin protein expression in relation with cell cycle-dependent regulation of tumor cells. Int J Oncol. 2012;40:695–702. doi: 10.3892/ijo.2011.1291. [DOI] [PubMed] [Google Scholar]
- 43.Kaira K, Takahashi T, Murakami H, Shukuya T, Kenmotsu H, Ono A, Naito T, Tsuya A, Nakamura Y, Endo M, Kondo H, Nakajima T, Yamamoto N. The role of betaIII-tubulin in non-small cell lung cancer patients treated by taxane-based chemotherapy. Int J Clin Oncol. 2013;18:371–9. doi: 10.1007/s10147-012-0386-8. [DOI] [PubMed] [Google Scholar]
- 44.Hwang JE, Hong JY, Kim K, Kim SH, Choi WY, Kim MJ, Jung SH, Shim HJ, Bae WK, Hwang EC, Lee KH, Lee JH, Cho SH, Chung IJ. Class III beta-tubulin is a predictive marker for taxane-based chemotherapy in recurrent and metastatic gastric cancer. BMC Cancer. 2013;13:431. doi: 10.1186/1471-2407-13-431. [DOI] [PMC free article] [PubMed] [Google Scholar]
- 45.Miura Y, Kaira K, Sakurai R, Imai H, Tomizawa Y, Sunaga N, Minato K, Hisada T, Oyama T, Yamada M. Prognostic effect of class III beta-tubulin and Topoisomerase-II in patients with advanced thymic carcinoma who received combination chemotherapy, including taxanes or topoisomerase-II inhibitors. Oncol Lett. 2017;14:2369–78. doi: 10.3892/ol.2017.6419. [DOI] [PMC free article] [PubMed] [Google Scholar]
- 46.Stengel C, Newman SP, Leese MP, Potter BV, Reed MJ, Purohit A. Class III beta-tubulin expression and in vitro resistance to microtubule targeting agents. Br J Cancer. 2010;102:316–24. doi: 10.1038/sj.bjc.6605489. [DOI] [PMC free article] [PubMed] [Google Scholar]
- 47.Nicholson KM, Anderson NG. The protein kinase B/Akt signalling pathway in human malignancy. Cell Signal. 2002;14:381–95. doi: 10.1016/s0898-6568(01)00271-6. [DOI] [PubMed] [Google Scholar]
- 48.Fresno Vara JA, Casado E, de Castro J, Cejas P, Belda-Iniesta C, Gonzalez-Baron M. PI3K/Akt signalling pathway and cancer. Cancer Treat Rev. 2004;30:193–204. doi: 10.1016/j.ctrv.2003.07.007. [DOI] [PubMed] [Google Scholar]
- 49.Sansal I, Sellers WR. The biology and clinical relevance of the PTEN tumor suppressor pathway. J. Clin. Oncol. 2004;22:2954–63. doi: 10.1200/JCO.2004.02.141. [DOI] [PubMed] [Google Scholar]
- 50.Dan HC, Sun M, Kaneko S, Feldman RI, Nicosia SV, Wang HG, Tsang BK, Cheng JQ. Akt phosphorylation and stabilization of X-linked inhibitor of apoptosis protein (XIAP) J Biol Chem. 2004;279:5405–12. doi: 10.1074/jbc.M312044200. [DOI] [PubMed] [Google Scholar]
- 51.Holcik M, Gibson H, Korneluk RG. XIAP: apoptotic brake and promising therapeutic target. Apoptosis. 2001;6:253–61. doi: 10.1023/a:1011379307472. [DOI] [PubMed] [Google Scholar]


