

Abstract
We evaluated the association between risk factors for endometrial cancer (EC) and sonographic endometrial thickness (ET) with FIGO stages at diagnosis. We also reported our experience in reliability of sonographic ET as screening tool for either histologic subtype I and II of EC. It was a case series study including 339 patients diagnosed with EC from 2010 to 2017 at the Ipswich Hospital, UK. Women with higher body mass index (BMI) presented at earlier stages when compared to women with lower BMIs (p-value = .046). By contrast, none of the variables: parity (p-value = .1630), use of HRT (p-value 0.7448), tamoxifen (p-value 0.0733) and diabetes (p-value = .1665) were statistically associated to FIGO stages. The mean of ET measurement was not statistically significant associated (p-value 0.0625) to stages. There was no statistic difference on mean ET at diagnosis between histologic subtypes I or II (p-value 0.804). According to our experience, BMI is associated to FIGO stage and endometrial sampling (ES) should be included in the working diagnosis of EC to obtain an early diagnosis in women with high BMIs even in premenopausal. Ultrasonographic measurement of the endometrium is equally reliable at determining cancer, but not at differentiating histologic subtypes I and II uterine cancers. However, ET does not correlate to FIGO stages at diagnosis.
Keywords: Endometrial cancer, Risk factors, Endometrial thickness and FIGO stages
Highlights
-
•
Women with higher BMI present at earlier stages
-
•
Endometrial thickness (ET) measurements are not associated with FIGO stages
-
•
The same ET cut-off is equally representative of histological subtype 1 and 2
1. Introduction
Endometrial cancer (EC) is the fourth most common observed malignancy in women and its incidence has been increasing over the last decade (Lindfors et al., 2018). The risk factors for EC include: age, nulliparity obesity, diabetes (Pearson-Stuttard et al., 2018) and use of hormone replacement therapy (HRT) and tamoxifen therapy (Simin et al., 2017). However, the association of these risk factors to FIGO stage at diagnosis remains unclear thus limiting their value in prognosis (Kim et al., 2016). Transvaginal ultrasound scan (TVS) is a non-invasive screening test and an ET of ≤4 mm is a cutoff value more frequently used in postmenopausal women for conservative management as, in these cases, the risk of EC drops from 10% to 0.8% and therefore these patients can avoid ES (Schramm et al., 2017). However, there is no strong evidence published on the association of ET measurement with all the known risk factors for EC. There are also not different recommendations on screening tools according to the two histologic subtypes of EC: type I (tumours of grade 1 or 2 endometrioid histology) with a favorable prognosis, and types II (grade 3 endometrioid tumours, as well as non-endometroid histologies such as serous, clear cell and carcinosarcoma (Wong et al., 2016a, Wong et al., 2016b). Moreover, EC is mainly a disease of postmenopausal women, although between 4.9%–14% of those affected are premenopausal, with a subset of 4% who are <40 years old and for whom their primary symptom is abnormal uterine bleeding (AUB) (Wise et al., 2016). In those symptomatic premenopausal women it is less clear who should undergo ES and selection of possible clinical indicators for biopsy to exclude EC remains equivocal. Most national guidelines (The American College of Obstetricians and Gynaecologists Committee Opinion, 2013) (National Institute for Health and Care Excellence, 2018) recommend ES in women older than 45 years with AUB. The New Zealand guidelines advise similarly that ES should be used in women over 45 years of age or with weights >90 kg (Duska, 2017). The Society of Obstetricians and Gynecologists of Canada advise ES in a slightly younger population: women older than 40 years or younger women with additional risk factors such as BMI of >30 mg/kg (Pearson-Stuttard et al., 2018) or nulliparity (The Society of Obstetricians and Gynaecologists of Canada, 2013).
The purpose of our study was to identify prognostic factors and potential difference in sonographic ET measurement at presentation between the histologic subtype I and II of EC. We evaluated the possible association between known risk factors for EC and ultrasound features to stage in women presenting with PMB and AUB. Such an association may help to highlight possible predictive factors in staging the disease for prognosis and may lead to both improved diagnostic pathways and better targeting of invasive diagnostic testing.
2. Materials and methods
Our case series included women with a final histological diagnosis of EC, who underwent surgical treatment at the Department of Gynaecological Oncology at Ipswich hospital between 2010 and 2017. Our audit department and Ethics Committee approved the study and consent from the patients to participate to research was asked prospectively at the time of the surgery Inclusion criteria were: women with PMB, defined as bleeding after 12 months of amenorrhea, and any women pre-menopausal with AUB and with a histologic diagnosis of EC. Exclusion criteria were: cases with missing information and patients with a diagnosis of EC at the initial ES, but not treated with surgery (hysterectomy and bilateral salpingo-oophorectomy with or without pelvic and or para-aortic lymphadenectomy). Data collected were: BMIs, parity, use of any type of HRT, type 1 or type 2 diabetes, FIGO stages, ET measurements before ES. BMI was calculated as weight in Kg divided by the square of height in metres (kg/m2) and classified: BMI ≥ 19.0–24.9 kg/m2 = normal weight; BMI ≥ 25.0–29.9 kg/m2 = overweight; BMI ≥ 30–34.9 kg/m2 = obese and BMI ≥ 40 kg/m2 extreme obese. Departmental protocol for the evaluation of PMB or AUB was a pelvic ultrasound scan. The indication for ES was ET ≥ 5 mm in symptomatic postmenopausal women or those with a thinner ET in case of persistent symptoms, in the presence of an abnormal endometrial appearance in any woman and in premenopausal women especially in the presence of a thick endometrium with high BMI. All cases of uterine cancers included were staged according to the FIGO staging system.
Statistical analysis was performed using Graph Pad Prism version 5 (GraphPad Software, USA). Descriptive statistics were used to report the characteristics of the study population. Representation of the association of ET measurements to histological subtypes and FIGO stages was illustrated using Box-and-Whisker plots, where the box represents the interquartile range (IQR) and the horizontal line inside the box indicates the median. The strength of associations among all the variables included and FIGO stage was analyzed by Fisher's exact test or Chi-Square test appropriately. Results were considered to be significant when the P < .05.
3. Results
From 2010 to 2017 we had 339 patients with EC, who underwent surgical treatment at the Department of Gynecology Oncology of the Ipswich hospital, UK. Among those 314/339 (92%) postmenopausal women and 25/339(8%) premenopausal. Mean age was 66.69 (range 36–96). There were 205/339(60%) patients with stage IA, 85/339(25%) with stage IB, 16/339 (5%) with stage II, 21/339(7%) with stage III and 12/339(3%) with stage IV. According to BMI, 43/339(13%) with normal weight (≥19–24.9BMI), 115/339(34%) overweight (≥25.0–29.9BMI), 141/339 (42%) obese (≥30–39.9BMI) and 40/339(12%) extreme obese (≥40 BMI). We had 83/339(25%) nulliparous and 256/339(75%) multiparous. Previous use of either HRT or tamoxifen was 41/339(12%) and 28/339(28%) respectively. With no previous use of HRT and or tamoxifen we had 298/339(88%) and 311/339(92%), respectively. Diabetes (type 1 or type 2) was present in 48/339(14%) and no present in 291/339(86%) patients. Fig. 1 summarizes baseline patients' clinical characteristics.
Fig. 1.

Descriptive analysis of patients' characteristics included in the cohort.
BMI = body mass index; HRT = Hormone replacement therapy.
Stratified association of different BMIs to FIGO stages confirmed a statistic difference among FIGO stage at presentation and different BMI categories (p-value = .046), as women with higher BMIs presented at earlier stages. By contrast, parity (p-value = .1630), use of HRT (p-value = .7448), tamoxifen (p-value = .0733) and diabetes (p-value = .1665) were not statistically associated to FIGO stages at presentation.
Mean ET, among all the patients included in the analysis, calculated by ultrasound scan was 14.5 mm(range 3.0–43.0), 17.5 mm(range 2.0–45.0), 12.1 mm(5–30), 16.3 mm(4.0–17.0) and 12.0 mm (6.0–20.0) for stage IA, IB, II, III and IV respectively. There was not statistically significant (p-value 0.0625) between mean ETs and FIGO stages. Fig. 2, Fig. 3 are Box-and-Whiskers plots that shows the distribution of all the ET measurements according to FIGO stages and according to histologic subtypes respectively.
Fig. 2.
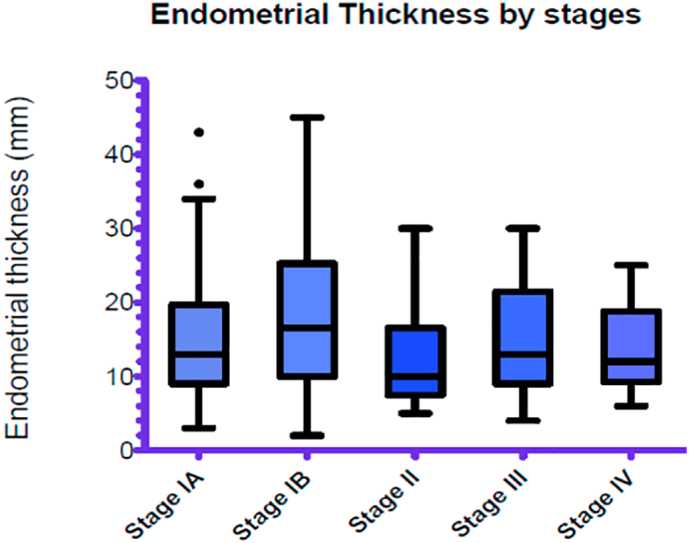
Distribution of all endometrial thickness (ET) measured by ultrasound scan according to FIGO stages at diagnosis.
Fig. 3.
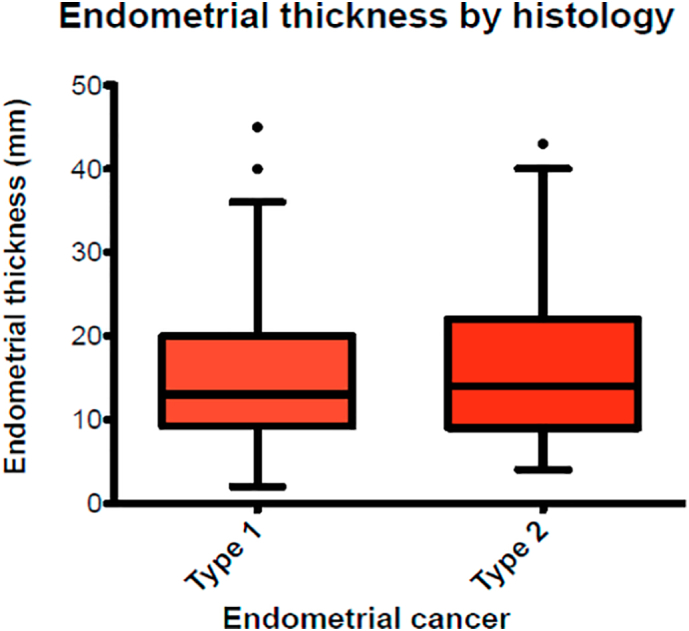
Distribution of endometrial thickness according to histological subtypes I and II.
We had 247/339(73%) patients with type 1 and 92/339(27%) with type 2 uterine cancers. Mean ET of patients included according to histological subtypes was 15.03 mm (range 2.0–45.0) and 16.3 mm (range 4.0–43.0) for type I and type II respectively. The difference among these values was not statistically significant (p-value = .804). Table 1 summarise the ET measurements according to histologic subtypes.
Table 1.
Ultrasonographic findings of the endometrium by histologic type of endometrial cancer.
| Cancer histological type | Type 1 |
Type 2 |
p-value |
|---|---|---|---|
| Number of patients | |||
| ET | |||
| <5 mm | 4 | 2 | 0.804 |
| ≥5–10 mm | 80 | 30 | |
| >10 mm | 145 | 44 | |
| Mean ET (mm) (range) | 15.03 (2.0–45.0) | 16.3 (4.0–43.0) | |
| Other findings | |||
| Intrauterine mass | 13 | 10 | |
| Fluid into uterine cavity | 4 | 7 | |
| Total | 247 | 92 | |
4. Discussion
Our data support the observation that women with higher BMIs present at earlier stages of EC when compared to women with BMIs in the normal range. Since diabetes, nulliparity, tamoxifen and use of HRT increase the risk to develop EC as high BMIs, it is conceivable that they may also influence the stage of the disease and therefore mortality. Nevertheless, the impact of well-known risk factors on prognosis and therefore stage is unclear and less studied when compared to the effect of BMI to stage at diagnosis for EC (Pearson-Stuttard et al., 2018). We did not find a significant association between diabetes, use of tamoxifen and HRT to FIGO stage at presentation, as for women with higher BMI. Moreover, timing for referral for premenopausal women with AUB is still inconsistent and therefore, in our opinion, there is a clear need to determine the role of risk factors on prognosis and diagnosis of EC in this category of women, despite we acknowledge that the risk of EC in those women is only 0.1% (Duska, 2017).
We also evaluated the association of ET measurements with FIGO stage and with the two histological subtypes, to add our experience on the use of sonographic ET for prognosis and as screening tool. There are data suggesting that an ET >9 mm is able to predict a grade > 1 and an ET >27 mm a grade >2 (Cakiroglu et al., 2014). Other authors interestingly reported that cases with deepest myometrial invasion exhibited a thicker endometrium (Hosoi et al., 2013). By contrast, we did not find a statistically significant association of ET to stages, as it does not increase the thickness of the endometrium according to stages in our cases. We can also use our experience to reinforce the evidence that endometrial heterogeneity, persistent bleeding in post-menopausal women or an abnormal finding into the endometrial cavity in pre-menopausal and postmenopausal women should warrant invasive diagnostic measures.
We also acknowledge the challenges faced in trying to establish ET cutoffs for premenopausal women, especially in these women endometrial polyps could be the main reason for a thick endometrium. Some authors evaluated ET in premenopausal women presenting with AUB and did not find ET to be significantly different among women with and without endometrial hyperplasia (EH) (13.4 ± 4.7 mm vs 12.9 ± 5.3 mm, P = .75) (Wong et al., 2016a, Wong et al., 2016b) By contrast, endometrial stripe abnormalities were found significantly associated with EH in premenopausal and perimenopausal women with/without AUB. Therefore, the thickened endometrium itself may not help, while endometrial stripe abnormalities, such as heterogeneity or cystic changes to the endometrium, may be crucial as screening tools in asymptomatic premenopausal and perimenopausal women. However, we would support the use of ES in premenopausal women who have high BMIs to aim earlier diagnosis and therefore improve prognosis.
We also compared mean of ET measurements at diagnosis between type I and II EC. Mean ET in type I subtype was 15.0 mm versus 16.3 mm in type II, and the difference was not statistically significant (p-value = .804). Authors disagreed with our findings and they have concluded that ET cut off used to diagnose type I EC has a less sensitivity and specificity compared to type II (Breijer and Mol, 2016).
In conclusion, our study add to evidence that women with higher BMI present at earlier stages when compared to women with lower BMIs The present study does not have enough data to support the inclusion of other risk factors, different from BMI, to help working diagnosis of EC in premenopausal as well as in postmenopausal women and to prove their role in predicting prognosis. We also reinforce the use of ET measurements only as a screening tool in postmenopausal women. However, in premenopausal women abnormal ultrasound findings should be considered for further investigations especially in the presence of high BMI and persistent symptoms. Finally, we agree with other published papers that ultrasonographic measurement of the endometrium for prediction of EC in post-menopausal women is still reliable in both histologic types I and II.
Author contributions
IR contributed to design the study, data collection, statistical analysis and writing of the first draft. All the authors RN, WM, MN, RS, BR contributed to data collection and to edit the manuscript.
Declaration of Competing Interest
The authors have no conflicts of interest.
Acknowledgements
We would like to thank the library of the Ipswich hospital to provide us all the articles we used to write the manuscript.
References
- Breijer M.C., Mol B.W. Transvaginal ultrasound measurement of the endometrium remains the first line test for investigating post-menopausal bleeding but integration of patient characteristics into testing may further improve diagnostic algorithms. BJOG. 2016 Feb;123(3):447. doi: 10.1111/1471-0528.13438. [DOI] [PubMed] [Google Scholar]
- Cakiroglu Y., Doger E., Yildirim Kopuk S., Ozcan C., Nalbant B., Corakci A., Yucesoy I. Prediction of tumor grade and stage in endometrial carcinoma by preoperative assessment of sonographic endometrial thickness: is it possible? Turk. J. Obstet. Gynecol. 2014;11(4):211–214. doi: 10.4274/tjod.35651. [DOI] [PMC free article] [PubMed] [Google Scholar]
- Duska L.R. Recognising endometrial cancer in pre-menopausal women. BJOG. 2017;124(3):412. doi: 10.1111/1471-0528.14487. [DOI] [PubMed] [Google Scholar]
- Hosoi A., Ueda Y., Shindo M., Nakagawa S., Matsuzaki S., Kobayashi E., Kimura T., Yoshino K., Fujita M., Kimura T. Endometrial thickness measured by ultrasonography in postmenopausal patients with endometrial carcinoma has significance, irrespective of histological subtype. Int. J. Gynecol. Cancer. 2013;23:1266–1269. doi: 10.1097/IGC.0b013e31829f1857. [DOI] [PubMed] [Google Scholar]
- Kim M., Kim J., Kim S. Endometrial evaluation with transvaginal ultrasonography for the screening of endometrial hyperplasia or cancer in premenopausal and perimenopausal women. Obstet. Gynecol. Sci. 2016;59(3):192–200. doi: 10.5468/ogs.2016.59.3.192. [DOI] [PMC free article] [PubMed] [Google Scholar]
- Lindfors A., Akesson A., Staf C., Sjoli P., Sundfeldt K., Dahm-Kahler P. Robotic versus open surgery for endometrial cancer in elderly patients: surgical outcome, survival and cost analysis. Int. J. Gynecol. Cancer. 2018;28(4):692–699. doi: 10.1097/IGC.0000000000001240. [DOI] [PubMed] [Google Scholar]
- National Institute for Health and Care Excellence Heavy Menstrual Bleeding: Assessment and Management. 2018. nice.org.uk/guidance/ng88 [PubMed]
- Pearson-Stuttard J., Zhou B., Kontis V., Bentham J., Gunter M.J., Ezzati M. Worldwide burden of cancer attributable to diabetes and high body-mass index: a comparative risk assessment. Lancet Diabetes Endocrinol. 2018;6(2):95–104. doi: 10.1016/S2213-8587(17)30366-2. [DOI] [PMC free article] [PubMed] [Google Scholar]
- Schramm A., Ebner F., Bauer E., Janni W., Friebe-Hoffmann U., Pellegrino M., De Gregorio N., Friedl T.W.P. Value of endometrial thickness assessed by transvaginal ultrasound for the prediction of endometrial cancer in patients with postmenopausal bleeding. Arch. Gynecol. Obstet. 2017;296(2):319–326. doi: 10.1007/s00404-017-4439-0. [DOI] [PubMed] [Google Scholar]
- Simin J., Tamimi R., Lagergren J., Adami H.O., Brusselaers N. Menopausal hormone therapy and cancer risk: an overestimated risk? Eur. J. Cancer. 2017;84:60–68. doi: 10.1016/j.ejca.2017.07.012. [DOI] [PubMed] [Google Scholar]
- The American College of Obstetricians and Gynaecologists Committee Opinion . Vol. 557. 2013. Management of Acute Abnormal Uterine Bleeding in Non-pregnant Reproductive Aged Women; pp. 1–6. [Google Scholar]
- The Society of Obstetricians and Gynaecologists of Canada Abnormal uterine bleeding in pre-menopausal women. J. Obstet. Gynaecol. 2013;35(5):473–475. doi: 10.1016/S1701-2163(15)30939-7. [DOI] [PubMed] [Google Scholar]
- Wise M.R., Gill P., Lensen S., Thompson J.M., Farquhar C.M. Body mass index trumps age in decision for endometrial biopsy: cohort study of symptomatic premenopausal women. Am. J. Obstet. Gynecol. 2016;215(5):598e1–e8. doi: 10.1016/j.ajog.2016.06.006. [DOI] [PubMed] [Google Scholar]
- Wong A.S., Cheung C.W., Fung L.W., Lao T.T., Mol B.W., Sahota D.S. Development and validation of prediction models for endometrial cancer in postmenopausal bleeding. Eur. J. Obstet. Gynecol. Reprod. Biol. 2016;203:220–224. doi: 10.1016/j.ejogrb.2016.05.004. [DOI] [PubMed] [Google Scholar]
- Wong A.S., Lao T.T., Cheung C.W., Yeung S.W., Fan H.L., Ng P.S., Yven P.M., Sahota D.S. Reappraisal of endometrial thickness for the detection of endometrial cancer in postmenopausal bleeding: a retrospective cohort study. BJOG. 2016;123(3):439–446. doi: 10.1111/1471-0528.13342. [DOI] [PubMed] [Google Scholar]