Abstract
Background Despite advances in natural language processing (NLP), extracting information from clinical text is expensive. Interactive tools that are capable of easing the construction, review, and revision of NLP models can reduce this cost and improve the utility of clinical reports for clinical and secondary use.
Objectives We present the design and implementation of an interactive NLP tool for identifying incidental findings in radiology reports, along with a user study evaluating the performance and usability of the tool.
Methods Expert reviewers provided gold standard annotations for 130 patient encounters (694 reports) at sentence, section, and report levels. We performed a user study with 15 physicians to evaluate the accuracy and usability of our tool. Participants reviewed encounters split into intervention (with predictions) and control conditions (no predictions). We measured changes in model performance, the time spent, and the number of user actions needed. The System Usability Scale (SUS) and an open-ended questionnaire were used to assess usability.
Results Starting from bootstrapped models trained on 6 patient encounters, we observed an average increase in F1 score from 0.31 to 0.75 for reports, from 0.32 to 0.68 for sections, and from 0.22 to 0.60 for sentences on a held-out test data set, over an hour-long study session. We found that tool helped significantly reduce the time spent in reviewing encounters (134.30 vs. 148.44 seconds in intervention and control, respectively), while maintaining overall quality of labels as measured against the gold standard. The tool was well received by the study participants with a very good overall SUS score of 78.67.
Conclusion The user study demonstrated successful use of the tool by physicians for identifying incidental findings. These results support the viability of adopting interactive NLP tools in clinical care settings for a wider range of clinical applications.
Keywords: workflow, data display, data interpretation, statistical, medical records systems, computerized
Background and Significance
Despite advances in natural language processing (NLP), extracting relevant information from clinical text reports remains challenging and time-consuming. 1 Interactive tools capable of easing the construction, review, and revision of NLP models can reduce the cost of constructing models and improve the utility of clinical reports for physicians, administrators, and other stakeholders.
We present the design, implementation, and evaluation of an interactive NLP tool for identifying incidental findings in radiology reports of trauma patients ( Fig. 1 ). The modern care of trauma patients relies on extensive use of whole-body computed tomography (CT) imaging for assessment of injuries. 2 Although CT imaging is invaluable in demonstrating the extent of injuries, unrelated incidental findings such as occult masses, lesions, and anatomic anomalies are often uncovered. 3 Incidental findings are quite common and range from an insignificant cyst in the kidney to a life-threatening nodule in the lung. 4 The members of the trauma team are responsible for interpreting the radiology reports, identifying and assessing the incidental findings, and conveying this information to the patient and other physicians. However, in a busy trauma center with acutely injured patients, the task of identifying and collating incidental findings is taxing. 5 The importance of clinical context in classifying a finding as incidental is a key source of difficulties. For example, a trauma surgeon's notion of an incidental finding may be very different from an oncologist's definition of an incidental finding in a cancer patient. This presents a challenge to automated text extraction approaches based on limited training data, making the identification of incidental findings a task best served by models customized to the clinical context and medical specialty.
Fig. 1.
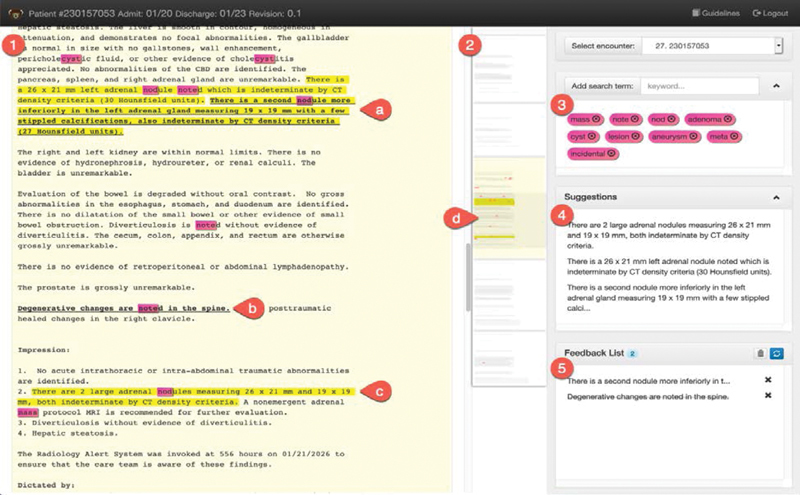
(1) A deidentified radiology report of computed tomography (CT) imaging in a patient with trauma. It revealed a nodule as an incidental finding that is highlighted in yellow by the prototype tool (a and c). Users are able to add incidental findings missed by the prototype (bolded in a) and also remove incorrectly highlighted findings (b). (2) The tool shows an overview of the patient case in a miniaturized view of all the records with highlights marking regions of interest (d). In the right sidebar, the tool allows the users to define search terms to be highlighted in pink. (3) These can be seen as rules which can help attract user attention to potentially important parts of the case. (4) Shows a list of predictions made by system. Clicking on a blurb item scrolls the report view to relevant prediction into view. (5) A log of feedback items and changes recorded by the user.
Interactive NLP tools that provide end-users with the ability to easily label data, refine models, and review the results of those changes have the potential to lower the costs associated with the customization, and therefore to increase the value of NLP on clinical reports ( Fig. 2 ). Interactive NLP can improve the clinical workflow and decrease time spent in documenting by automatically identifying and extracting relevant content needed for tasks such as preparing discharge summaries, formulating reports for rounding, and authoring consultation notes. We present the design and implementation of an interactive NLP tool for identifying incidental findings in radiology reports, followed by results from a user study with physicians to evaluate the accuracy and usability of the tool.
Fig. 2.
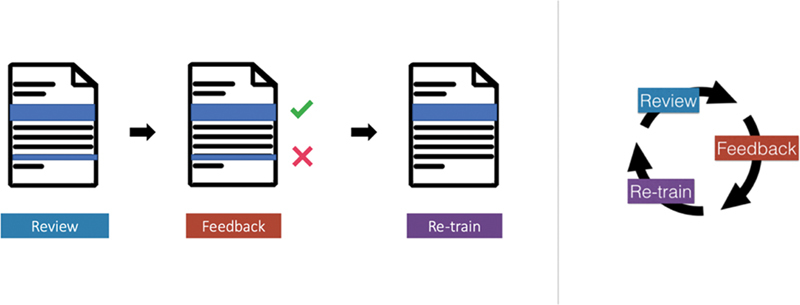
System overview: Physicians (1) review highlights predicted by the system, and (2) provide feedback on them. (3) Once this feedback is used to retrain models, it completes an interactive learning cycle.
Related Work
Several efforts have applied NLP pipelines and machine learning methods to radiology reports. 6 7 8 Yetisgen-Yildiz et al 9 demonstrated the use of NLP and supervised machine learning for identifying critical sentences in radiology reports, using an extractive summarization approach, focused on binary classification of sentences. Zech et al also worked on identifying findings in radiology reports with a similar pipeline and linear classification models. 10 Follow-up work by Yetisgen et al 11 noted that because manual annotation is time-consuming and labor-intensive, they could annotate only a small portion of their corpus. Interactive annotation approaches were recommended as a means of addressing this challenge.
Interactive machine learning (IML) is defined as the process of iteratively building machine learning models through end-user input. 12 13 IML systems require effective displays for presenting outputs and eliciting feedback from users for retraining models. 14 Both Amershi et al 15 and Boukhelifa et al 16 provide summaries of prior work in IML. Interactive methods are particularly appealing in addressing the challenges inherent in developing NLP applications, which are further exacerbated by differences across institutions and clinical subdomains. In the traditional approach, models are built by NLP experts in linguistics and machine learning, while subject matter domain experts who are often the end-users must construct training data through laborious annotation of sample texts. This approach is expensive and inefficient, particularly when language subtleties necessitate multiple iterations through the annotation cycle (as is often the case). For clinical applications, it quickly becomes infeasible to customize models for every specific task and application. RapTAT demonstrated how interactive annotation and preannotated documents can reduce the time required to create an annotated corpus. 17 18 To simplify the process of building models, LightSIDE 19 and CLAMP 20 provide graphical user interfaces for building customized NLP pipelines. D'Avolio et al 21 described a prototype system combining tools for creating text annotations (Knowtator 22 ) and for deriving NLP features (cTAKES 23 ), within a common user interface to configure statistical machine learning algorithms. Other efforts provide interfaces for information extraction using rule-based NLP such as regular expressions as well as user-defined grammars and lexicons. 24 25 Although the majority of these tools focus on supporting different parts of an NLP expert's workflow, they do not address the challenges in designing an end-to-end interactive system for physicians or other domain experts. Our work complements these efforts by focusing not only on customizing individual components of the NLP pipeline, but also on the design of all components required for building a clinically focused closed-loop IML system. Other interactive tools designed for end-user needs have addressed specific NLP tasks including clustering, 26 classification, 27 28 29 topic modeling, 30 31 and word sense disambiguation. 32
Objectives
Our objective was to develop an intelligent interactive tool to be used by physicians in the trauma care setting for identifying incidental findings. The current workflow for identifying incidental findings at the Trauma Services at University of Pittsburgh Medical Center (UPMC) is a manual process. For each patient, physicians read full-text radiology reports in the patient's electronic medical record (EMR) and synthesize them to fill in different sections of a templated signout note. One of these sections specifically focuses on incidental findings. This process is repeated daily and the signout note is revised whenever a new radiology report is added to the patient's EMR. Typically, resident physicians in the trauma team that include surgery, internal medicine, and radiology are responsible for writing the signout notes. We conducted informal discussions with members of these teams and stakeholders that provided initial validation of the problem and requirements, along with insights and feedback for developing the tool. We built on our previous work 29 to address the challenge of integrating interactive NLP into the clinical workflow. The tool consists of (1) a learning pipeline that builds, applies, and updates an NLP model for identifying incidental findings, and (2) a user interface that enables users review, provide feedback, and understand changes to the NLP model.
NLP Learning Pipeline Requirements
The NLP pipeline should have a sectionizer that is capable of splitting notes into sections and sentences. As in Yetisgen-Yildiz et al, 9 these elements are then subject to a binary classifier predicting whether or not each element discusses incidental findings. The system should incorporate end-user input to revise the models, thus completing an interactive learning cycle capable of predicting useful elements in clinical text.
User Interface Requirements
The user interface should have functionality to help physicians in selecting relevant training examples and in providing labels appropriate for updating the NLP model. The interface should display predictions from the model and allow physicians to give feedback that will be used to revise the model. Visualization and interaction components should support these steps within the interactive learning cycle. These requirements are further itemized as follows:
(i) Review
R1: The user interface should highlight sentences as predicted by the NLP model to be relevant and, where possible, help users understand why a sentence was predicted to describe an incidental finding.
R2: The interface should help users to quickly navigate between documents as well as predictions.
(ii) Feedback
R3: Users should be able to select sentences that should have been highlighted and were missed by the NLP model. Similarly, they should be able to remove incorrect highlights.
R4: The user interface should help minimize user actions and time required for providing feedback.
(iii) Retrain
R5: Feedback provided by users should be displayed as a list of additions and deletions to help users understand changes between model revisions.
Hypothesis
We hypothesize that our tool will enable physicians to build useful NLP models for identifying incidental findings in radiology reports within a closed feedback loop, with no support from NLP experts. We split this into two subhypotheses for efficiency and usability:
H1: The interactive tool will decrease time and effort for physicians for identifying incidental findings.
We compare our IML approach to a simpler interface lacking IML, using measurements of time and effort (in terms of number of user actions) to evaluate how the interactive cycle could facilitate construction of highly accurate models.
H2: The interactive tool will be used by physicians successfully to identify incidental findings with little or no support from NLP experts.
Design of interactive learning systems require that we adopt a human-centered approach for collecting training data and building models. Simple active learning approaches that involve asking a series of questions to human “oracles” can be annoying and frustrating, as noted in Cakmak and Thomaz. 33 The focus in IML is in building tools that align the process of providing feedback with user needs. Thus, we test whether the proposed tool is usable by end-users, that is, physicians, for the task of identifying incidental findings.
Methods
We followed a three-step sequence for design, implementation, and evaluation for our tool. For designing the user interface, we used an iterative process starting with design mockups ( Fig. 3 ), followed by implementation and revision phases. We also created a labeled gold standard data set for the user study.
Fig. 3.
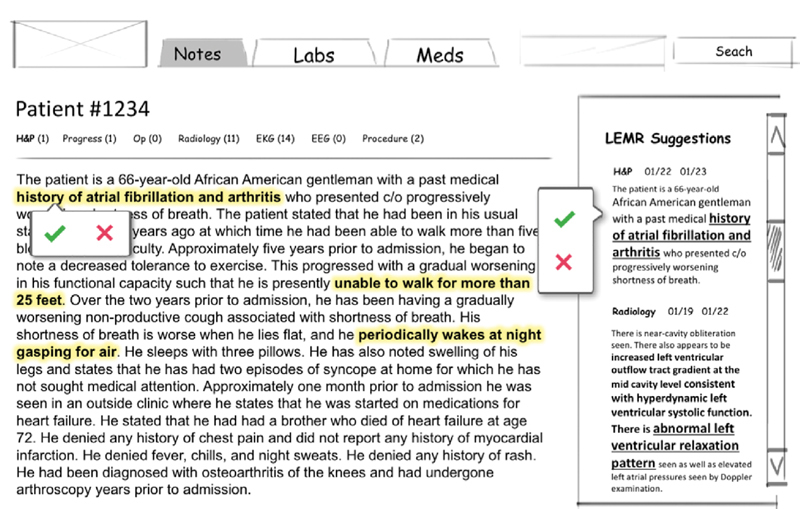
An early mock-up of the tool. The left side shows the full-text reports and the right sidebar shows suggested incidental findings.
Data and Annotation
We obtained 170,052 radiology reports for trauma patients who were treated by UPMC Trauma Services. Reports were deidentified to remove patient identifiers and identifiers regarding imaging modalities using the DE-ID software from DE-ID Data Corp. 34
To create an annotated data set, two trauma physicians used a preliminary version of our tool to annotate 4,181 radiology reports (686 encounters, 6.09 ± 4.18 reports per encounter following a power-law distribution) for incidental findings. Annotators focused on two types of incidental findings: lesions suspected to be malignant and arterial aneurysms meeting specified size and location criteria. Table 1 provides detailed annotation guidelines that were used by the physicians. An initial pilot set of 128 radiology reports was annotated by the two physicians independently, with good interannotator agreement (IAA) of 0.73 measured using Cohen's kappa statistic. 35 Kappa calculations were based on agreement of classification of each sentence as containing an incidental or not. After review and discussions, the annotation guidelines were revised, and a second pilot set of 144 radiology reports was annotated, resulting in a revised IAA of 0.83. Each of the remaining 4,053 reports was annotated by a single physician using the revised annotation scheme.
Table 1. Annotation guidelines: Adapted from Sperry et al 5 .
| Lesions | Aneurysms | ||
|---|---|---|---|
| Brain | Any solid lesion | Thoracic aorta | ≥ 5 cm |
| Thyroid | Any lesion | Abdominal aorta | ≥ 4 cm |
| Bone | Any osteolytic or osteoblastic lesion, not age-related | External iliac artery | ≥ 3 cm |
| Breast | Any solid lesion | Common femoral artery | ≥ 2 cm |
| Lung | Any solid lesion (except lymph) | Popliteal artery | ≥ 1 cm |
| Liver | Any heterogeneous lesion | ||
| Kidney | Any heterogeneous lesion | ||
| Adrenal | Any lesion | ||
| Pancreas | Any lesion | ||
| Ovary | Any heterogeneous lesion | ||
| Bladder | Any lesion | ||
| Prostate | Any lesion | ||
| Intraperitoneal/Retroperitoneal | Any free lesion | ||
Note: Potentially-malignant lesions and arterial aneurysms greater than a specified size were annotated.
We sampled a subset of encounters from the annotated data set for the user study described in the “Evaluation” section. We restricted the sample to encounters that contained one or more incidental findings and had between 3 and 7 reports. This allowed us to avoid outliers with large numbers of reports to allow for a reasonably consistent review time duration per encounter. Annotators (same physicians) reviewed this smaller sample of 694 reports (130 encounters; 5.36 ± 1.3 reports per encounter; mostly CT and X-ray reports, with a small number of other modalities such as ultrasound, magnetic resonance imaging, fluoroscopy, etc.) again to remove any inconsistencies in labeled gold standard against the annotation guidelines ( Table 1 ). This sample with revised annotations was used in the user study.
Learning Pipeline
We extracted individual sentences using the spaCy Python NLP library ( https://spacy.io ). 36 A sentence was labeled positive if any part of the sentence (or the entire sentence) was selected by the annotators. Sections were extracted after applying regular expressions to identify section headings. A section was marked positive if it contained one or more sentences with incidental findings. Similarly, a report was marked positive if it contained one or more sentences with incidental findings. Table 2 shows the distribution of incidental findings across sentences, sections, and reports.
Table 2. Distribution of positives at sentence, section, and report levels in the evaluation data set.
| Total | Positives | |
|---|---|---|
| Reports | 694 | 164 (23.6%) |
| Sections | 6,046 | 302 (5.0%) |
| Sentences | 20,738 | 369 (1.8%) |
Note: Positives denote the raw count of sentences, sections, or reports containing one or more incidental findings.
We used a simple NLP pipeline with linear-kernel support vector machine (SVM) using bag-of-words feature sets. We built separate models to classify reports, sections, and sentences, respectively. Earlier results suggest that this approach performed competitively with other sophisticated methods for classifying relevant sentences in radiology reports. 9 10 We used the “ rationale model ” proposed by Zaidan and Eisner 37 for implementing IML with user feedback. Specifically, when the user identified a span of text as an incidental finding, we constructed similar synthetic text as additional training data. Using a simple classification model allowed us to focus the discussion in this article on the design of the overall system. We performed a detailed exploration into classifier modeling techniques for identifying incidental findings, as described elsewhere. 38
User Interface
The user interface of the tool is shown in Figs. 1 and 4 . A video demonstration is available at http://vimeo.com/trivedigaurav/incidentals . In the following sections, we describe the components of the interactive feedback loop in detail.
Fig. 4.
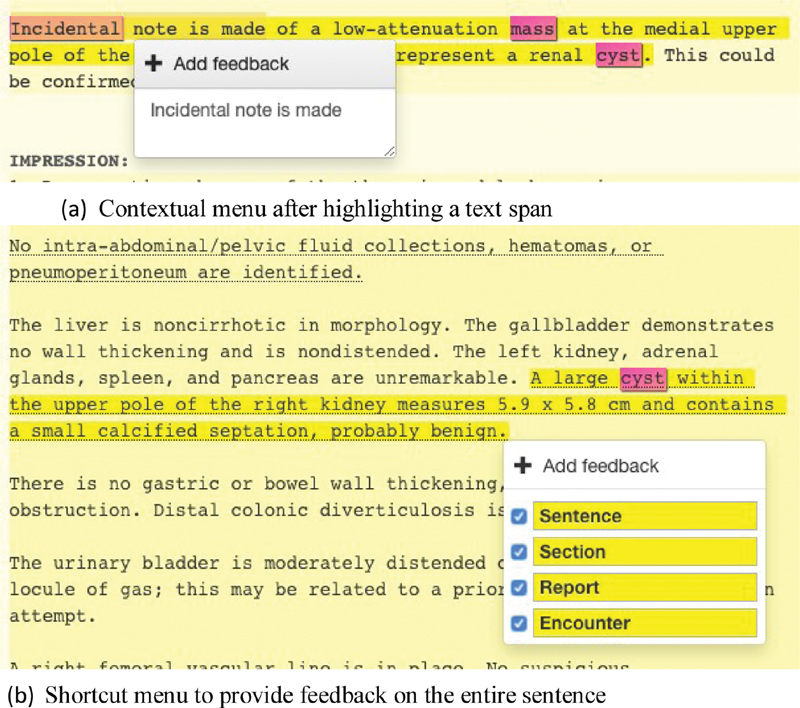
( A ) Users can add feedback by highlighting a span of text and triggering the contextual menu with a right-click. ( B ) By right clicking on the background, without any selected text span, users can add or remove an entire sentence, report, or encounter.
Review
The tool presents all the radiology reports from a single patient encounter, in a continuous scrolling view. A timeline view on the top indicates the number of reports associated with the encounter and provides shortcuts to individual reports. Reports are broken into individual sections and sentences, which are marked by yellow highlights when predicted to contain incidental findings ( Fig. 1 (1) ). Varying saturation levels to draw attention to predicted incidental findings: reports with predicted incidental findings are lightly colored in yellow, followed by a darker background for sections which contains the highlighted sentence. The miniview on the right displays an overview of the full encounter ( Fig. 1 (2) ) and helps the user navigate quickly between the reports by serving as an alternate scroll bar. A list of terms relevant for identifying incidental findings includes terms such as nodule , aneurysm , incidental , etc. ( Fig. 1 (3) ). These terms are highlighted in pink in the main document and in the miniview. Users have an option to add or remove their own terms. Incidental findings are also listed in the suggestions box on the right along with a short excerpt ( Fig. 1 (4) ). The user can click on these excerpts to scroll to the appropriate position in the full-text report.
Feedback
To revise models, users right-click on selected text spans to launch a feedback menu enabling addition, removal, or confirmation of predicted incidental findings ( Fig. 4 (a) ). Individual sections or sentences can be selected through a single right-click (no span selection required, Fig. 4 (b) ). The user also has an option to specify incidental findings at the sentence, section, report, or encounter levels individually. A checked box indicates the presence of an incidental finding. Hierarchical rules are automatically applied as the user provides feedback: if the sentence is marked as an incidental then all the upper levels are also checked. A similar user action is needed to remove incorrectly predicted findings as well. The appropriate interpretation of a feedback action is inferred from the context. For example, if the only predicted sentence is removed from a section, then both the sentence as well as the section containing it are unhighlighted. Text items against which feedback is provided are bolded and underlined ( Fig. 1 (a) and (b) ). If a user reads through a report and makes no change to predicted incidentals findings ( Fig. 1 (c) ), the initial labels are assumed to be correct and added as implicit feedback.
Retrain
A list of all current feedback is provided on the bottom panel of the right sidebar ( Fig. 1 (5) ), which shows a short excerpt from each selected text span. If a user removes highlighted incidental findings, these are also listed in the sidebar and are denoted by a strike through. Clicking on these items in the feedback list scrolls the full-text note to appropriate location. The “x”-button allows the users to undo feedback actions and remove them from the feedback list. Switching to different patient encounter triggers model retraining. Once the retraining is complete, the new predictions are highlighted. The refresh button can also be used to manually retrain and refresh predictions.
Fig. 5.
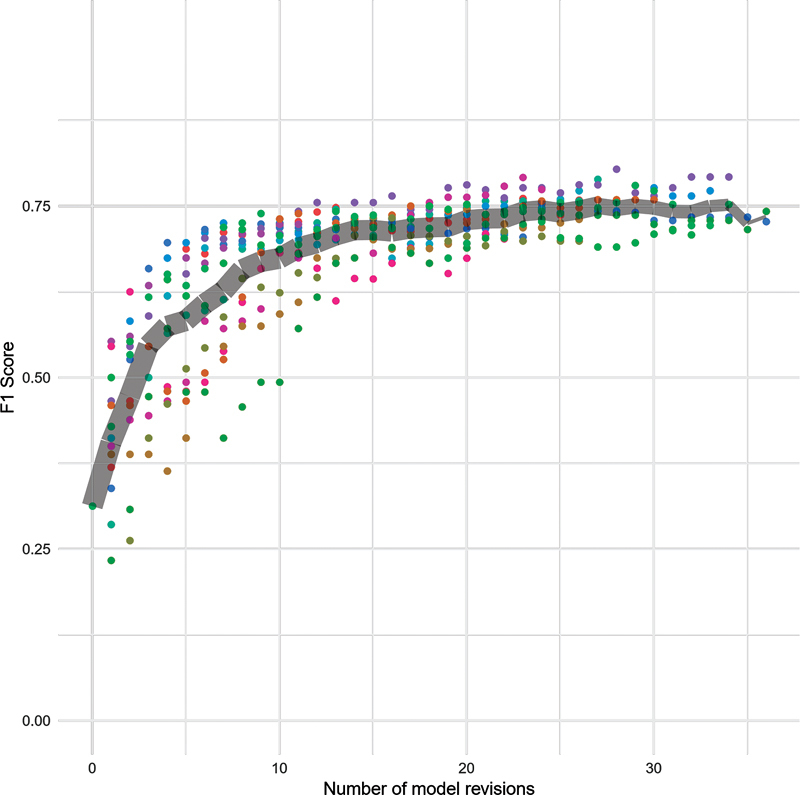
Reports: Change in F1 scores over time at report level. Colored points represent individual participants. The gray band marks the average score and tapers off in thickness to represent the decreasing number of participants completing higher numbers of revisions.
Implementation
Our tool was implemented as a Web application using the AngularJS (angularjs.org) framework. The learning pipeline was implemented as Falcon (a Web application programming interface framework for Python; falconframework.org) Web service layer. Preprocessing steps such as sentence segmentation were performed using spaCy (spacy.io), 36 with a MongoDB (mongodb.com) NoSQL database used to store preprocessed text along with full-text reports. This architecture allowed us to perform quick retraining on the fly without any delays that were noticeable to the users. SVM models were built using the Python scikit-learn machine learning library ( scikit-learn.org/ 39 ). The software and the source code are available at https://github.com/trivedigaurav/lemr-vis-web/ and https://github.com/trivedigaurav/lemr-nlp-server/ .
Evaluation
IML systems require evaluation from two different perspectives 16 40 : model performance and system usability. Thus, our evaluation maps to the two subhypotheses discussed in the “Objectives” section (H1: efficiency and model accuracy and H2: tool usability).
We recruited 15 physicians as participants with experience in reading radiology reports and identifying incidental findings to participate in the evaluation study. 41 Participants were given a $50 gift card as compensation for participating. Study sessions were conducted via Web conferencing. At the start of each study session, we collected background information about the participant including their clinical experience and the extent of their knowledge and experience with NLP tools. We then introduced the annotation guidelines and allowed the participant to seek clarifications. While we presented the guidelines as shown in Table 1 , participants were asked to select incidentals without specifying any categories. They were allowed to ask questions about the guidelines throughout the study. After a short demonstration of the tool, the participant conducted a trial run of the tool before reviewing the study encounters.
Predictive models were bootstrapped by training an initial model on a set of 6 patient encounters with gold standard labels. Each encounter included 3 to 7 radiology reports. The encounters were divided into control and intervention (experimental) conditions. Participants were asked to review radiology reports and identify all incidental findings in both these conditions. User feedback was saved and used to revise models. However, highlights predicting incidental findings were shown only in the experimental condition. For control encounters, no incidental findings were highlighted for the participants to review, but all other features of the tool were provided. Thus, the control encounters simulated the approach used in current annotation tools and current practice for documenting incidental findings. Each participant was presented with intervention encounters that were interleaved with control encounters. We asked participants to review as many encounters as possible within 60 minutes. We logged time spent on each encounter along with participant interactions with the tool.
At the end of the user study, each participant completed a poststudy questionnaire about their experience, including prompts intended to encourage feedback on individual design components of the tool.
Evaluation of Model Performance
We evaluated efficiency and model accuracy through a combination of intrinsic and extrinsic approaches.
Intrinsic evaluation : We compared predictions from the models built by the participants with human-annotated gold standard data, using F1, precision, and recall metrics. Two-thirds of the data set with 130 patient encounters (694 reports; “Data and annotation” section) was used for review during the study and the remaining third was held out for testing. We maintained similar distribution of positive incidental findings for the review and test data sets at all three levels. We used the same test and train split for all participants to allow comparison of final results.
Extrinsic evaluation : We measured time spent per encounter, as well as the total number of user-actions in the intervention and control conditions. Since each participant was presented the intervention and control encounters in an interleaved manner, we obtained a total of 15 paired samples. We ignored each participant's first encounters in both control and intervention conditions from the timing calculations to minimize learning effects. We found that most participants were able to clarify any questions or concerns about the interface after the trial run and the first two encounters.
Usability Evaluation
To assess the overall usability and usefulness of the tool, we performed a System Usability Scale (SUS) 42 evaluation along with semistructured interviews. SUS offers a quick and reliable measure for overall usability, asking 10 questions with 5-point Likert scale responses, which are used to compute an overall score from 0 to 100. We also recorded subjective feedback about individual components of the tool.
Results
Participants
Study participants were physicians with training in critical care, internal medicine, or radiology ( Table 3 ). All participants had experience in identifying incidental findings during their clinical training, practice, and/or research.
Table 3. Study participants: Summary of participants' responses from the prestudy questionnaire.
| Participant | Position | Years in position | Area | Role | Experience with NLP? |
|---|---|---|---|---|---|
| p1 | Physician | < 5 | Pediatric emergency medicine |
Clinician | No |
| p2 | Resident | < 5 | General surgery | Clinician, researcher | No; Involved in a past project |
| p3 | Resident | < 5 | Radiology | Clinician | No; But familiar |
| p4 | Resident | < 5 | Radiology | Clinician | No |
| p5 | Resident | < 5 | Neuroradiology | Clinician, researcher | No |
| p6 | Resident | < 5 | Radiology | Clinician | No |
| p7 | Resident | < 5 | Internal medicine | Clinician | No |
| p8 | Doctoral fellow | < 5 | Biomedical informatics | Researcher | No |
| p9 | Assistant professor | < 5 | Internal medicine | Clinician | No |
| p10 | Resident | 5–10 | General surgery | Clinician | No |
| p11 | Resident | 5–10 | Critical care | Clinician | No |
| p12 | Research staff | < 5 | Biomedical informatics | Clinician, researcher | No |
| p13 | Senior research scientist |
10+ | Biomedical informatics | Researcher | No |
| p14 | Assistant professor | 10+ | Internal medicine | Clinician | No |
| p15 | Resident | < 5 | General surgery | Clinician | No |
Abbreviation: NLP, natural language processing.
Model Performance
Physicians reviewed between 12 and 37 encounters (mean = 29.33 ± 6.3) in our user study. The changes in F1 scores on the test data set (relative to the gold standard labels) at each revision are shown in Figs. 5 – 7 . Comparing the F1 scores of the initial models with the final models that were derived from participant feedback in the hour-long session, we observed an increase in the F1 score from 0.22 to 0.50 to 0.68 (mean = 0.60 ± 0.04) for sentences, from 0.32 to 0.57 to 0.73 (mean = 0.68 ± 0.04) for sections, and from 0.31 to 0.70 to 0.79 (mean = 0.75 ± 0.03) for reports. Table 4 shows precision, recall, and F1 scores for initial and final models. Precision, recall, and F1 scores for models built by each participant are shown in Supplementary Table S1 (available in the online version).
Fig. 7.
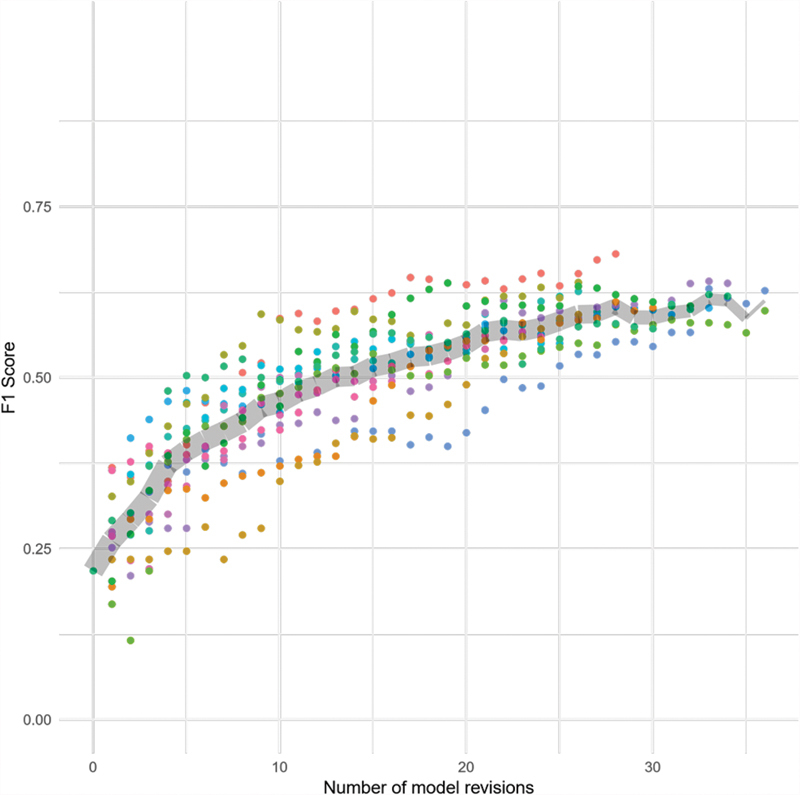
Sentences: Change in F1 scores over time at the sentence level. The colored points represent individual participants. The gray band marks the average score and tapers off in thickness to represent the decreasing number of participants completing higher numbers of revisions.
Table 4. Final scores: Precision (P), recall (R), and F1 scores at initial and final model revisions aggregated over 15 participants.
| Initial | Final | ||||||||
|---|---|---|---|---|---|---|---|---|---|
| P | R | F1 | P | R | F1 | ||||
| Range | Mean | Range | Mean | Range | Mean | ||||
| Reports | 0.90 | 0.19 | 0.31 | [0.67, 0.90] | 0.77 ± 0.06 | [0.62, 0.81] | 0.72 ± 0.05 | [0.70, 0.79] | 0.75 ± 0.03 |
| Sections | 0.86 | 0.20 | 0.32 | [0.73, 0.86] | 0.79 ± 0.04 | [0.45, 0.68] | 0.60 ± 0.07 | [0.57, 0.73] | 0.68 ± 0.04 |
| Sentences | 0.84 | 0.13 | 0.22 | [0.75, 0.88] | 0.80 ± 0.04 | [0.36, 0.62] | 0.48 ± 0.06 | [0.50, 0.68] | 0.60 ± 0.04 |
Note: The initial model was trained on the same six encounters to bootstrap the learning cycle.
Fig. 6.
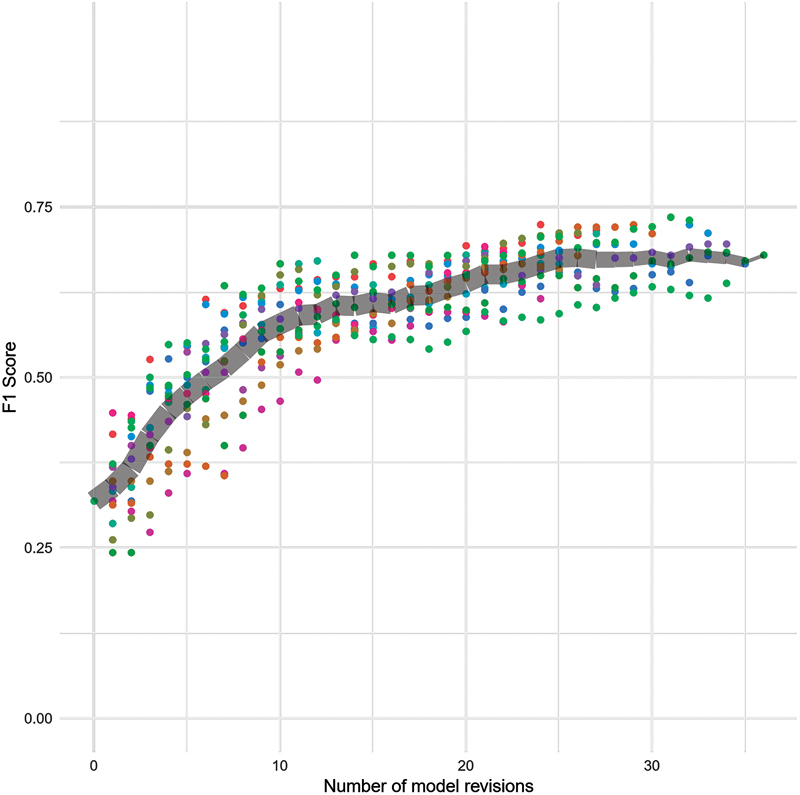
Sections: Change in F1 scores over time at the section level. The colored points represent individual participants. The gray band marks the average score and tapers off in thickness to represent the decreasing number of participants completing higher numbers of revisions.
Agreement of feedback labels with gold standard labels ranged from Cohen's κ of 0.74 to 0.91 (mean = 0.82 ± 0.05) for sentences, 0.84 to 0.96 (mean = 0.90 ± 0.04) for sections, and 0.76 to 0.95 (mean = 0.88 ± 0.05) for reports.
We observed statistically significant lower time in intervention encounters compared with control encounters (mean time: 134.38 vs. 148.44 seconds; Wilcoxon, Z = 10.0, p < 0.05). The average time spent per encounter for each participant is shown in Fig. 8 .
Fig. 8.
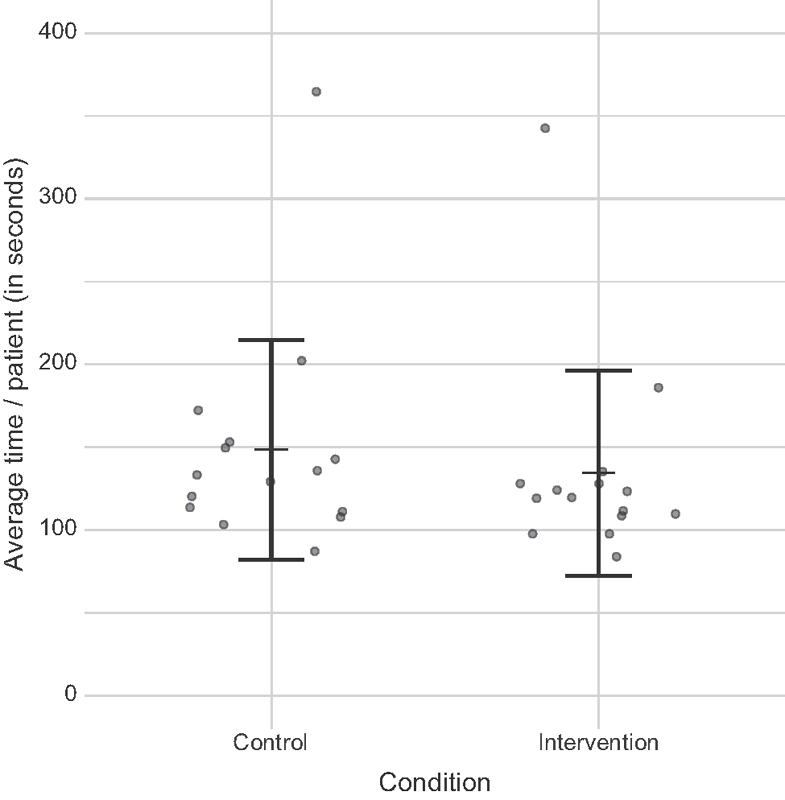
Average time spent in seconds in control and intervention conditions. Dots represent individual participants. We observed statistically significant lower time in intervention versus control conditions (mean time: 134.38 vs. 148.44 seconds; Wilcoxon, Z = 10, p < 0.05). One participant spent much longer time per encounter than others and can be seen as an outlier in both the conditions.
Comparing the total number of feedback actions, we observed statistically significant lower counts of feedback actions in intervention encounters compared with control encounters (average counts: 42.00 vs. 55.07; Wilcoxon, Z = 13.5, p < 0.05) (see Fig. 9 ).
Fig. 9.
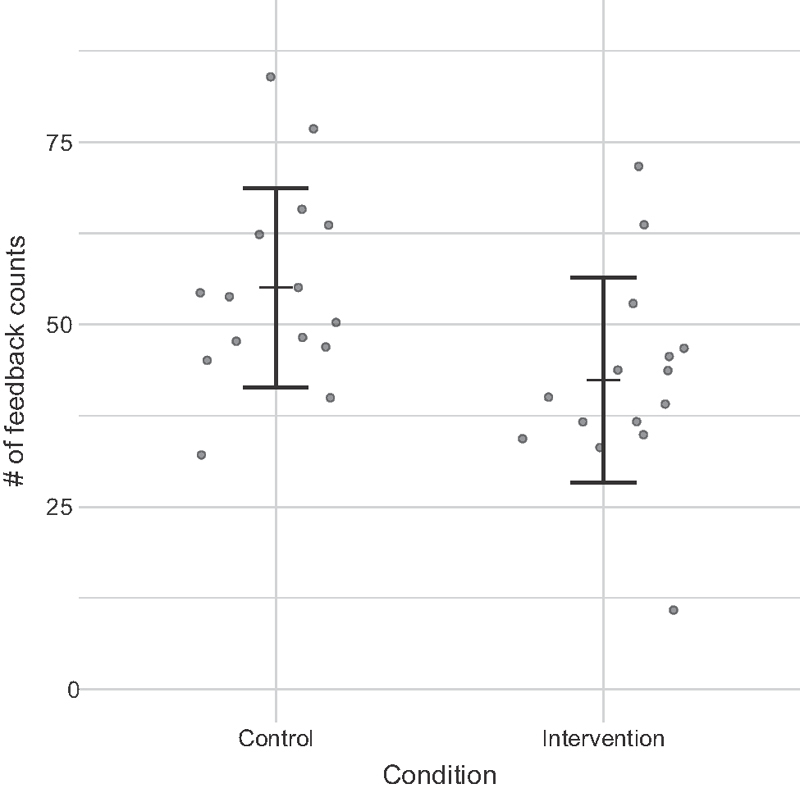
Average feedback counts in control and intervention conditions. Dots represent individual participants. We observed statistically significant lower counts in intervention versus control conditions (average counts: 42 vs. 55.07; Wilcoxon, Z = 13.5, p < 0.05).
We found no statistically significant differences between final F1 scores or agreement with gold standard labels between intervention and control encounters at any level ( Fig. 10 ).
Fig. 10.
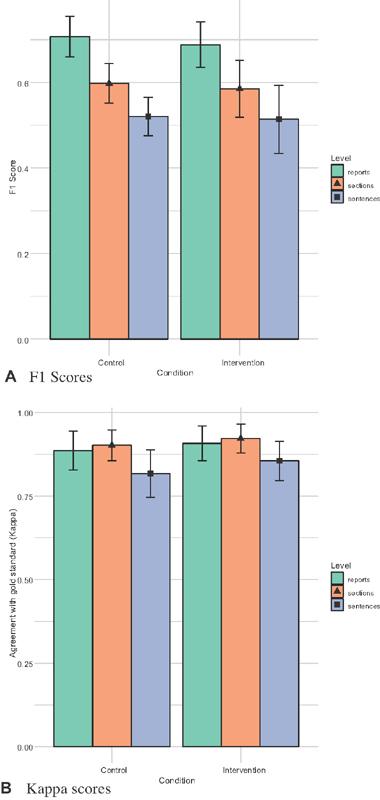
We found no statistical differences between final F1 scores or agreement with gold standard labels between control and intervention conditions at any level. ( A ) F1 scores. ( B ) Kappa scores.
Usability Results
SUS scores averaged 78.67 ( ± 9.44) out of 100. A SUS score of 68 is considered as average usability performance. 43 Table 5 shows a break-up of scores received from individual participants.
Table 5. System Usability Scale (SUS): Columns Q1–Q10 represent the user assessment score against each question.
| Participant | Q1 | Q2 | Q3 | Q4 | Q5 | Q6 | Q7 | Q8 | Q9 | Q10 | SUS |
|---|---|---|---|---|---|---|---|---|---|---|---|
| p1 | 10 | 10 | 10 | 10 | 10 | 10 | 10 | 10 | 7.5 | 7.5 | 95 |
| p2 | 10 | 7.5 | 10 | 2.5 | 7.5 | 10 | 7.5 | 10 | 7.5 | 7.5 | 80 |
| p3 | 7.5 | 7.5 | 7.5 | 7.5 | 2.5 | 7.5 | 10 | 5 | 5 | 2.5 | 62.5 |
| p4 | 7.5 | 7.5 | 5 | 2.5 | 7.5 | 7.5 | 7.5 | 7.5 | 7.5 | 7.5 | 67.5 |
| p5 | 10 | 10 | 10 | 0 | 10 | 10 | 10 | 10 | 10 | 7.5 | 87.5 |
| p6 | 7.5 | 7.5 | 7.5 | 10 | 7.5 | 7.5 | 7.5 | 7.5 | 7.5 | 7.5 | 77.5 |
| p7 | 7.5 | 7.5 | 7.5 | 7.5 | 7.5 | 7.5 | 7.5 | 7.5 | 7.5 | 7.5 | 75 |
| p8 | 5 | 7.5 | 7.5 | 7.5 | 7.5 | 7.5 | 10 | 7.5 | 5 | 5 | 70 |
| p9 | 7.5 | 7.5 | 7.5 | 5 | 7.5 | 7.5 | 7.5 | 7.5 | 7.5 | 7.5 | 72.5 |
| p10 | 7.5 | 7.5 | 10 | 10 | 7.5 | 10 | 10 | 7.5 | 7.5 | 7.5 | 85 |
| Mean (SD) |
8.17 ( ± 1.48) | 7.83 ( ± 1.29) |
8.17 ( ± 1.76) |
6.67 ( ± 3.09) |
7.83 ( ± 1.86) |
8.17 ( ± 1.48) |
8.67 ( ± 1.29) |
8.17 ( ± 1.48) |
7.67 ( ± 1.76) |
7.33 ( ± 2) |
78.67 ( ± 9.44) |
| List of questions from the SUS questionnaire: Q1. I think that I would like to use this system frequently | |||||||||||
| Q2. I found this system unnecessarily complex | |||||||||||
| Q3. I thought the system was easy to use | |||||||||||
| Q4. I think that I would need the support of a technical person to be able to use this system | |||||||||||
| Q5. I found the various functions in this system were well integrated | |||||||||||
| Q6. I thought there was too much inconsistency in this system | |||||||||||
| Q7. I would imagine that most people would learn to use this system very quickly | |||||||||||
| Q8. I found the system very cumbersome to use | |||||||||||
| Q9. I felt very confident in using the system | |||||||||||
| Q10. I needed to learn a lot of things before I could get going with this system | |||||||||||
Abbreviation: SD, standard deviation.
Note: The scores are scaled and normalized from a response on the 5-point Likert scale to a 0–10 range (higher scores are better). Overall SUS scores are computed by summing these columns.
Open-ended subjective feedback revealed no major usability problems. One participant described the tool as being “ intuitive and easy to use after initial training .” Overall, the idea for highlighting incidental findings was well received:
“ In my personal practice, I have missed out on incidental findings [on occasion] ... if we are able to highlight them, it would be very helpful .”
“ It's useful to verify that I didn't miss anything .”
Review
Participants appreciated the encounter view which provided easy access to all related reports, “ In the system that I use [at work], you have to open each report individually rather than having to see them at once and scroll through them easily .”
All participants found it useful to be able to define search terms that were highlighted in pink ( Fig. 1 (3) ). While we provided functionality to add and remove custom terms, most participants did not make use of that feature. Participants praised the highlighting components of the tool as well, “ …when it was already highlighted, my response to confirming that was an incidental was faster .” Highlighting on reports, sections, and sentences in increasing saturation levels was also found to be useful: [it signaled] “ ...that there is something going on ,” “ ...made me focus more .”
Most participants did not pay attention to the miniview of the full encounter ( Fig. 1 (2) ) but acknowledged that it would be useful in a real-world use case. A small group of participants, however, used it extensively: “ Made it easy to see where incidentals have been found, ” “ Helped me understand which page of the record I am at .”
Feedback
Participants found the mechanism for providing feedback straightforward ( Fig. 4 ). Right-click and highlight ( Fig. 4A ) was useful when sentence boundary detection was problematic: “ There were some examples when I did want the whole sentence to be highlighted .”
All but one participant gave feedback only at the sentence level even though the tool allowed users to provide feedback at section and report levels as well. This participant also provided feedback on sections and reports that were incorrectly highlighted, along with fixing errors at sentence level.
User perception of the feedback list on the bottom right was mixed ( Fig. 1 (5) ). While some participants made extensive use of undo feedback actions, others did not pay attention to the feedback list since it did not occupy a prominent location on the screen. One participant suggested that it could be combined in a single box along with system-suggested incidental findings ( Fig. 1 (3) ), while another insisted that it occupy a separate view: “ This was helpful because sometimes I noticed that I highlighted too much, so I could go back and fix it .”
Retrain
Although most participants agreed that shortcuts to click on incidental excerpts and jump to those findings in the text would be useful, they did not use this feature. Several participants remarked that they did not explore every component of the user interface as they were focused on the study task of reviewing reports.
“ I picked up more speed towards the end .”
“ If I regularly used this tool then it may be even more useful in skimming through the text – saves a lot of time .”
Suggested Future Directions
Table 6 summarizes several design improvements suggested by the participants. Participants also suggested that the approach might be useful for several categories of findings beyond incidental findings:
Table 6. List of design recommendations for improving the system from the user study.
| Category | Recommendation |
|---|---|
| Review | 1. Allow users to define their custom color schemes for highlights |
| 2. Include negation rules for keyword search. For example, differentiate between: “mass” and “no mass” 50 | |
| 3. Enable top feature highlighting as explanations for the predictions | |
| 4. Distinguish between different kinds of sections in the reports (e.g., Impression and Findings vs. other sections). Allows users to quickly jump to specific sections | |
| Feedback | 1. All but one participant gave feedback only at the sentence level even though the tool allowed them to provide feedback at report and section levels as well. Feedbacks may be provided with a single right-click instead of triggering a contextual menu first. Options for other levels may then be provided with a pop-up menu over these highlighted feedback items |
| 2. Display intelligent blurbs in the feedback list that drew attention to the main findings or keywords (e.g., “ mass ” or “ nodule ”) instead of just the leading part of the sentence | |
| Retrain | 1. Allow some free-form comments along with the feedback marking incidental findings. Not only this can serve as a helpful annotation for the other members of the team, the learning pipeline may use that as an additional input to improve models |
| 2. Some of the predefined search keywords (in pink) raised a lot of false-positives (e.g., “ note ”). An automated mechanism to suggest addition and removal of these terms may be useful |
“ We scan through a lot of reports and notes, so it would be very to help to identify important findings from the rest of the noise, ... [such a tool] could potentially help us streamline a lot of our workflow .”
Depending the situation, the physicians are looking for specific types of problems:
“ If I see bruising... I may go back and see what the radiologist noted about injuries .”
Besides incidental findings, interactive NLP could be used to build models for other kinds of findings including injuries, effusions, and clinically relevant observations that may have an impact on a patient's care and treatment. Participants also pointed out use-cases in radiology, including reminding radiologists about missed incidental findings when they dictate a report. Based on the findings listed in the report, the system could autosuggest relevant findings to be mentioned in impression including recommendations for follow-up based on the current guidelines. Other suggestions stemmed from use-cases in reading pathology reports, blood reports, laboratory test results, etc. One participant acknowledged the benefits of automation to support clinical workflow while also adding a caveat about potential automation bias:
“ Clinical notes have a lot of text and are hard to read and having something that highlights a finding – everything that saves time is helping me do the job better. Although I wouldn't want to miss something if it is not highlighted by the tool .”
Discussion
Our evaluation study demonstrated successful use of the tool by physicians with little or no experience with NLP to build models bootstrapped from a small number of initial examples. These results support the viability of adopting interactive NLP tools in clinical care settings.
We observed an average increase in F1 score from 0.31 to 0.75 for reports, 0.32 to 0.68 for sections, and from 0.22 to 0.60 for sentences ( Table 4 ) over the hour-long sessions. Specifically, we observed large improvements in our recall scores between the initial and final models. We recorded an average increase of 0.19 to 0.72 ± 0.05 for reports, 0.20 to 0.60 ± 0.07 for sections, and 0.13 to 0.48 ± 0.06 for sentences ( Table 2 ). For the final models, precision and recall scores were balanced for reports, but sections and sentence had lower recall scores. This may be due to heavily skewed training data.
From our extrinsic evaluation, we found that tool helped significantly reduce the time spent for reviewing patient cases (134.30 vs. 148.44 seconds in intervention and control, respectively), while maintaining overall quality of labels measured against our gold standard. This was because the participants needed less time identifying and marking incidental findings in the intervention condition where the tool had already highlighted them. An overall SUS score of 78.67 suggested very good usability. Subjective feedback about our user interface was also positive.
Users relied almost exclusively on feedback given at the sentence level. This is not surprising, as most incidental findings are succinctly described in a single sentence. We expected that the main application of section and report level highlighting would be for the identification of false positives. Deeper investigation into usage patterns and resulting models might provide some insight into which factors influenced user actions, and how they might be resolved in future redesigns.
Physicians spend a large proportion of their time searching notes and reports to learn relevant information about patients. Although our work focused on the use of incidental findings as an example use case, the problem of identifying important or relevant information from free-text reports may be generalized for many similar applications including preparing discharge summaries, formulating reports for rounding, and authoring consultation notes. Several of these applications were suggested by the study participants.
By building tools that integrate NLP, and more generally machine learning, into clinical workflows, we are addressing the problem of lack of upfront labeled training data and providing end users with the ability to customize models. Interactive approaches also support the evolution of guidelines and associated models over time. By building interactive NLP tools that focus on clinicians as end users, we are able to more fully realize the true potential of using NLP for real-world clinical applications.
Study Limitations
Our tool, especially the user interface, was designed solely for the user-study task and not as a general purpose EMR system. Another limitation is that the task in the study was somewhat artificial as the physicians reviewed many patients at once. In a real-world scenario, physicians may review notes for many different objectives at once and not for a singular task such as identifying incidental findings. We also compiled a list of participant feedback from the study for future design revisions. As our interpretation of participant feedback did not involve a full qualitative analysis, it is possible that our discussion of these comments missed relevant insights.
Future Work
Participants suggested extensions to our work and how such a tool may be applicable to support other clinical workflows (see Table 6 ). We used simpler classification models as a trade-off for faster speed and easier implementation versus classification performance. Future work may involve an exploration of more recent modeling approaches for classifying incidental findings. For example, we may design mechanisms for using positive and unlabeled modeling, considering soft labels based on user expertise, building collaborative models for a team, and handling evolving guidelines for labeling. Future directions may also explore automated means for informing the patients about incidental findings, 44 ensuring appropriate follow-up, 45 and preventing overdiagnosis. 46
Conclusion
Despite advances in NLP techniques, extraction of relevant information from free-text clinical notes in EMR systems is often expensive and time-consuming. 1 Traditional NLP approaches involve the construction of models based on expert-annotated corpora, requiring require extensive input from domain experts who have limited opportunity to review and provide feedback on the resulting models. Interactive NLP holds promise in addressing this gap toward improving clinical care. “Human-in-the-loop” and interactive methods may also reduce the need for labeled examples upfront and bring machine learning closer to end users who consume these models.
Prior work on IML provide guidance on how humans and machine learning algorithms should interact and collaborate. 47 48 Our work builds on these principles to demonstrate how interactive learning can be used in a key clinical task: the identification of incidental findings in radiology reports. Our prototype tool combines interactive displays of NLP results with capabilities for reviewing text and revising models, allowing physician end users to build customized NLP models on their own. The combination of these continuously learning interactive learning approaches and advances in unsupervised machine learning, has the potential to provide direct support to clinical end users, while contributing to the development of new medical insights. 49
Clinical Relevance Statement
Our interactive tool enables faster development of NLP models and provides a path for building models tailored to physicians' use. Implementation of our tool in clinical practice has the potential to both reduce time spent in the EMR system and help prevent physicians from missing important information.
Multiple Choice Questions
-
Why is detection of incidentals a challenging problem for NLP?
Most incidental findings are inconsequential and require no follow-up.
Clinicians are too busy to identify all incidental findings.
Incidentals are context dependent.
Extensive use of whole-body CT imaging often uncovers a large number of unrelated incidental findings.
Correct Answer: The correct answer is option c, incidentals are context dependent. The importance of clinical context in classifying a finding as incidental is a key source of difficulties. Moreover, guidelines and definitions for incidentals may also change over time. This presents a challenge to automated text extraction approaches based on limited training data, making the identification of incidental findings a task best served by models customized to the clinical context and medical specialty.
-
Why are interactive NLP tools useful?
Interactive tools provide superior accuracy.
They can be integrated into clinical workflows.
They provide more efficient inferences.
They can build a global model for use across different hospital systems.
Correct Answer: The correct answer is option b, they can be integrated into clinical workflows. By building clinical tools that integrate NLP into clinical workflows, we are addressing the problem of lack of upfront labeled training data and providing end users with the ability to customize models.
Funding Statement
Funding The research reported in this publication was supported by the National Library of Medicine of the National Institutes of Health under award number R01LM012095 and a Provost’s Fellowship in Intelligent Systems at the University of Pittsburgh (awarded to G.T.). The content of the paper is solely the responsibility of the authors and does not necessarily represent the official views of the National Institutes of Health or the University of Pittsburgh.
Conflict of Interest The authors declare that they have no conflicts of interest in the research. Dr. Chapman reports nonfinancial support from Health Fidelity, personal fees from IBM, outside the submitted work. Dr. Hochheiser reports grants from National Institutes of Health during the conduct of the study.
Protection of Human and Animal Subjects
Our data collection and user-study protocols were approved by the University of Pittsburgh's Institutional Review Board (PRO17030447 and PRO18070517).
Supplementary Material
References
- 1.Chapman W W, Nadkarni P M, Hirschman L, D'Avolio L W, Savova G K, Uzuner O. Overcoming barriers to NLP for clinical text: the role of shared tasks and the need for additional creative solutions. J Am Med Inform Assoc. 2011;18(05):540–543. doi: 10.1136/amiajnl-2011-000465. [DOI] [PMC free article] [PubMed] [Google Scholar]
- 2.Salim A, Sangthong B, Martin M, Brown C, Plurad D, Demetriades D. Whole body imaging in blunt multisystem trauma patients without obvious signs of injury: results of a prospective study. Arch Surg. 2006;141(05):468–473. doi: 10.1001/archsurg.141.5.468. [DOI] [PubMed] [Google Scholar]
- 3.Lumbreras B, Donat L, Hernández-Aguado I. Incidental findings in imaging diagnostic tests: a systematic review. Br J Radiol. 2010;83(988):276–289. doi: 10.1259/bjr/98067945. [DOI] [PMC free article] [PubMed] [Google Scholar]
- 4.James M K, Francois M P, Yoeli G, Doughlin G K, Lee S W. Incidental findings in blunt trauma patients: prevalence, follow-up documentation, and risk factors. Emerg Radiol. 2017;24(04):347–353. doi: 10.1007/s10140-017-1479-5. [DOI] [PubMed] [Google Scholar]
- 5.Sperry J L, Massaro M S, Collage R D et al. Incidental radiographic findings after injury: dedicated attention results in improved capture, documentation, and management. Surgery. 2010;148(04):618–624. doi: 10.1016/j.surg.2010.07.017. [DOI] [PMC free article] [PubMed] [Google Scholar]
- 6.Pons E, Braun L MM, Hunink M GM, Kors J A. Natural language processing in radiology: a systematic review. Radiology. 2016;279(02):329–343. doi: 10.1148/radiol.16142770. [DOI] [PubMed] [Google Scholar]
- 7.Cai T, Giannopoulos A A, Yu S et al. Natural language processing technologies in radiology research and clinical applications. Radiographics. 2016;36(01):176–191. doi: 10.1148/rg.2016150080. [DOI] [PMC free article] [PubMed] [Google Scholar]
- 8.Grundmeier R W, Masino A J, Casper T C et al. Identification of long bone fractures in radiology reports using natural language processing to support healthcare quality improvement. Appl Clin Inform. 2016;7(04):1051–1068. doi: 10.4338/ACI-2016-08-RA-0129. [DOI] [PMC free article] [PubMed] [Google Scholar]
- 9.Yetisgen-Yildiz M, Gunn M L, Xia F, Payne T H.Automatic identification of critical follow-up recommendation sentences in radiology reportsAMIA Annual Symposium. Proceedings of the AMIA Symposium; 2011:1593–1602 [PMC free article] [PubMed]
- 10.Zech J, Pain M, Titano J et al. Natural language-based machine learning models for the annotation of clinical radiology reports. Radiology. 2018;287(02):570–580. doi: 10.1148/radiol.2018171093. [DOI] [PubMed] [Google Scholar]
- 11.Yetisgen M, Klassen P, McCarthy L, Pellicer E, Payne T, Gunn M.Annotation of clinically important follow-up recommendations in radiology reportsIn: Proceedings of the Sixth International Workshop on Health Text Mining and Information Analysis;2015:50–54
- 12.Ware M, Frank E, Holmes G, Hall M A, Witten I H. Interactive machine learning: letting users build classifiers. Int J Hum Comput Stud. 2001;55:281–292. [Google Scholar]
- 13.Fails J A, Olsen D R., JrInteractive machine learningIn: Proceedings of the 8th International Conference on Intelligent User Interfaces;2003:39–45
- 14.Amershi S, Fogarty J, Kapoor A, Tan D.Effective end-user interaction with machine learningIn: Proceedings of the Twenty-Fifth AAAI Conference on Artificial Intelligence; 2011:1529–1532
- 15.Amershi S, Cakmak M, Knox W B, Kulesza T. Power to the people: the role of humans in interactive machine learning. AI Mag. 2014;35(04):105–120. [Google Scholar]
- 16.Boukhelifa N, Bezerianos A, Lutton E.Evaluation of Interactive Machine Learning SystemsHuman and Machine Learning, 2018
- 17.Gobbel G T, Garvin J, Reeves R et al. Assisted annotation of medical free text using RapTAT. J Am Med Inform Assoc. 2014;21(05):833–841. doi: 10.1136/amiajnl-2013-002255. [DOI] [PMC free article] [PubMed] [Google Scholar]
- 18.Gobbel G T, Reeves R, Jayaramaraja S et al. Development and evaluation of RapTAT: a machine learning system for concept mapping of phrases from medical narratives. J Biomed Inform. 2014;48:54–65. doi: 10.1016/j.jbi.2013.11.008. [DOI] [PubMed] [Google Scholar]
- 19.Mayfield E, Rosé C P.LightSIDE: Open source machine learning for textIn Handbook of Automated Essay Evaluation, 2013;146–157. Routledge [Google Scholar]
- 20.Soysal E, Wang J, Jiang M et al. CLAMP - a toolkit for efficiently building customized clinical natural language processing pipelines. J Am Med Inform Assoc. 2017:ocx132. doi: 10.1093/jamia/ocx132. [DOI] [PMC free article] [PubMed] [Google Scholar]
- 21.D'Avolio L W, Nguyen T M, Goryachev S, Fiore L D. Automated concept-level information extraction to reduce the need for custom software and rules development. J Am Med Inform Assoc. 2011;18(05):607–613. doi: 10.1136/amiajnl-2011-000183. [DOI] [PMC free article] [PubMed] [Google Scholar]
- 22.Ogren P V.Knowtator: a protégé plug-in for annotated corpus constructionIn: Proceedings of the 2006 Conference of the North American Chapter of the Association for Computational Linguistics on Human Language Technology, Morristown, NJ, USA;2006:273–275
- 23.Savova G K, Masanz J J, Ogren P V et al. Mayo clinical Text Analysis and Knowledge Extraction System (cTAKES): architecture, component evaluation and applications. J Am Med Inform Assoc. 2010;17(05):507–513. doi: 10.1136/jamia.2009.001560. [DOI] [PMC free article] [PubMed] [Google Scholar]
- 24.Malmasi S, Sandor N L, Hosomura N, Goldberg M, Skentzos S, Turchin A. Canary: an NLP platform for clinicians and researchers. Appl Clin Inform. 2017;8(02):447–453. doi: 10.4338/ACI-2017-01-IE-0018. [DOI] [PMC free article] [PubMed] [Google Scholar]
- 25.Osborne J D, Wyatt M, Westfall A O, Willig J, Bethard S, Gordon G. Efficient identification of nationally mandated reportable cancer cases using natural language processing and machine learning. J Am Med Inform Assoc. 2016;23(06):1077–1084. doi: 10.1093/jamia/ocw006. [DOI] [PMC free article] [PubMed] [Google Scholar]
- 26.Chau D H, Kittur A, Hong J I, Faloutsos C.Apolo: making sense of large network data by combining rich user interaction and machine learningIn: Proceedings of the SIGCHI Conference on Human Factors in Computing Systems, New York, NY, USA;2011:167–176
- 27.Heimerl F, Koch S, Bosch H, Ertl T. Visual classifier training for text document retrieval. IEEE Trans Vis Comput Graph. 2012;18(12):2839–2848. doi: 10.1109/TVCG.2012.277. [DOI] [PubMed] [Google Scholar]
- 28.Kulesza T, Burnett M, Wong W-K, Stumpf S.Principles of explanatory debugging to personalize interactive machine learningIn: Proceedings of the 20th International Conference on Intelligent User Interfaces, New York, NY, USA;2015:126–137
- 29.Trivedi G, Pham P, Chapman W W, Hwa R, Wiebe J, Hochheiser H. NLPReViz: an interactive tool for natural language processing on clinical text. J Am Med Inform Assoc. 2018;25(01):81–87. doi: 10.1093/jamia/ocx070. [DOI] [PMC free article] [PubMed] [Google Scholar]
- 30.Choo J, Lee C, Reddy C K, Park H. UTOPIAN: user-driven topic modeling based on interactive nonnegative matrix factorization. IEEE Trans Vis Comput Graph. 2013;19(12):1992–2001. doi: 10.1109/TVCG.2013.212. [DOI] [PubMed] [Google Scholar]
- 31.Chuang J, Ramage D, Manning C D, Heer J.Interpretation and trust: designing model-driven visualizations for text analysisIn: ACM Human Factors in Computing Systems (CHI);2012 [Google Scholar]
- 32.Wang Y, Zheng K, Xu H, Mei Q. Interactive medical word sense disambiguation through informed learning. J Am Med Inform Assoc. 2018;25(07):800–808. doi: 10.1093/jamia/ocy013. [DOI] [PMC free article] [PubMed] [Google Scholar]
- 33.Cakmak M, Thomaz A L.Optimality of human teachers for robot learnersIn: 2010 IEEE 9th International Conference on Development and Learning;2010:64–69
- 34.Gupta D, Saul M, Gilbertson J. Evaluation of a deidentification (De-Id) software engine to share pathology reports and clinical documents for research. Am J Clin Pathol. 2004;121(02):176–186. doi: 10.1309/E6K3-3GBP-E5C2-7FYU. [DOI] [PubMed] [Google Scholar]
- 35.Cohen J. A coefficient of agreement for nominal scales. Educ Psychol Meas. 1960;20(01):37–46. [Google Scholar]
- 36.Honnibal M, Johnson M.An improved non-monotonic transition system for dependency parsingIn Proceedings of the 2015 Conference on Empirical Methods in Natural Language Processing, Lisbon, Portugal;2015:1373–1378
- 37.Zaidan O F, Eisner J.Using “annotator rationales” to improve machine learning for text categorizationIn: In NAACL-HLT;2007:260–267 [Google Scholar]
- 38.Trivedi G, Hong C, Dadashzadeh E R, Handzel R M, Hochheiser H, Visweswaran S. Identifying incidental findings from radiology reports of trauma patients: an evaluation of automated feature representation methods. Int J Med Inform. 2019;129:81–87. doi: 10.1016/j.ijmedinf.2019.05.021. [DOI] [PMC free article] [PubMed] [Google Scholar]
- 39.Pedregosa F, Varoquaux G, Gramfort Aet al. Scikit-learn: machine learning in Python J Mach Learn Res 201112(Oct):2825–2830. [Google Scholar]
- 40.Fiebrink R, Cook P R, Trueman D.Human model evaluation in interactive supervised learningIn: Proceedings of the SIGCHI Conference on Human Factors in Computing Systems, New York, NY, USA;2011:147–156
- 41.Friedman C P, Wyatt J C. Secaucus, NJ: Springer-Verlag New York, Inc.; 2005. Evaluation Methods in Biomedical Informatics (Health Informatics) [Google Scholar]
- 42.Brooke J. London: Taylor and Francis; 1996. SUS: a quick and dirty usability scale. [Google Scholar]
- 43.Sauro J. Denver, CO: CreateSpace; 2011. A Practical Guide to the System Usability Scale: Background, Benchmarks and Best Practices. [Google Scholar]
- 44.Perri-Moore S, Kapsandoy S, Doyon K et al. Automated alerts and reminders targeting patients: a review of the literature. Patient Educ Couns. 2016;99(06):953–959. doi: 10.1016/j.pec.2015.12.010. [DOI] [PMC free article] [PubMed] [Google Scholar]
- 45.Xu Y, Tsujii J, Chang E I-C. Named entity recognition of follow-up and time information in 20,000 radiology reports. J Am Med Inform Assoc. 2012;19(05):792–799. doi: 10.1136/amiajnl-2012-000812. [DOI] [PMC free article] [PubMed] [Google Scholar]
- 46.Jenniskens K, de Groot J AH, Reitsma J B, Moons K GM, Hooft L, Naaktgeboren C A. Overdiagnosis across medical disciplines: a scoping review. BMJ Open. 2017;7(12):e018448. doi: 10.1136/bmjopen-2017-018448. [DOI] [PMC free article] [PubMed] [Google Scholar]
- 47.Amershi S, Weld D, Vorvoreanu Met al. Guidelines for Human-AI InteractionIn: Proceedings of the SIGCHI Conference on Human Factors in Computing Systems; New York, NY, 2019:3–13
- 48.Heer J. Agency plus automation: designing artificial intelligence into interactive systems. Proc Natl Acad Sci U S A. 2019;116(06):1844–1850. doi: 10.1073/pnas.1807184115. [DOI] [PMC free article] [PubMed] [Google Scholar]
- 49.Rajkomar A, Dean J, Kohane I. Machine learning in medicine. N Engl J Med. 2019;380(14):1347–1358. doi: 10.1056/NEJMra1814259. [DOI] [PubMed] [Google Scholar]
- 50.Chapman W W, Bridewell W, Hanbury P, Cooper G F, Buchanan B G. A simple algorithm for identifying negated findings and diseases in discharge summaries. J Biomed Inform. 2001;34(05):301–310. doi: 10.1006/jbin.2001.1029. [DOI] [PubMed] [Google Scholar]
Associated Data
This section collects any data citations, data availability statements, or supplementary materials included in this article.


