Abstract
Background/Aim: Breast cancer (BC) incidence and mortality rates have been increasing due to the lack of appropriate diagnostic tools for early detection. Proteomics-based studies may provide novel targets for early diagnosis and efficient treatment. The aim of this study was to investigate the global changes occurring in protein profiles in breast cancer tissues to discover potential diagnostic or prognostic biomarkers. Materials and Methods: BC tissues and their corresponding healthy counterparts were collected, subtyped, and subjected to comparative proteomics analyses using two-dimensional gel electrophoresis (2-DE) and two-dimensional electrophoresis fluorescence difference gel (DIGE) coupled to matrix-assisted laser desorption/ ionisation-time of flight mass spectrometry (MALDI-TOF/TOF) to explore BC metabolism at the proteome level. Western blot analysis was used to verify changes occurring at the protein levels. Results: Bioinformatics analyses performed with differentially regulated proteins highlighted the changes occurring in triacylglyceride (TAG) metabolism, and directed our attention to TAG metabolism-associated proteins, namely glycerol-3-phosphate dehydrogenase 1 (GPD1) and monoacylglycerol lipase (MAGL). These proteins were down-regulated in tumor groups in comparison to controls. Conclusion: GPD1 and MAGL might be promising tissue-based protein biomarkers with a predictive potential for BC.
Keywords: Breast cancer proteomics, monoacylglycerol lipase, glycerol-3-phosphate dehydrogenase
Despite major advances in health sciences, breast cancer (BC) is still one of the most life-threatening diseases for women. Unfortunately, BC mortality rates have been drastically increasing around the world reaching up to 522,000 deaths in 2017 alone (1). Luckily, however, not all women who have BC expire. In fact, the overall survival rate is highly dependent on the stage of the cancer. For the early detected and localized tumors (stage I and II) the chance of survival can reach up to 80-90%, while for the late detected tumors (stage III and IV) the survival rate drops dramatically to as low as 24% (1). Similarly, when 5-year survival rates were analysed, 92% of the stage 0 patients are not affected by the disease (2). While this rate for stage II patients is 75%, it goes down to 13% in stage IV patients (2). Overall, these numbers are indicative of the significance of early BC diagnosis and getting appropriate cancer treatment to prevent deaths.
Early diagnosis of BC is depended on two different tests. One of the tests relies on physical examination and imaging of the breast tissue by a physician or the patient herself. If any suspicious lump is detected, an image of the breast via mammography may be examined to assess the presence of the tumor (3). The other test may be performed directly on the biopsy material taken from the breast tissue or on the serum sample of the suspected BC patient. For BC, the CA 15-3, CA 27-29, carcinoembryonic antigen (CAE), estrogen receptor (ER), progesterone receptor (PR), human epidermal growth factor 2 (HER2) are currently the most commonly used biomarkers in the clinic (4). Each biomarker is a reporter of a special status of breast tumor. For example, CA 15-3 and CA 27-29 are glycoproteins encoded by the genes of the MUC family (5,6); their levels are increased in BC patient serum, thus representing valuable markers for BC prognosis, therapy and monitoring. However, none of these biomarkers are useful for the early diagnosis (7). Recent efforts to find a biomarker or a group of biomarkers for the early BC detection were not successful, although some novel prognostic biomarkers were proposed (8).
To discover useful biomarkers that are BC-specific and allow early diagnosis, the molecular mechanisms causing the conversion of cells from normal to cancerous state have to be elucidated in detail. Migration properties and growth rates of the aggressive tumor types, as well as their genetic and biochemical changes should be determined and compared to their non-aggressive counterparts. The answers to the question of how a dysregulated protein expression in cancer cells contributes to ungoverned tumor growth should provide a list of candidate biomarkers that will have the power to specifically diagnose BC at an early stage.
In this study, we first investigated the global changes in protein profiles using protein extracts from human BC tissues and their healthy counterparts via two-dimensional gel electrophoresis (2-DE). Then fluorescence difference gel electrophoresis (DIGE) analysis was performed to verify 2-DE results and generate a list of differentially regulated proteins. The changes in the expression levels of two proteins namely MAGL and GPD1 were further analysed in the BC molecular subtypes and the healthy controls. A bioinformatics analysis was carried out to associate the changes in protein abundance with the relevant biological processes. The data generated in this study represented the first detailed report for a comprehensive proteomic study using fresh-frozen BC tissue samples classified into the BC subtypes.
Materials and Methods
Ethical approval. This study has been approved by the Ethics Committee of Kocaeli University (approval numbers: KOU KAEK 2015/274 and KU GOKAEK 2018/49). Informed consents, approved by the institutional ethics committee, were obtained from each patient.
Procurement and storage of the tissues. The BC and corresponding healthy tissues were collected from the patients who were diagnosed with BC at Kocaeli University Medical School General Surgery Department and underwent lumpectomy or mastectomy between the years of 2015 and 2017. Immediately after the removal, the breast tissues were washed with ice-cold 10 mM Tris buffer containing 250 mM sucrose pH 7.4, snap frozen in liquid nitrogen and stored at –80˚C.
Patient characteristics. One hundred female BC patients aged between 30-60 years old and diagnosed with invasive or infiltrating ductal carcinoma (IDC) have been selected, and incorporated into this study. The patients did not receive prior treatment such as endocrine therapy and/or chemotherapy.
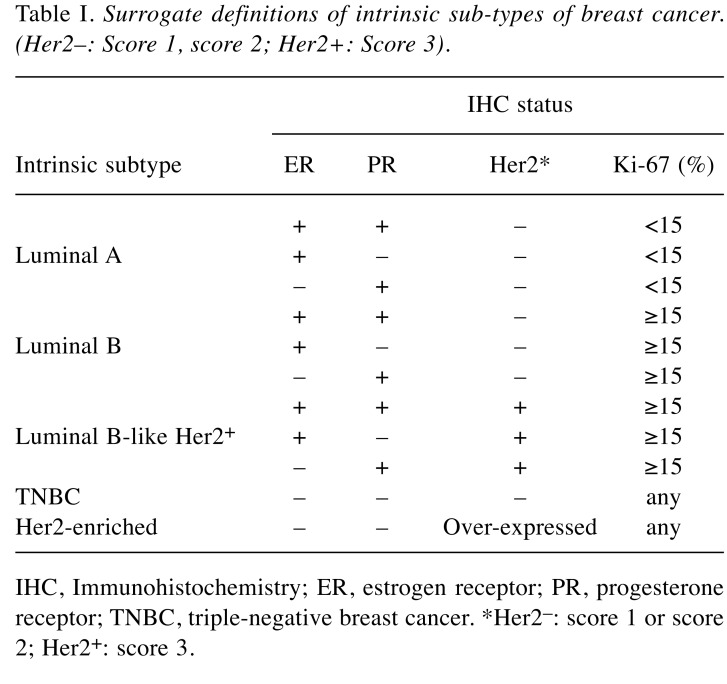
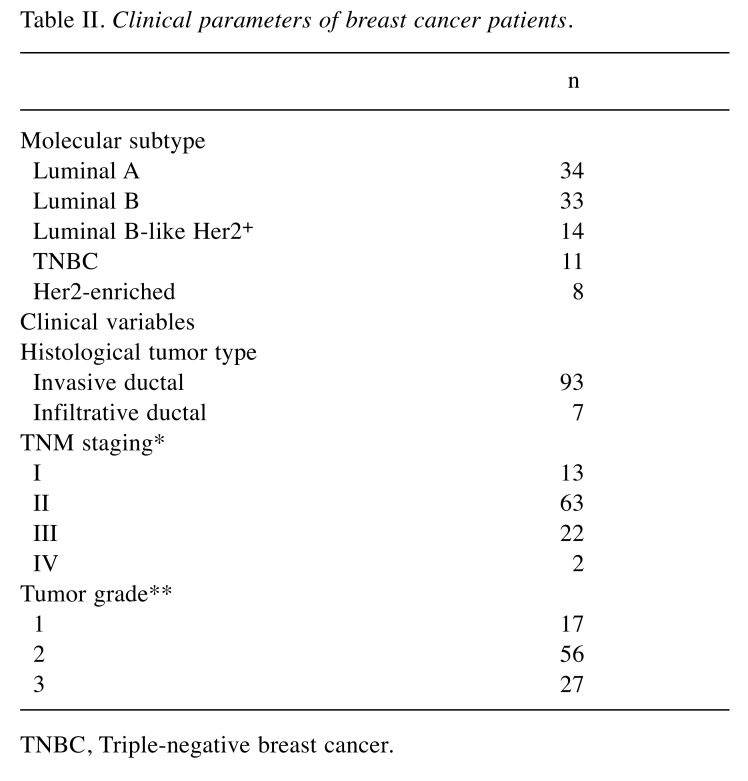
Molecular subtyping of tumor samples. Molecular subtyping of tumor samples was performed at Kocaeli University Medical School Pathology department by analysing expressions of ER, PR, HER2, and Ki-67 proteins. The expressions of these proteins were evaluated using routine immunohistochemical methods (9). Based on the expression patterns, the tumor tissues were grouped into five different subtypes, namely Luminal A (ER+ and/or PR+, HER2–, Ki-67<15%); Luminal B (Her2–) (ER+ and/or PR+, HER2–, Ki-67≥15%); Luminal B-like (HER2+) (ER+ and/or PR+, HER2+, Ki-67≥15%); Her2-enriched (ER–, PR–, HER2+); triple negative BC (TNBC) (ER–, PR–, HER2–) (Table I) (10,11). In overall, Luminal A, Luminal B, Luminal B-like, Her2-enriched, and TNBC groups were consisted of 34, 33, 14, 8, and 11 patients, respectively (Table II). The control group consisted of 100 samples obtained from healthy breast tissue.
Table I. Surrogate definitions of intrinsic sub-types of breast cancer. (Her2–: Score 1, score 2; Her2+: Score 3).
IHC, Immunohistochemistry; ER, estrogen receptor; PR, progesterone receptor; TNBC, triple-negative breast cancer. *Her2–: score 1 or score 2; Her2+: score 3.
Table II. Clinical parameters of breast cancer patients.
TNBC, Triple-negative breast cancer.
Preparation of protein extracts. Tissue samples were thawed on ice and cut into small pieces (<1.00 mm) before centrifuged for 5 min at 10,000 × g to remove blood and the wash solution. Approximately 200 μl lysis buffer (7 M urea, 2 M thiourea, 10 mM Tris-HCl pH 8.0, 5 mM magnesium acetate, 4% CHAPS, pH 8.0) was added onto 0.15 g minced tissues and homogenized with Scilogex homogenizer (Rocky hill, CT, USA) for about 10 s at 20,000 rpm, on ice. Further homogenization was achieved with a bead-beater (Blut blender, Next Advance, Troy, NY, USA) using 0.2 mm stainless steel beads. The homogenates were centrifuged for 15 min at 10,000 × g to obtain a crude supernatant which was further centrifuged for 45 min at 15,000 × g to obtain a clear protein extract. Protein concentrations were determined by a modified Bradford assay (Bio-Rad, Hercules, CA, USA).
Two-dimensional gel electrophoresis (2-DE). Protein extract (500 μg) was loaded onto 11 cm non-linear pH 3-10 immobilized pH gradient (IPG) strips (Bio-Rad) by passive rehydration. First dimension separation based on isoelectric points was performed with a Protean isoelectric focusing cell (Bio-Rad) using the following conditions: 20 min at 250 V with rapid ramp, 2 h at 4,000 V with slow ramp, and 8,000 V with rapid ramp until a total of 25,000 V/h was reached, at 20˚C. Following isoelectric focusing, strips were washed with buffer I (6 M Urea, 375 mM Tris-HCl pH 8.8, 2% SDS, 20% glycerol, 2% w/v DTT) for 15 min and then with buffer II (6 M Urea, 375 mM Tris-HCl pH 8.8, 2% SDS, 20% glycerol, 2.5% w/v iodoacetamide) for 15 min at room temperature. Second dimension separation based on molecular weights was achieved by sodium dodecyl sulphate-polyacrylamide gel electrophoresis (SDS-PAGE; 12%) using Criterion Dodeca gel running system (Bio-Rad). Gels were stained with colloidal Coomassie Blue and visualized by VersaDoc4000 MP (Bio-Rad) using QuantityOne software (Version 4.6.7, Bio-Rad).
Fluorescence difference gel electrophoresis (DIGE). Protein extracts were pooled in equal amounts and were labelled with CyDye minimal fluors using the CyDye™ DIGE Fluor Minimal Labeling Kit (GE Healthcare, Chicago, IL, USA); the experiments were carried out in dark. In brief, 50 μg of protein sample was used in each experiment. The pH of the extracts was adjusted to 8.5, and then protein pools were incubated with the dyes Cy2, Cy3, and Cy5 at 4˚C for 30 min. Labelling reactions were stopped by adding 10 mM lysine. Labelled protein samples were then combined and a standard 2-DE experiment was performed.
Analysis of 2-DE and DIGE gel images. The Coomassie-stained 2-DE gels were analysed with PDQuest Advance 2-DE Analysis Software (Version 8.0.1 build 055, Bio-Rad) which provided the tools for spot intensity calibration, spot detection, and background subtraction. Two separate gels were run for each pooled group to minimize the experimental variation. Stain speckles were filtered and the standardized areas of interest from all gels were warped and matched and the quantity of each spot was normalized by the total valid spot intensity using linear regression model. The statistical significance of image analysis was determined by the Student’s t-test (statistical level of p<0.05 was considered significant). Protein spots with differences in expression more than 2-fold were selected and excised from gels using ExQuest Spotcutter (Bio-Rad).
DIGE gels were also visualized with VersaDoc MP4000 (Bio-Rad) using three different light sources. After automatic spot detection by using PDQuest Advance Analysis Software, spots were manually revised with edition tools to prevent mismatches. Spot picking was performed using a preparative 2-DE gel, which was stained with colloidal Coomassie blue. The preparative gel was aligned with the DIGE reference image to outline the spots of interest selected during DIGE analysis. All selected spots were excised as described above.
In-gel tryptic digestion and matrix-assisted laser desorption/ ionisation-time of flight mass spectrometry (MALDI TOF/TOF) analysis. In-gel digestion was performed using the in-gel tryptic digestion kit (Thermo Fisher Scientific) according to the manufacturer’s instructions. Digested peptides were then desalted and concentrated using C18 ZipTips (Millipore, Burlington, MA, USA). Peptides were eluted with a matrix solution containing 50% (v/v) acetonitrile (Sigma Aldrich, St. Louis, MO, USA) 0.1% (v/v) trifluoroacetic acid (Sigma Aldrich) and 10 mg/ml alpha-cyano-4-hydroxycinnamic acid (α-CHCA) (Sigma Aldrich), and were spotted onto MALDI target plate. An AB SCIEX TOF/TOF 5800 instrument (AB Sciex, Framingham, MA, USA) was used to generate peptide-mass fingerprints (PMFs) for protein identification (12).
Tandem mass spectrometry (MS/SM) data analysis. PMFs were searched in the MASCOT database (Matrix Science, Boston, MA, USA) using ProteinPilot software 4.0.8085 revision 148085 (AB Sciex). Search parameters included; human as taxonomy, trypsin as the enzyme, ±50 ppm as the precursor tolerance, ±0.4 Da as the MS/MS fragment tolerance, and carbamidomethyl and MetOxidation as the variable modifications. Only hits with p<0.05 value were accepted for protein determination.
Western blot (WB) analysis. Proteins were separated by SDS-PAGE (12%) and transferred onto a nitrocellulose membrane (GE Healthcare, Chicago, IL, USA) using a Trans-Blot SD Semi-Dry Transfer Cell (Bio-Rad). The membrane was blocked in TBS-T buffer (Tris-HCl 25 mM pH 7.2, NaCl 150 mM, and 0.1% Tween 20) containing 5% non-fat dry milk for 1 h at room temperature and washed with TBS-T for three times before incubation of primary antibody diluted in TBS-T for 1 h at room temperature or overnight at 4˚C. The membrane was then washed three times with TBS-T and incubated with goat anti-mouse HRP-labelled secondary antibody (#170-5047; Bio-Rad) for 1 h at room temperature. Following subsequent three washes with TBS-T, protein bands were visualized with an enhanced chemiluminescence detection system (Bio-Rad). Monoclonal anti-β-actin antibody (sc-81178; Santa Cruz Biotechnology, Santa Cruz, CA, USA), monoclonal anti-glycerol-3-phosphate dehydrogenase NAD+, cytoplasmic antibody (anti-GPD1) (sc-376219; Santa Cruz Biotechnology), and monoclonal anti-monoglyceride lipase antibody (anti-MAGL) (sc-398942; Santa Cruz Biotechnology, USA) were used at the respective dilutions of 1:1000, 1:750, and 1:750. Either QuantityOne (Bio-Rad) or ImageJ (https://imagej.nih.gov/ij/index.html) was used for relative quantitative assessments of the band intensities when necessary.
Cell culture. CHO (Chinese hamster ovary cells), SH-SY5Y (human neuroblastoma cells), HeLa (human cervical cancer cells) and MCF-7 (human breast adenocarcinoma cells) cell lines were purchased from ATCC (Manassas, VA, USA). DP (dental pulp derived mesenchymal stem cells) was purchased from Kocaeli University Stem Cell Research Center (KOGEM, Kocaeli, Turkey). The cells were cultured in DMEM (Lonza, Basel, Switzerland) low-glucose medium supplemented with 10% fetal bovine serum (FBS) (Lonza), 100 μg/ml penicillin/streptomycin (Lonza) and 2 mM L-glutamine (Lonza) at 37˚C in a humidified 5% CO2 atmosphere. Primary breast adenocarcinoma cells (PCL) were isolated using a commercial kit (Cancer Cell Isolation Kit, Thermo Scientific) from a TNBC tissue sample and grown in DMEM high-glucose medium supplemented with 10% heat-inactivated FBS, 100 μg/ml penicillin-streptomycin, 2 mM L-glutamine, and human epidermal growth factor (EGF; 10 ng/ml) at 37˚C in a humidified 5% CO2 atmosphere. Confluent cells (70-80%) were washed with PBS for three times and removed from the plates by scraping. Cell pellet was created by centrifugation at 1,500 × g for 10 min at 4˚C. Mammalian protein extraction reagent (M-PER, Thermo Scientific) containing protease inhibitor cocktail (Roche, Indianapolis, IN, USA) was added over each cell pellet and cells were homogenized with a bead-beater using stainless steel beads. The soluble protein fraction was obtained by centrifugation at 10,000 × rpm for 10 min and 15,000 × rpm for 45 min at 4˚C. Protein concentrations were measured as described above. Protein extracts were stored at −80˚C after snap-frozen in liquid nitrogen.
Immunofluorescence (IF) microscopy. Cells were also grown on culture plates containing 12 mm poly-D-lysine-coated cover slips (Corning Inc., Corning, NY, USA) for IF microscopy. Cells on cover slips were fixed with 3% formaldehyde and permeabilized with PBS containing 0.5% Triton X-100. Anti-GPD1 and anti-MAGL antibodies (Santa Cruz) were used at the dilution of 1:100. Goat anti-mouse Texas Red antibody (T-6390; Thermo Scientific) was used as the secondary antibody with a dilution of 1:100. The nuclei were stained with DAPI (Molecular Probes, Eugene, OR, USA) (0.5% in PBS) and cover slips were mounted on glass slides using Mowiol®. Cells were observed with an inverted Olympus CKX41 microscope (Olympus, Tokyo, Japan) with appropriate filters. Images were processed using ImageJ software and localization of the proteins was assessed.
Bioinformatics analysis. STRING analysis (https://string-db.org) was carried out using the UniProt accession numbers of the regulated proteins. The search engine option was set to “multiple proteins by names/identifiers” and the organism was specified as Homo sapiens. The retrieved proteins were manually checked to assure that they were all correctly retrieved from the database. Whole genome analysis was the preferred choice. The setting tab was used to change the stringency of the analysis. The parameters for STRING search included interaction score of medium confidence, selected maximum number of interactors for the 1st and 2nd shells of no more than 5 interactors, active interaction sources of text mining, experiments, databases, co-expression, neighbourhood, gene fusion and co-occurrence. The hits considered in this study had false discovery rates (FDR) smaller than 1e-04. DAVID analysis (version 6.8; David Bioinformatics Resources) (https://david.ncifcrf.gov) was carried out using the UniProt accession numbers of the regulated proteins. Principal component analysis (PCA) was performed using the add-in statistical software XLSTAT (Addinsoft, New York, NY, USA). Average spot intensities were exported from PDQuest Advance as tab delaminated Excel data. Missing intensities were estimated using mean mode approach in XLSTAT and descriptive statistics and correlations were calculated. Venn diagrams were created using the on-line tool available at: http://bioinformatics.psb.ugent.be/webtools/Venn/.
Statistical analysis. 2-DE experiments were performed in duplicate while WB experiments were performed in triplicate. When it was required quantitative results were expressed as means±standard deviation (SD). The p-values were calculated using one-way analysis of variance (ANOVA) or Student t-tests in XLSTAT software (Addinsoft, New York, USA). All p-values <0.05 were considered statistically significant. Only significant hits, as defined by the MASCOT probability analysis (p<0.05), were accepted.
Results
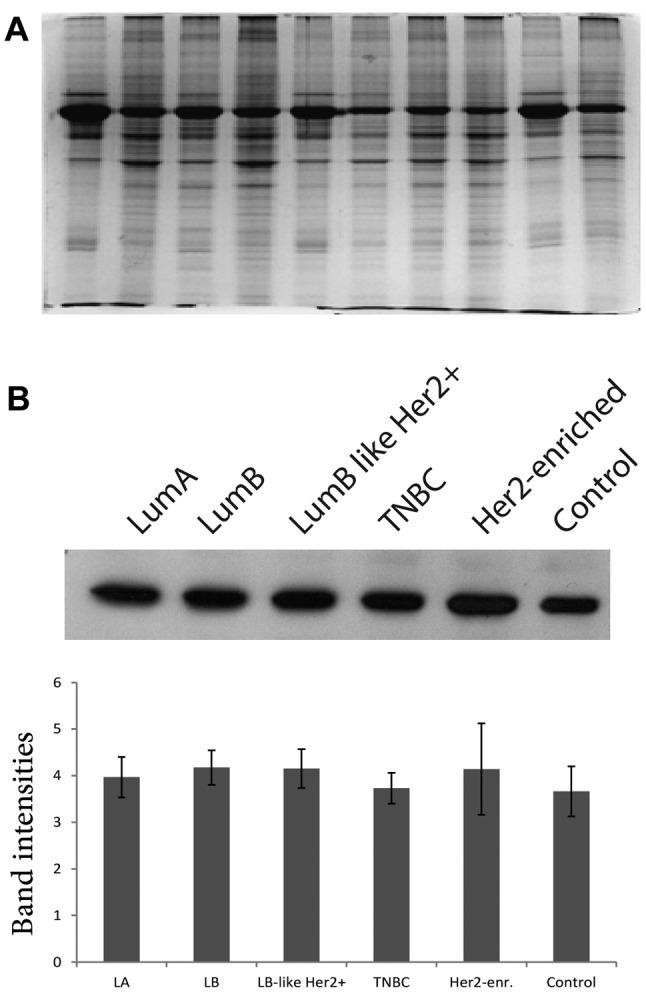
Preparation of protein pools. SDS-PAGE gels were run to assess the quality and the quantity of each protein extract after measurement of protein concentrations. In terms of quality, each sample displayed distinct bands without any evidence of smear indicating that the protein extracts required no further clean up (Figure 1A). Moreover, WB analysis was performed using anti-beta-actin antibody to ensure equal protein loading (13). The protein pools were accurately recreated according to WB quantification results (Figure 1B).
Figure 1. Normalization of protein concentrations in protein pools. Selected protein extracts were analyzed by SDS-PAGE (A). Western blot (WB) analysis of the protein pools of each tumor and control groups after normalization with actin. The band intensities were measured by performing densitometric analysis using ImageJ software (B).
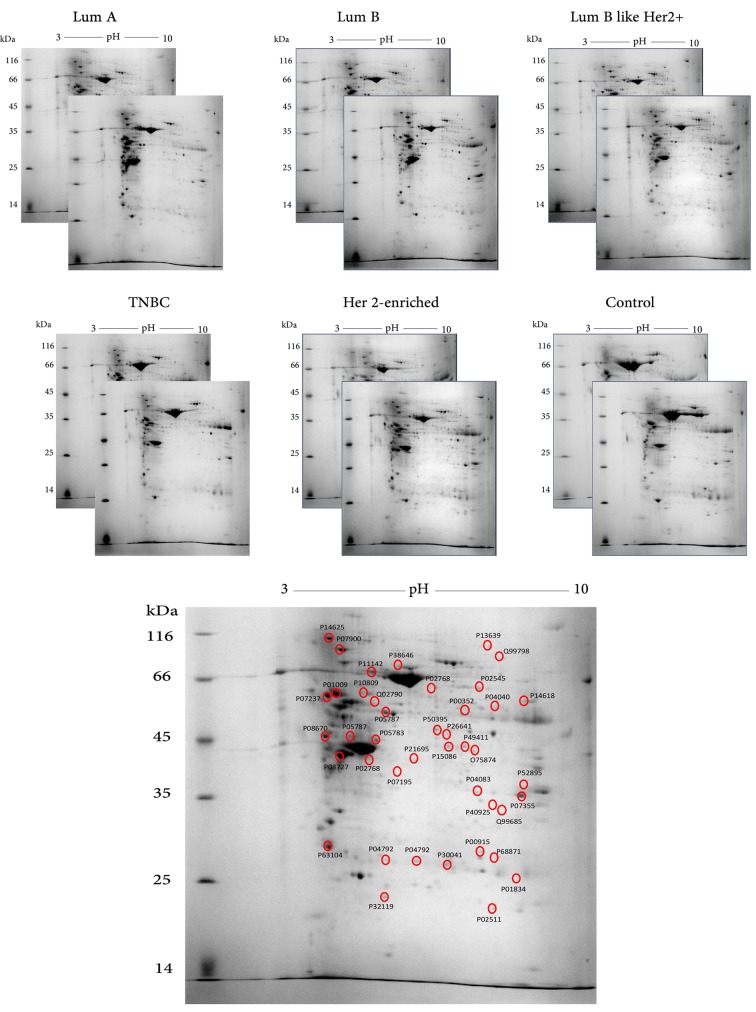
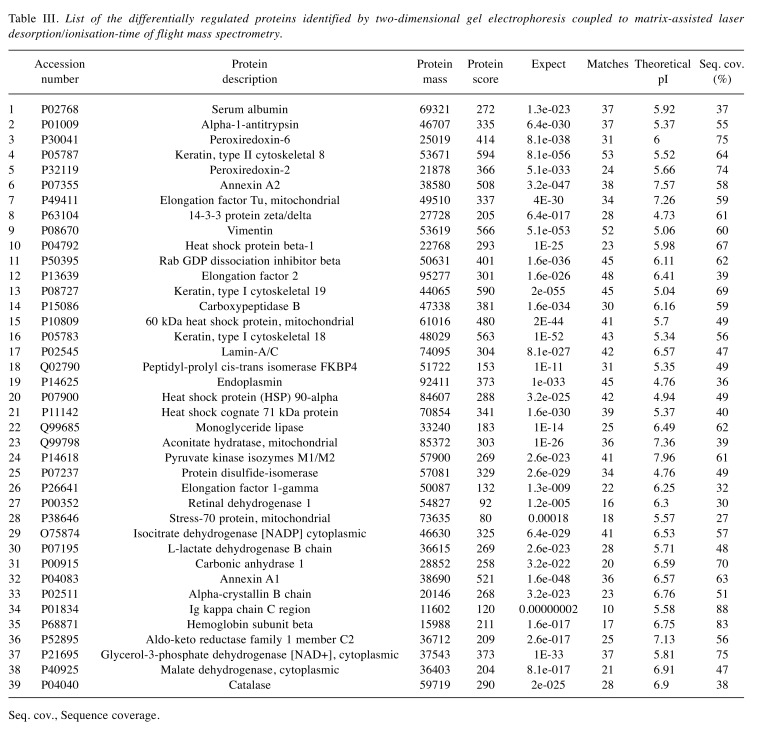
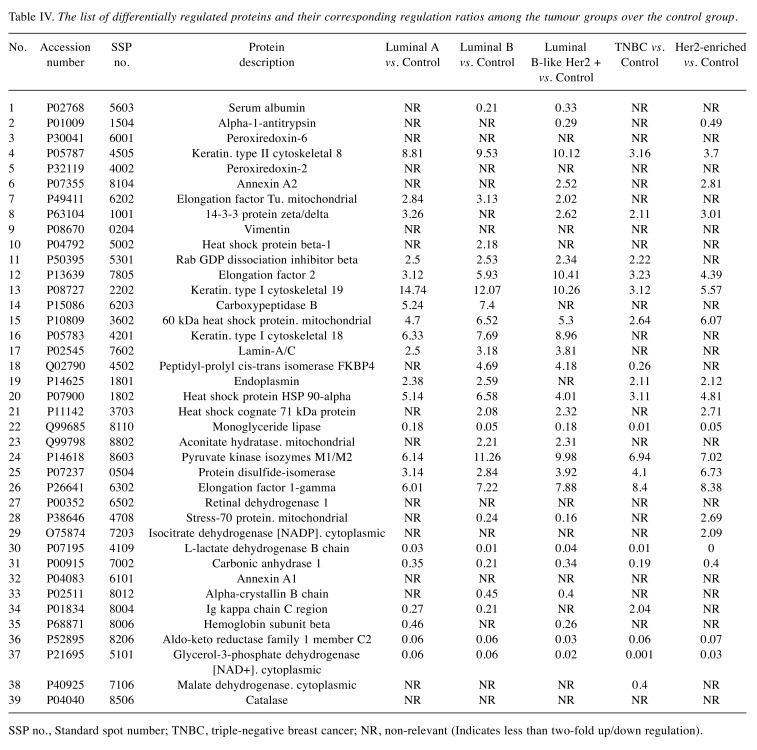
Comparative 2-DE analysis revealed 13 proteins that were differentially regulated in the tumor groups compared to the control. Well-resolved and reproducible 2-DE gels were produced and subjected to spot detection (Figure 2). An average of 750 spots per analytical gel was detected. The overall mean coefficient for spot matching was 24%, indicating that the protein distribution patterns among the gels were highly similar. Protein spots that significantly differed in expression (more than 2-fold) were selected and identified by MALDI-TOF/TOF analysis. The changes in spot intensities were compared for each tumor protein pool in comparison to the control pool (e.g., Luminal A versus control or Luminal B versus control), while comparisons between tumor groups (e.g., Luminal A versus Luminal B) were not considered in this study. Lists of the identified proteins with their respective MALDI scores and their corresponding regulation ratios among the tumor groups over the control group are given in Table III and Table IV, respectively.
Figure 2. Images of the two-dimensional electrophoresis (2-DE) gels for tumor and control groups. The representative gel marked with hollow circles and labelled with Uniprot accession numbers indicates the positions of the identified protein spots on the gel. Lum, Luminal; TNBC, triplenegative breast cancer.
Table III. List of the differentially regulated proteins identified by two-dimensional gel electrophoresis coupled to matrix-assisted laser resorption/ionisation-time of flight mass spectrometry.
Seq. cov., Sequence coverage.
Table IV. The list of differentially regulated proteins and their corresponding regulation ratios among the tumour groups over the control group.
SSP no., Standard spot number; TNBC, triple-negative breast cancer; NR, non-relevant (Indicates less than two-fold up/down regulation).
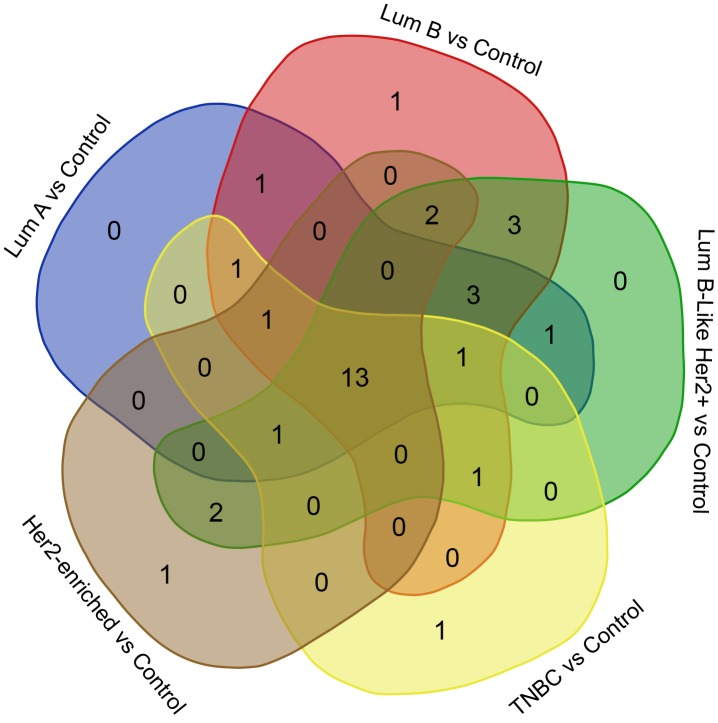
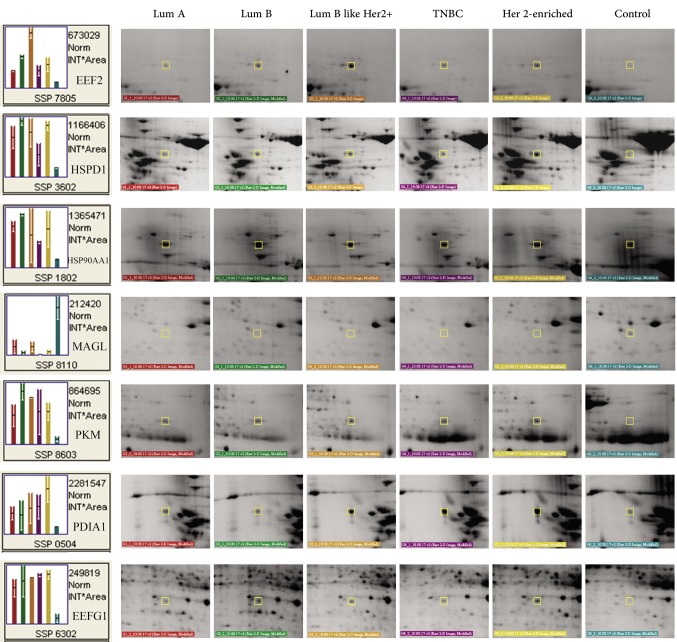
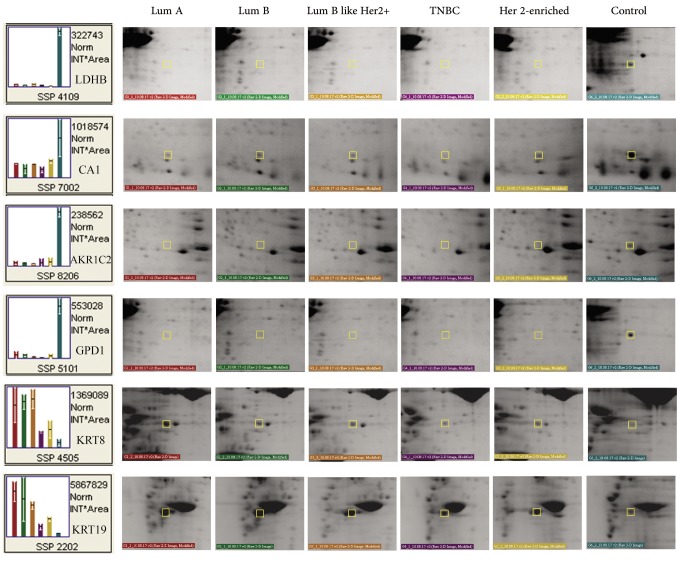
A Venn diagram was created using the accession numbers of differentially regulated proteins in each comparative analysis (tumor groups versus control group) (Figure 3). Thirteen shared proteins were differentially regulated in each tumor group in comparison to the control (Figure 4). Those proteins were elongation factor 2 (EEF2), 60 kDa heat shock protein (HSPD1), heat shock protein 90-alpha (HSP90AA1), monoacylglycerol lipase (MAGL), pyruvate kinase (PK), protein disulfide-isomerase (PDIA1), elongation factor 1-gamma (EEFG1), L-lactate dehydrogenase B chain (LDHB), carbonic anhydrase 1(CA1), aldo-keto reductase family 1 member C2 (AKR1C2), cytoplasmic glycerol-3-phosphate dehydrogenase [NAD+] (GPD1), keratin type II cytoskeletal 8 (KRT8), and keratin type I cytoskeletal 19 (KRT19). When regulation ratios of these thirteen proteins were analysed, MAGL, LDHB, CA1, AKR1C2 and GPD1 displayed low expression levels while EEF2, HSPD1, HSP90AA1, PKM, PDIA1, EEFG1, KRT8 and KRT19 displayed high expression levels in tumor groups in comparison to the control group.
Figure 3. Venn diagram created to reveal identities of the shared proteins among the differentially regulated proteins in each comparative analysis of tumor groups against the control group. Lum, Luminal; TNBC, triple-negative breast cancer.
Figure 4. Representative close-up images of the differentially regulated proteins. The proteins shared in the Venn diagram (n=13) were determined by comparing tumor groups with the control group. The determined the proteins were used to create the close-up images. Lum, Luminal; TNBC, triple-negative breast cancer.
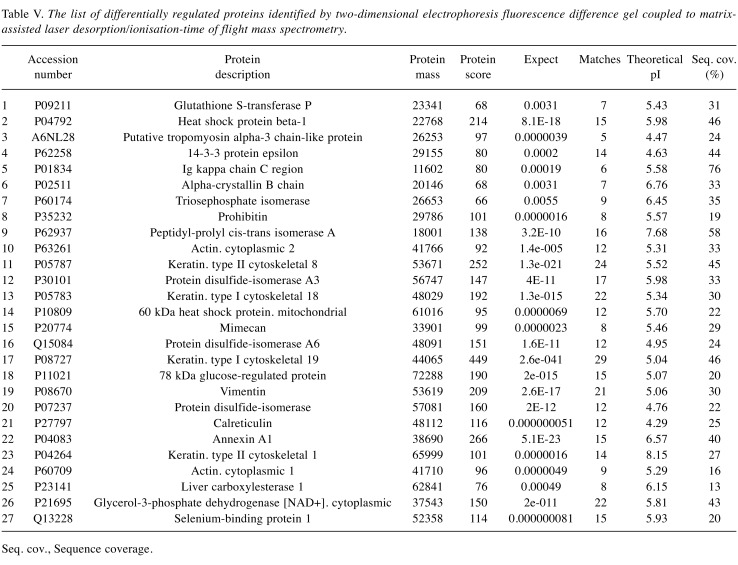
Comparative DIGE analysis revealed 5 proteins down-regulated in tumor tissues compared to the control. For DIGE analysis, a separate protein pool representing each tumor subtype was formed. This protein pool was then compared with the control protein pool (Figure 5). Based on the 2-fold change criteria, differentially regulated proteins were detected and identified by MALDI-TOF/TOF (Table V). GPD1 received our attention since it was highly down-regulated in the tumor tissues in comparison to control tissues in the DIGE experiment with a similar trend observed in 2-DE experiments. Among the proteins that were differentially regulated in the tumor groups compared to the control, we focused on two that showed down-regulation and were involved in the same pathways. Specifically, GPD1 and MAGL, which are involved in triacylglycerol metabolism (14) were selected for further verification experiments.
Figure 5. Representative images of the two-dimensional electrophoresis fluorescence difference (DIGE) gels used for comparative analysis. Pooled protein extracts from the tumor and control samples were labelled with Cye3 and Cye5, respectively. The internal control mix (Cye2-labeled), used for normalization, was formed by mixing equal amounts of protein from the tumor and the control pools. The superimposed image was the product of superimposing all three Cye dye images; images were pseudo-coloured.
Table V. The list of differentially regulated proteins identified by two-dimensional electrophoresis fluorescence difference gel coupled to matrixassisted laser desorption/ionisation-time of flight mass spectrometry.
Seq. cov., Sequence coverage.
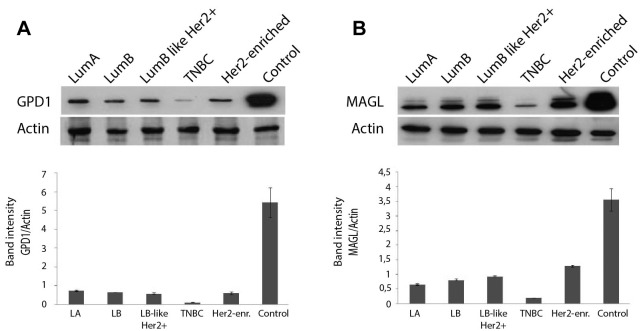
WB analysis verified the changes in GPD1 and MAGL protein levels. The protein pools from the tumor and the control groups were analysed by WB using anti-GPD1 and anti-MAGL monoclonal antibodies. The results indicated low levels of both proteins in the tumor pools in comparison to the control, thus verifying the findings of 2-DE and DIGE experiments. Moreover, comparisons among the tumor groups revealed that the TNBC group had the lowest level of GPD1 and MAGL expression, while the other tumor groups displayed similar GPD1 expression levels (GPD1: >1000-fold difference, p=0.03; MAGL: >100-fold difference, p=0.04) (Figure 6A and B).
Figure 6. Western blot analysis of the tumor groups and the control group using anti- glycerol-3-phosphate dehydrogenase 1 (anti-GPD1) antibody (A) and anti-monoacylglycerol lipase (anti-MAGL) antibody (B) to determine the changes on the protein expression levels. The band intensities were measured by performing densitometric analysis using ImageJ software. Lum, Luminal; TNBC, triple-negative breast cancer.
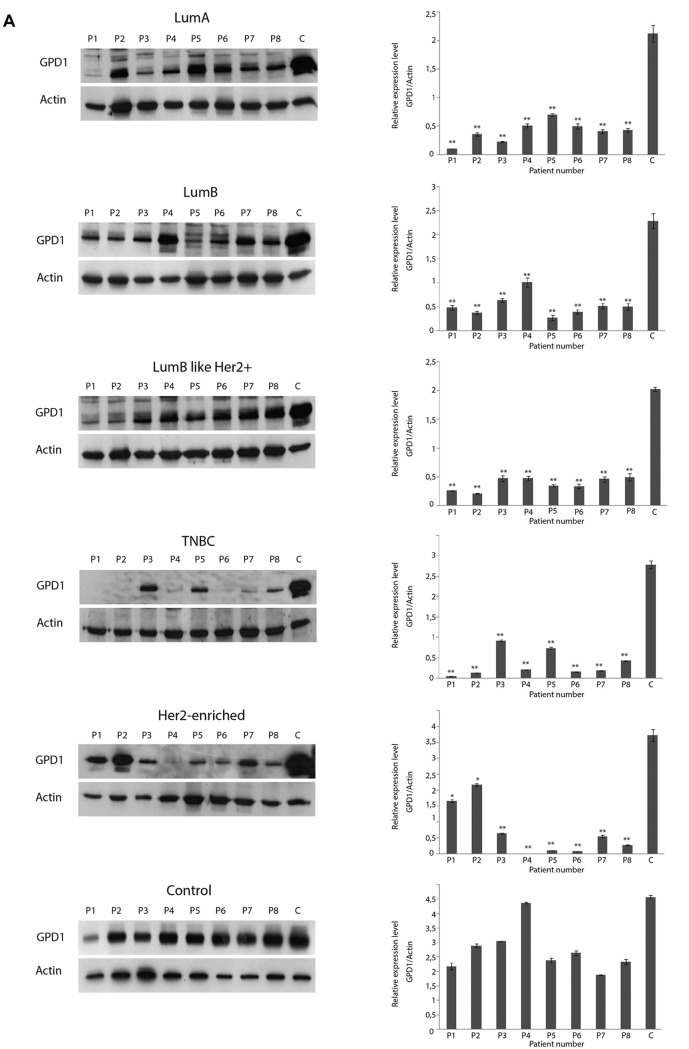
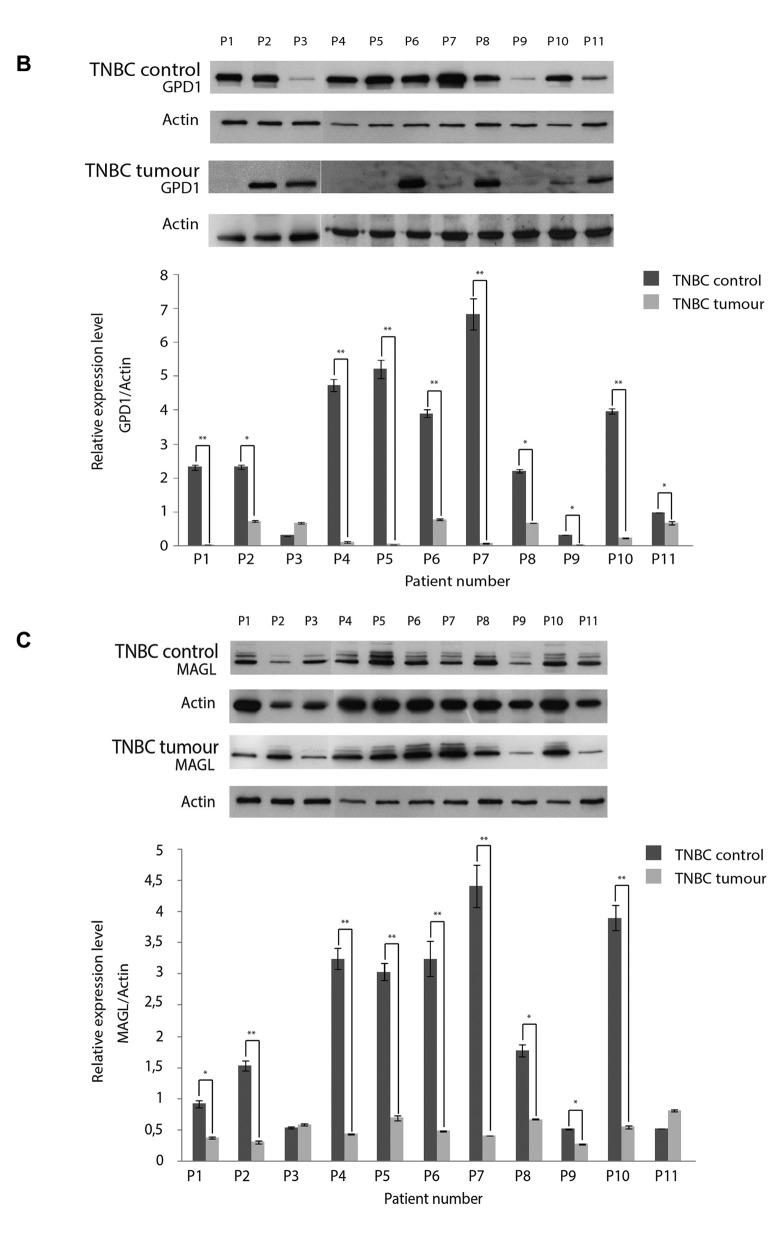
GPD1 protein levels varied among the TNBC samples. To further determine the variation in GPD1 expression levels among individual patients in the tumor groups, eight samples from each tumor subtype were selected and subjected to WB analyses (Figure 7A). Except five samples of the TNBC and three samples of the Her2+ group, GPD1 expression was detected in each sample at a similar level. However, GPD1 levels in each sample belonging to tumor groups were always lower than the GPD1 levels in the control group. For the samples belonging to the TNBC group, 5/8 samples displayed extremely low/non-detectable the GPD1 expression. Thus, WB experiments were repeated to screen all the available TNBC samples (n=11). The results indicated that nearly half of the TNBC samples had non-detectable GPD1 expression. Each control sample belonging to the TNBC group (peripheral healthy breast tissues collected from the same TNBC patients) was also subjected to WB analyses to assess the changes in GPD1 levels (Figure 7B). Two out of the 11 control samples also displayed extremely low GPD1 levels. Regarding Her2+ samples, there was also variation in GPD1 levels but it was not as significant (>2-fold change) as that observed in the TNBC samples (data not shown).
Figure 7. Glycerol-3-phosphate dehydrogenase 1 (GPD1) expression levels were determined by western blot (WB) in eight individual samples from each tumor group and the control group. The blot was stripped and re-probed with an anti-actin antibody for normalization of the expression levels. The band intensities were measured with the QuantityOne software. The letters “P” and “C” designate the patient number and the control pool formed by the combination of all individual controls, respectively. *p<0.05 and **p<0.01 compared to the control pool (A). WB analysis was also performed for all individual triple negative breast cancer (TNBC) samples and their respective controls to determine the changes in GPD1 (B) and monoacylglycerol lipase (MAGL) (C) levels. *p<0.05 and **p<0.01 for within subject TNBC control. Data presented as mean±SD (n=3).
Based on these findings, all TNBC samples (11 patients) were selected for further analysis by WB using anti-MAGL antibody, in order to determine the variation in expression levels of MAGL among individual patients in the tumor groups. Two samples (P2 and P9) displayed relatively low levels of MAGL expression, while repeated WB experiments using all the TNBC samples confirmed the findings and indicated that one fifth of the TNBC group displayed low level MAGL expression. Each control sample belonging to the TNBC group was also subjected to WB analyses to assess the changes in MAGL levels. One of the control samples (P9) displayed low level of MAGL expression. The corresponding tumor sample of P9 also displayed low level of MAGL expression (Figure 7C).
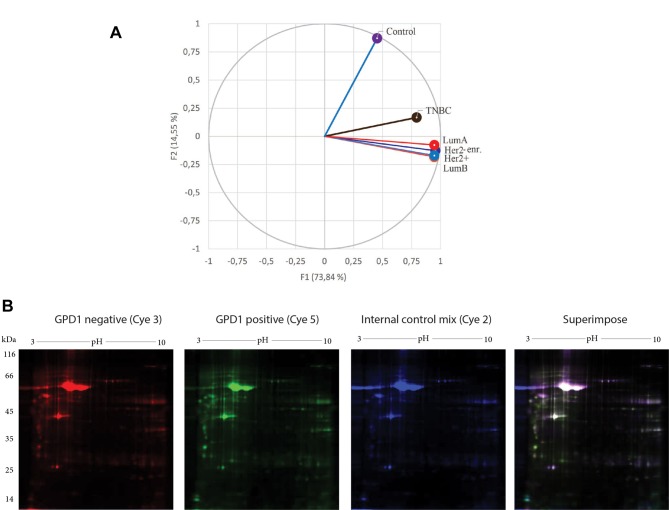
PCA of the tumor groups and the control group. By taking 2-DE spot intensities on every replicate tumor group and the control group, the variations were projected onto a 2-dimensional space. Therefore, we were able to determine which groups were similarly contributing to the variance and which groups appeared in a separate region (Figure 8A). PCA succeeded to differentiate the tumor groups from the control group. PCA also provided the evidence for the separation of TNBC from the other BC subtypes, which was indicative of variation in their respective protein expression profiles.
Figure 8. Principle component analysis (PCA) was performed using XLSTAT, an add-in software developed by Addinsoft. Average spot intensities were exported from the PDQuest Advance as tab delaminated Excel data (A). DIGE images of the pooled glycerol-3-phosphate dehydrogenase 1 (GPD1–) (Cye3) and pooled GPD1+ (Cye5) triple negative breast cancer (TNBC) samples. The internal control mix (Cye2), used for normalization, was formed by mixing equal amount of protein from the pooled GPD1+ and the pooled GPD1– TNBC samples. The superimposed image was the product of superimposing all three Cye dye images; images were pseudo coloured (B). Lum, Luminal.
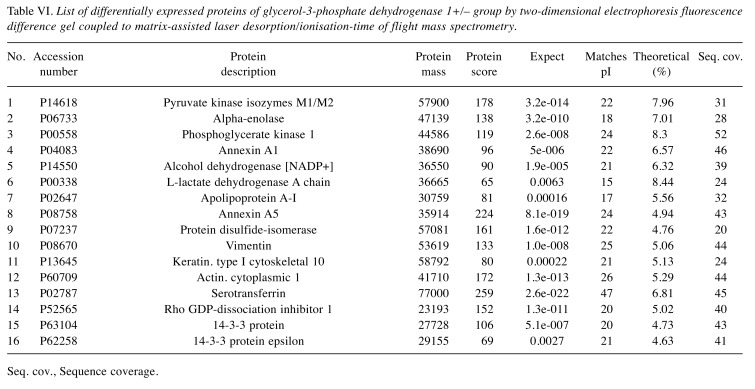
Comparative DIGE analysis for the GPD1-positive and-negative TNBC samples. Analysis of the WB results revealed two subgroups with different GPD1 expression levels in the TNBC group. The first group consisted of the samples with low/non-detectable GPD1 expression (GPD1–) and the second of those with moderate GPD1 expression (GPD1+). This finding led us perform DIGE analysis to compare GPD1+ and GPD1– samples at the proteome level (Figure 8B). Sixteen proteins displayed regulation in their expression levels (Table VI).
Table VI. List of differentially expressed proteins of glycerol-3-phosphate dehydrogenase 1+/– group by two-dimensional electrophoresis fluorescence difference gel coupled to matrix-assisted laser desorption/ionisation-time of flight mass spectrometry.
Seq. cov., Sequence coverage.
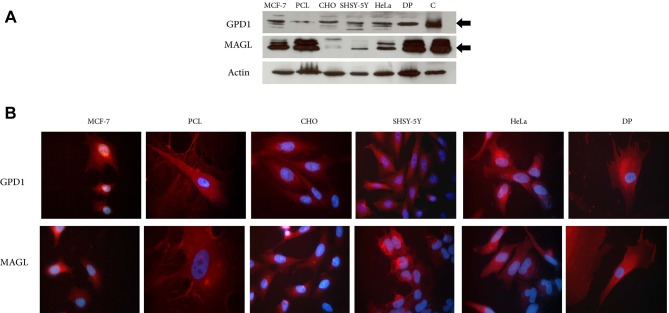
GPD1 and MAGL expression in different cell lines. The expression levels of GPD1 and MAGL were further examined in vitro, in CHO, SH-SY5Y, HeLa, DP, MCF-7 and PCL cell lines. All cell lines expressed both proteins when cultured. Among the cell lines, the lowest expression level of GPD1 was observed in the primary PCL cells which were obtained from a TNBC patient. The low GPD1 expression level in this sample was in agreement with our previous findings and demonstrated that TNBC samples either lacked or had low level of GPD1 expression (Figure 7A). As to MAGL, its expression levels fluctuated among the cell lines (Figure 9A). The expressions of the two proteins in the cell lines were also confirmed by IF imaging. Results showed a uniform cytoplasmic distribution of both proteins within the cells (Figure 9B).
Figure 9. Protein extracts from MCF-7, primary breast cancer cell line (PCL), CHO, SHSY-5Y, HeLa and dental pulp-derived mesenchymal stem cells (DP) were analyzed by western blot for glycerol-3-phosphate dehydrogenase 1 (GPD1) and monoacylglycerol lipase (MAGL) expressions; protein pools prepared from the control breast tissues were used as positive control (C) (A). Immunofluorescence of the cells to demonstrate expression of GPD1 and MAGL. Red color depicted the distributions of GPD1 and MAGL. Cell nuclei were stained with DAPI (B).
Discussion
STRING analysis using differentially regulated proteins listed in Table IV created an interactome which led to the pathways associated with protein folding and unfolded protein response (UPR). STRING analysis of the differentially regulated proteins determined by DIGE also confirmed the findings of 2-DE, pointing to the pathways associated with protein folding and UPR. Similar to our findings, Pozniak et al. (2016) reported changes in protein levels associated with UPR. In their study, formalin-fixed paraffin-embedded BC tissue samples were analyzed and down-regulation of UPR-related proteins was found in tumors compared to normal tissue (15). UPR activation indicates the presence of cellular stress related to endoplasmic reticulum due to accumulation of unfolded or misfolded proteins (16). Sustained over-activation of the UPR has also been implicated in several different human solid tumors (17-21). In general, UPR is expected in solid tumors because human solid tumors contain areas of pure vascular perfusion which causes inadequate blood circulation in the tumor microenvironment and severe oxygen and glucose deprivations. UPR is expected to protect the tumor cells in response to adverse conditions (22). It has been demonstrated that in antiestrogen-treated cancer cells, and in cells that have increased protein production and secretion, UPR activation is mild and protective (23). UPR activation has also been linked with inhibition of chemosensitivity to drugs (24). Therefore, markers of UPR activation may provide clinical relevance for BC therapeutic approaches.
Some of the differentially regulated proteins of this study can be linked to carbon metabolism. Those proteins include aconitate hydratase (Q99798), malate dehydrogenase (P40925), pyruvate kinase (P14618) and lactate dehydrogenase (P07195). It has been long known that cancer cells can reprogram their central carbon metabolism and maintain elevated level of glycolysis to sustain their energy needs and convert glucose to lactate (25-28). During this conversion, pyruvate kinase (PK) catalyses the last step of glycolysis converting phosphoenolpyruvate to pyruvate. Pyruvate is then converted to lactate by lactate dehydrogenase (LDH) to provide sufficient reducing power for energy production (29). In our study, we observed up-regulation in PK in all BC subtypes in comparison to the control. The up-regulation of PK in cancer cells can be linked to the higher cell proliferation ability and increased anabolic functions (30,31). In literature, there is evidence indicating that the expression of LDH isoforms differs in healthy and cancerous tissues and LDH-A is the isoenzyme which plays the key role in regulating glycolysis in tumor cells. In fact, carcinomatous tissues possess high LDH-A isoform (32-34). However, the LDH isoform identified in this study was, LDH-B (48% sequence coverage). So far, there was no report emphasizing the changes occurring at LDH-B levels. To the best of our knowledge, this is the first study reporting regulation in LDH-B levels in all subtypes of BC.
The role of lipid metabolism has been conferred to explain the aggressive properties of malignant cancers (35). In the literature, dysregulated core enzymes in lipid metabolism and their contribution to the cancer cell migration, invasion and metastasis have been well established (35-37). The genes involved in cellular fatty acid uptake and de novo lipogenesis are amplified in metastatic tumors and fatty acid synthesis plays an important role in cancer pathogenesis (38,39). The liberated stored fatty acids and the newly-synthesized fatty acids are rapidly incorporated into neutral-lipid and phospholipid stores. Herein, two differentially regulated proteins, namely MAGL and GPD1 helped us establish an association between triglyceride metabolism (TGM) and BC.
GPD1 is a member of the NAD+-dependent glycerol-3-phosphate dehydrogenase family and plays a critical role in carbohydrate and lipid metabolism by catalysing the reversible conversion of dihydroxyacetone phosphate (DHAP) and reduced nicotinamide adenine dinucleotide (NADH) to glycerol-3-phosphate (G3P) and NAD+ (40,41). Based on the Human Protein Atlas, GPD1 expression can be detected in most malignant tumors including renal and hepatocellular carcinomas, malignant gliomas and prostate cancers (http://v15.proteinatlas.org/ENSG00000167588-GPD1/cancer). The relative expression levels of GPD1 among 20 different cancer types indicate that GPD1 is moderately expressed in BC tissues compared to other cancer types. In the present study, we found that GPD1 was highly down-regulated in all BC subtype groups in comparison to the control. In addition, the lowest GPD1 expression was detected in the TNBC samples. In fact, in some TNBC samples, GPD1 expression could not be detected at all. This was in line with a recent study by Zhou et al. demonstrating that the mRNA expression level of GPD1 was found to be significantly down-regulated in BC patients (42). The same study revealed several important findings including higher GPD1 expression levels in receptor (ER and PR) positive and Her2 negative subtypes, shorter survival time in patients with low GPD1 expression, prognostic GPD1 value for ER-positive tumors, significant down-regulation at GPD1 mRNA levels in BC cell lines and significant down-regulation in GPD1 protein levels in BC cell lines and tissues. In the present study, we have observed similar GPD1 protein expression levels in all BC subtypes, except the TNBC. Luminal A displayed the highest GPD1 expression at the protein level. The lowest level of GPD1 protein expression was observed in TNBC samples, implicating that not only Her2 reactivity but also ER/PR positivity is associated with GPD1 expression levels. Analysis of GPD1 expression levels in each sample revealed some variation among the individual samples, mainly in TNBC and Her2+ groups. This variability is an expected result considering the heterogeneous nature of BC subtypes. BC is a heterogeneous disease that differs greatly among different patients (inter-tumor heterogeneity) and even within the same tumor sample (intra-tumor heterogeneity) (43). Some of the samples in the TNBC group had either no or barely detectable GPD1 expression; thus, TNBC samples were suggested to be divided into two different groups, GPD1+ and GPD1–.
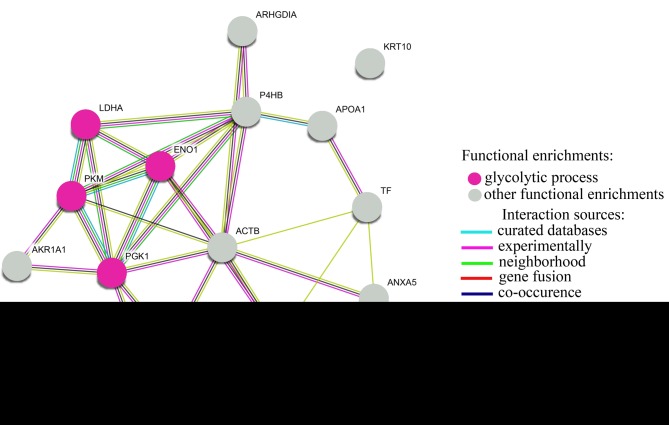
TNBC represents 12-15% of all BCs (44). Its molecular heterogeneity is reflected onto a significantly different clinical outcome among other subtypes. Very often, this cancer is much more aggressive causing distant metastasis (45). Therefore, it is necessary to establish a detailed classification for the TNBC sub-group. Statistically, high percentages of TNBCs belong to the basal-like BC group which has high mitotic index and high histological grade (46,47). Basal-like BCs are identified by a variety of immunohistochemical markers, such as cytokeratins (CK5, CK6, CK14 or CK17), EGFR, SMA, p-cadherin, p63 or c-kit antigen (48). Herein, we were curious about whether GPD1 negative samples represented the basal-like BCs. We thus determined CK5 and CK6 expressions in eight of those samples and evaluated the coherence between CK5/6 and GPD1 expressions. Except one sample, there was an inverse correlation between CK5/6 status and GPD1 expression levels. Samples which lacked GPD1 expression had positive immunohistochemical staining for CK5/6, while the samples which expressed GPD1 were negative for CK5/6. This finding indicated that GPD1 may be a good candidate biomarker to differentiate basal-like BCs from other TNBC subtypes (47). The results of comparative DIGE experiments with GPD1+ and GPD1– samples revealed the presence of 16 differentially regulated proteins. STRING analysis with the differentially regulated proteins listed in Table VI indicated a significant change in glycolytic process (FDR of 8.56e-05) (Figure 10). The glycolytic proteins that displayed down-regulation in GPD1+ samples in comparison to GPD1- samples were lactate dehydrogenase, pyruvate kinase, phosphoglycerate kinase 1 and alpha-enolase. It is likely that the heterogenic complex nature of TNBC may require flexible cell metabolism in which non-enzymatic functions of most glycolytic enzymes may offer important contributions (49). Future studies should consider whether the changes in the levels of these glycolytic enzymes may help TNBC cells to sustain their growth.
Figure 10. STRING analysis of the differentially regulated proteins identified in two-dimensional electrophoresis fluorescence difference performed to compare GPD1+ and GPD1– groups.
MAGL is the enzyme responsible for the breakdown of monoacylglycerols (MAG) to free fatty acids (FFA) (50). It is best recognized for its role in degrading endogenous 2-arachidonoylglycerol (2-AG) in the brain and the peripheral tissues (51). MAGL is considered to be one of the key enzymes which regulate the network of FFAs in numerous aggressive tumors such as colorectal cancer, neuroblastoma, and nasopharyngeal carcinoma (52-54). Increased aggressiveness requires increased lipid synthesis by lipolytic pathway to liberate stored fatty acids by MAGL. This was demonstrated in a seminal paper by Nomura et al. (55) who showed that MAGL was highly expressed in aggressive human cancer cells and primary tumors, where it regulated a fatty acid network enriched in oncogenic signalling lipids. Aggressive cell lines displayed much greater in vitro migration and in vivo tumor growth rates in comparison to their non-aggressive counterparts. Moreover, inhibition of MAGL demonstrated that aggressive cancer cells display highly elevated MAG activity, most of which comes from the MAGL enzyme. Blocking MAGL by either siRNA or an inhibitor reduced in vitro migration, invasion, and cell survival under serum deprivation; while, over-expression of MAGL in non-aggressive cancer cells increased their pathogenicity. The work by Nomura et al. opened a way to investigate whether MAGL could be a potential therapeutic target and prognostic indicator for various cancer types (50). In our study, we have identified MAGL as one of the regulated proteins in BC subtypes. Interestingly, our 2-DE experiments demonstrated that MAGL was down-regulated in all BC subtypes in comparison to the control. More specifically, the TNBC subtype showed the lowest MAGL expression compared to the other BC subtypes. Some individual patient samples had much less MAGL levels in comparison to the other patient samples indicating variability in MAGL levels amongst the patients. Similarly, there was also variation in MAGL levels among the controls.
Contrary to the results by Nomura et al., the current study demonstrated a decrease in the MAGL expression level in the tumor tissues compared to their counterparts. This conundrum cannot be explained with the current knowledge about the known function of MAGL. The complex interplay between oncogenic signalling and lipid metabolism and the large spectrum of lipid functions at both the cellular and organismal level requires more detailed understanding of the alterations in lipid metabolism in cancer. A possible reason to explain the discordance between our data and that by Nomura et al., is that they performed activity-based proteomic analysis and did not monitor the changes in MAGL protein levels. On the other hand, we performed non-functional proteomic analysis and only determined the changes in MAGL protein levels. MAGL overexpression causes significant reduction in MAGs and elevation in FFAs (50). Based on this knowledge, we propose that the in vivo aggressiveness of cancer cells depends on the level of MAGs rather than the level of FFAs. However, currently there is no supporting data for our proposal in the literature. Despite the recent research indicating the relationship between MAGL and the tumor progression, the mechanism of pro-tumor activity of MAGL is still unknown. The data presented here raises a point for MAGL to be a candidate therapeutic target and prognostic indicator for BC. Histological examination of tissue samples may be useful for clinical application of MAGL for BC diagnosis and subtyping. It may be worth investigating the changes in serum levels of MAGL to develop a more reliable and convenient clinical test for BC diagnosis and prognosis.
Cancerous state is acquired through reprogramming the metabolic pathways to deviate cells from the normal state (56). There is a growing appreciation that the regulation of metabolism defines the features of cancer (57). In this context, the work by Tyanova et al. shed some light onto the changes in metabolic events occurring in BC tissues (58). They analyzed changes in a vast number of proteins using LC-MS/MS technology and described significant changes occurring in energy metabolism (glycolysis and gluconeogenesis), amino acid metabolism, replication/repair, cell growth/death and translation. In another recent study, Yanovich et al. aimed at detailed analysis of BC subtypes and reported changes in the levels of vast number of proteins (59). Their study also involved comparison of their findings with the past studies and concluded that certain metabolic pathways display changes in certain BC subtypes such as changes in galactose metabolism, oxidative phosphorylation and immune activity in Her2+, ER+ and TNBC BC subtypes, respectively.
Conclusion
The currently used diagnostic biomarkers for BC are either not specific or do not allow early detection of the disease. The classical radiological scans and the other clinical approaches do not appear to be powerful and convenient enough to allow early detection. During the last decade, novel biomarker candidates have emerged, however they also lack sensitivity and specificity (60-62). On the other hand, panels of gene/protein biomarkers have been proposed, but their use is limited due to their high cost and availability issues. The difficulty in finding a biomarker for early detection lies in the complexity of pathways that transform cells into cancerous state. Understanding the complex interplay among these pathways will ultimately lead to discovery of a simple and effective biomarker/biomarker panel. However, this requires a detailed analysis of the genome, transcriptome, metabolome and proteome. Herein, the changes occurring in the proteome profile of BC subtypes with respect to their healthy counterparts were analyzed. The findings placed an emphasis on the relationship among triacylglycerol metabolism and BC-subtypes and suggested that the alterations occur in two key proteins, GPD1 and MAGL. These proteins may have high potentials to become diagnostic /prognostic /predictive biomarkers.
Authors’ Contributions
KKY contributed to experiment conduction and prepared the data for publication. MK and GA contributed to experiment conduction and manuscript preparation. AG performed the surgeries, collected and classified the tissue samples. BG performed the pathological examinations of tissue samples and helped their classification. NZU performed the surgeries and contributed to tissue sample collection and clinical evaluation of the data.
Ethics Approval and Consent to Participate
This study was approved by the Ethics Committee of Kocaeli University (approval numbers: KOU KAEK 2015/274 and KU GOKAEK 2018/49). Informed consents, approved by the institutional ethics committee, were obtained from each patient.
Conflicts of Interests
The authors declare that they have no competing interests.
Acknowledgements
This study was carried out in DEKART Proteomics laboratory at Kocaeli University Medical School (http://laboratuar.kocaeli.edu.tr/ dekart/) and supported by Kocaeli University, Scientific Research Unit under the grant number of 2018/123. The funding body had no role in the design or execution of the study.
References
- 1.Society AC Breast cancer facts & figures 2017-2018. American Cancer Society, Inc.: Atlanta. 2017. Available at: https://www.cancer.org/content/dam/cancer-org/research/cancer-factsand-statistics/breast-cancer-facts-and-figures/breast-cancer-factsand-figures-2017-2018.pdf. Accessed on January 2019.
- 2.Woodward WA, Strom EA, Tucker SL, McNeese MD, Perkins GH, Schechter NR, Singletary SE, Theriault RL, Hortobagyi GN, Hunt KK, Buchholz TA. Changes in the 2003 american joint committee on cancer staging for breast cancer dramatically affect stage-specific survival. J Clin Oncol. 2003;21(17):3244–3248. doi: 10.1200/JCO.2003.03.052. PMID: 12947058. DOI: 10.1200/JCO.2003.03.052. [DOI] [PubMed] [Google Scholar]
- 3.Provencher L, Hogue JC, Desbiens C, Poirier B, Poirier E, Boudreau D, Joyal M, Diorio C, Duchesne N, Chiquette J. Is clinical breast examination important for breast cancer detection. Curr Oncol. 2016;23(4):e332–339. doi: 10.3747/co.23.2881. PMID: 27536182. DOI: 10.3747/co.23.2881. [DOI] [PMC free article] [PubMed] [Google Scholar]
- 4.Duffy MJ, Harbeck N, Nap M, Molina R, Nicolini A, Senkus E, Cardoso F. Clinical use of biomarkers in breast cancer: Updated guidelines from the european group on tumor markers (egtm) Eur J Cancer. 2017;75:284–298. doi: 10.1016/j.ejca.2017.01.017. PMID: 28259011. DOI: 10.1016/j.ejca.2017.01.017. [DOI] [PubMed] [Google Scholar]
- 5.Cole KD, He HJ, Wang L. Breast cancer biomarker measurements and standards. Proteomics Clin Appl. 2013;7(1-2):17–29. doi: 10.1002/prca.201200075. PMID: 23341234. DOI: 10.1002/prca.201200075. [DOI] [PubMed] [Google Scholar]
- 6.Kabel AM. Tumor markers of breast cancer: New prospectives. J Oncol Sci. 2017;3(1):6. DOI: 10.1016/j.jons.2017.01.001. [Google Scholar]
- 7.Frenette PS, Thirlwell MP, Trudeau M, Thomson DM, Joseph L, Shuster JS. The diagnostic value of CA 27-29, CA 15-3, mucin-like carcinoma antigen, carcinoembryonic antigen and CA 19-9 in breast and gastrointestinal malignancies. Tumor Biol. 1994;15(5):247–254. doi: 10.1159/000217898. [DOI] [PubMed] [Google Scholar]
- 8.Nicolini A, Ferrari P, Duffy MJ. Prognostic and predictive biomarkers in breast cancer: Past, present and future. Semin Cancer Biol. 2018;52(Pt 1):56–73. doi: 10.1016/j.semcancer.2017.08.010. PMID: 28882552. DOI: 10.1016/j.semcancer.2017.08.010. [DOI] [PubMed] [Google Scholar]
- 9.Williams SL, Birdsong GG, Cohen C, Siddiqui MT. Immunohistochemical detection of estrogen and progesterone receptor and her2 expression in breast carcinomas: Comparison of cell block and tissue block preparations. Int J Clin Exp Pathol. 2009;2(5):476–480. PMID: 19294006. [PMC free article] [PubMed] [Google Scholar]
- 10.Cho N. Molecular subtypes and imaging phenotypes of breast cancer. Ultrasonography. 2016;35(4):281–288. doi: 10.14366/usg.16030. PMID: 27599892. DOI: 10.14366/usg.16030. [DOI] [PMC free article] [PubMed] [Google Scholar]
- 11.Goldhirsch A, Winer EP, Coates AS, Gelber RD, Piccart-Gebhart M, Thurlimann B, Senn HJ. Personalizing the treatment of women with early breast cancer: Highlights of the st gallen international expert consensus on the primary therapy of early breast cancer 2013. Ann Oncol. 2013;24(9):2206–2223. doi: 10.1093/annonc/mdt303. PMID: 23917950. DOI: 10.1093/annonc/mdt303. [DOI] [PMC free article] [PubMed] [Google Scholar]
- 12.Akpinar G, Kasap M, Canturk NZ, Zulfigarova M, Islek EE, Guler SA, Simsek T, Canturk Z. Proteomics analysis of tissue samples reveals changes in mitochondrial protein levels in parathyroid hyperplasia over adenoma. Cancer Genomics Proteomics. 2017;14(3):197–211. doi: 10.21873/cgp.20031. PMID: 28446534. DOI: 10.21873/cgp.20031. [DOI] [PMC free article] [PubMed] [Google Scholar]
- 13.Ferguson RE, Carroll HP, Harris A, Maher ER, Selby PJ, Banks RE. Housekeeping proteins: A preliminary study illustrating some limitations as useful references in protein expression studies. Proteomics. 2005;5(2):566–571. doi: 10.1002/pmic.200400941. PMID: 15627964. DOI: 10.1002/pmic.200400941. [DOI] [PubMed] [Google Scholar]
- 14.Saponaro C, Gaggini M, Carli F, Gastaldelli A. The subtle balance between lipolysis and lipogenesis: A critical point in metabolic homeostasis. Nutrients. 2015;7(11):9453–9474. doi: 10.3390/nu7115475. PMID: 26580649. DOI: 10.3390/nu7115475. [DOI] [PMC free article] [PubMed] [Google Scholar]
- 15.Pozniak Y, Balint-Lahat N, Rudolph JD, Lindskog C, Katzir R, Avivi C, Ponten F, Ruppin E, Barshack I, Geiger T. System-wide clinical proteomics of breast cancer reveals global remodeling of tissue homeostasis. Cell Syst. 2016;2(3):172–184. doi: 10.1016/j.cels.2016.02.001. PMID: 27135363. DOI: 10.1016/j.cels.2016.02.001. [DOI] [PubMed] [Google Scholar]
- 16.Mahdi AA, Rizvi SH, Parveen A. Role of endoplasmic reticulum stress and unfolded protein responses in health and diseases. Indian J Clin Biochem. 2016;31(2):127–137. doi: 10.1007/s12291-015-0502-4. PMID: 27069320. DOI: 10.1007/s12291-015-0502-4. [DOI] [PMC free article] [PubMed] [Google Scholar]
- 17.Fernandez PM, Tabbara SO, Jacobs LK, Manning FC, Tsangaris TN, Schwartz AM, Kennedy KA, Patierno SR. Overexpression of the glucose-regulated stress gene grp78 in malignant but not benign human breast lesions. Breast Cancer Res Treat. 2000;59(1):15–26. doi: 10.1023/a:1006332011207. PMID: 10752676. [DOI] [PubMed] [Google Scholar]
- 18.Zhang J, Jiang Y, Jia Z, Li Q, Gong W, Wang L, Wei D, Yao J, Fang S, Xie K. Association of elevated grp78 expression with increased lymph node metastasis and poor prognosis in patients with gastric cancer. Clin Exp Metastasis. 2006;23(7-8):401–410. doi: 10.1007/s10585-006-9051-9. PMID: 17187227. DOI: 10.1007/s10585-006-9051-9. [DOI] [PubMed] [Google Scholar]
- 19.Shuda M, Kondoh N, Imazeki N, Tanaka K, Okada T, Mori K, Hada A, Arai M, Wakatsuki T, Matsubara O, Yamamoto N, Yamamoto M. Activation of the atf6, xbp1 and grp78 genes in human hepatocellular carcinoma: A possible involvement of the er stress pathway in hepatocarcinogenesis. J Hepatol. 2003;38(5):605–614. doi: 10.1016/s0168-8278(03)00029-1. PMID: 12713871. DOI: 10.1016/S0168-8278(03)0 0029-1. [DOI] [PubMed] [Google Scholar]
- 20.Scriven P, Brown NJ, Pockley AG, Wyld L. The unfolded protein response and cancer: A brighter future unfolding. J Mol Med (Berl) 2007;85(4):331–341. doi: 10.1007/s00109-006-0150-5. PMID: 17216204. DOI: 10.1007/s00109-006-0150-5. [DOI] [PubMed] [Google Scholar]
- 21.Uramoto H, Sugio K, Oyama T, Nakata S, Ono K, Yoshimastu T, Morita M, Yasumoto K. Expression of endoplasmic reticulum molecular chaperone grp78 in human lung cancer and its clinical significance. Lung Cancer. 2005;49(1):55–62. doi: 10.1016/j.lungcan.2004.12.011. PMID: 15949590. DOI: 10.1016/j.lungcan.2004.12.011. [DOI] [PubMed] [Google Scholar]
- 22.Koumenis C, Wouters BG. "Translating" Tumor hypoxia: Unfolded protein response (UPR)-dependent and upr-independent pathways. Mol Cancer Res. 2006;4(7):423–436. doi: 10.1158/1541-7786.MCR-06-0150. PMID: 16849518. DOI: 10.1158/1541-7786.MCR-06-0150. [DOI] [PubMed] [Google Scholar]
- 23.Shapiro DJ, Livezey M, Yu L, Zheng X, Andruska N. Anticipatory upr activation: A protective pathway and target in cancer. Trends Endocrinol Metab. 2017;27(10):731–741. doi: 10.1016/j.tem.2016.06.002. PMID: 27354311. DOI: 10.1016/j.tem.2016.06.002. [DOI] [PMC free article] [PubMed] [Google Scholar]
- 24.Scriven P, Coulson S, Haines R, Balasubramanian S, Cross S, Wyld L. Activation and clinical significance of the unfolded protein response in breast cancer. Br J Cancer. 2009;101(10):1692–1698. doi: 10.1038/sj.bjc.6605365. PMID: 19861963. DOI: 10.1038/sj.bjc.6605365. [DOI] [PMC free article] [PubMed] [Google Scholar]
- 25.Liberti MV, Locasale JW. Metabolism: A new layer of glycolysis. Nat Chem Biol. 2016;12(8):577–578. doi: 10.1038/nchembio.2133. PMID: 27354311. DOI: 10.1016/j.tem.2016.06.002. [DOI] [PubMed] [Google Scholar]
- 26.Liberti MV, Locasale JW. The warburg effect: How does it benefit cancer cells. Trends Biochem Sci. 2016;41(3):211–218. doi: 10.1016/j.tibs.2015.12.001. PMID: 26778478. DOI: 10.1016/j.tibs.2015.12.001. [DOI] [PMC free article] [PubMed] [Google Scholar]
- 27.Zhou W, Liotta LA, Petricoin EF. Cancer metabolism: What we can learn from proteomic analysis by mass spectrometry. Cancer Genomics Proteomics. 2012;9(6):373–381. PMID: 23162076. [PMC free article] [PubMed] [Google Scholar]
- 28.Warburg O. Iron, the oxygen-carrier of respiration-ferment. Science. 1925;61(1588):575–582. doi: 10.1126/science.61.1588.575. PMID: 23162076. [DOI] [PubMed] [Google Scholar]
- 29.Gupta V, Bamezai RN. Human pyruvate kinase m2: A multifunctional protein. Protein Sci. 2010;19(11):2031–2044. doi: 10.1002/pro.505. PMID: 20857498. DOI: 10.1002/pro.505. [DOI] [PMC free article] [PubMed] [Google Scholar]
- 30.Christofk HR, Vander Heiden MG, Harris MH, Ramanathan A, Gerszten RE, Wei R, Fleming MD, Schreiber SL, Cantley LC. The m2 splice isoform of pyruvate kinase is important for cancer metabolism and tumor growth. Nature. 2008;452(7184):230–233. doi: 10.1038/nature06734. PMID: 18337823. DOI: 10.1038/nature06734. [DOI] [PubMed] [Google Scholar]
- 31.Yao F, Zhao T, Zhong C, Zhu J, Zhao H. Ldha is necessary for the tumorigenicity of esophageal squamous cell carcinoma. Tumour Biol. 2013;34(1):25–31. doi: 10.1007/s13277-012-0506-0. PMID: 18337823. DOI: 10.1038/nature06734. [DOI] [PubMed] [Google Scholar]
- 32.Pan LX, Xu JN, Isaacson PG. Cellular h- and m-type lactate dehydrogenase (ldh) isoenzymes and tumour diagnosis--an immunohistochemical assessment. J Pathol. 1991;163(1):53–60. doi: 10.1002/path.1711630110. PMID: 1705976. DOI: 10.1002/path.1711630110. [DOI] [PubMed] [Google Scholar]
- 33.Wong TL, Che N, Ma S. Reprogramming of central carbon metabolism in cancer stem cells. Biochim Biophys Acta. 2017;1863(7):1728–1738. doi: 10.1016/j.bbadis.2017.05.012. PMID: 28502706. DOI: 10.1016/j.bbadis. 2017.05.012. [DOI] [PubMed] [Google Scholar]
- 34.Miao P, Sheng S, Sun X, Liu J, Huang G. Lactate dehydrogenase a in cancer: A promising target for diagnosis and therapy. IUBMB Life. 2013;65(11):904–910. doi: 10.1002/iub.1216. PMID: 24265197. DOI: 10.1002/iub.1216. [DOI] [PubMed] [Google Scholar]
- 35.Luo X, Cheng C, Tan Z, Li N, Tang M, Yang L, Cao Y. Emerging roles of lipid metabolism in cancer metastasis. Mol Cancer. 2017;16(1):76. doi: 10.1186/s12943-017-0646-3. PMID: 28399876. DOI: 10.1186/ s12943-017-0646-3. [DOI] [PMC free article] [PubMed] [Google Scholar]
- 36.Santos CR, Schulze A. Lipid metabolism in cancer. FEBS J. 2012;279(15):2610–2623. doi: 10.1111/j.1742-4658.2012.08644.x. PMID: 22621751. DOI: 10.1111/ j.1742-4658.2012.08644.x. [DOI] [PubMed] [Google Scholar]
- 37.Ray U, Roy SS. Aberrant lipid metabolism in cancer cells - the role of oncolipid-activated signaling. FEBS J. 2018;285(3):432–443. doi: 10.1111/febs.14281. PMID: 22621751. DOI: 10.1111/j.1742-4658. 2012.08644.x. [DOI] [PubMed] [Google Scholar]
- 38.Kim HY, Lee KM, Kim SH, Kwon YJ, Chun YJ, Choi HK. Comparative metabolic and lipidomic profiling of human breast cancer cells with different metastatic potentials. Oncotarget. 2016;7(41):67111–67128. doi: 10.18632/oncotarget.11560. PMID: 27564096. DOI: 10.18632/ oncotarget.11560. [DOI] [PMC free article] [PubMed] [Google Scholar]
- 39.Menendez JA, Lupu R. Fatty acid synthase and the lipogenic phenotype in cancer pathogenesis. Nat Rev Cancer. 2007;7(10):763–777. doi: 10.1038/nrc2222. PMID: 17882277. DOI: 10.1038/nrc2222. [DOI] [PubMed] [Google Scholar]
- 40.Hopkinson DA, Peters J, Harris H. Rare electrophoretic variants of glycerol-3-phosphate dehydrogenase: Evidence for two structural gene loci (gpd1 and gpd2) Ann Hum Genet. 1974;37(4):477–484. doi: 10.1111/j.1469-1809.1974.tb01852.x. PMID: 4415475. DOI: 10.1111/j.1469-1809. 1974.tb01852.x. [DOI] [PubMed] [Google Scholar]
- 41.Menaya J, Gonzalez-Manchon C, Parrilla R, Ayuso MS. Molecular cloning, sequencing and expression of a cdna encoding a human liver nad-dependent alpha-glycerol-3-phosphate dehydrogenase. Biochim Biophys Acta. 1995;1262(1):91–94. doi: 10.1016/0167-4781(95)00069-s. PMID: 7772607. DOI: 10.1016/0167-4781(95)00069-S. [DOI] [PubMed] [Google Scholar]
- 42.Zhou C, Yu J, Wang M, Yang J, Xiong H, Huang H, Wu D, Hu S, Wang Y, Chen XZ, Tang J. Identification of glycerol-3-phosphate dehydrogenase 1 as a tumour suppressor in human breast cancer. Oncotarget. 2017;8(60):101309–101324. doi: 10.18632/oncotarget.21087. PMID: 29254166. DOI: 10.18632/oncotarget.21087. [DOI] [PMC free article] [PubMed] [Google Scholar]
- 43.Turashvili G, Brogi E. Tumor heterogeneity in breast cancer. Front Med (Lausanne) 2017;4:227. doi: 10.3389/fmed.2017.00227. PMID: 29276709. DOI: 10.3389/fmed.2017.00227. [DOI] [PMC free article] [PubMed] [Google Scholar]
- 44.Boyle P. Triple-negative breast cancer: Epidemiological considerations and recommendations. Ann Oncol. 2012;23 (Suppl 6):vi7–12. doi: 10.1093/annonc/mds187. PMID: 23012306. DOI: 10.1093/annonc/mds187. [DOI] [PubMed] [Google Scholar]
- 45.Rouzier R, Perou CM, Symmans WF, Ibrahim N, Cristofanilli M, Anderson K, Hess KR, Stec J, Ayers M, Wagner P, Morandi P, Fan C, Rabiul I, Ross JS, Hortobagyi GN, Pusztai L. Breast cancer molecular subtypes respond differently to preoperative chemotherapy. Clin Cancer Res. 2005;11(16):5678–5685. doi: 10.1158/1078-0432.CCR-04-2421. PMID: 16115903. DOI: 10.1158/1078-0432.CCR-04-2421. [DOI] [PubMed] [Google Scholar]
- 46.Badowska-Kozakiewicz AM, Budzik MP. Immunohisto-chemical characteristics of basal-like breast cancer. Contemp Oncol (Pozn) 2017;20(6):436–443. doi: 10.5114/wo.2016.56938. PMID: 28239279. DOI: 10.5114/wo.2016.56938. [DOI] [PMC free article] [PubMed] [Google Scholar]
- 47.Alluri P, Newman LA. Basal-like and triple-negative breast cancers: Searching for positives among many negatives. Surg Oncol Clin N Am. 2014;23(3):567–577. doi: 10.1016/j.soc.2014.03.003. PMID: 24882351. DOI: 10.1016/j.soc.2014.03.003. [DOI] [PMC free article] [PubMed] [Google Scholar]
- 48.Rakha EA, El-Sayed ME, Reis-Filho J, Ellis IO. Patho-biological aspects of basal-like breast cancer. Breast Cancer Res Treat. 2009;113(3):411–422. doi: 10.1007/s10549-008-9952-1. PMID: 18327637. DOI: 10.1007/ s10549-008-9952-1. [DOI] [PubMed] [Google Scholar]
- 49.Lincet H, Icard P. How do glycolytic enzymes favour cancer cell proliferation by nonmetabolic functions. Oncogene. 2015;34(29):3751–3759. doi: 10.1038/onc.2014.320. PMID: 25263450. DOI: 10.1038/onc.2014.320. [DOI] [PubMed] [Google Scholar]
- 50.Zhang J, Liu Z, Lian Z, Liao R, Chen Y, Qin Y, Wang J, Jiang Q, Wang X, Gong J. Monoacylglycerol lipase: A novel potential therapeutic target and prognostic indicator for hepatocellular carcinoma. Sci Rep. 2016;6:35784. doi: 10.1038/srep35784. PMID: 27767105. DOI: 10.1038/srep35784. [DOI] [PMC free article] [PubMed] [Google Scholar]
- 51.Dinh TP, Freund TF, Piomelli D. A role for monoglyceride lipase in 2-arachidonoylglycerol inactivation. Chem Phys Lipids. 2002;121(1-2):149–158. doi: 10.1016/s0009-3084(02)00150-0. PMID: 12505697. DOI: 10.1016/ S0009-3084(02)00150-0. [DOI] [PubMed] [Google Scholar]
- 52.Ye L, Zhang B, Seviour EG, Tao KX, Liu XH, Ling Y, Chen JY, Wang GB. Monoacylglycerol lipase (magl) knockdown inhibits tumor cells growth in colorectal cancer. Cancer Lett. 2011;307(1):6–17. doi: 10.1016/j.canlet.2011.03.007. PMID: 21543155. DOI: 10.1016/j.canlet. 2011.03.007. [DOI] [PubMed] [Google Scholar]
- 53.Matuszak N, Hamtiaux L, Baldeyroux B, Muccioli GG, Poupaert JH, Lansiaux A, Lambert DM. Dual inhibition of magl and type ii topoisomerase by n-phenylmaleimides as a potential strategy to reduce neuroblastoma cell growth. Eur J Pharm Sci. 2012;45(3):263–271. doi: 10.1016/j.ejps.2011.11.011. PMID: 22127371. DOI: 10.1016/ j.ejps.2011.11.011. [DOI] [PubMed] [Google Scholar]
- 54.Hu WR, Lian YF, Peng LX, Lei JJ, Deng CC, Xu M, Feng QS, Chen LZ, Bei JX, Zeng YX. Monoacylglycerol lipase promotes metastases in nasopharyngeal carcinoma. Int J Clin Exp Pathol. 2012;7(7):3704–3713. PMID: 25120746. [PMC free article] [PubMed] [Google Scholar]
- 55.Nomura DK, Long JZ, Niessen S, Hoover HS, Ng SW, Cravatt BF. Monoacylglycerol lipase regulates a fatty acid network that promotes cancer pathogenesis. Cell. 2010;140(1):49–61. doi: 10.1016/j.cell.2009.11.027. PMID: 20079333. DOI: 10.1016/j.cell.2009.11.027. [DOI] [PMC free article] [PubMed] [Google Scholar]
- 56.Phan LM, Yeung SC, Lee MH. Cancer metabolic reprogramming: Importance, main features, and potentials for precise targeted anti-cancer therapies. Cancer Biol Med. 2014;11(1):1–19. doi: 10.7497/j.issn.2095-3941.2014.01.001. PMID: 24738035. DOI: 10.7497/j.issn.2095-3941.2014.01.001. [DOI] [PMC free article] [PubMed] [Google Scholar]
- 57.Pavlova NN, Thompson CB. The emerging hallmarks of cancer metabolism. Cell Metab. 2016;23(1):27–47. doi: 10.1016/j.cmet.2015.12.006. PMID: 26771115. DOI: 10.1016/j.cmet.2015.12.006. [DOI] [PMC free article] [PubMed] [Google Scholar]
- 58.Tyanova S, Albrechtsen R, Kronqvist P, Cox J, Mann M, Geiger T. Proteomic maps of breast cancer subtypes. Nat Commun. 2016;7:10259. doi: 10.1038/ncomms10259. PMID: 26725330. DOI: 10.1038/ ncomms10259. [DOI] [PMC free article] [PubMed] [Google Scholar]
- 59.Yanovich G, Agmon H, Harel M, Sonnenblick A, Peretz T, Geiger T. Clinical proteomics of breast cancer reveals a novel layer of breast cancer classification. Cancer Res. 2018;78(20):6001–6010. doi: 10.1158/0008-5472.CAN-18-1079. PMID: 30154156. DOI: 10.1158/0008-5472.CAN-18-1079. [DOI] [PMC free article] [PubMed] [Google Scholar]
- 60.Jia Y, Chen Y, Wang Q, Jayasinghe U, Luo X, Wei Q, Wang J, Xiong H, Chen C, Xu B, Hu W, Wang L, Zhao W, Zhou J. Exosome: Emerging biomarker in breast cancer. Oncotarget. 2017;8(25):41717–41733. doi: 10.18632/oncotarget.16684. PMID: 28402944. DOI: 10.18632/ oncotarget.16684. [DOI] [PMC free article] [PubMed] [Google Scholar]
- 61.Sana M, Malik HJ. Current and emerging breast cancer biomarkers. J Cancer Res Ther. 2015;11(3):508–513. doi: 10.4103/0973-1482.163698. PMID: 26458575. DOI: 10.4103/0973-1482.163698. [DOI] [PubMed] [Google Scholar]
- 62.Weigel MT, Dowsett M. Current and emerging biomarkers in breast cancer: Prognosis and prediction. Endocr Relat Cancer. 2010;17(4):R245–262. doi: 10.1677/ERC-10-0136. PMID: 20647302. DOI: 10.1677/ERC-10-0136. [DOI] [PubMed] [Google Scholar]


