

Abstract
Mortality from perinatal hypoxic–ischemic (HI) brain injury reached 1.15 million worldwide in 2010 and is also a major factor for neurological disability in infants. HI directly influences the oxidative phosphorylation enzyme complexes in mitochondria, but the exact mechanism of HI-reoxygenation response in brain remains largely unresolved. After induction of HI-reoxygenation in postnatal day 10 rats, activities of mitochondrial respiratory chain enzymes were analysed and complexome profiling was performed. The effect of conformational state (active/deactive (A/D) transition) of mitochondrial complex I on H2O2 release was measured simultaneously with mitochondrial oxygen consumption. In contrast to cytochrome c oxidase and succinate dehydrogenase, HI-reoxygenation resulted in inhibition of mitochondrial complex I at 4 h after reoxygenation. Immediately after HI, we observed a robust increase in the content of deactive (D) form of complex I. The D-form is less active in reactive oxygen species (ROS) production via reversed electron transfer, indicating the key role of the deactivation of complex I in ischemia/reoxygenation. We describe a novel mechanism of mitochondrial response to ischemia in the immature brain. HI induced a deactivation of complex I in order to reduce ROS production following reoxygenation. Delayed activation of complex I represents a novel mitochondrial target for pathological-activated therapy.
Keywords: Ischemia, immature brain, mitochondrial complex I, A/D transition, reactive oxygen species
Introduction
Perinatal hypoxic–ischemic (HI) brain injury causes neurological disability and morbidity in infants. The incidence of systemic asphyxia is 3–10 per 1000 births and occurs in approximately 60% of low-birth-weight premature newborns.1–3 The worldwide mortality from perinatal HI injury reached 1.15 million in 2010.4 One of the animal models mimicking HI encephalopathy in at-term human infants is the experimental HI model in brains from postnatal days 10 (P10) rats developed by Rice et al.5 This HI brain injury model synergistically combines the ischemic effects induced by unilateral common carotid artery (CCA) occlusion with additional effects of hypoxia applied systemically. HI triggers a complex molecular pathophysiological response in the neonatal brain that also affects energy metabolism, in particular, mitochondrial oxidative phosphorylation (OXPHOS).6–11
When applied after HI, tissue reoxygenation partially restores mitochondrial respiration, activates oxidative phosphorylation, and increases the level of high-energy phosphates, such as ATP and phosphocreatine.12 However, several hours after reoxygenation, mitochondria exhibit a profound decline in their ability to generate ATP, referred to as secondary energy failure.10,12,13 Although reoxygenation is essential for neuronal survival, it also initiates mechanisms leading to post-ischemic brain injury. Studies applying HI or ischemia-reperfusion to adult rodent brains addressed various mitochondrial functions. They revealed that HI directly influences the respiratory chain or OXPHOS enzyme complexes, such as complex I,14–18 complex IV,19 and complex II.20 For instance, a decreased ADP-stimulated respiration on complex I substrates (malate/glutamate) was observed following HI.7 However, further mechanistic insights into the exact target of HI remained largely unresolved.
Mitochondrial complex I is a key component of the respiratory chain. It oxidizes NADH produced in catabolism through glycolysis, the Krebs cycle and β-oxidation of fatty acids, and reduces ubiquinone, while forming a proton gradient across the inner mitochondrial membrane. This energy-generating redox process catalyzed by complex I can be reversed. The opposite catalytic reaction consisting of NAD+ reduction by ubiquinol at the expense of the mitochondrial proton gradient represents the reverse electron transfer (RET).21–23
Several studies on the isolated, reconstituted, or mitochondria-localized mammalian OXPHOS complex I demonstrate that the enzyme complex can adopt two catalytically and structurally different states: the active (A) and the de-active (D) conformations.24–29 Unlike the A-form, the D-form catalyzes the physiological reaction of NADH oxidation by ubiquinone with a considerable lag-phase. If idle at physiological temperatures, i.e. during hypoxia or ischemia, when the lack of oxygen decreases the electron transfer in the respiratory chain, complex I converts from the A-form to the D-form. This catalytic conversion is paralleled by conformational changes within complex I that expose a critical cysteine residue of the ND3 subunit, which renders the D-form sensitive to nitrosation and thiol oxidation.30–32 This reversible deactivation of mitochondrial complex I is considered one of the key events in hypoxic tissue response, but is still to be demonstrated as clinically relevant in animal models of ischemia. Here, we show reversible A/D transition of complex I in an HI rat model of the immature brain. Our work describes a novel mechanism by which mitochondrial complex I deactivation may serve as a safety lock preventing the brain energy metabolism from RET, thereby decreasing the ROS production during reoxygenation after HI.
Materials and methods
Cerebral HI
The animal protocol was approved by the Institutional Animal Care and Use Committee of Weill Cornell Medicine. All experiments were conducted in accordance with the Guidelines for the Care and Use of Laboratory Animals of the National Institutes of Health and the ARRIVE guidelines. HI injury was induced by a permanent unilateral (right) CCA ligation followed by systemic hypoxia (8% O2/92% N2) for 1 h in postnatal day 10 (P10, both males and females) Wistar rats (Charles River) as described previously.5,12,33 For this set of experiments, we aimed for a hypoxic exposure sufficient to produce a moderate-severe insult which is consistent with a very limited (<5%) mortality of the animals. After CCA ligation surgery, the rat pups had a 2-h recovery interval before being placed into an air-tight container for systemic hypoxia for 1 h at 37℃ (HI treatment). Non-ligated control rats (C) were exposed to room air. After systemic hypoxia, rats were subjected to a reoxygenation period of varying duration. At 0 h, 30 min, or 4 h after systemic hypoxia, rats were anesthetized with isoflurane and decapitated directly into isopentane/dry ice for rapid freezing. Frozen heads were stored at −80℃ until dissection for further biochemical analyses.
Isolation of mitochondrial fragments and intact mitochondria
For both the activity measurements of mitochondrial enzymes and complexome profiling, mitochondria were isolated from frozen ipsi- and contralateral brain hemispheres by differential centrifugation. After sagittal transection of the heads into the ipsi- and contralateral brain hemispheres, the skull and meninges were quickly removed. The cortical regions with the maximal damage12 were excised from both hemispheres separately.
Fragments of mitochondrial membranes used for the activity measurements and A/D ratio determination were isolated from frozen material as described previously,27,28 In brief, pieces of frozen cortical brain tissue (60–80 mg) were homogenized for 3 min using BioRuptor homogenizer in 1.5 ml of SET medium (250 mM sucrose, 50 mM Tris-HCl, pH 8.8, 0.2 mM EDTA) and 1 mM MgCl2.The homogenization medium was supplemented with 50 µg/ml alamethicin and 1 mM ferricyanide in order to preserve physiological A/D ratio during isolation.26,28 The treatment above permeabilizes the inner mitochondrial membrane leading to rapid oxidation of cellular NADH and preserves the A/D ratio of complex I during the isolation. Tissue debris was discarded after centrifugation for 4 min at 1500g at 4℃. The supernatant was centrifugated for 15 min at 20,000 g at 4℃. The resulting membrane pellet was rinsed twice with SET medium (pH 8.0) and subsequently resuspended in 100 µl of SET medium, pH 7.5. Frozen aliquots were stored at −80℃ until use.
For complexome profiling, the cortical brain tissue after thawing and mincing was mechanically disrupted by homogenization in a 3.5-ml glass/Teflon Potter-Elvehjem homogenizer at 4℃ in mitochondria isolation buffer (250 mM sucrose, 20 mM Tris/HCl, pH 7.4, 1 mM EDTA) supplemented with protease inhibitor cocktail (SigmaFast). Homogenates were centrifuged at 1000g for 10 min at 4℃, and the resulting supernatants were subsequently centrifuged at 10,000g for 10 min at 4℃. The mitochondria-enriched pellets were washed in mitochondria isolation buffer. Protein concentration was determined by Lowry method. Mitochondria protein aliquots were stored at −80℃.
To isolate intact mitochondria, a protocol combining differential centrifugation with digitonin treatment in order to disrupt synaptosomal membranes34 was used as detailed in Stepanova et al.35
Enzyme activity measurements of mitochondrial membranes
All measurements using mitochondrial fragments were performed spectrophotometrically at 25℃. Complex IV activity was measured as oxidation of 50 µM ferrocytochrome c (ɛ550nm = 21.0 mM−1 × cm−1) in SET medium supplemented with 0.025% dodecyl maltoside (DDM). Succinate:ubiquinone reductase activity was determined at 275 nm (ɛ275nm = 13.0 mM−1 × cm−1) in SET medium with 15 µM Q1, 1 mM cyanide, and 10 mM succinate as described previously.36 The activity was fully sensitive to specific inhibitors of complex II, such as malonate or thenoyltrifluoroacetone.
The activity of complex I was determined as oxidation of 150 µM NADH (ɛ340nm = 6.22 mM−1 × cm−1) in 1 ml of standard SET medium, pH 7.5 supplemented with 15 µM cytochrome c, 25 µg/ml alamethicin, 2 mM MgCl2 and 10–25 µg protein/ml mitochondrial membranes. NADH-oxidase activity was fully sensitive to inhibitors of complex I and IV, rotenone and cyanide, respectively, indicating that NADH-oxidation is catalysed only by mitochondrial complex I. NADH:hexammineruthenium (HAR) oxidoreductase37 was assayed in SET medium supplemented with 1 mM cyanide and 1 mM HAR.
The relative content of the active (A) form of complex I in a given mitochondrial membrane preparation was determined as described previously26–28 using initial rates of the NADH-oxidase reaction in the alkaline SET medium at 25℃ before and after activation with a pulse of 20 µM NADH.
Accessing mitochondrial respiration and ROS production in intact mitochondria
Respiration and extramitochondrial release of H2O2 in intact mitochondria were measured using an Oroboros high-resolution respirometer equipped with a fluorescence emission optical module as described.35 Mitochondria (0.14–0.18 mg of protein) were added to the reaction chamber containing 2 ml of respiration buffer composed of 125 mM KCl, 0.2 mM EGTA, 20 mM HEPES-Tris, 4 mM KH2PO4, pH 7.5, 2 mM MgCl2, 2 mg/ml BSA, 10 µM Amplex UltraRed (Invitrogen) and 4 U/ml horseradish peroxidase at 37℃. The following complex I or II substrates were used: 2 mM malate and 5 mM pyruvate or 5 mM succinate, respectively. To initiate state 3 respiration (State 3), 200 µM ADP was added to the mitochondrial suspension. Respiration was fully inhibited by 1 mM cyanide or 1 µM antimycin A. The calibration of Amplex UltraRed response was performed by adding several 93 pmol/ml aliquots of freshly made H2O2 to the measuring medium at the end of the each experiment.
Deactivation of complex I
In vitro deactivation of complex I in intact mitochondria was carried out by preincubation of mitochondria (0.28–0.36 mg/ml) in an anaerobic respiration buffer for 20 min at 37℃ without substrates. This treatment results gradual deactivation of the enzyme, so that 70 or 80% of the enzyme was found to be in the D-form (after 15 and 20 min of incubation, respectively determined as described above). To be able to rapidly return from an anaerobic incubation medium to an oxygen-containing medium that allows for oxygen consumption measurements, the respirometer has been modified by adding a gas headspace (1 ml) above the measurement chamber. The headspace could be continuously purged with humidified gaseous nitrogen through the stopper at a rate of 10–60 ml/min. By varying the partial pressure of gaseous nitrogen in the headspace, we are able to control oxygen concentration in the liquid sample via N2 exchange between the two phases. If necessary, the gas flow can be turned off and the upper stoppers moved to seal the oxygen chamber so that no headspace remains allowing direct oxygen consumption measurements.
Complexome profiling
Frozen mitochondrial proteins (200 µg) were solubilized with 6 g digitonin/g protein in 50 mM NaCl, 5 mM 6-aminohexanoic acid, 1 mM EDTA, 50 mM imidazole/HCl, pH 7.0. After centrifugation at 22,000 g for 20 min at 4℃, the supernatant was supplemented with Coomassie brilliant blue G250 and proteins were separated by 4-16% gradient blue native (BN) polyacrylamide gel electrophoresis (PAGE) as described in detail previously.38
After electrophoresis, the gel was fixed, stained with Coomassie blue, and the gel lanes were prepared for complexome profiling as described previously.39 Briefly, BN gel lanes were cut into 60 even pieces, each of which was cut into smaller pieces, transferred to a 96-well filter microtiter plate (Millipore) and destained in 50% (v/v) methanol, 50 mM ammonium bicarbonate. After complete destaining, in-gel tryptic digestion was performed as described previously.39
Peptides after tryptic digestion were separated by liquid chromatography and subsequently analyzed by tandem mass spectrometry (LC-MS/MS). Q-Exactive 2.0 orbitrap mass spectrometer was equipped at the front end with an Easy-nLC1000 nano-flow ultra-high pressure liquid chromatography system (Thermo Fisher Scientific) and the Thermo Scientific Xcalibur 2.2 SP1 Software Package.40,41
Protein identification, label-free quantification and hierarchical clustering
Mass spectrometry RAW data were analyzed using MaxQuant (version 1.5.0.25; www.maxquant.org42). The extracted spectra were matched against the Rattus norvegicus NCBI Reference Sequence database release 55. Database searches were done with 20 ppm match tolerances. Trypsin was chosen as the protease with two missed cleavages allowed. Fixed modification included cysteine carbamidomethylation, and dynamic ones included N-terminal acetylation and oxidation of methionine. Trypsin and keratin data were removed from the list.
The abundance of each protein was determined by label-free quantification using the composite intensity-based absolute quantification (iBAQ) values determined by MaxQuant analysis42 and was normalized within single and multiple migration profiles using the average peak values of 13 nuclear-encoded proteins, which were not affected by the treatment. Gel migration profiles were built for each protein and normalized to the maximum abundance across all samples analyzed. The profiles of the identified OXPHOS proteins were hierarchically clustered by distance measures based on uncentered Pearson correlation coefficient and the average linkage method. The clustering, visualization, and analysis of the heat maps of the complexome profiles showing the normalized protein abundance in each gel slice in a three color code gradient (black/yellow/red) were done using the NOVA software v0.5.43 Then exported data were processed in Microsoft Excel. Respiratory chain complexes and supercomplexes served as standards for the mass calibration for the BN as previously described.39
Chemicals, protein determination and statistical analysis
All chemicals were purchased from Sigma except when specifically stated. Protein content was determined by BCA assay (Sigma) with 0.1% deoxycholate for solubilisation of mitochondrial membranes.
All results except A/D data are given as mean values of percentages calculated from enzyme activity in the ipsilateral hemisphere versus enzyme activity in the contralateral hemisphere from the same animal. Data are presented as the arithmetic means ± SD. Paired t-test was used for comparison of ipsi- and contralateral hemispheres. Two-sample t-test or multiple t-tests with pooled SD (when possible) were used to compare different groups; p-values were adjusted using false discovery rate estimation. Each group consisted of six to eight animals.
Results
Effect of HI on mitochondrial respiratory chain
Initially, we tested if HI-reoxygenation affects the mitochondrial respiratory chain in the immature brain. The activity of respiratory chain complexes in mitochondrial membranes was evaluated using cortical brain tissues from three experimental groups of HI-treated rats differing in the time of reoxygenation after systemic hypoxia: 0 min (no reoxygenation), 30 min and 4 h. Mitochondrial complex IV (cytochrome c oxidase) activity was lower at 0 min after HI (p = 0.04) but returned to control level at 30 min after reoxygenation, and was further raised significantly at 4 h after reoxygenation (Figure 1(a)). There were no significant changes observed for the activity of mitochondrial complex II (succinate dehydrogenase) (Figure 1(b)).
Figure 1.

Effect of duration of reoxygenation after systemic hypoxia of HI-treated P10 rats on cytochrome c oxidase (a), succinate dehydrogenase (b), NADH oxidase (c) and NADH:HAR reductase activity (d) of brain mitochondria fragments. Complex IV and IV activities in non-ligated control animals were 1.1 ± 0.3 and 0.08 ± 0.02 µmol substrate × min−1 × mg protein−1, respectively. Complex I-mediated activities in control animals were 0.50 ± 0.09 and 0.81 ± 0.19 µmol NADH × min−1 × mg protein−1 for NADH oxidase and HAR reductase, respectively. Values represent the percentage of activities in the ipsi- versus contralateral hemisphere from the same animal (n = 6–8, *−p < 0.05, **−p < 0.01).
NADH oxidase activity (complexes I, III and IV together) declined by about 30% at 4 h of reoxygenation after HI-treatment, indicating an impairment of mitochondrial respiration in the affected rat brain hemisphere (Figure 1(c)). Two different mechanistic scenarios could explain this finding: a decline in the catalytic rate of the enzyme or a decrease of complex I content in the membrane. NADH:HAR reductase activity can be used as a measure of the relative content of functional complex I since it is proportional to the FMN of the enzyme.37,44 We found a reduction of the relative complex I content at 4 h after reoxygenation (Figure 1(d), p = 0.002). This indicates that the enzyme content was affected but not the catalytic activity.
Conformational changes or the A/D transition of complex I occur in highly metabolizing tissues, such as the heart at physiological temperatures when the enzyme is idle.27–29,45 We hypothesized that short time hypoxia would also result in deactivation of the enzyme in the immature brain. Mitochondrial membranes isolated from HI-treated rats before reoxygenation (0 min) showed a noticeable lag-phase at the beginning of the NADH oxidase reaction measurement (Figure 2(a), trace 1), which is one of the classical attributes of the deactivated enzyme. The addition of a 20 µM pulse of NADH before the reaction resulted in complex I activation and eliminated the lag-phase in these samples (Figure 2(a), trace 3). The NADH oxidase reaction catalyzed by the enzyme isolated from control animals did not manifest a lag-phase (Figure 2(a), trace 2) and was not activated by the NADH pulse (Figure 2(a), trace 4), indicating that most of complex I was in the A-form.
Figure 2.

Effect of HI-treatment and duration of reoxygenation after systemic hypoxia of HI-treated P10 rats on A/D ratio of complex I of brain mitochondria fragments. (a) NADH-oxidase activity of complex I in brain mitochondrial membranes (20 µg protein/ml) isolated from HI-treated animals (0 min) (traces 1 and 3) and non-ligated control (traces 2 and 4). Traces 1 and 2 are representative traces of HI-treated and non-ligated control rats, respectively, measured without activation of complex I. The same samples were fully activated by preincubation of mitochondrial membranes with a pulse of 20 µM NADH directly in the cuvette before initiation of the reaction with 150 µM NADH (traces 3 and 4). NADH oxidase was assayed as described in ‘Material and methods’ section; (b) the percentage of the D-form of mitochondrial complex I in the contra- and ipsilateral hemispheres (white and grey bars, respectively). The A/D ratio was calculated using the enzyme assay as described under Methods. Values represent the means ± SD of n = 6–8 animals per group, *−p < 0.05, **−p < 0.01, ***−p < 0.001.
Figure 2(b) shows an estimation of the A/D ratios in mitochondrial membrane preparations presenting the relative fraction of the D-form as percentage of the A-form in the ipsi- and contralateral hemispheres after different reoxygenation times (grey and white bars, respectively). HI-treatment without reoxygenation (0 min) resulted in a deactivation of complex I in the ipsilateral hemisphere (34.7 ± 18.8% of the D-form), whereas the contralateral samples revealed only 13.6 ± 7.5% of complex I in the D-form. Reoxygenation of HI-treated rats for 30 min (Figure 2(b), grey bar) caused complex I to return from the D-form to the A-form, resulting in a percentage of the D-form similar to the contralateral hemisphere of the same animal (6.5 ± 5.5%, Figure 2(b), white bars) or the non-ligated control (C) sample 7.9 ± 4.1% (Figure 2(b)). We concluded that 60 min HI results in deactivation of mitochondrial complex I in the immature brain and reoxygenation returns A/D ratio back to the basal level.
Identification of mitochondrial OXPHOS complexes and supercomplexes by complexome profiling
To study the effect of HI-treatment and subsequent reoxygenation on the composition and abundance of OXPHOS complexes and supercomplexes in rat brains, we analyzed mitochondria by complexome profiling.39,41 This method allows for the identification of proteins in digitonin-solubilized mitochondria by state-of-the-art mass spectrometry and assignment of different protein complexes based on similarities in their migration profiles in blue-native electrophoresis (BNE) gels. Label-free quantification can estimate the relative distribution of mitochondrial proteins.
The results of the complexome profiling of the OXPHOS complexes and supercomplexes in mitochondria isolated from brain samples of HI-treated rats after 0 min, 30 min, and 4 h of reoxygenation are shown in Figure 3. Complexome profiling abundance heat maps (above) are presented along with migration profiles (below) of all detected subunits averaged for OXPHOS complex I (CI), complex II (CII), complex III (CIII), and complex IV (CIV).
Figure 3.

Complexome profiling abundance heat maps and plots of migration profiles of selected OXPHOS complex I (CI), complex II (CII), complex III (CIII), complex IV (CIV) from HI-treated rat brains after different times of reoxygenation. Abundance heat maps and migration profiles of mitochondria from HI-treated rat pups without reoxygenation (0 h; first panel from above), HI-treatment with 30 min of reoxygenation (30 min; second panel from above), and HI-treatment with 4 h of reoxygenation (4 h; third panel from above) are presented to define the relative quantity of OXPHOS complexes and supercomplexes. Rat brains were analyzed for the contralateral (left panels) and ipsilateral brain hemispheres (right panel). Each panel shows the relative abundance of the summary of all detected subunits in the OXPHOS complexes (CI-CIV) and supercomplexes. For each OXPHOS complex, the subunits were assembled manually and color-coded by normalizing the relative abundance in comparison to control and all experiments for each protein separately. The abundance migration profiles of the OXPHOS complexes were monitored by averaging the abundance values for all detected subunits of each of the OXPHOS complexes. In the abundance heat maps (HI; first panel from above), the OXPHOS complexes are indicated, and their molecular masses are given: CI – 1010 kDa, CII – 125 kDa, CIII – 485 kDa, CIV – 210 kDa. Supercomplex S1 – 1705 kDa is indicated.
The complexome profiling data of all samples reveal the presence of complex II subunits in the succinate dehydrogenase complex (CII; ∼ 125 kDa). In all samples, the subunits of complex I were detected in both the monomeric complex I (1010 kDa) and the OXPHOS supercomplexes (S0–S4), including supercomplex S1 consisting of monomeric CI, dimeric CIII, and monomeric CIV depicted in Figure 3 (1705 kDa). At a molecular mass of 485 kDa, subunits of complex III, forming a constitutive dimer, were detected, whereas subunits constituting monomeric complex IV were observed at 210 kDa. Besides the supercomplexes, which are composed of complex III (S0-S4; 1495-2335 kDa) and complex IV (S1-S4; 1705-2335 kDa) in addition to complex I, a supercomplex consisting of the OXPHOS complex III dimer and complex IV monomer is detectable at 695 kDa (not indicated). A comparison of the migration profiles of all samples did not reveal any significant differences in the abundance or the distribution of the OXPHOS complexes and supercomplexes.
Role of HI-induced deactivation of complex I
To this point, our study demonstrates that HI-treatment of P10 rats results in a significant deactivation of mitochondrial complex I of the ipsilateral brain hemisphere. A subsequent reoxygenation period caused the A/D ratio to return to levels as observed in the contralateral hemisphere and in untreated control rats. As observed for mitochondria from heart tissue27–29 and cells,46 ischemia-induced transition of complex I from the A- to the D-form can serve as an intrinsic mechanism to prevent ROS generation in mitochondria upon reoxygenation. To test this, the effect of complex I deactivation on H2O2 release was studied in intact mitochondria.
Initially, we estimated the rates of H2O2 release rate for intact brain mitochondria oxidizing different substrates. Mitochondria from untreated control rats exhibited respiratory control values of 6.5–7.0 when respiring on malate/pyruvate as substrates of mitochondrial respiration, and are therefore able to provide high rates of H2O2 production. In Table 1, the quantitative characteristics of mitochondrial respiration and H2O2 release applying different respiratory substrates are summarized. During oxidation of NADH-generating substrates malate/pyruvate, addition of antimycin A stimulated the H2O2 release two-fold, while it inhibited oxygen consumption by 95% (Figure 4(a), Table 1). The highest rate of H2O2 release was found during succinate oxidation. The succinate-mediated H2O2 production was fully sensitive to the addition of ADP or uncouplers as well as to the complex I inhibitor rotenone, indicating that the ROS generation site is located at complex I and occurs via RET (Figure 4(a), Table 1).
Table 1.
Mitochondrial respiratory activities and H2O2 productiona of brain mitochondria from P10 rats.
| Respiratory activity, nmol O2 × min−1 × mg−1 | H2O2 release pmol × min− 1 × mg−1 | |
|---|---|---|
| Malate + Pyruvate (5 mM + 2 mM) | 29.0 ± 4.3 | 124 ± 17** |
| +ADP (0.2 mM) | 176.5 ± 14.4 | 44 ± 22 |
| +Antimycin A (1µM) | 7.6 ± 2.25 | 215 ± 14 |
| Succinate (5 mM) | 71.7 ± 2.1 | 535 ± 25** |
| +ADP (0.2 mM) | 220.2 ± 21.7 | 59 ± 8 |
| +FCCP (0.2 µM) | 185.0 ± 17.2 | 113 ± 32 |
| +Rotenone (1µM) | 67.0 ± 6.0 | 112 ± 12 |
| +Antimycin A (1µM) | 8.5 ± 0.6 | 166 ± 16 |
Measured simultaneously with respiration (see Methods). Three different preparations of mitochondria were used, each measured in four technical replicates.
p = 0.0005.
Figure 4.

Respiration and ROS production by intact brain mitochondria oxidizing succinate. (a) Representative traces of oxygen consumption (black) and H2O2 release (red) during oxidation of succinate by mitochondria (0.16 mg protein/ml). (b) Release of H2O2 as a function of oxygen concentration 100% rate corresponds to 535 pmol H2O2 × min−1 × mg−1. Oxygen concentration was rapidly varied by continuously purging the headspace with nitrogen as described in ‘Materials and methods’ section while measuring directly by the Oroboros respirometer.
It was important to determine how mitochondrial ROS production changes at different oxygen levels. The effect of oxygen concentration on mitochondrial H2O2 release during succinate oxidation was estimated by purging the headspace in the Oroboros system with nitrogen to quickly reduce the partial pressure of O2 in solution. RET-associated H2O2 production during succinate oxidation was linearly dependent on the oxygen concentration in the medium over a broad range (5–200 µM [O2], Figure 4(b)).
To test the effect of complex I deactivation on H2O2 release during RET, in vitro oxygenation was initiated by addition of an oxygen-saturated respiration buffer supplemented with 10 mM succinate to an equal volume of anoxic suspension of intact mitochondria containing either the A- or the D-form of complex I (as described in Materials and Methods). This resulted in a steep increase of the oxygen concentration in solution to 100–110 µM, thereby initiating respiration under RET conditions associated with H2O2 production. As shown in Figure 5, the rate of H2O2 release increased with time. When complex I was in the D-form, acceleration of ROS production occurred significantly slower with an initial lag phase (Figure 5(a)). The half-time of the rate increase was 19.3 ± 2.1 and 47.9 ± 4.0 s for the A and the D-form, respectively (Figure 5(b), p = 0.002). Overall, these results indicate that the deactivation of complex I lowered the initial rates H2O2 release upon reoxygenation.
Figure 5.
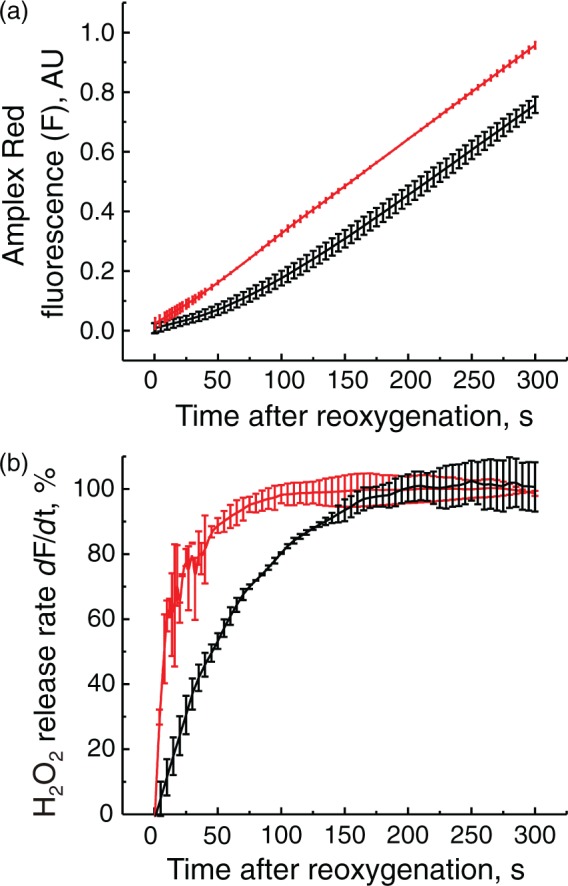
Effect of complex I deactivation on the initial rates of H2O2 release by intact brain mitochondria upon reoxygenation. Reoxygenation initiated by addition of 1 ml of the aerobic respiratory medium containing 10 mM succinate to anaerobic mitochondrial suspension containing either the A- or the D-form of complex I (red and black traces, respectively) and all of the components of the assay. (a) Raw amplex UltraRed fluorescent signal (F); (b) a derivative (dF/dt) of the raw fluorescent signal showing the increase of the initial rates of the H2O2 release after reoxygenation in time. 100% rate corresponds to 250 pmol × min−1 × mg−1. Average of six registration traces is shown.
Discussion
Using the Rice-Vannucci model of oxygen deprivation in the developing brain,5,33 we observed a significant change in activities of the enzymes of the respiratory chain following HI-reoxygenation. Mitochondrial respiration rate can be a good predictor of tissue survival after I/R.47 However, the changes in mitochondrial respiration observed in the present study cannot be exclusively attributed to neurons only. It is known that the enzymatic profile is mostly oxidative type in neurons and glycolysis in glial cells.48,49 Astrocytes have a limited capacity to stimulate processing of pyruvate through the Krebs cycle and at the same time neurons cannot upregulate glycolysis and possess mostly high OXPHOS activity.48 At the same time, a glia-to-neuron ratio of 0.4–0.35 was reported for adult mouse brain,50,51 suggesting that neuronal mitochondria may contribute the major fraction of respiratory activity in our preparation.
We found that cytochrome c oxidase activity is decreased after HI. This observation corroborates with previous studies in the adult brain ischemia model.19,20 An unexpected increase in activity at 4 h of reoxygenation after HI-treatment may partially indicate a compensatory upregulation of the enzyme in the developing brain52,53 in response to HI. Specific activation of the cytochrome c oxidase catalytic rate by enzyme phosphorylation or by allosteric mechanisms cannot be excluded, as shown for the enzyme from heart tissue.54–56
We observed a tendency of increased complex II activity 4 h after HI-reoxygenation in the immature brain. A comparable increase in the enzyme activity was observed recently in brain mitochondria from adult gerbils after ischemia.57
Energy-generating oxidation of NADH in the mitochondrial matrix of aerobic cells is catalyzed exclusively by mitochondrial complex I. Physiological regulation of this critical component of cellular metabolism is not completely understood. Complex I has been recognized as an initial target as well as a source of ROS in ischemia/reperfusion injury.18,58–60
We found a significant decrease in complex I activity in samples obtained at 4 h of reoxygenation after HI. This is in agreement with data on the decline of complex I-dependent respiration obtained in a similar model of neonatal HI in mice18 as well as in adult brain after ischemia/reperfusion.16,17,61 It should be stressed that in our model of neonatal HI-reoxygenation, the decrease of complex I activity could be due to a decrease of content of the enzyme or loss of functionality of its NADH-binding catalytic domain. However, unlike in cardiac ischemia,62,63 we did not detect any significant differences in the distribution of complex I monomers or in complex I-containing supercomplexes by complexome profiling of mitochondria from control and HI-reoxygenation-treated brain samples. Changes in protein abundance of complex I and its subunits were also not detected by complexome profiling.
We found that intact mitochondria from immature brain oxidizing succinate generate H2O2 at the highest rate, which agrees with previous studies using brain and heart mitochondria.18,64–67 The absolute values of H2O2 production in mitochondria from immature rat brain are very close to the data obtained for the adult mouse brain mitochondria.68 In our experiments, the rate of H2O2 release is equivalent to about 1% of total oxygen consumption in RET, which is less than observed for mitochondria from adult rat brain.69
We observed a linear dependence of RET-supported H2O2 release on oxygen concentration, supporting previous studies demonstrating a similar dependence of superoxide generation by heart submitochondrial particles oxidizing succinate.70 An almost linear dependence of H2O2 production on oxygen concentration in hyperoxic conditions was also found in brain in vivo.71 Our observation suggests that the rate of H2O2 generation (or more accurately, of its precursor, superoxide) is proportional to the oxygen concentration, obeying the law of mass action. This is in apparent disagreement with the widely accepted concept of hypoxia-stimulated ROS production playing a significant role in stabilization of transcription factor HIF-1α.72,73
An interesting characteristic of mitochondrial complex I is its ability to adopt two distinct states: the catalytically active (A) and the deactive, dormant state (D)24 (reviewed in Vinogradov25 and Babot et al.26). We demonstrated for the first time the existence of a reversible A/D transition of mitochondrial complex I in a physiologically relevant HI-reoxygenation model of the developing brain. The presence of around 10% of the total enzyme in the D-from in the brain of untreated control animals suggests that a finely tuned balance between the A- and the D-form can govern the rate of OXPHOS in brain mitochondria defined by the magnitude and the dynamics of ATP-demand as well as oxygen availability. It should be noted that the difference in the D-form content in mitochondrial membranes derived from the samples subjected to 15 min HI (34.7 ± 18.8%) is twofold lower than the degree of inactivation of the enzyme after 15 min anaerobic incubation or intact brain mitochondria in vitro. It may reflect a difference between in situ and in vitro conditions, but more likely was due to some uncertainty in the excision of the ischemic area of the frozen brain.
Ischemic deactivation of the enzyme would delay the return of cellular respiration back to the baseline level at the time of reoxygenation and, most likely, has a protective role.31,46,74 Several ischemia-reperfusion studies of the heart59,75,76 and brain18 demonstrated that inhibition of complex I by various agents decreased the extent of HI-reoxygenation injury. On the one hand, this result seems paradoxical since a quick return of the respiratory chain to operating at full capacity ensures normalization of ATP and phosphocreatine levels after an ischemic episode. On the other hand, at the early stage of reperfusion, full recovery of complex I is associated with an accelerated release of ROS,18,59 probably due to the process of RET.60 A markedly reduced succinate-supported H2O2 release from the mitochondria isolated immediately after HI without reoxygenation, was observed using similar Rice-Vannucci HI-reoxygenation model.18 In this study, 30-min reoxygenation results in an increase of H2O2 generation in mitochondria in RET conditions. Our results suggested a mechanistic explanation for these observations.
More than 25 years ago, the inability of the D-form to catalyze RET was shown in the preparation of submitochondrial particles.24 Redox properties of the D-form are very similar to the enzyme inhibited by rotenone.25 Since rotenone inhibits H2O2 release in intact mitochondria oxidizing succinate, it should be expected that the deactivation also prevents ROS generation. For the first time, we directly demonstrated that the D-form of the enzyme is less active in ROS generation in RET when oxidation of succinate is catalysed by intact mitochondria in vitro. Therefore, the process of A to D transition of mitochondrial complex I could be considered as an intrinsic protective mechanism against ROS formation by reverse electron transport.
After a period of oxygen deprivation, succinate levels are elevated in the brain77,78 and the heart.60,79 Upon reperfusion, in the presence of mitochondrial membrane potential, electrons from accumulated succinate could be transferred upstream to complex I, where superoxide anion can be produced, most likely at the level of FMN.68,80–82 Under these conditions, deactivation of complex I (or transient treatment with specific inhibitors) prevents the reduction of all complex I redox centers including FMN and renders the enzyme inert.
Complex I A/D dynamics during reoxygenation in brain attests an important role of this enzyme in the prevention and compensation of HI-reoxygenation injury. Our results identify the deactivation of mitochondrial complex I in ischemia as an important protective mechanism following ischemia-reperfusion injury. We believe that further characterization of the A/D transition in brain ischemia may provide a better understanding of the regulation of the brain tissue response to oxygen deprivation. Our finding of oxygen-dependent deactivation of complex I extends the mechanistic knowledge of brain injury and adaptation of the nervous tissue to HI and opens new avenues in the search for neuroprotective treatments.
Collectively, our data suggest that we identified a key mechanism of regulation of OXPHOS and ROS production in mitochondria by oxygen.
Acknowledgements
A fellowship from the Humboldt Foundation to SG is gratefully acknowledged. We are grateful to Suzanne R Burstein and Tabitha Emde for help in the preparation of this manuscript.
Authors’ contributions
Anna Stepanova – Acquisition of data, analysis, and interpretation of data, drafting the article. Sergio Guerrero-Castillo – Acquisition of proteomics data, analysis and interpretation of data. Giovanni Manfredi – critical revision of the article, final approval; Csaba Konrad – fluorescent module setting up and programming. Susanne Arnold – Supervisor, analysis and interpretation of proteomics data, critical revision of the article, final approval. Susan J Vannucci – Supervisor, animal model experimental design, critical revision of the article, final approval. Alexander Galkin – Supervisor, conception, acquisition of data, analysis, and interpretation of data, drafting the article, critical revision of the article, final approval.
Funding
The author(s) disclosed receipt of the following financial support for the research, authorship, and/or publication of this article: This study was supported by MRC grant MR/L007339/1 (to A.G.), and grants from the LeDucq Fondation, France (SJV) and the National Institutes of Health, USA (NIH/R21NS083425) (SJV).
Declaration of conflicting interests
The author(s) declared no potential conflicts of interest with respect to the research, authorship, and/or publication of this article.
References
- 1.Volpe JJ. Brain injury in the premature infant – current concepts of pathogenesis and prevention. Biol Neonate 1992; 62: 231–242. [DOI] [PubMed] [Google Scholar]
- 2.McGuire W. Perinatal asphyxia. BMJ Clin Evid 2007; 2007: 0320. [PMC free article] [PubMed] [Google Scholar]
- 3.Vannucci RC. Hypoxic-ischemic encephalopathy. Am J Perinatol 2000; 17: 113–20. [DOI] [PubMed] [Google Scholar]
- 4.Lee AC, Kozuki N, Blencowe H, et al. Intrapartum-related neonatal encephalopathy incidence and impairment at regional and global levels for 2010 with trends from 1990. Pediatr Res 2013; 74(Suppl 1): 50–72. [DOI] [PMC free article] [PubMed] [Google Scholar]
- 5.Rice JE, 3rd, Vannucci RC, Brierley JB. The influence of immaturity on hypoxic-ischemic brain damage in the rat. Ann Neurol 1981; 9: 131–141. [DOI] [PubMed] [Google Scholar]
- 6.Rousset CI, Baburamani AA, Thornton C, et al. Mitochondria and perinatal brain injury. J Matern Fetal Neonatal Med 2012; 25(Suppl 1): 35–38. [DOI] [PubMed] [Google Scholar]
- 7.Gilland E, Puka-Sundvall M, Hillered L, et al. Mitochondrial function and energy metabolism after hypoxia-ischemia in the immature rat brain: involvement of NMDA-receptors. J Cereb Blood Flow Metab 1998; 18: 297–304. [DOI] [PubMed] [Google Scholar]
- 8.Puka-Sundvall M, Gajkowska B, Cholewinski M, et al. Subcellular distribution of calcium and ultrastructural changes after cerebral hypoxia-ischemia in immature rats. Brain Res Dev Brain Res. 2000; 125: 31–41. [DOI] [PubMed] [Google Scholar]
- 9.Caspersen CS, Sosunov A, Utkina-Sosunova I, et al. An isolation method for assessment of brain mitochondria function in neonatal mice with hypoxic-ischemic brain injury. Dev Neurosci 2008; 30: 319–324. [DOI] [PMC free article] [PubMed] [Google Scholar]
- 10.Lorek A, Takei Y, Cady EB, et al. Delayed (“secondary”) cerebral energy failure after acute hypoxia-ischemia in the newborn piglet: continuous 48-hour studies by phosphorus magnetic resonance spectroscopy. Pediatr Res 1994; 36: 699–706. [DOI] [PubMed] [Google Scholar]
- 11.Ten VS, Yao J, Ratner V, et al. Complement component c1q mediates mitochondria-driven oxidative stress in neonatal hypoxic-ischemic brain injury. J Neurosci 2010; 30: 2077–2087. [DOI] [PMC free article] [PubMed] [Google Scholar]
- 12.Vannucci RC, Towfighi J, Vannucci SJ. Secondary energy failure after cerebral hypoxia-ischemia in the immature rat. J Cereb Blood Flow Metab 2004; 24: 1090–1097. [DOI] [PubMed] [Google Scholar]
- 13.Blumberg RM, Cady EB, Wigglesworth JS, et al. Relation between delayed impairment of cerebral energy metabolism and infarction following transient focal hypoxia-ischaemia in the developing brain. Exp Brain Res 1997; 113: 130–137. [DOI] [PubMed] [Google Scholar]
- 14.Chomova M, Tatarkova Z, Dobrota D, et al. Ischemia-induced inhibition of mitochondrial complex I in rat brain: effect of permeabilization method and electron acceptor. Neurochem Res 2012; 37: 965–976. [DOI] [PubMed] [Google Scholar]
- 15.Almeida A, Allen KL, Bates TE, et al. Effect of reperfusion following cerebral ischaemia on the activity of the mitochondrial respiratory chain in the gerbil brain. J Neurochem 1995; 65: 1698–1703. [DOI] [PubMed] [Google Scholar]
- 16.Allen KL, Almeida A, Bates TE, et al. Changes of respiratory chain activity in mitochondrial and synaptosomal fractions isolated from the gerbil brain after graded ischaemia. J Neurochem 1995; 64: 2222–2229. [DOI] [PubMed] [Google Scholar]
- 17.Sims NR. Selective impairment of respiration in mitochondria isolated from brain subregions following transient forebrain ischemia in the rat. J Neurochem 1991; 56: 1836–1844. [DOI] [PubMed] [Google Scholar]
- 18.Niatsetskaya ZV, Sosunov SA, Matsiukevich D, et al. The oxygen free radicals originating from mitochondrial complex I contribute to oxidative brain injury following hypoxia-ischemia in neonatal mice. J Neurosci 2012; 32: 3235–3244. [DOI] [PMC free article] [PubMed] [Google Scholar]
- 19.Racay P, Tatarkova Z, Drgova A, et al. Ischemia-reperfusion induces inhibition of mitochondrial protein synthesis and cytochrome c oxidase activity in rat hippocampus. Physiol Res 2009; 58: 127–138. [DOI] [PubMed] [Google Scholar]
- 20.Villa RF, Gorini A, Hoyer S. Effect of ageing and ischemia on enzymatic activities linked to Krebs' cycle, electron transfer chain, glutamate and aminoacids metabolism of free and intrasynaptic mitochondria of cerebral cortex. Neurochem Res 2009; 34: 2102–2116. [DOI] [PubMed] [Google Scholar]
- 21.Chance B, Hollunger G. Energy-linked reduction of mitochondrial pyridine nucleotide. Nature 1960; 185: 666–672. [DOI] [PubMed] [Google Scholar]
- 22.Kotlyar AB, Vinogradov AD. Slow active/inactive transition of the mitochondrial NADH- ubiquinone reductase. Biochim Biophys Acta 1990; 1019: 151–158. [DOI] [PubMed] [Google Scholar]
- 23.Dröse S, Brandt U. Molecular mechanisms of superoxide production by the mitochondrial respiratory chain. Adv Exp Med Biol 2012; 748: 145–169. [DOI] [PubMed] [Google Scholar]
- 24.Kotlyar AB, Vinogradov AD. Slow active/inactive transition of the mitochondrial NADH-ubiquinone reductase. Biochim Biophys Acta 1990; 1019: 151–158. [DOI] [PubMed] [Google Scholar]
- 25.Vinogradov AD. Catalytic properties of the mitochondrial NADH-ubiquinone oxidoreductase (Complex I) and the pseudo-reversible active/inactive enzyme transition. Biochim Biophys Acta 1998; 1364: 169–185. [DOI] [PubMed] [Google Scholar]
- 26.Babot M, Birch A, Labarbuta P, et al. Characterisation of the active/de-active transition of mitochondrial complex I. Biochim Biophys Acta 2014; 1837: 1083–1092. [DOI] [PMC free article] [PubMed] [Google Scholar]
- 27.Maklashina E, Sher Y, Zhou HZ, et al. Effect of anoxia/reperfusion on the reversible active/de-active transition of NADH-ubiquinone oxidoreductase (complex I) in rat heart. Biochim Biophys Acta 2002; 1556: 6–12. [DOI] [PubMed] [Google Scholar]
- 28.Gorenkova N, Robinson E, Grieve D, et al. Conformational change of mitochondrial complex I increases ROS sensitivity during ischaemia. Antioxid Redox Signal 2013; 19: 1459–1468. [DOI] [PMC free article] [PubMed] [Google Scholar]
- 29.Chouchani ET, Methner C, Nadtochiy SM, et al. Cardioprotection by S-nitrosation of a cysteine switch on mitochondrial complex I. Nat Med 2013; 19: 753–759. [DOI] [PMC free article] [PubMed] [Google Scholar]
- 30.Galkin A, Meyer B, Wittig I, et al. Identification of the mitochondrial ND3 subunit as a structural component involved in the active/deactive enzyme transition of respiratory complex I. J Biol Chem 2008; 283: 20907–20913. [DOI] [PMC free article] [PubMed] [Google Scholar]
- 31.Galkin A, Moncada S. S-nitrosation of mitochondrial complex I depends on its structural conformation. J Biol Chem 2007; 282: 37448–37453. [DOI] [PubMed] [Google Scholar]
- 32.Gavrikova EV, Vinogradov AD. Active/de-active state transition of the mitochondrial complex I as revealed by specific sulfhydryl group labeling. FEBS Lett 1999; 455: 36–40. [DOI] [PubMed] [Google Scholar]
- 33.Vannucci RC, Vannucci SJ. A model of perinatal hypoxic-ischemic brain damage. Ann N Y Acad Sci 1997; 835: 234–249. [DOI] [PubMed] [Google Scholar]
- 34.Rosenthal RE, Hamud F, Fiskum G, et al. Cerebral ischemia and reperfusion: prevention of brain mitochondrial injury by lidoflazine. J Cereb Blood Flow Metab 1987; 7: 752–758. [DOI] [PubMed] [Google Scholar]
- 35.Stepanova A, Kahl A, Konrad C, et al. Reverse electron transfer results in a loss of flavin from mitochondrial complex I: potential mechanism for brain ischemia reperfusion injury. J Cereb Blood Flow Metab 2017; 37: 3649–3658. [DOI] [PMC free article] [PubMed] [Google Scholar]
- 36.Stepanova A, Shurubor Y, Valsecchi F, et al. Differential susceptibility of mitochondrial complex II to inhibition by oxaloacetate in brain and heart. Biochim Biophys Acta 2016; 1857: 1561–1568. [DOI] [PMC free article] [PubMed] [Google Scholar]
- 37.Sled VD, Vinogradov AD. Kinetics of the mitochondrial NADH-ubiquinone oxidoreductase interaction with hexammineruthenium(III). Biochim Biophys Acta 1993; 1141: 262–268. [DOI] [PubMed] [Google Scholar]
- 38.Wittig I, Braun HP, Schägger H. Blue native PAGE. Nat Protoc 2006; 1: 418–428. [DOI] [PubMed] [Google Scholar]
- 39.Heide H, Bleier L, Steger M, et al. Complexome profiling identifies TMEM126B as a component of the mitochondrial complex I assembly complex. Cell Metab 2012; 16: 538–549. [DOI] [PubMed] [Google Scholar]
- 40.Olsen JV, de Godoy LM, Li G, et al. Parts per million mass accuracy on an Orbitrap mass spectrometer via lock mass injection into a C-trap. Mol Cell Proteomics 2005; 4: 2010–2021. [DOI] [PubMed] [Google Scholar]
- 41.Guerrero-Castillo S, Baertling F, Kownatzki D, et al. The assembly pathway of mitochondrial respiratory chain complex I. Cell Metab 2017; 25: 128–139. [DOI] [PubMed] [Google Scholar]
- 42.Cox J, Mann M. MaxQuant enables high peptide identification rates, individualized p.p.b.-range mass accuracies and proteome-wide protein quantification. Nat Biotechnol 2008; 26: 1367–1372. [DOI] [PubMed] [Google Scholar]
- 43.Giese H, Ackermann J, Heide H, et al. NOVA: a software to analyze complexome profiling data. Bioinformatics 2015; 31: 440–441. [DOI] [PubMed] [Google Scholar]
- 44.Birrell JA, Yakovlev G, Hirst J. Reactions of the flavin mononucleotide in complex I: a combined mechanism describes NADH oxidation coupled to the reduction of APAD+, ferricyanide, or molecular oxygen. Biochemistry 2009; 48: 12005–12013. [DOI] [PubMed] [Google Scholar]
- 45.Babot M, Galkin A. Molecular mechanism and physiological role of active-deactive transition of mitochondrial complex I. Biochem Soc Trans 2013; 41: 1325–1330. [DOI] [PMC free article] [PubMed] [Google Scholar]
- 46.Galkin A, Abramov AY, Frakich N, et al. Lack of oxygen deactivates mitochondrial complex I: implications for ischemic injury? J Biol Chem 2009; 284: 36055–36061. [DOI] [PMC free article] [PubMed] [Google Scholar]
- 47.Hertz L. Bioenergetics of cerebral ischemia: a cellular perspective. Neuropharmacology 2008; 55: 289–309. [DOI] [PubMed] [Google Scholar]
- 48.Magistretti PJ, Allaman I. A cellular perspective on brain energy metabolism and functional imaging. Neuron 2015; 86: 883–901. [DOI] [PubMed] [Google Scholar]
- 49.Lovatt D, Sonnewald U, Waagepetersen HS, et al. The transcriptome and metabolic gene signature of protoplasmic astrocytes in the adult murine cortex. J Neurosci 2007; 27: 12255–12266. [DOI] [PMC free article] [PubMed] [Google Scholar]
- 50.Herculano-Houzel S, Watson C, Paxinos G. Distribution of neurons in functional areas of the mouse cerebral cortex reveals quantitatively different cortical zones. Front Neuroanat 2013; 7: 35. [DOI] [PMC free article] [PubMed] [Google Scholar]
- 51.Rangroo Thrane V, Thrane AS, Wang F, et al. Ammonia triggers neuronal disinhibition and seizures by impairing astrocyte potassium buffering. Nat Med 2013; 19: 1643–1648. [DOI] [PMC free article] [PubMed] [Google Scholar]
- 52.Brown GC, Crompton M, Wray S. Cytochrome oxidase content of rat brain during development. Biochim Biophys Acta 1991; 1057: 273–275. [DOI] [PubMed] [Google Scholar]
- 53.Bates TE, Almeida A, Heales SJ, et al. Postnatal development of the complexes of the electron transport chain in isolated rat brain mitochondria. Dev Neurosci 1994; 16: 321–327. [DOI] [PubMed] [Google Scholar]
- 54.Helling S, Vogt S, Rhiel A, et al. Phosphorylation and kinetics of mammalian cytochrome c oxidase. Mol Cell Proteomics 2008; 7: 1714–1724. [DOI] [PMC free article] [PubMed] [Google Scholar]
- 55.Acin-Perez R, Salazar E, Brosel S, et al. Modulation of mitochondrial protein phosphorylation by soluble adenylyl cyclase ameliorates cytochrome oxidase defects. EMBO Mol Med 2009; 1: 392–406. [DOI] [PMC free article] [PubMed] [Google Scholar]
- 56.Arnold S, Kadenbach B. Cell respiration is controlled by ATP, an allosteric inhibitor of cytochrome-c oxidase. Eur J Biochem 1997; 249: 350–354. [DOI] [PubMed] [Google Scholar]
- 57.Shcherbak NS, Galagudza MM, Ovchinnikov DA, et al. Activity of succinate dehydrogenase in the neocortex and hippocampus of Mongolian gerbils with ischemic and reperfusion brain injury. Bull Exp Biol Med 2013; 155: 14–17. [DOI] [PubMed] [Google Scholar]
- 58.Cino M, Del Maestro RF. Generation of hydrogen peroxide by brain mitochondria: the effect of reoxygenation following postdecapitative ischemia. Arch Biochem Biophys 1989; 269: 623–638. [DOI] [PubMed] [Google Scholar]
- 59.Ambrosio G, Zweier JL, Duilio C, et al. Evidence that mitochondrial respiration is a source of potentially toxic oxygen free radicals in intact rabbit hearts subjected to ischemia and reflow. J Biol Chem 1993; 268: 18532–18541. [PubMed] [Google Scholar]
- 60.Chouchani ET, Pell VR, Gaude E, et al. Ischaemic accumulation of succinate controls reperfusion injury through mitochondrial ROS. Nature 2014; 515: 431–435. [DOI] [PMC free article] [PubMed] [Google Scholar]
- 61.Canevari L, Kuroda S, Bates TE, et al. Activity of mitochondrial respiratory chain enzymes after transient focal ischemia in the rat. J Cereb Blood Flow Metab 1997; 17: 1166–1169. [DOI] [PubMed] [Google Scholar]
- 62.Gadicherla AK, Stowe DF, Antholine WE, et al. Damage to mitochondrial complex I during cardiac ischemia reperfusion injury is reduced indirectly by anti-anginal drug ranolazine. Biochim Biophys Acta 2012; 1817: 419–429. [DOI] [PMC free article] [PubMed] [Google Scholar]
- 63.Rosca M, Minkler P, Hoppel CL. Cardiac mitochondria in heart failure: normal cardiolipin profile and increased threonine phosphorylation of complex IV. Biochim Biophys Acta 2011; 1807: 1373–1382. [DOI] [PubMed] [Google Scholar]
- 64.Hinkle PC, Butow RA, Racker E, et al. Partial resolution of the enzymes catalyzing oxidative phosphorylation. XV. Reverse electron transfer in the flavin-cytochrome beta region of the respiratory chain of beef heart submitochondrial particles. J Biol Chem 1967; 242: 5169–5173. [PubMed] [Google Scholar]
- 65.Votyakova TV, Reynolds IJ. ΔΨm-dependent and -independent production of reactive oxygen species by rat brain mitochondria. J Neurochem 2001; 79: 266–277. [DOI] [PubMed] [Google Scholar]
- 66.Quinlan CL, Perevoshchikova IV, Hey-Mogensen M, et al. Sites of reactive oxygen species generation by mitochondria oxidizing different substrates. Redox Biol 2013; 1: 304–312. [DOI] [PMC free article] [PubMed] [Google Scholar]
- 67.Tahara EB, Navarete FD, Kowaltowski AJ. Tissue-, substrate-, and site-specific characteristics of mitochondrial reactive oxygen species generation. Free Radic Biol Med 2009; 46: 1283–1297. [DOI] [PubMed] [Google Scholar]
- 68.Kwong LK, Sohal RS. Substrate and site specificity of hydrogen peroxide generation in mouse mitochondria. Arch Biochem Biophys 1998; 350: 118–126. [DOI] [PubMed] [Google Scholar]
- 69.Starkov AA, Fiskum G. Regulation of brain mitochondrial H2O2 production by membrane potential and NAD(P)H redox state. J Neurochem 2003; 86: 1101–1107. [DOI] [PubMed] [Google Scholar]
- 70.Vinogradov AD, Grivennikova VG. Generation of superoxide-radical by the NADH:ubiquinone oxidoreductase of heart mitochondria. Biochemistry 2005; 70: 120–127. [DOI] [PubMed] [Google Scholar]
- 71.Yusa T, Beckman JS, Crapo JD, et al. Hyperoxia increases H2O2 production by brain in vivo. J Appl Physiol 1987; 63: 353–358. [DOI] [PubMed] [Google Scholar]
- 72.Bell EL, Klimova TA, Eisenbart J, et al. Mitochondrial reactive oxygen species trigger hypoxia-inducible factor-dependent extension of the replicative life span during hypoxia. Mol Cell Biol 2007; 27: 5737–5745. [DOI] [PMC free article] [PubMed] [Google Scholar]
- 73.Klimova T, Chandel NS. Mitochondrial complex III regulates hypoxic activation of HIF. Cell Death Differ 2008; 15: 660–666. [DOI] [PubMed] [Google Scholar]
- 74.Chouchani ET, Hurd TR, Nadtochiy SM, et al. Identification of S-nitrosated mitochondrial proteins by S-nitrosothiol difference in gel electrophoresis (SNO-DIGE): implications for the regulation of mitochondrial function by reversible S-nitrosation. Biochem J 2010; 430: 49–59. [DOI] [PMC free article] [PubMed] [Google Scholar]
- 75.Lesnefsky EJ, Chen Q, Moghaddas S, et al. Blockade of electron transport during ischemia protects cardiac mitochondria. J Biol Chem 2004; 279: 47961–47967. [DOI] [PubMed] [Google Scholar]
- 76.Riepe MW, Ludolph AC. Chemical preconditioning: a cytoprotective strategy. Mol Cell Biochem 1997; 174: 249–254. [PubMed] [Google Scholar]
- 77.Folbergrova J, Ljunggren B, Norberg K, et al. Influence of complete ischemia on glycolytic metabolites, citric acid cycle intermediates, and associated amino acids in the rat cerebral cortex. Brain Res 1974; 80: 265–279. [DOI] [PubMed] [Google Scholar]
- 78.Solberg R, Enot D, Deigner HP, et al. Metabolomic analyses of plasma reveals new insights into asphyxia and resuscitation in pigs. PLoS One 2010; 5: e9606. [DOI] [PMC free article] [PubMed] [Google Scholar]
- 79.Pisarenko O, Studneva I, Khlopkov V, et al. An assessment of anaerobic metabolism during ischemia and reperfusion in isolated guinea pig heart. Biochim Biophys Acta 1988; 934: 55–63. [DOI] [PubMed] [Google Scholar]
- 80.Galkin A, Brandt U. Superoxide radical formation by pure complex I (NADH:ubiquinone oxidoreductase) from Yarrowia lipolytica. J Biol Chem 2005; 280: 30129–30135. [DOI] [PubMed] [Google Scholar]
- 81.Kussmaul L, Hirst J. The mechanism of superoxide production by NADH:ubiquinone oxidoreductase (complex I) from bovine heart mitochondria. Proc Natl Acad Sci U S A 2006; 103: 7607–7612. [DOI] [PMC free article] [PubMed] [Google Scholar]
- 82.Liu Y, Fiskum G, Schubert D. Generation of reactive oxygen species by the mitochondrial electron transport chain. J Neurochem 2002; 80: 780–787. [DOI] [PubMed] [Google Scholar]