Significance Statement
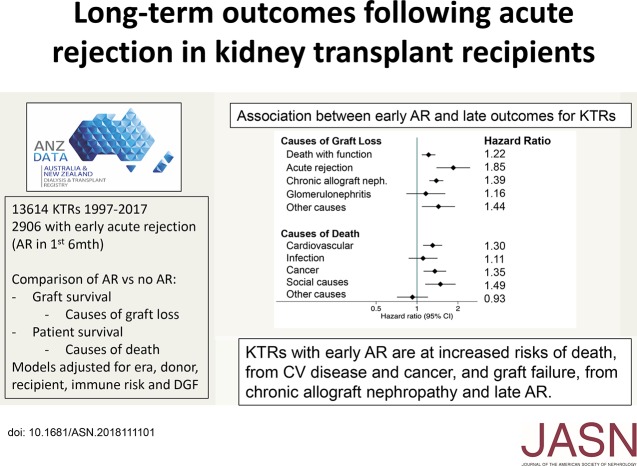
Declining rates of acute rejection (AR) and the very high rate of 1-year graft survival among patients with AR has led some clinicians and researchers to reconsider the importance of AR as a primary outcome in clinical trials or in patients. The authors examine the association of AR within 6 months of kidney transplant with long-term outcomes of transplant recipients, using data from the Australia and New Zealand Dialysis and Transplant (ANZDATA) Registry between 1997 and 2017. Recipients with early AR were more likely to experience graft loss attributed to chronic allograft nephropathy (hazard ratio [HR], 1.39; 95% confidence interval [95% CI], 1.23 to 1.56) and recurrent AR (HR, 1.85; 95% CI, 1.39 to 2.46). Recipients with early AR were also more likely to die from cardiovascular disease (HR, 1.30; 95% CI, 1.11 to 1.53) or cancer (HR, 1.35; 95% CI, 1.12 to 1.64). AR therefore remains an important short-term outcome in kidney transplantation with significant long-term effects.
Keywords: kidney transplantation, rejection, chronic allograft failure, survival
Visual Abstract
Abstract
Background
Declining rates of acute rejection (AR) and the high rate of 1-year graft survival among patients with AR have prompted re-examination of AR as an outcome in the clinic and in trials. Yet AR and its treatment may directly or indirectly affect longer-term outcomes for kidney transplant recipients.
Methods
To understand the long-term effect of AR on outcomes, we analyzed data from the Australia and New Zealand Dialysis and Transplant Registry, including 13,614 recipients of a primary kidney-only transplant between 1997 and 2017 with at least 6 months of graft function. The associations between AR within 6 months post-transplant and subsequent cause-specific graft loss and death were determined using Cox models adjusted for baseline donor, recipient, and transplant characteristics.
Results
AR occurred in 2906 recipients (21.4%) and was associated with graft loss attributed to chronic allograft nephropathy (hazard ratio [HR], 1.39; 95% confidence interval [95% CI], 1.23 to 1.56) and recurrent AR beyond month 6 (HR, 1.85; 95% CI, 1.39 to 2.46). Early AR was also associated with death with a functioning graft (HR, 1.22; 95% CI, 1.08 to 1.36), and with death due to cardiovascular disease (HR, 1.30; 95% CI, 1.11 to 1.53) and cancer (HR, 1.35; 95% CI, 1.12 to 1.64). Sensitivity analyses restricted to subgroups with either biopsy-proven, antibody-mediated, or vascular rejection, or stratified by treatment response produced similar results.
Conclusions
AR is associated with increased risks of longer-term graft failure and death, particularly death from cardiovascular disease and cancer. The results suggest AR remains an important short-term outcome to monitor in kidney transplantation and clinical trials.
The incidence of acute rejection (AR) has fallen throughout the history of kidney transplantation, from rates exceeding 50% during the 1970s to 10%–20% in the current era, as reported by the major registries from the United States and Australia/New Zealand.1,2 Once a major cause of graft loss, AR is now uncommonly attributed as a cause of graft failure.1,2 Between 2000 and 2010 in Australia and New Zealand, <3% of all transplant procedures resulted in graft loss directly attributed to AR in the first post-transplant year.3 As a less common occurrence with an apparently declining effect on graft failure,4 AR has increasingly been captured as a secondary, rather than primary, outcome in clinical trials.5
The diagnosis of AR may have significant short-term consequences beyond immediate graft loss. From a patient perspective, anxiety and fear of graft loss, increased tests and costs, follow-up frequency, treatment intensity, and risk of side-effects including infections and death are incurred.6,7 From a provider perspective, higher costs linked to treatment and follow-up have been documented.7
Early episodes of AR may also have consequences for the patient and their graft beyond the first 6 months after transplantation. Greater histologic severity of cellular AR has been associated with inferior death-censored graft survival.8 Vascular AR in particular has been strongly associated with premature graft failure8 and histologically with premature development of chronic allograft nephropathy (CAN) in subsequent protocol biopsies.9 Antibody-mediated rejection (AMR), particularly when vascular involvement is evident, incurs a high risk of graft failure over the ensuing 5 years.10 We have previously reported that patients with vascular AR exhibited lower eGFR and were twice as likely as those without AR to incur graft loss between 6 months and 5 years after transplant, whereas those with AR without a vascular component were also at significantly increased risk, albeit to a lesser extent.3 Causes of increased graft loss subsequent to AR were not determined in that study; however, the finding that mean serum creatinine at 12 months post-transplant was significantly higher among those with versus without AR suggested a degree of graft injury that may predispose to CAN.3,10 A growing body of evidence also suggests that cellular AR may be an antecedent of donor-specific antibody development and subsequent AMR.11,12 Treatment for AR with high-dose steroids and/or lymphocyte-depleting antibodies incurs an increased risk of sepsis and cancer, potentially leading to death with a functioning graft.6 Inferior graft function, proteinuria, and increased immunosuppression may also heighten cardiovascular risk, thereby predisposing affected recipients to cardiovascular morbidity and mortality.13
We therefore tested the hypothesis that AR is associated with increased risks of long-term graft failure and death by undertaking a cause-specific survival analysis using data obtained from the Australia and New Zealand Dialysis and Transplant Registry (ANZDATA), including up to 20 years of patient follow-up. We hereby demonstrate that AR is associated with both an increased risk of late graft loss and an increased risk of premature death.
Methods
We used data from the ANZDATA, which collects data on consenting (>99%) patients receiving RRT in Australia and New Zealand. Its methods are described in more detail at its website (http://www.anzdata.org.au). In April 1997, ANZDATA began collecting data on rejection episodes within the first 6 months post-transplant. Rejection data includes whether a biopsy was performed, rejection severity, treatment used, and response to treatment. In October 2003, ANZDATA began collecting data on all rejection episodes (not just in the first 6 months), and in 2005 a specific question about AMR was added to the form.
We included all primary kidney-only transplants performed between April 1997 and June 2017. Follow-up was until patient death, loss to follow-up, or December 31, 2017. Graft loss was defined as permanent return to dialysis, retransplantation, or death with a functioning graft. Causes of graft loss were categorized as death with a functioning graft, AR, CAN (defined by ANZDATA as “slow progressive loss of renal function, not due to recurrent original disease or acute rejection”), GN, technical (vascular and ureteric complications), and other causes. Cumulative incidence plots of cause-specific graft loss were constructed from univariate models accounting for the relevant competing risks.
We then categorized the transplants according to whether they experienced one or more episodes of AR during the first 6 months post-transplant, and therefore excluded transplants with <6 months follow-up. Rejection episodes that were biopsy-proven were categorized as having (1) no vascular or antibody mediated component, (2) vascular rejection, (3) AMR, or (4) both vascular and AMR. Because AMR was only collected from 2005, we considered rejection episodes with glomerulitis to represent AMR. To avoid misclassifying recurrent GN as AMR, patients with GN as their primary renal disease were excluded from analyses of AMR. Complete resolution of the rejection episode was defined as return of graft function to prerejection levels or better.
Baseline data were compared using Wilcoxon signed-rank test for continuous data and Pearson chi-squared for categorical data. The Kaplan–Meier method was used to estimate unadjusted patient and graft survival. Time to graft loss from each of the causes listed above (with technical incorporated into “other”) was studied using a Cox proportional hazards model for each cause, with graft losses due to the other causes being censored. Adjusted models included rejection status and were adjusted for patient age, sex, race, primary renal disease, comorbidities at the time of transplant (diabetes, coronary artery disease, cerebrovascular disease, peripheral vascular disease, chronic lung disease), donor type (living or deceased), donor age, HLA mismatch, peak panel-reactive antibody, era (1997–2002, 2003–2007, 2008–2012, 2013–2017), and the presence or absence of delayed graft function (defined as no immediate function, with the need for dialysis within 72 hours of transplantation). These covariates were included in the models empirically on the basis of known associations with patient and/or graft survival. Because of very low rates of missing data, complete case analysis was performed.
Causes of death were categorized as cardiovascular, infection, social, cancer, or other causes. Time to death overall and from each of these five causes was analyzed in the same way as described for graft loss. These analyses were not censored at graft failure.
GFR post-transplant was estimated using the four-variable Modification of Diet in Renal Disease Study equation.14 The difference between eGFR in the rejection and nonrejection groups was tested using linear mixed models with a random effect for each patient and a crossed fixed effect for rejection status. All P values reported are two-tailed, with P<0.05 considered statistically significant. No adjustments were made for multiple analyses. All analyses were conducted using Stata/IC 15.1 (StataCorp., College Station, TX).
Results
During the study period, 14,241 primary kidney-only transplant operations were performed in Australia and New Zealand. The long-term outcomes of those transplants are shown in Supplemental Figure 1, which demonstrates the strikingly constant rates of both death with function and graft loss attributed to CAN, becoming the two dominant causes of transplant failure beyond the first post-transplant year.
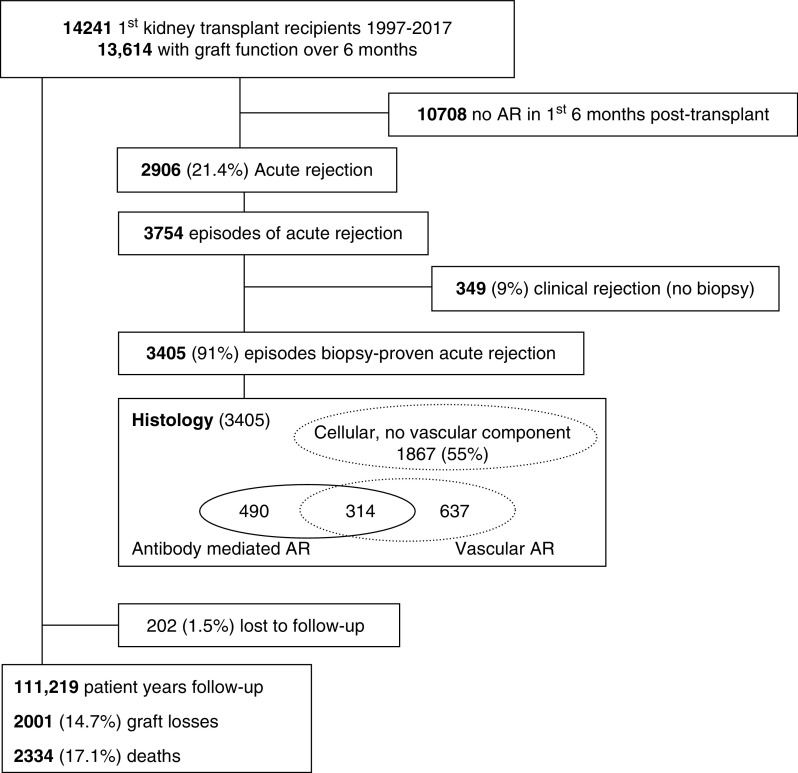
Of the 14,241 transplants, graft function was maintained beyond 6 months in 13,614 patients who were included in the remaining analyses, with a total follow-up of 111,219 patient-years (Figure 1). A total of 202 patients (1.5%) were lost to follow-up after a median of 6.0 years, and 2906 patients (21.4%) were reported as incurring AR during the first 6 months post-transplant. Baseline demographic and clinical characteristics indicate that those with versus without AR were similar in terms of age, sex, race, primary kidney disease, and comorbid profile, but had a higher panel-reactive antibody score, a higher degree of HLA mismatch, and were more likely to have been transplanted in an earlier era (Table 1). Patients who experienced AR were less likely to receive tacrolimus at baseline, but more likely to receive it at 6 months. Delayed graft function was observed in 593 (20.5%) patients with AR compared with 1548 (14.7%) of those without.
Figure 1.
Patient flow.
Table 1.
Baseline characteristics of included patients
| Characteristic | No Rejection by 6 Mo | Rejection by 6 Mo | P Value |
|---|---|---|---|
| N | 10,708 | 2906 | |
| Age at transplant, median (IQR) | 49.0 (37.0–59.0) | 47.0 (35.0–57.0) | <0.001 |
| Male sex | 6664 (62.2%) | 1896 (65.2%) | 0.003 |
| Ethnicity | <0.001 | ||
| White | 8286 (78.1%) | 2326 (80.5%) | |
| Aboriginal/Torres Strait Islander | 319 (3.0%) | 109 (3.8%) | |
| Asian | 1183 (11.2%) | 244 (8.4%) | |
| Māori | 281 (2.6%) | 76 (2.6%) | |
| Pacific | 303 (2.9%) | 78 (2.7%) | |
| Other | 236 (2.2%) | 58 (2.0%) | |
| Primary renal disease | <0.001 | ||
| GN | 4633 (43.5%) | 1353 (46.6%) | |
| Polycystic | 1623 (15.2%) | 373 (12.9%) | |
| Reflux | 855 (8.0%) | 267 (9.2%) | |
| Hypertension | 614 (5.8%) | 166 (5.7%) | |
| Diabetes | 1111 (10.4%) | 322 (11.1%) | |
| Other | 1822 (17.1%) | 421 (14.5%) | |
| Diabetes | 1622 (15.2%) | 454 (15.7%) | 0.52 |
| Coronary disease | 1589 (14.9%) | 415 (14.3%) | 0.45 |
| Cerebrovascular disease | 531 (5.0%) | 119 (4.1%) | 0.05 |
| Peripheral vascular disease | 803 (7.5%) | 226 (7.8%) | 0.61 |
| Chronic lung disease | 697 (6.5%) | 193 (6.7%) | 0.79 |
| Deceased donor | 6574 (61.4%) | 1730 (59.5%) | 0.07 |
| Donor age, median (IQR) | 48.0 (36.0–57.0) | 49.0 (38.0–58.0) | <0.001 |
| HLA mismatch | <0.001 | ||
| 0–2 | 3860 (36.6%) | 766 (26.6%) | |
| 3–4 | 3724 (35.3%) | 1100 (38.3%) | |
| 5–6 | 2961 (28.1%) | 1009 (35.1%) | |
| Peak PRA (%) | <0.001 | ||
| 0–19 | 8933 (85.7%) | 2344 (82.4%) | |
| 20–49 | 789 (7.6%) | 248 (8.7%) | |
| 50–79 | 362 (3.5%) | 134 (4.7%) | |
| 80–100 | 336 (3.2%) | 117 (4.1%) | |
| Era | <0.001 | ||
| 1997–2002 | 2019 (18.9%) | 906 (31.2%) | |
| 2003–2007 | 2232 (20.8%) | 584 (20.1%) | |
| 2008–2012 | 3125 (29.2%) | 679 (23.4%) | |
| 2013–2017 | 3332 (31.1%) | 737 (25.4%) | |
| Antibody induction | <0.001 | ||
| Neither | 3071 (28.7%) | 1251 (43.0%) | |
| Anti-CD25 | 7190 (67.1%) | 1565 (53.9%) | |
| T cell depletion | 256 (2.4%) | 57 (2.0%) | |
| Both | 191 (1.8%) | 33 (1.1%) | |
| Immunosuppression at baseline | <0.001 | ||
| Pred/Tac/MMF | 5976 (55.8%) | 1360 (46.8%) | |
| Pred/CsA/MMF | 3416 (31.9%) | 1063 (36.6%) | |
| Pred/CsA/Aza | 287 (2.7%) | 135 (4.6%) | |
| mTORi based | 366 (3.4%) | 119 (4.1%) | |
| Other | 663 (6.2%) | 229 (7.9%) | |
| Immunosuppression at 6 mo | <0.001 | ||
| Pred/Tac/MMF | 5649 (52.8%) | 1795 (61.8%) | |
| Pred/CsA/MMF | 2860 (26.7%) | 506 (17.4%) | |
| Pred/CsA/Aza | 280 (2.6%) | 83 (2.9%) | |
| mTORi based | 568 (5.3%) | 146 (5.0%) | |
| Other | 1351 (12.6%) | 376 (12.9%) | |
| Delayed graft function | 1548 (14.7%) | 593 (20.5%) | <0.001 |
All characteristics were missing in <1% of the population apart from HLA mismatch (1.4%), peak PRA (2.6%), and delayed graft function (1.4%). IQR, interquartile range; PRA, panel-reactive antibody; Pred, prednisolone; Tac, tacrolimus; MMF, mycophenolate; CsA, cyclosporin; Aza, azathioprine; mTORi, mammalian target of rapamycin (mTOR) inhibitor.
Among the 2906 patients diagnosed with AR, 3754 discrete episodes were reported, of which 3405 (91%) were biopsy proven. Episodes were coded as (1) cellular without a vascular or glomerular component (n=1867, 55%), (2) vascular (n=951, 28%), or antibody mediated (n=804, 24%) (Figure 1). Pulse steroids were the most commonly reported therapy, used in 2344 (62%) participants; 794 (21%) received lymphocyte-depleting antibodies; 543 (15%) received other therapies, including IVIG, plasmapheresis, and/or rituximab; and no therapy was reported for 73 (2%) participants. Response to treatment was (1) resolution (n=2721, 73%), as defined by return of creatinine to prerejection levels or better; (2) resolution of rejection episode but with some loss of function (n=985, 26%); or (3) rejection unable to be resolved (n=9, 0.2%).
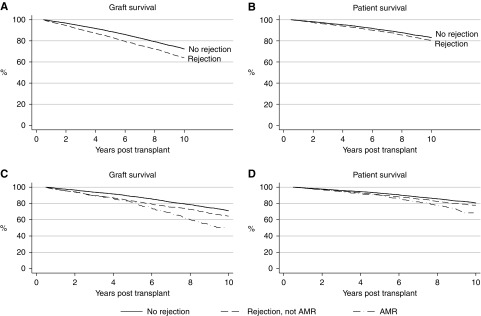
During follow-up there were 2001 (14.7%) graft losses and 2334 (17.1%) deaths. The specific causes of graft loss and death are shown in Table 2. Five-year graft survival (not censored for death) was 87% (95% confidence interval [95% CI], 87% to 88%) and 5-year patient survival was 93% (95% CI, 93 to 94). Unadjusted graft and patient survival were both inferior in those with AR (Figure 2).
Table 2.
Causes of graft loss and death
| N (%) | |
|---|---|
| Cause of Graft Loss | |
| Death with function | 1660 (45%) |
| AR | 227 (6%) |
| CAN | 1310 (36%) |
| GN | 189 (5%) |
| Other | 247 (7%) |
| Not reported | 28 (<1%) |
| Total | 3633 |
| Cause of death | |
| Cardiovascular | 770 (33%) |
| Infection | 354 (15%) |
| Sociala | 286 (12%) |
| Malignancy | 563 (24%) |
| Other | 347 (15%) |
| Not reported | 14 (<1%) |
| Total | 2320 |
Social causes of death include withdrawal due to cardiovascular disease (29%), withdrawal due to malignancy (13%), and withdrawal for psychosocial reasons (29%); 63% of social deaths occurred after graft failure.
Figure 2.
Graft and patient survival were worse in those who experienced rejection in the first 6 months post-transplant, particularly for those who experienced AMR. P<0.001 for all graphs.
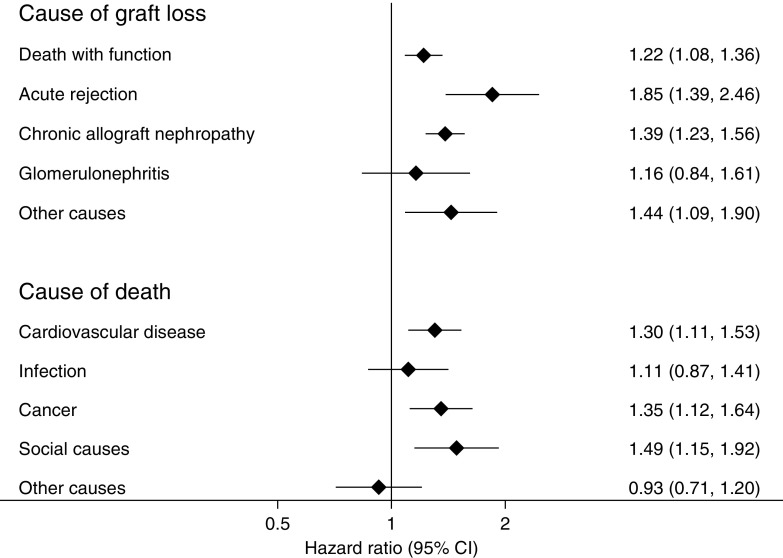
Cox proportional hazards models, adjusted for baseline donor, recipient, and transplant characteristics, demonstrated a significant excess of graft loss for those with versus without any episode of AR from death with function (hazard ratio [HR], 1.22; 95% CI, 1.08 to 1.36) (Figure 3). Those with versus without AR were also more likely to incur death-censored graft loss, attributed to AR (HR, 1.85; 95% CI, 1.39 to 2.46) and CAN (HR, 1.39; 95% CI, 1.23 to 1.56), with no increase in loss due to recurrent GN. Overall patient survival was also lower in those with AR, largely attributable to an excess of deaths from cardiovascular disease or cancer (Figure 4). An excess of death attributed to “social” causes was also evident, including withdrawal from care, accidents, and suicides, 63% of which occurred after graft failure (Figure 3, Table 2).
Figure 3.
Graft losses and death from most causes were increased in those who experienced rejection. The figure shows the adjusted associations between rejection in the first 6 months post-transplant and subsequent cause-specific graft loss and cause-specific death. All models are adjusted for patient and donor characteristics, baseline immunologic risk, transplant era, and delayed graft function.
Figure 4.
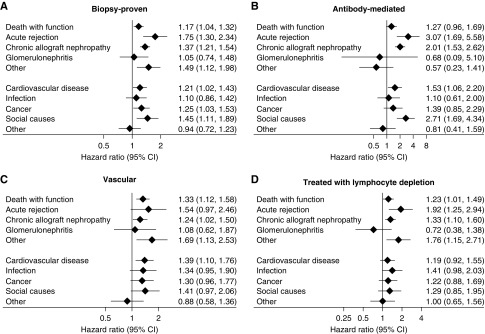
Associations between rejection and outcomes were similar across different rejection subtypes. The figure shows the adjusted associations between different subtypes of rejection and subsequent outcomes. All models are adjusted for patient and donor characteristics, baseline immunologic risk, transplant era, and delayed graft function and as described in the text.
Vascular AR is typically treated more aggressively than nonvascular rejection and may incur greater risks of both permanent graft damage and treatment-emergent adverse effects.3,6,8–10 Restriction of the analysis to those with vascular AR (n=951, 28% of all biopsy-proven acute rejection [BPAR]) yielded similar outcomes to those experiencing any AR, with higher risks of death with function, attributed to cardiovascular disease, cancer, or infection, and graft loss from recurrent AR and CAN (Figure 4).
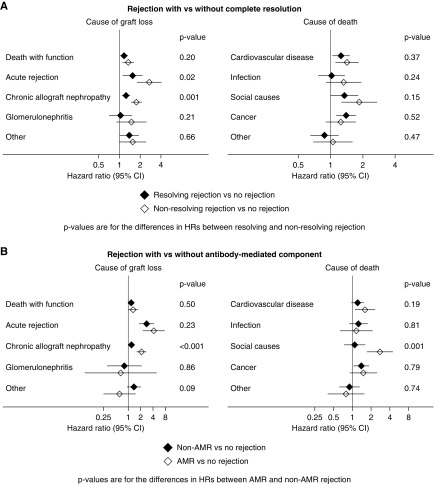
AMR is well recognized as a common mediator of late death-censored graft failure.10,15 Of all biopsy-proven episodes of AR during the first 6 months after transplantation, 804 (24% of all episodes of BPAR) were reported to fulfill criteria for AMR. Incidence of AMR was associated with female recipient status, higher degrees of HLA mismatch and panel-reactive antibody percentage, deceased donor recipients, and delayed graft function. Long-term outcomes for those with AMR were similar to those seen after any AR (Figure 4). As compared with recipients without AR, those with AMR were more likely to experience graft loss attributed to CAN by two-fold and recurrent AR by three-fold (Figure 4). In comparison to those with AR without evidence of AMR, those with AMR experienced progressively higher rates of both graft loss and death over time, becoming evident beyond 5 years post-transplant (Figure 2). The key drivers of this were graft loss from CAN (P<0.001) and death from social causes (P=0.001) (Figure 5).
Figure 5.
Rejection without complete resolution, or with an antibody-mediated component, was associated with more graft loss from chronic allograft nephropathy. The figure shows the adjusted associations between rejection in the first 6 months post-transplant and subsequent outcomes, stratified by (A) whether the rejection completely resolved (defined as the return of graft function to prerejection levels or better) and (B) whether AMR was present or not. P values are for the differences in subhazard ratios between resolving and nonresolving rejection.
Sensitivity analyses restricted to those with AR treated with lymphocyte-depleting antibodies versus not (Figure 4), BPAR versus not (Figure 4), and AR with failure to achieve resolution versus not (Figure 5), showed similar patterns to the primary analysis, with graft loss attributed to CAN or AR particularly prominent among those with AR with failure to achieve resolution.
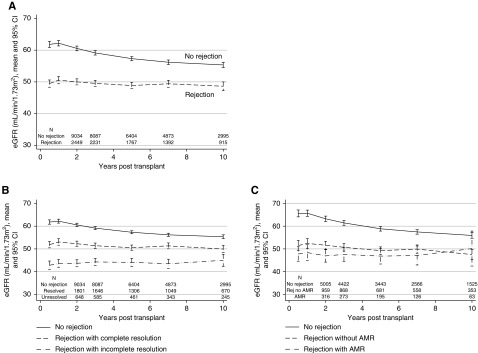
As reported previously at 5 years post-transplant,3 eGFR was inferior in the AR group at all time points post-transplant, with mean difference ranging from 7 to 12 ml/min per 1.73 m2 from month 6 to year 10 post-transplant (Figure 6; P<0.001). Stratification by type of rejection demonstrated significantly lower mean eGFR for those with AMR (Figure 6). Stratification by response to treatment showed that an incomplete response to antirejection therapy was also associated with inferior eGFR as compared with those who did initially respond to therapy; however, even those with a good initial response exhibited inferior eGFR in the longer term as compared with those who were free from rejection (Figure 6).
Figure 6.
Kidney function was worse in those who experienced rejection, especially rejection that didn't completely resolve. The figure shows the eGFR in those with and without rejection in the first 6 months post-transplant: (A) any AR versus not, and (B) AMR versus AR excluding AMR versus no AR, and (C) treatment responsive (return to within 10% of baseline serum creatinine) versus not. eGFR was only calculated in those patients with functioning grafts at each timepoint. P<0.001 for all comparisons apart from panel 3C rejection with versus without AMR (P=0.88).
Discussion
AR remains a significant cause of graft loss during the first year after transplantation; however, the proportion of grafts that fail during this period has declined over time.3,4 Previous studies had demonstrated associations between early AR and increased rates of transplant dysfunction and failure over the subsequent 2–5 years.3,8,10,12,16,17 Treatment of AR has also been associated with increased risks of sepsis and cancer.6,18 This study adds to this literature by demonstrating robust associations between AR and long-term graft loss, mediated by increased risks of both death with function and death-censored graft failure.
Those with AR incurred an excess of death attributed to cardiovascular disease and cancer. Both appear to be biologically plausible. Lower eGFR and albuminuria are recognized as independent risk factors for all-cause and cardiovascular mortality in the general19 and kidney transplant13 populations and both may occur consequent to AR. The intensity of immunosuppression may affect both cardiovascular risk, through mechanisms including development of new-onset diabetes, hypertension, dyslipidemia, renal impairment and proteinuria,9,20–22 and cancer risk.18,23 Further work exploring the association of rejection with cardiovascular deaths would need to include more granular data than is currently collected by ANZDATA. Somewhat surprisingly, AR treated with lymphocyte depleting antibodies was not significantly associated with death due to cancer. This may reflect a lack of statistical power, or potentially loss caused by competing outcomes, including infection, cardiovascular disease, and CAN.
Late-onset AR (occurring beyond the first 6 months after transplantation) has long been known to be associated with increased risk of graft loss.18,19 Late onset of chronic AMR in particular has been strongly associated with graft loss15 and effective therapies are currently lacking.24 Late AR causing graft loss was significantly more frequent among those with than without AR in this study. This is not surprising but may be important in considering the management of patients after an episode of AR. Our data has demonstrated excess risks of death due to cardiovascular disease and cancer after AR and the greater burden of immunosuppression administered to such patients may have a causal role. However, any reduction in immunosuppression to curb death risk may incur increased risk of late AR. Defining the optimal approach here is important but will not be simple. Post-treatment biopsy has been advocated to detect cases with residual inflammation warranting further intensification of therapy.12 Understanding the potential contribution of nonadherence25 and variability in drug exposure26,27 in this context may be critical, as both may contribute to the development of AR both early and late after transplantation. Previously documented associations between nonadherence and AMR in particular are noteworthy,25 given that AMR was associated with the highest risk of graft failure due to recurrent AR in this study.
As a registry analysis, several limitations should be borne in mind when interpreting the results of this study. Although ANZDATA uses rigorous internal quality control procedures, as with any registry data there is risk of misclassification and underreporting. Risks of misclassification exist for causes of graft loss and death. Over 90% of episodes of AR reported to the registry are biopsy proven3; however, as the coding of AR used by the registry has not been assessed for interobserver consistency, risk of misclassification is also relevant here. Detailed biopsy data (e.g., Banff scores) is not consistently reported. Coding for antibody mediated AR was added to the registry only from 2005 and before that time we coded any biopsy that showed glomerulitis as indicating AMR, after excluding all patients with GN as their cause of ESKD. This may also have led to attribution errors. The Registry also does not currently collect donor-specific antibody status. Furthermore we were not able to separate acute from chronic AMR; however, as our focus was on AR diagnosed during the first 6 months after transplantation, the bulk of AMR episodes were likely to have been acute. The reason for choice of particular treatments of AR is not collected, and the response to treatment data have not been validated. Registry data are by nature observational, and associations reported should not be interpreted as causal. Our analyses were subjected to multiple sensitivity analyses and although these confirmed the primary analyses, the variables included in our models were restricted to those captured by the registry, and as such, we cannot exclude the possibility of unmeasured confounders. Finally, the study was restricted to Australia and New Zealand where the majority of patients are white and do not receive lymphocyte-depleting induction therapy, but do receive a calcineurin inhibitor, an antiproliferative drug, and low-dose steroids throughout maintenance phase,28 and such features may differ from other regions of the world.
In conclusion, this study has revealed the adverse long-term consequences associated with AR that occurs within the first 6 months after kidney transplantation. AR was associated with significant increases in risk of both death with function and graft loss due to CAN, the leading causes of transplant failure in the current era. The associations noted were strongest for those with AMR and for those where initial therapy failed to enable return to baseline serum creatinine. Despite the decline in both the incidence of AR and the incidence of early graft loss directly caused by AR, these data highlight the importance of AR as a pivotal early event after transplantation with long-lasting consequences. Prevention of AR should therefore remain a priority in patient management and an important outcome to be captured in clinical trials.
Disclosures
Prof. McDonald reports grants from Australian Organ and Tissue Donation and Transplantation Authority, grants from National Health and Medical Research Council, grants from New Zealand Ministry of Health, during the conduct of the study. Prof. Chadban reports personal fees from Novartis, Amgen, Vitaeris, grants from Novartis, Vitaeris, Astellas, outside the submitted work. All of the remaining authors have nothing to disclose.
Funding
The Registry is funded by the Australian Organ and Tissue Donation and Transplantation Authority, the New Zealand Ministry of Health, and Kidney Health Australia. Dr. Clayton is supported by the Better Evidence and Translation in CKD (BEAT-CKD) program grant (Australian National Health and Medical Research Council) and a Jacquot Research Establishment Award (Royal Australasian College of Physicians).
Supplementary Material
Acknowledgments
We are grateful to the Australian and New Zealand renal units, patients, and staff for their cooperation and contributions to the Australia and New Zealand Dialysis and Transplant Registry (ANZDATA).
Dr. Clayton designed the study, performed the analyses and wrote the paper. Prof. Chadban conceived the study and wrote the paper. All authors interpreted the data, revised the manuscript for important intellectual content, and approved the manuscript for publication.
The data reported here were supplied by the ANZDATA. The interpretation and reporting of these data are the responsibility of the authors and in no way should be seen as an official policy or interpretation of the Australia and New Zealand Dialysis and Transplant Registry.
Footnotes
Published online ahead of print. Publication date available at www.jasn.org.
Supplemental Material
This article contains the following supplemental material online at http://jasn.asnjournals.org/lookup/suppl/doi:10.1681/ASN.2018111101/-/DCSupplemental.
Supplemental Figure 1. Causes of transplant failure. All primary kidney-only transplants performed in Australia and New Zealand between 1997 and 2017 (n=14,241).
References
- 1.Organ Procurement and Transplantation Network (OPTN) and Scientific Registry of Transplant Recipients : (SRTR). OPTN/SRTR 2011 Annual Data Report, Rockville, MD, Department of Health and Human Services, Health Resources and Services Administration, Healthcare Systems Bureau, Division of Transplantation, 2012 [Google Scholar]
- 2.Australia and New Zealand Dialysis and Transplant Registry: 39th Annual Report, Chapter 8, Transplantation. Australia and New Zealand Dialysis and Transplant Registry, Adelaide, Australia, 2016 [Google Scholar]
- 3.McDonald S, Russ G, Campbell S, Chadban S: Kidney transplant rejection in Australia and New Zealand: Relationships between rejection and graft outcome. Am J Transplant 7: 1201–1208, 2007 [DOI] [PubMed] [Google Scholar]
- 4.Meier-Kriesche HU, Schold JD, Srinivas TR, Kaplan B: Lack of improvement in renal allograft survival despite a marked decrease in acute rejection rates over the most recent era. Am J Transplant 4: 378–383, 2004 [DOI] [PubMed] [Google Scholar]
- 5.OʼConnell PJ, Kuypers DR, Mannon RB, Abecassis M, Chadban SJ, Gill JS, et al.: Clinical trials for immunosuppression in transplantation: The case for reform and change in direction. Transplantation 101: 1527–1534, 2017 [DOI] [PubMed] [Google Scholar]
- 6.Jamil B, Nicholls K, Becker GJ, Walker RG: Impact of acute rejection therapy on infections and malignancies in renal transplant recipients. Transplantation 68: 1597–1603, 1999 [DOI] [PubMed] [Google Scholar]
- 7.Gheorghian A, Schnitzler MA, Axelrod DA, Kalsekar A, L’italien G, Lentine KL: The implications of acute rejection and reduced allograft function on health care expenditures in contemporary US kidney transplantation. Transplantation 94: 241–249, 2012 [DOI] [PubMed] [Google Scholar]
- 8.Wu K, Budde K, Lu H, Schmidt D, Liefeldt L, Glander P, et al.: The severity of acute cellular rejection defined by Banff classification is associated with kidney allograft outcomes. Transplantation 97: 1146–1154, 2014 [DOI] [PubMed] [Google Scholar]
- 9.Nankivell BJ, Borrows RJ, Fung CL, O’Connell PJ, Allen RD, Chapman JR: The natural history of chronic allograft nephropathy. N Engl J Med 349: 2326–2333, 2003 [DOI] [PubMed] [Google Scholar]
- 10.Lefaucheur C, Loupy A, Vernerey D, Duong-Van-Huyen J-P, Suberbielle C, Anglicheau D, et al.: Antibody-mediated vascular rejection of kidney allografts: A population-based study. Lancet 381: 313–319, 2013 [DOI] [PubMed] [Google Scholar]
- 11.Moreso F, Carrera M, Goma M, Hueso M, Sellares J, Martorell J, et al.: Early subclinical rejection as a risk factor for late chronic humoral rejection. Transplantation 93: 41–46, 2012 [DOI] [PubMed] [Google Scholar]
- 12.El Ters M, Grande JP, Keddis MT, Rodrigo E, Chopra B, Dean PG, et al.: Kidney allograft survival after acute rejection, the value of follow-up biopsies. Am J Transplant 13: 2334–2341, 2013 [DOI] [PubMed] [Google Scholar]
- 13.Meier-Kriesche HU, Baliga R, Kaplan B: Decreased renal function is a strong risk factor for cardiovascular death after renal transplantation. Transplantation 75: 1291–1295, 2003 [DOI] [PubMed] [Google Scholar]
- 14.Levey A, Greene T, Kusek J, Beck G: A simplified equation to predict glomerular filtration rate from serum creatinine [Abstract]. J Am Soc Nephrol 11: 155A, 2000 [Google Scholar]
- 15.Halloran PF, Chang J, Famulski K, Hidalgo LG, Salazar ID, Merino Lopez M, et al.: Disappearance of T cell-mediated rejection despite continued antibody-mediated rejection in late kidney transplant recipients. J Am Soc Nephrol 26: 1711–1720, 2015 [DOI] [PMC free article] [PubMed] [Google Scholar]
- 16.Basadonna GP, Matas AJ, Gillingham KJ, Payne WD, Dunn DL, Sutherland DE, et al.: Early versus late acute renal allograft rejection: Impact on chronic rejection. Transplantation 55: 993–995, 1993 [DOI] [PubMed] [Google Scholar]
- 17.Joseph JT, Kingsmore DB, Junor BJ, Briggs JD, Mun Woo Y, Jaques BC, et al.: The impact of late acute rejection after cadaveric kidney transplantation. Clin Transplant 15: 221–227, 2001 [DOI] [PubMed] [Google Scholar]
- 18.Lim WH, Turner RM, Chapman JR, Ma MK, Webster AC, Craig JC, et al.: Acute rejection, T-cell-depleting antibodies, and cancer after transplantation. Transplantation 97: 817–825, 2014 [DOI] [PubMed] [Google Scholar]
- 19.Hallan SI, Matsushita K, Sang Y, Mahmoodi BK, Black C, Ishani A, et al. ; Chronic Kidney Disease Prognosis Consortium : Age and association of kidney measures with mortality and end-stage renal disease. JAMA 308: 2349–2360, 2012 [DOI] [PMC free article] [PubMed] [Google Scholar]
- 20.Vincenti F, Friman S, Scheuermann E, Rostaing L, Jenssen T, Campistol JM, et al. ; DIRECT (Diabetes Incidence after Renal Transplantation: Neoral C Monitoring Versus Tacrolimus) Investigators : Results of an international, randomized trial comparing glucose metabolism disorders and outcome with cyclosporine versus tacrolimus. Am J Transplant 7: 1506–1514, 2007 [DOI] [PubMed] [Google Scholar]
- 21.Israni AK, Snyder JJ, Skeans MA, Peng Y, Maclean JR, Weinhandl ED, et al. ; PORT Investigators : Predicting coronary heart disease after kidney transplantation: Patient Outcomes in Renal Transplantation (PORT) study. Am J Transplant 10: 338–353, 2010 [DOI] [PubMed] [Google Scholar]
- 22.Wong W, Tolkoff-Rubin N, Delmonico FL, Cardarelli F, Saidman SL, Farrell ML, et al.: Analysis of the cardiovascular risk profile in stable kidney transplant recipients after 50% cyclosporine reduction. Clin Transplant 18: 341–348, 2004 [DOI] [PubMed] [Google Scholar]
- 23.Yanik E, Clarke CA, Snyder JJ, Pfeiffer RM, Engels EA: Variation in cancer incidence among patients with ESRD during kidney function and nonfunction intervals. J Am Soc Nephrol 27: 1495–1504, 2016 [DOI] [PMC free article] [PubMed] [Google Scholar]
- 24.Wan SS, Ying TD, Wyburn K, Roberts DM, Wyld M, Chadban SJ: The treatment of antibody-mediated rejection in kidney transplantation: An updated systematic review and meta-analysis. Transplantation 102: 557–568, 2018 [DOI] [PubMed] [Google Scholar]
- 25.Sellarés J, de Freitas DG, Mengel M, Reeve J, Einecke G, Sis B, et al. : Understanding the causes of kidney transplant failure: The dominant role of antibody-mediated rejection and nonadherence. Am J Transplant 12: 388–399, 2012 [DOI] [PubMed] [Google Scholar]
- 26.Sapir-Pichhadze R, Wang Y, Famure O, Li Y, Kim SJ: Time-dependent variability in tacrolimus trough blood levels is a risk factor for late kidney transplant failure. Kidney Int 85: 1404–1411, 2014 [DOI] [PubMed] [Google Scholar]
- 27.Sablik KA, Clahsen-van Groningen MC, Hesselink DA, van Gelder T, Betjes MGH: Tacrolimus intra-patient variability is not associated with chronic active antibody mediated rejection. PLoS One 13: e0196552, 2018 [DOI] [PMC free article] [PubMed] [Google Scholar]
- 28.Chang SH, Russ GR, Chadban SJ, Campbell SB, McDonald SP: Trends in kidney transplantation in Australia and New Zealand, 1993-2004. Transplantation 84: 611–618, 2007 [DOI] [PubMed] [Google Scholar]
Associated Data
This section collects any data citations, data availability statements, or supplementary materials included in this article.


