Abstract
We assess the stability of two previously suggested binding modes for the neuropeptide orexin-A in the OX2 receptor through extensive molecular dynamics simulations. As the activation determinants of the receptor remain unknown, we simulated an unliganded receptor and two small-molecular ligands, the antagonist suvorexant and the agonist Nag26 for comparison. Each system was simulated in pure POPC membrane as well as in the 25% cholesterol–POPC membrane. In total, we carried out 36 μs of simulations. Through this set of simulations, we report a stable binding mode for the C-terminus of orexin-A. In addition, we suggest interactions that would promote orexin receptor activation, as well as others that would stabilize the inactive state.
Introduction
Orexin System. Peptide Binding
The orexin receptors are key regulators in several neurological processes. The main physiological role of the orexinergic system is the regulation of sleep, and it also plays a role in energy homeostasis and the reward system.1 Orexin receptors are prominent drug targets for novel hypnotics,2,3 and hopefully, in the future, narcolepsy could be alleviated through orexin receptor activation.4,5 Orexin receptors are also putative targets for cancer treatment, as orexinergic signaling directs certain cancer cell lines to apoptosis.6 However, the treatment of both narcolepsy and cancer through orexin receptors would require agonistic ligands, whereas the pharmaceutical industry has concentrated on antagonists. A few potent small-molecular agonists have been reported and characterized,7−9 but the poor understanding of the receptor activation determinants hampers the search for new agonists.
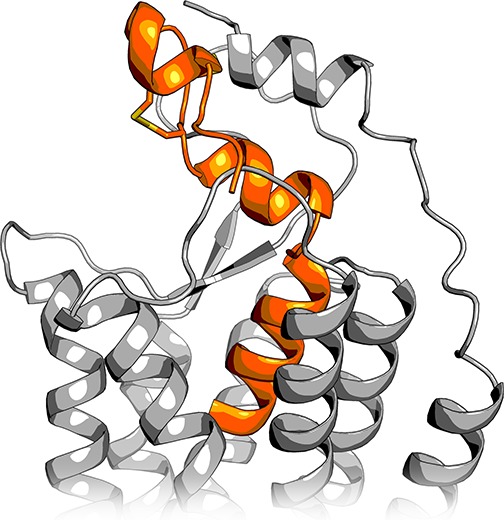
The orexinergic system comprises two peptide ligands, orexin-A and -B, and two G protein-coupled receptors (GPCR) OX1 and OX2.10 In aqueous solution, the orexin peptides adopt conformations comprising helical segments I and II (and III for orexin-A), with a structural hinge motif between the helices I and II (Figure 1).11−13 Orexin-B, which is a linear 28-amino-acid amidated peptide, shows a 90° bend between the helices I and II, at N20–A22, i.e., 1.5 turns from the C-terminal. Orexin-A, a 33-amino-acid amidated peptide with two intramolecular disulfide bridges, is often observed with a similar bend at A23–N25, half a turn further from the C-terminus, resulting in bending in the opposite direction in comparison to orexin-B (Figure 1). In addition to the bent conformations, orexin-A appears in some NMR-models in a straight α-helical conformation, except for the disulfide-bridge-stabilized hook at the N-terminus. For orexin-B, such conformation has not been reported.
Figure 1.
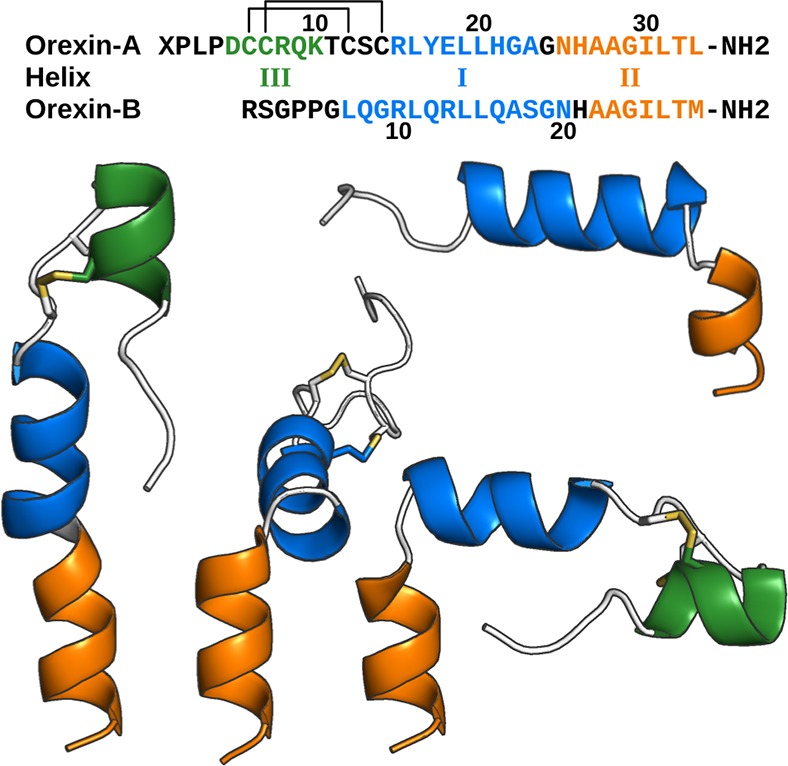
Orexin peptides. Sequences are colored consistently with the figures. X: Pyroglutamoyl; lines denote disulfide bonds. For orexin-B (top right), one conformation has been published,13 while for orexin-A, three conformations have been observed.11,12
Site-directed mutagenesis (SDM) on both receptor subtypes and both peptides has highlighted several key residues for peptide–receptor interaction.14−20 The most notable observations is that the C-terminus of both orexin peptides is vital for bioactivity, whereas the N-terminus can be mutated or even deleted without the loss of activity, which has given rise to the assumption that the C-terminus enters the canonical class A GPCR binding cavity. With this information, molecular modelers have provided few suggestions on the binding mode for the orexin peptides,21,22 with the assumption that the C-terminus binds in the α-helical conformation observed in solution, but validation of these suggestions has been challenging. Recently, we suggested that orexin peptides locked in an α-helical conformation can indeed activate the orexin receptors,23 but as the method included an introduction of a bulky hydrocarbon linker between two helical turns and severely impaired the peptide’s potency, no firm conclusions could be drawn.
GPCR Activation. Simulations of GPCRs
GPCR activation is a process where ligand binding stabilizes a receptor conformation that allows for G protein (or other effector protein) binding, activation and downstream signaling.24 As GPCR ligands differ greatly, also the key interactions at the binding site must differ. Among the class A GPCRs, the activation cascade that links events at the binding site with the intracellular G protein binding site appears to converge into defined interaction patterns,25 and large-scale movements such as the outswing of the TM6 (the sixth transmembrane helix), which opens up the G protein binding site.26
Molecular dynamics (MD) simulations have shed light on different parts of the receptor function, such as ligand binding, receptor transitions both between and within active and inactive states, and allosteric modulation.27 The opening of the G protein binding site has not been observed in classical MD simulations reaching up to tens of microseconds, but the reverse event has been reported.28 In contrast, the binding site and the so-called core triad can adopt activelike conformations within a microsecond-scale simulation.28
In the present study, we set out to simulate the OX2 receptor with two previously reported alternative orexin-A binding modes,21 a small molecular agonist Nag267 and a small molecular antagonist suvorexant.2 In addition, we simulated an unliganded receptor. Our main point of interest was the ligand binding interactions and their stability. As our simulations did not include G proteins or mimetics thereof, we anticipated that the transition of the receptor into its active state was likely beyond our reach, but we hoped to observe such differences between the ligands that could indicate key interactions for agonism.
Methods
Overview
We carried out and analyzed a total of 36 μs of molecular dynamics simulations. We simulated OX2 receptor without a ligand, with small molecules suvorexant and Nag26 and with two alternative binding modes of orexin-A. Each simulation was run both in a pure POPC (1-palmitoyl-2-oleoylphosphatidylcholine) membrane and in a POPC−cholesterol (25%) membrane for 3 μs. For Nag26 and orexin-A simulations, we also produced 1 μs replicas. The simulation conditions are summarized in the Table 1, and the simulations are referred to by their numbers thereafter. For the system setup and analysis we employed Gromacs 5.1,29 and for the MD simulations Gromacs 4.6.7.30
Table 1. Molecular Dynamics Simulations.
| sim. | ligand | membrane | length (μs) |
|---|---|---|---|
| 1 | orexin-A, TM5 | POPC | 3 |
| 2 | orexin-A, TM5 | POPC | 1 |
| 3 | orexin-A, TM5 | POPC–CHOL | 3 |
| 4 | orexin-A, TM5 | POPC–CHOL | 1 |
| 5 | orexin-A, TM7 | POPC | 3 |
| 6 | orexin-A, TM7 | POPC | 1 |
| 7 | orexin-A, TM7 | POPC–CHOL | 3 |
| 8 | orexin-A, TM7 | POPC–CHOL | 1 |
| 9 | suvorexant | POPC | 3 |
| 10 | suvorexant | POPC–CHOL | 3 |
| 11 | Nag26 | POPC | 3 |
| 12 | Nag26 | POPC | 1 |
| 13 | Nag26 | POPC–CHOL | 3 |
| 14 | Nag26 | POPC–CHOL | 1 |
| 15 | none | POPC | 3 |
| 16 | none | POPC–CHOL | 3 |
Amino Acid Numbering
For clarity, we use one-letter amino acid codes for the orexin-A, and three-letter codes for the OX2 receptor. For the receptor, we use the GPCRdb numbering scheme,31 in which the most conserved amino acid in each transmembrane helix is denoted Nx50, where N is the number of the respective helix. Amino acids up- and downstream are numbered consecutively based on their overlap with an ideal α helix; if a residue is “missing”, the corresponding number is skipped, and in the case of bulges, the residue furthest from the helical axis is denoted NxYY1, where NxYY is the number for the previous residue.
System Setup
The OX2 Receptor
The OX2 receptor crystal32 (PDB id: 4S0V) is missing the N-terminus upstream of Pro50, residues 160–163 (the second intracellular loop, ICL2), 198–202 (top of the hairpin in the second extracellular loop, ECL2), 255–293 (ICL3), 336–337 (ECL3), and the C-terminus downstream of Cys381. Few side-chain atoms are also missing near the unresolved sections. To fill these gaps, we used Modeller 9.1433 with default settings to build 30 homology models of the human OX2 (residues 50–254 and 294–381) using the crystal structure 4S0V as a template, and selected the model with the lowest RMSD in comparison to the template. We left out the receptor termini and the ICL3 since long stretches such as these do not produce reliable models without suitable templates, which were not available at the time. We set all arginine, lysine, glutamic acid, and aspartic acid residues as charged, except for the Asp1002x50, which we set to be protonated.34 We allowed Gromacs to decide the protonation states for histidine residues based on the optimal hydrogen bonding conformation with default settings.
Peptide Docking
Orexin-A2–33 in the straight α-helical conformation11 was docked to the receptor model with ZDOCK35 and docking poses were refined with RDOCK36 via Discovery Studio 4.5.37 As pyroglutamate is not parametrized in these docking algorithms, we were forced to omit the first residue. It was added manually prior to simulation. From top-scoring docking poses, we selected manually two poses that were close matches to our previously published binding modes,21 which were named the TM5-mode and the TM7-mode based on the orientation of H26.
Small Molecule Placement
Suvorexant was copied from the OX2 crystal structure 4S0V.32 Nag26 was docked to the crystal structure as described previously.38 In short, Nag26 was docked with Glide induced-fit protocol, retaining the binding site water molecules. Shape and interaction similarities to suvorexant directed the pose selection. The selected pose (but not the water molecules) was then copied into the binding cavity of the homology model with no further refinement.
Membrane
We employed CHARMM-GUI39−42 to generate two hexagonal membranes solvated in TIP3P43 water to result in a 12 nm total height. We used a pure POPC membrane of 150 lipids per leaflet, and a POPC + CHOL (25%) membrane of 126 + 42 lipids per leaflet. The membrane size was selected to ensure at least 50 Å between the periodic images of the protein in the membrane plane, and 25 Å in the direction perpendicular to the membrane. Both membrane models employed here are simplified representations of reality. For computational feasibility, we selected only one phospholipid for the study. POPC membranes are frequently used in MD simulations as the lipid is commonly present in biomembranes.44 The comparison of simulations, especially in the field of GPCRs, is facilitated by employing membranes similar to other studies.28,45−50 While most MD simulations with GPCRs employ single-component membranes, we additionally replicated all simulations with cholesterol-containing membranes to probe for the effects of the membrane composition. Cholesterol is known to be present in the cellular membrane, and its effects on the membrane thickness and packing are clear.51−54 Also, several interaction sites for cholesterol have been mapped onto the membrane-facing interface of GPCRs.55
As the starting positions for the cholesterol in contact with the receptor can have a significant impact on their distribution through the simulation, we carried out coarse-grained MARTINI56 simulations to define suitable starting locations. We used CHARMM-GUI39−42,57 to embed the OX2 receptor in POPC–cholesterol bilayers with 10%, 25% or 50% of cholesterol, and to derive necessary topologies for the simulation. All systems were energy-minimized for 5000 steps and subsequently equilibrated for 100 ns (NVE ensemble). Then, each system was simulated for 10 μs in triplicate under NPT conditions. A time step of 20 fs was used in the simulations. Temperature of 310 K and pressure of 1.0 bar were maintained with V-rescale thermostat and Berendsen barostat with coupling times of 1.0 ps. Long-range electrostatics were calculated with the reaction field method and the van der Waals interaction was cut off at 1.1 nm. All backbone atoms of the receptor were position restrained with a force constant of 1000 kJ/mol × nm2. The first 3 μs of each simulation were treated as equilibration, and the final 7 μs were subjected to analysis of cholesterol density around the protein. This revealed 8 sites for cholesterol molecules, and 15 sites for POPC molecules. These were back-mapped to an all-atom system.
Construction of Simulation Systems
We inserted the receptor complexes into the membranes with the Gromacs tool membed with default settings except for a 0.1 resize factor in the xy-dimension. To the POPC membrane, the protein complex was embedded as such; this resulted in a deletion of 3 + 3 POPC molecules, except for the peptide simulations, where the intracellular leaflet lost an additional lipid. For the POPC–cholesterol membrane, we first combined the receptor with the lipids identified by the coarse-grained simulation. Then, to ensure a symmetrical membrane with the intended 25% cholesterol content, we selected manually a suitable location for the insertion into the generated membrane and created a circular hole by deleting 18 POPC molecules per leaflet and 6 + 4 cholesterol molecules from extra- and intracellular leaflets respectively (as 5 out of 8 identified cholesterols were on the extracellular leaflet). The receptor and the close lipids were then inserted into the pregenerated hole.
In each system, we added NaCl to neutralize the charge for the receptor complex and to reach a salt concentration of 100 mmol/L. The resulting systems contained 293–294 POPC lipids or 246 POPC + 82 CHOL lipids, and ∼25 000 water molecules in addition to necessary ions and the receptor complex.
Force Field and Protocol
We used Amber99sb-ildn force field58 together with Slipids59 parameters for POPC and cholesterol. We added parameters for pyroglutamate manually, and used atom charges from TINKER60 parameters. Suvorexant was parametrized with Antechamber,61 with Gaussian62-derived RESP partial charges. Nag26 parameters were combined from Amber99sb-ildn (most bond and angle parameters), OPSL-AA63 (bonds and angles whenever native Amber parameters were unavailable, and torsions for the sulfonamide) and Antechamber (torsions excluding the sulfonamide, AM1-BCC charges64). The topologies for the small molecules are available as part of the Supporting Information.
All simulations were run under periodic boundary conditions in hexagonal prism-shaped boxes. For all simulations, the time step was 2 fs, center-of-mass motion was removed every 10 steps for membrane−protein–ligand complex and solvent separately, and Verlet pair-list was updated every 20 steps. Temperature was kept at 310 K with Nose–Hoover thermostat separately for membrane, solvent and the protein complex, and pressure of 1 bar was maintained independently for z- and xy-dimensions with semi-isotropic Parrinnello–Rahman barostat. Short-range electrostatics and van der Waals forces were cut off at 1 nm with long-range dispersion corrections for energy and pressure. PME was used for long-range electrostatics with cubic interpolation and Fourier spacing of 0.12 nm. LINCS constraints were used with all bonds.
Equilibration and Production
We used an equilibration scheme inspired by a previously presented work.65 Each simulation was equilibrated in seven 10 ns phases; in the first phase we imposed a 1000 kJ/mol restraint on protein and ligand heavy atoms, as well as on cholesterol heavy atoms for the simulations in the cholesterol-containing membrane. Through phases 2–5, we tapered off the heavy atom restraints with 200 kJ/mol intervals, except for the cholesterols, where the restraint was removed after phase 1. At phase 6, the 200 kJ/mol restraint was applied to all protein and peptide Cα, as well as to all heavy atoms in the small molecular ligands. At phase 7, the restraint was lifted from those α carbons that reside in the receptor loops. In addition to visual examination of the receptor, ligand and membrane, we monitored the equilibration through the stabilization of potential energy, simulation box vectors and receptor Cα-RMSD.
The equilibration was followed by 3 μs production runs. For the Nag26 and orexin-A simulations in both membranes, we started additional 1 μs replicas from the equilibrated systems.
Analysis
For analysis, each trajectory was aligned based on the receptor Cα with the Gromacs flag progressive; i.e., each frame was aligned to the previous frame to create continuous motions. Analysis was carried out on these full trajectories, except for the analysis involving water and calculation of the preferred locations for cholesterol around the receptor. For these, trimmed trajectories with frames every 3 ns were used. The analysis of membrane thickness and area per lipid was carried out on unaligned coordinates of the final frame, as the receptor-based alignment tends to twist the membrane slightly out of the xy-plane.
The analysis of receptor and its interactions was conducted with Gromacs utilities in combination with VMD66 and Matlab.67 RMSD for protein and peptide was measured from the α carbons, and for the small molecules from the heavy atoms (i.e., non-hydrogen). We refer to RMSD as “external”, when the alignment was based on the receptor Cα, and “internal” when the alignment considered only the ligand Cα (peptides) or heavy atoms (small molecules). Thus, external RMSD contains ligand translation, rotation and conformational changes, whereas internal RMSD describes only the conformational stability. Interactions were mapped residuewise (or by atom groups in small molecules) with gmx mindist with a cutoff of 4 Å, disregarding hydrogens, and hydrogen bonds with the tool gmx hbond with default settings. Pairwise interaction energies were extracted with gmx enemat. Water-bridged hydrogen bonds were scanned with an in-house script by framewise inspection of multiple hydrogen-bonding partners to a single water molecule.
Stable water molecule locations, as well as preferred locations for cholesterol were mapped with VMD Volmap as density with default settings. Cholesterol density across the membrane was mapped using the gmx densmap with grid size of 1 Å. For the density analysis, we aligned the trajectories on the protein, but allowed rotation only around the z-axis to prevent the membrane from tilting, as this would have hindered the separated analysis of the membrane leaflets.
Order parameters for the POPC lipids were calculated with gmx order, and the double bond was treated as described by Pluhackova et al.68 The area per lipid and bilayer thickness were calculated with GridMAT-MD.69 For the analysis, the simulation box was surrounded by periodic images in the xy-plane, while calculations included only the lipids from the original box. The average membrane thickness was estimated as the area-weighted mean of the headgroup P–P distance at individual lipids.
Results and Discussion
Membrane
First, we analyzed the membranes to verify that our simulations replicate the expected membrane properties. At the end of the simulations, the pure POPC membranes showed an average area per lipid (APL) of 60.9 ± 0.8 Å2, and membrane thickness of 36.9 ± 0.4 Å (see Supporting Information, Table S1). These values are in line with experimental data.51−54 The unsymmetrical insertion of some peptide–receptor complexes did not result in marked differences in APL. The cholesterol containing membranes showed clear effects of cholesterol condensing with POPC APL of 51.1 ± 0.6 Å2 and membrane thickness of 41.4 ± 0.5 Å. Cholesterol APL was 37.5 ± 0.9 Å2. The ordering parameters of the POPC tails closely replicate experimental values70 for both pure and cholesterol-containing membrane; see Supporting Information, Figure S1. Despite the clear effect of cholesterol on the membrane properties, we observe no consistent differences in ligand binding interactions or receptor mobility between pure POPC membrane and the cholesterol-containing membrane. This might reflect the orexin receptors’ indifference to the membrane composition, or more likely catching such effects would require more replicas or extended simulation periods.
The class A GPCRs have been postulated to feature specific cholesterol-binding sites facing the membrane milieu.55 On the extracellular leaflet, crystal structures of GPCRs have shown cocrystallized cholesterol molecules next to the TM3, at the TM4–5 interface and along the ECL3-side of the receptor, where the position at the TM6–7 interface has been most frequently populated.55 On the intracellular leaflet, the most notable site is the suggested “Cholesterol Consensus Motif” (CCM)71 located at the cleft formed by the TM1–4, which provides a binding site for one or two cholesterol molecules at least in the β2-adrenoceptor. As these sites offer a possible route for cholesterol-mediated effects, we sought to find and populate them through the coarse-grained simulations. The simulations suggested five sites on the extracellular leaflet (one facing the TMs 1 and 7, two in the crevice formed by the TM2–4, one close to the TM4–5 and one facing the TM6–7) and three sites on the intracellular leaflet (two next to the TMs 1, 2, and 4, and one facing the TM3–5) (Figure 2). Many of the sites discovered by the coarse-grained simulations match the cholesterol binding observed in the crystal structures; both sides of the extracellular end of the TM7, at the extracellular TM4–5 interface, and at the intracellular TM3–5 interface. Two cholesterol molecules were located close to the CCM site enclosed by the TMs 1–4, but not completely within the cavity. Of the starting sites, only the extracellular leaflet positions on both sides of the TM7 and next to the TM4–5 were stable through equilibration, and only the two positions flanking the TM7 were consistently stable in the production simulations (Figure 2, Supporting Information, Figure S2). Individual simulations show also other binding sites, most often in the extracellular leaflet, but these are not consistent across the pool of simulations (Supporting Information, Figure S2). Interestingly, the TM7-flanking sites, which were the most stable, are among those observed through X-ray crystallography.55 Aromatic residues in the region (Phe333ECL3, Trp3457x33, Phe3487x36, Trp3517x39, and Tyr531x31 appear to interact with cholesterol in these “pockets”. The significance of these sites for orexin receptor function remains to be elucidated.
Figure 2.
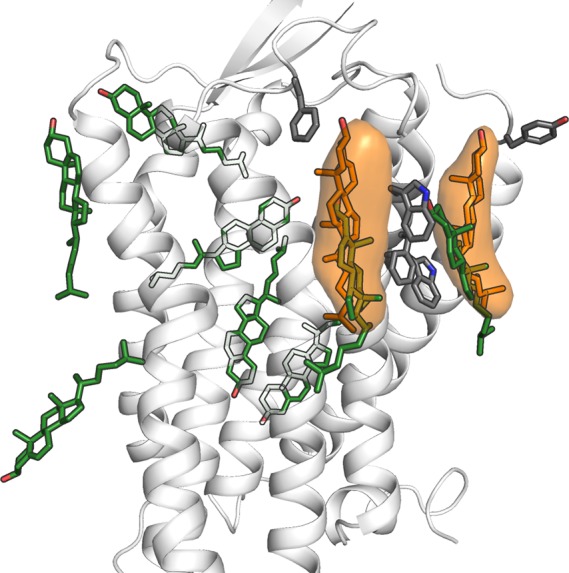
Cholesterol around the receptor. In green, the initial locations; in orange, the stable locations.
Receptor Conformation
GPCR activation is heralded by the outswing of the intracellular end of the TM6, which is accompanied by the reorganization of interhelical interactions at the intracellular side of the receptor.25 The interaction patterns have been analyzed for all GPCRs that have been crystallized both in the active and the inactive state. The analysis showed that there are five conserved “inactive” interactions, which in OX2 would be Ile1483x46–Leu3066x37, Val751x53–Tyr3647x53, Tyr3647x53–Phe3718x50 and Asn3657x54–Arg3728x51.25 Similarly, there are two conserved “active” interactions, which would be Leu3106x41–Val2405x55 and Tyr3647x53–Ile1483x46 in the OX2. In addition to these interactions, which locate at the intracellular side of the receptor, a triad of amino acids at the center of the receptor has been suggested to reorganize upon receptor activation.72 This “core triad” comprises Phe3136x44, Pro2355x50 and Val1423x40 in the OX2. During the transition from the inactive to the active state, the side chain of Phe6x44 is suggested to pass the side chain of the amino acid 3x40 (valine in orexin receptor but isoleucine in adrenoceptors where the core triad reorganization has been observed) and move closer to Pro5x50. This movement is also tied to the outswing of the TM6.
Our 16 simulations showed a quite static receptor (receptor Cα RMSD of 2–4 Å in comparison to the equilibrated structure, see Supporting Information, Figure S3). No large-scale conformational changes were visible, including the TM6, which retained its closed, inactive conformation. Residuewise RMSF showed that most fluctuation took place at or near the loop regions or chain termini (data not shown). Concerning the reorganization of contacts upon activation, none of the simulations showed either of the two active interactions described above. The five interactions typical to inactive receptors were mostly maintained, and even if they were periodically broken, it was not caused by activation-like conformational changes. The core triad of Phe3136x44, Pro2355x50 and Val1423x40 remained in the starting (inactive) conformation, except for the simulations 7 (TM7-mode) and 10 (suvorexant). The observed reorganization was not replicated in other simulations with these ligands, and not reflected by the large-scale conformation of the TM6, which remained in the inactive conformation.
The antagonist-bound orexin receptor crystal structures display three to four salt bridges lining the binding site. All structures show the salt bridges Asp45x51–Arg6x59, Glu45x52–His5x40, and Asp2x64–His7x38. In addition, the OX2 crystal structures show a salt bridge between Glu2x67–Arg7x27. It has been suggested that these bridges might stabilize the inactive state, and that a disruption of the bridges could lead to receptor activation.21,32 While the simulations conducted here showed nonuniform salt bridge behavior (see Supporting Information, Figure S4), the differences did not appear to depend on the ligand or the membrane composition.
Peptide Binding Modes
One of the aims of our study was to assess the stability of the two alternative orexin-A binding modes we had previously suggested,21 called the TM5-mode and the TM7-mode based on the orientation of the (arbitrarily selected) H26. In the previous study, neither binding mode was promoted by the assessment of docking scores and interactions toward residues that had been shown important by SDM.
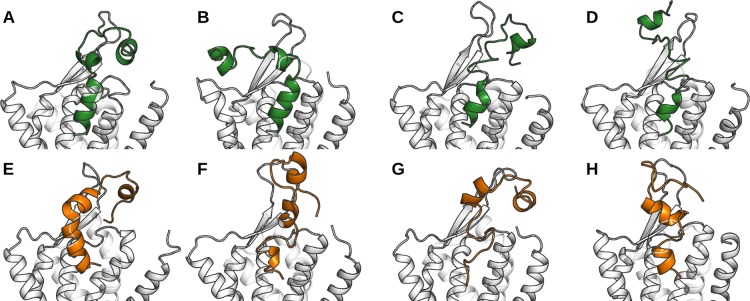
While the 19-amino-acid fragment from the orexin-A C-terminus has been shown to suffice for the biological activity, we elected to use a full-length peptide, which we docked in the straight α-helical conformation to replicate our previous docking poses. The simulations, however, showed that this straight conformation was not stable unless hydrogen bonding between the N-terminal hook and the receptor ECL2 took place. These hydrogen bonds often involved the ECL2 main chain, and were not consistent across the simulations. In absence of hydrogen bonding between the orexin-A N-terminus and the receptor ECL2, the peptide hinge was allowed to bend, moving the peptide N-terminus to rest horizontally atop the receptor. This bending took place in the simulations 2 and 5, which feature the TM5- and TM7-modes, respectively, while other simulations with orexin-A showed the N-terminus in contact with the ECL2, following its fluctuations (Figure 3). Our simulations did not include the receptor N-terminus, as its structure and location had not been resolved at the time. The possible impact of the receptor N-terminal helix73,74 on the peptide conformation and binding is discussed below, after the description of the peptide C-terminus binding.
Figure 3.
End point of orexin-A simulations. (A–D) TM5-mode, simulations 1–4, respectively; (E–H) TM7-mode, simulations 5–8, respectively.
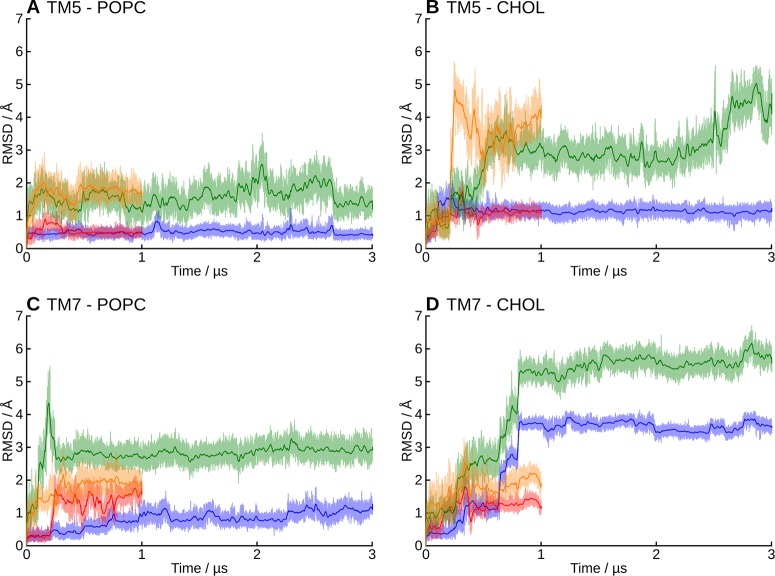
As the C-terminus of the peptide is the key for biological activity, we focused in its stability and interactions. To assess the stability of the predicted binding modes, we analyzed the peptide C-terminus (N25–L33) separately, since the bending of the hinge region and the conformational flexibility of the N-terminal hook dominate the RMSD of the full-length peptide. Overall, the receptor-bound C-terminus of orexin-A maintained its conformation and location better in the TM5-mode (i.e., H26 side chain points toward TM5) than in the TM7-mode, and for both binding modes, the conformation was more stable in the pure POPC membrane than in the cholesterol-containing membrane (Figure 4).
Figure 4.
RMSD of the peptide C-terminus. In green and orange, the “external” RMSD, and in blue and red, the “internal” RMSD. (A) Simulations 1–2, (B) 3-4, (C) 5–6, and (D) 7–8. See Methods, Analysis, for definitions for the external and internal RMSD.
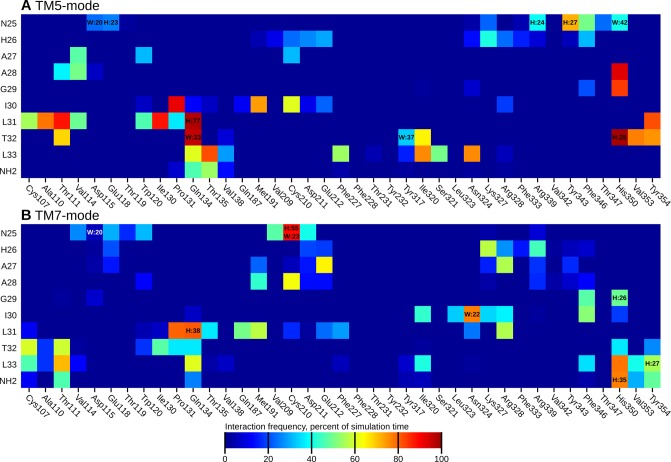
As the binding interaction of the peptide N-terminus are heavily influenced by the (possible) bending of the peptide, we assessed the binding interactions only for the peptide C-terminus (N25–L33). These interactions, averaged across the simulations, are shown in Figure 5, panels A and B for the TM5- and TM7-mode, respectively. Simulationwise heatmaps of the interaction frequencies, along with mapped interaction energies are available in the Supporting Information as Figures S5–S12. The stable location and conformation of the peptide C-terminus in the TM5-mode is mirrored in well-defined, stable interactions across simulations 1–4, whereas the higher mobility and instability of the TM7-mode is reflected by more variable interactions in the simulations 5–8.
Figure 5.
Heatmap of binding interactions of the peptide C-terminus, averaged across all simulations sharing the same binding mode (1–4 for TM5-mode, 5–8 for TM7-mode). The heatmaps display the fraction of simulation time that any interatomic distance was below 4 Å. H:xx denotes the presence of a hydrogen bond and W:xx the presence of a water-mediated hydrogen bond. These are shown only when the frequency was over 20%.
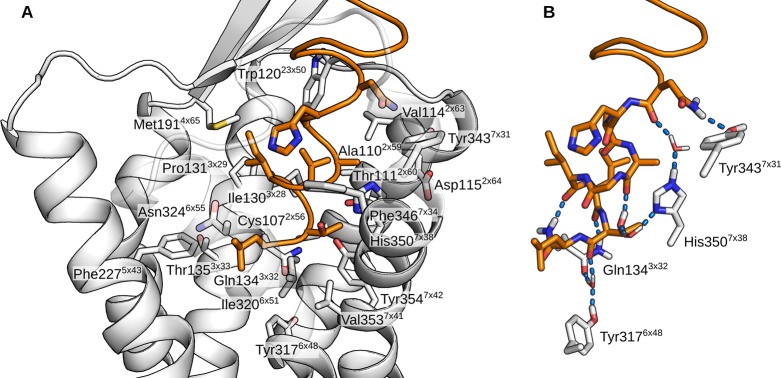
As described, the orexin-A C-terminus remained quite stable in the TM5-mode (simulations 1–4), especially in the POPC membrane (1–2). In the cholesterol-containing membrane (3–4), the peptide rose some 1.4 Å further from the bottom of the binding cavity, which was reflected in the external RMSD. In the simulation 4, the peptide C-terminus also tilted 10° toward the TM1. Despite these differences, the interactions remained similar in all four simulations (Figure 6). N25 interacted mainly with residues at the top of the TM7, most often Tyr3437x31. In simulations 3 and 4, this interaction was often a hydrogen bond; in the simulation 3, between the side chains, either NH2···OH or OH···O, and in the simulation 4, due to the tilting of the peptide, Tyr3437x31 OH to N24 main-chain carbonyl. The simulation 1 showed an alternative interaction, namely a hydrogen-π bond from N25 NH2 to Phe3467x34. In all four simulations, the N25 also interacted with His3507x38, either directly as seen in the simulation 1 and 2 (POPC membrane), or via a water-mediated hydrogen bond due to the increased distance in the simulation 3 and 4 (cholesterol membrane). H26 interacted with the side chains of the acidic residues in the ECL2 (Asp21145x51 and Glu21245x52) in the simulations 1 and 2 (a prominent interaction also in terms of interaction energy, as seen in Figures S5–S6 in the Supporting Information), while the peptide repositioning seen in the simulation 3 and 4 was accompanied by a local tightening of the helical turn, which brought the H26 side chain toward the ECL3. Further toward the C-terminus, the interactions were similar in all simulations; A28 side chain faced a pocket lined by His3507x38, Thr1112x60, Val1142x63, and the aliphatic chain of Asp1152x64. G29 allowed the close packing of His3507x38 against the side of the peptide and the A28–G29 amide bond. I30 faced Met1914x65 and Pro1313x29. To the TM2-side of the Pro1313x29 lay the L31 side chain in a pocket lined also by Ile1303x28, Ala1102x59, Thr1112x60, and the aliphatic chain of Gln1343x32. The T32 side chain faced Tyr3547x42, Val3537x41, His3507x38, Ile3206x51, and Thr1112x60. Most often it hydrogen bonded intramolecularly to A28 (OH···O), unless the His3507x38 adopted a rotamer where the unprotonated Nδ became available for hydrogen bonding. This took place in the simulations 3 and 4, where the His3507x38 side chain flipped upward to follow the N25, in concert with the peptide movement. The L33 side chain lay in a pocket lined by Ile3206x51, Asn3246x55, and Phe2275x43. The NH2 of the amidated C-terminus mainly bonded to the G29 or the I30 carbonyl. An interesting network of interactions took place at the bottom of the binding cavity, between the exposed carbonyls of L31 and T32, along with Gln1343x32 and Tyr3176x48. In the beginning of the simulations, Gln1343x32 side-chain nitrogen usually formed a hydrogen bond to the carbonyl of T32, while Tyr3176x48 hydroxyl pointed down. This was most likely imposed by the starting configuration. During the simulations, the Gln1343x32 hydrogen bond shifted to the carbonyl of L31, Tyr3176x48 hydroxyl flipped upward, and a water molecule moved in to bridge interactions between the Gln1343x32 side-chain carbonyl, Tyr3176x48 hydroxyl and the T32 carbonyl. The Gln3x32–L31 interaction was also prominent in terms of interaction energy (Figures S5–S8 in Supporting Information). In the simulation 2, this reorganization did not happen, as Tyr3176x48 hydroxyl immediately bound to the Gln1343x32 side-chain carbonyl, leaving no space for the bridging water molecule. While the hydroxyl of the Tyr3547x42 was consistently close to the carbonyl of L31, it participated in the network only transiently, preferring to bind with Thr1112x60; this interaction was almost exclusively seen only in the TM5-mode (simulations 1–4). The carbonyl of L33 also took part only rarely.
Figure 6.
Orexin-A binding interactions in the TM5-mode. (A) Binding site with close receptor residues shown as sticks. (B) Hydrogen bonds between the peptide C-terminus and the receptor. The atomic coordinates for the TM5-mode receptor complex presented here are available as Supporting Information.
The instability of the orexin-A helix in the TM7-mode rendered it difficult to sum up the interactions across the simulations 5–8. The simulation 7 showed an almost complete “melting” of the peptide C-terminus, and in simulation 6 and 8 the hinge region unfolded and fell into the cavity between the TMs 2 and 7. The common observations between the simulations were that N25 was close to Asp21145x51 and Cys21045x50, I30 inhabited a pocket lined by Ile3206x51, Asn3246x55, Lys3276x58, and Phe3467x34, and L33 was close to His3507x38, often hydrogen bonded to the C-terminal amide. In terms of interaction energy, there was no apparent consistency between the simulations (Supporting Information, Figures S9–S12). The simulation 7 with the most prominent peptide unfolding aside, the three other simulations (5, 6, and 8) showed the side chain of A27 facing a salt bridge formed by Glu21245x52 and Arg3286x59, A28 residing under the ECL2 and the side chain of L31 facing the pocket of Pro1313x29, Thr1353x33, Gln1874x61 and Met1914x65. The C-terminal carbonyls did not form uniform interactions such as those described above for the TM5-mode.
Given the difference in stability, in terms of both peptide conformation and binding interactions, between the TM5- and the TM7-mode of binding, the TM7-mode seems less likely to be the correct binding mode. Therefore, if the C-terminus of the orexin-A indeed binds in an α-helical conformation, we suggest the TM5-mode as the binding mode for orexin-A at the OX2. The binding mode should also be valid for the OX1 receptor and for orexin-B, since the orexin peptide C-terminus is conserved and the receptor structures are similar. However, with current data, we cannot rule out the possibility of nonhelical bioactive conformation. Endothelin, for example, adopts a conformation that is mostly helical but the C-terminus is extended into the receptor cavity.75 On the other hand, endothelin displays a similar extended C-terminus also in solution,76 whereas orexin peptides show consistently helices also at the peptide C-terminus.
Concerning the receptor amino acids that SDM studies have shown to be important for orexin-A binding and/or receptor activation,14,15 the peptide C-terminus in the TM5-mode interacts strongly with Thr1112x60, Gln1343x32, and His3507x38, comes into direct close contact with Phe2275x43, Asn3246x55 and Tyr3547x42 and forms water-bridged interactions to Tyr3176x48. Thr1112x60 and Tyr3547x42 are also consistently hydrogen bonded with each other. Asp21145x51 and Glu21245x52 in the ECL2 interact with the middle section of the orexin-A, but defined binding partners cannot be summarized from the simulations as the peptide flexibility results in quite different midsection conformations and locations. Trp214 in the ECL2 and Tyr2235x39 line the binding pocket at the ECL2–TM5 junction, but the peptide does not interact with them in our simulations. However, both pack between the TMs 4 and 5, which suggest that they might contribute to the receptor overall conformation or the binding site conformation. Thr2315x461 and Tyr2325x47 are mostly out of reach for the peptide, especially as Tyr2325x47 mostly resides between the TMs 5 and 6. There are also no frequent water-mediated interactions with the peptide, but the residues could be a part of the hydrogen-bond network at the bottom of the binding site or otherwise important for the activation cascade.
The conformations of the bound peptide in the TM5-mode simulations reflect the NMR-derived models of the conformation in water; the peptide C-terminus and the middle section retain their helical conformation, while the hinge region allows the peptide to bend. However, in the simulation 2, and to some extent also in the simulation 3, the peptide bends toward the TM5, which is not among the bending directions observed in the NMR models of orexin-A.11,12 The direction is similar to the orexin-B solution structure,13 except that the bending takes place one helical turn further from the C-terminus. Recent studies73,74 have been able to resolve the structure of the OX1 and OX2 N-terminus, which appears to form a short amphipathic helix either atop the receptor or pointing away from the receptor, residing atop the membrane. While it remains unclear whether these different locations represent different functional states or if either one is a crystallization artifact, the N-terminal helix was shown, through mutagenesis, to be important in the peptide-induced receptor activation.73 This suggests direct interaction with the peptide, which in turn would promote the location next to the ECL2. If the N-terminal helix would indeed lie atop the receptor in interaction with ECL2, as seen in the OX1 structure,73 it would prevent the binding of orexin-A in the straight α-helical conformation such as the one we used for docking and as the starting conformation for the simulations. However, the peptide bent toward the TM5 would fit snugly underneath the N-terminal helix, presenting R15 and Y17 among others toward the downward-facing polar residues of the N-terminal helix (Figure 7). Interestingly though, the N-terminal helix in the crystal structure features lipophilic residues (Phe31, Leu32, Tyr34, Leu35, and Trp36) facing toward the solvent, which seems unfavorable. A roll of 180° would bring them in contact with L16, Y17 and L20 in the orexin-A. It is also possible that the N-terminal helix adopts a distinct peptide-bound conformation, which differs from the small-molecule-bound structures.
Figure 7.
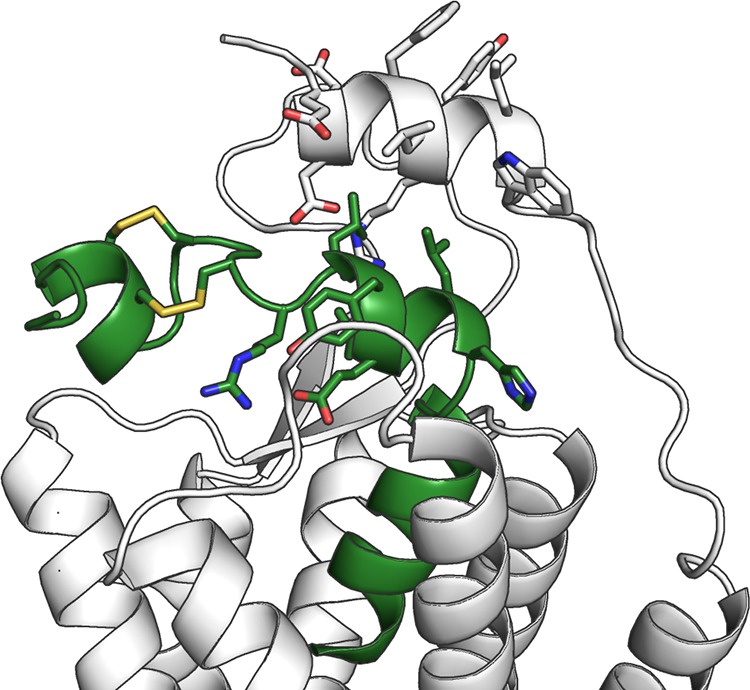
Simulation-derived bent conformation of orexin-A overlaid with the recently published OX1 structure, which displays the N-terminal receptor helix.
Small Molecule Binding
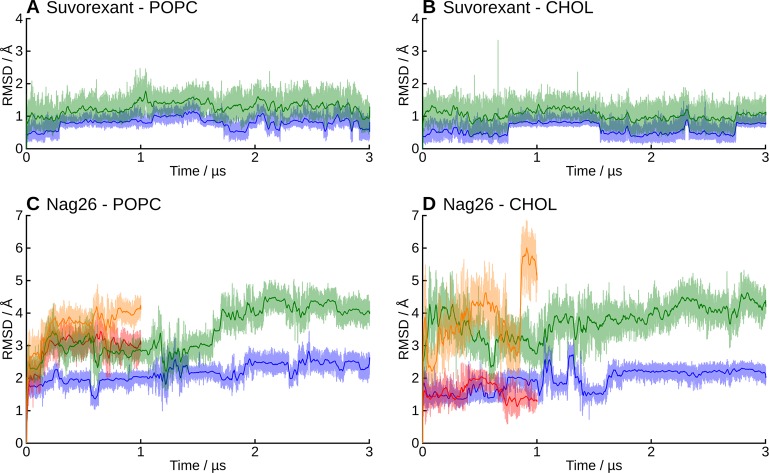
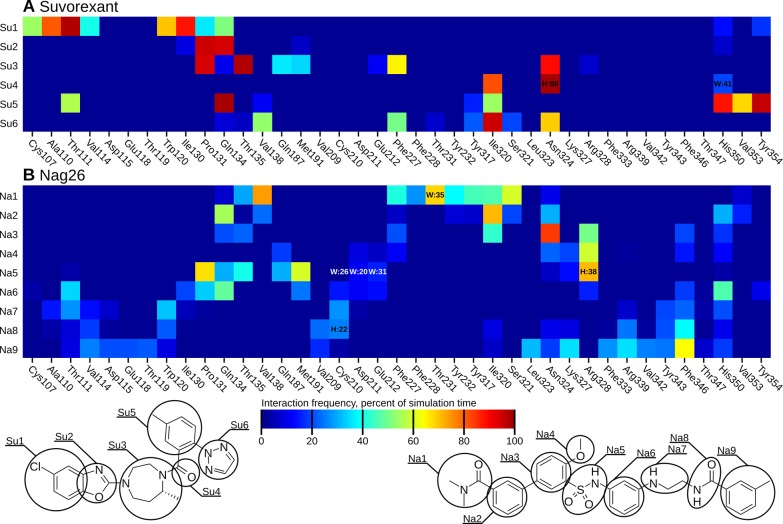
In addition to orexin-A, we carried out simulations with bound small molecules, the antagonist suvorexant (simulations 9–10) and the agonist Nag26 (simulations 11–14). Suvorexant binding mode seen in the crystal structures was stable through the simulations in both membranes. The external RMSD fluctuated around 1 Å, and the internal RMSD between 0.5–1 Å (Figure 8). The chlorinated benzoxazole remained in the pocket lined by Cys1072x56, Ala1102x59, Thr1112x60, Val1142x63, Trp12023x50, Ile1303x28, Pro1313x29, and Gln1343x32, with the oxazole ring packing next to Pro1313x29 (Figure 9A). A water molecule was often seen binding with the oxazole nitrogen, but it did not form a stable water-mediated interaction. The seven-membered ring occupies a central location with the methyl facing Phe2275x43. The linker carbonyl hydrogen bonds to Asn3246x55 and via water to His3507x38. The methylated benzene ring interacts with His3507x38, Val3537x41, and Tyr3547x42 in TM7, and is flanked by Gln1343x32 and the benzoxazole ring on the other side. Underneath, the Gln1343x32–Tyr3547x42 hydrogen bond is maintained throughout the simulations, which is not seen consistently in any other simulations. The triazole ring is next to Ile3206x51 and Phe2275x43, and traps 2–3 water molecules into a pocket between the TMs 5 and 6, where the water molecules form a hydrogen-bond network between Ser3216x52, Thr2315x461, and His2245x40.
Figure 8.
RMSD of the small molecular ligands. In green and orange, the “external” RMSD, and in blue and red, the “internal” RMSD.
Figure 9.
Heatmap of binding interactions of the small molecular ligands. For the mapping, the small molecules were divided into groups as displayed below the heatmaps. The heatmaps display the fraction of simulation time that any interatomic distance was below 4 Å. H:xx denotes the presence of a hydrogen bond and W:xx the presence of a water-mediated hydrogen bond. These are shown only when the frequency was over 20%.
Concerning the pool of crystallized orexin receptor antagonists, the binding mode of suvorexant is near identical between the OX1 and OX2 subtypes,32,73 and closely replicated by the OX1-selective SB-674042.73 The OX2-selective EMPA also occupies a similar location and displays a horseshoe-like conformation.74 All antagonists display the intact Gln3x32–Tyr7x42 hydrogen bond in the crystal structures.
The small molecular agonist Nag26 was more mobile than suvorexant both in terms of conformation (internal RMSD 1.5–3 Å) and location (external RMSD 3–6 Å)(Figure 8), which is not surprising given the number of rotatable bonds in the ligand scaffold. While the molecule mostly retained the initial location, especially the extremities (groups Na1–2 and Na8–9 in Figure 9), showed significant movement. This was reflected in the interaction patterns, which were not always consistent between simulations. The average binding interactions are shown in Figure 9B, and the interaction heatmaps for individual simulations, along with interaction energies, are available in Supporting Information as Figures S13–S18. In some simulations, the ligand retained its initial horseshoe-packed conformation, whereas in others, the ligand extended within the binding site (Figure 10). The dimethylamide group was initially located deep in the binding cavity, next to Thr2315x461 and flanked by Tyr3176x48, Val1383x36, and Ser3216x52. At this site, the carbonyl oxygen often formed a water-mediated hydrogen bond with the side chain of Thr2315x461. In the simulations 13 and 14 (cholesterol membrane), the group retained this position, whereas in the simulations 11 and 12, the group rose a bit and then pushed in-between the TMs 4 and 5. This rise brought the amide oxygen in water-mediated contact with Asn3246x55 or Arg3286x59. The push also moved Thr2315x461 and Phe2275x43 toward the TM4, resulting in a marked counterclockwise rotation of the upper section of the TM5 and tightening of the helical turn at the bulge near Tyr2325x47. The sulfonamide moiety, which is crucial for activity,7 lay next to Pro1313x29 in all simulations but found different binding partners. In the simulation 13, where the Nag26 conformation was the most stable, the sulfonamide formed both direct and water-bridged hydrogen bonds from the oxygens to Gln1343x32. Despite close proximity, Gln1874x61 and Thr1353x33 did not hydrogen bond with the sulfonamide. The amide nitrogen formed a stable water-bridge to Glu21245x52, which in turn remained bonded to Arg3286x59 through the simulation. The simulation 11 showed a more mobile sulfonamide moiety, which hydrogen-bonded first with Arg3286x59 and then moved higher and toward the center of the binding site and switched to Lys3276x58. This movement also allowed the amide nitrogen to bond with Asp21145x51. Arg3286x59 and Glu21245x52 remained in interaction through the simulation, but the ligand movement moved both side chains toward the TM5 and appeared to constrict the entrance of the binding site. Simulations 12 and 14 showed Arg3286x59 hydrogen bonding with the sulfonamide and Glu21245x52/Asp21145x51, while the amide nitrogen interacted with Cys21045x50 main-chain oxygen via water. Water also bridged transient interactions between the sulfonamide oxygens and the side chains of Asp21145x51 and Glu21245x52. The hydrogen bonding between the sulfonamide nitrogen and Lys3276x58/Arg3286x59 seen in simulations 11, 12 and 14 was also a strong contributor to the interaction energy (Supporting Information, Figures S13, S14, and S16). The rest of the molecule was quite mobile; if the ligand retained or readopted the packed conformation, the methylated ring folded in-between the TM7 and the rest of the ligand, favoring interactions with Phe3467x34. In the case of ligand extension, the ring moved close to the ECL1, which brought the polar atoms of the chain linker in hydrogen-bonding distance of the exposed carbonyl of Cys21045x50, and also Thr1112x60.
Figure 10.
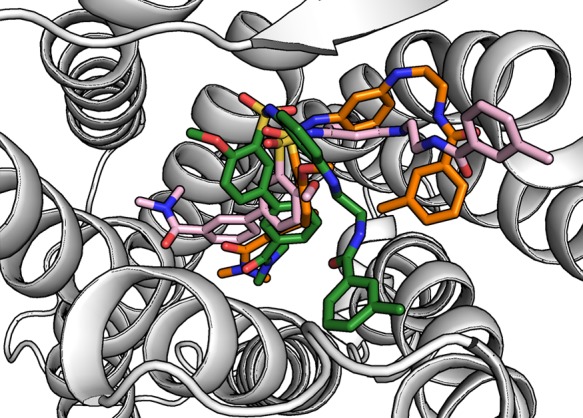
Small molecular agonist Nag26 was mobile during the simulations, rendering the binding mode identification difficult. Representatives of the three most visited conformations are shown.
It is noteworthy that we employed only one starting conformation for the Nag26 agonist. As also our peptide simulations highlighted, the starting conformation can heavily impact the simulation trajectory, and it is possible that another starting conformation for the Nag26 would have yielded different results. Then again, our simulations showed the Nag26 sampling multiple conformations within the binding site, unable to find a markedly stable binding mode. This could mirror the weaker binding interactions in comparison to suvorexant; the Nag26 Ki is 140 nM at the OX2, while the corresponding value for suvorexant is 0.35 nM.2,7 Alternatively, the initial conformation might be far from correct, but given the resemblance between our docking pose and the structurally related small molecular antagonist EMPA (not shown), that seems unlikely.
Water Molecules
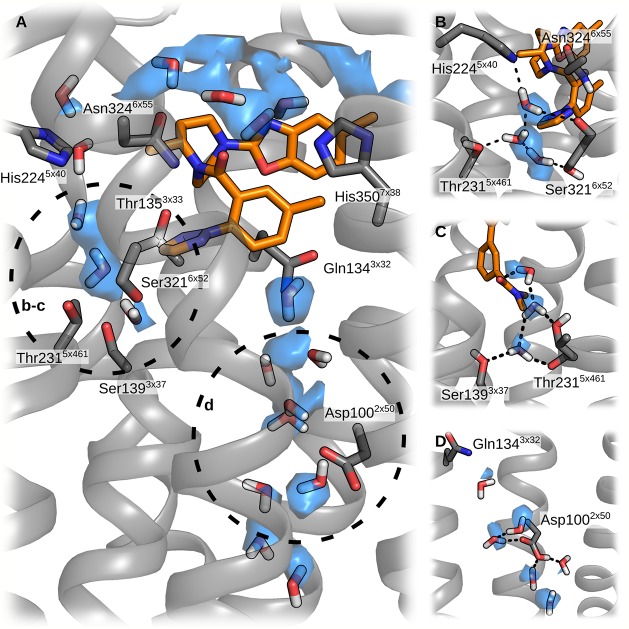
The simulations showed distinct preferences for water molecule locations. Within the receptor core, Asp1002x50 was often accompanied by few water molecules (Figure 11). In some simulations, a semistable chain of water molecules connected these waters to the binding cavity. Two to three water molecules usually resided between the TMs 5 and 6, bound to Thr2315x461 and Ser3216x52, sometimes also to His2245x40 and Asn3246x55. Often, the simulations showed also stable water molecules that took part in the ligand–receptor interactions; these were discussed in detail above for each complex.
Figure 11.
Several water molecules remain in the binding site throughout the simulations. (A) Overview of the binding-site water. The circles with lowercase letters refer to the panels on the right. (B) TM5–6 interface. (C) TM4–5 interface. (D) Asp1002x50.
Many of the observed stable water molecules are also present in the high-resolution crystal structures,32,73,74 such as between the TMs 5 and 6 (Thr2315x461 and Ser3216x52), around Asp1002x50, at the TM6 kink and atop the TM6, and in the intracellular cavity between TMs 3, 4, and 5. Water molecules were also seen around the ECL2 in matching positions to the crystal structures, and close to the TMs 5 and 6. Interestingly, the water molecule that takes part in suvorexant binding, bridging the carbonyl oxygen to His3507x38, was also stable in simulation 1 (orexin-A in the TM5-mode), where the water molecule bridged a three-way interaction between Asn3246x55, His3507x38 and the main-chain carbonyl of N25. In simulation 13, the carbonyl oxygen in the linker chain of the Nag26 occupied a similar position. The water molecules between the TMs 5 and 6 provide the most interesting case; there were two-to-three water molecules in all simulations, unless the TM5 made the counterclockwise turn, moving Thr2315x461 further from Ser3216x52 and thus breaking the water-binding pocket. With the Nag26 simulations, this was linked with the dimethylamide pushing between the TMs 4 and 5, but in the simulation 2 (orexin-A in the TM5-mode), this turning appeared to take place without clearly defined ligand-dependency.
Activation
The activation of a GPCR is a chain of events propagating through the receptor from the ligand-binding site to the G-protein-binding site at the intracellular face. In our simulations, the intracellular conformation of the receptor remained in the inactive state, as anticipated, which was mirrored by the absence of the common contacts observed in the structures of activated GPCRs.25 Concerning the transitional steps along the activation cascade, the core triad,72 which lies underneath the binding site and is thought to be relevant in relaying the activation signal, also remains in the initial, inactive conformation.72 It is noteworthy that orexin receptors have a valine residue at 3x40, whereas a bulkier residue such as isoleucine is often found in the receptors that display a clear “activation” of the core triad. The M2 receptor also features Val3x40, but there both active77 and inactive78 receptor structure resemble the activated core triad of e.g. β2 receptor. At the binding site, the activation determinants differ between receptors, rendering comparison of orexin receptors to the available structures of active GPCRs dubious. However, a common theme in activating interactions is a change in interhelical interactions across the binding site. With this in mind, we noted that suvorexant simulations showed a consistent hydrogen bond between Gln1343x32 and Tyr3547x42, which was not seen in other simulations, but is replicated by other crystallized antagonists.73,74 In contrast, the simulations with orexin-A in the TM5-mode showed this hydrogen bond only 0–8% of the simulation time. On the other hand, the TM5-mode propagated Tyr3547x42–Thr1112x60 hydrogen bonding. We speculate that enforcing the Gln1343x32–Tyr3547x42 hydrogen bond could stabilize the inactive state of the receptor, and that the alternative Tyr3547x42–Thr1112x60 hydrogen bond could enable receptor activation, even though Nag26 did not show as strong effect as the orexin peptide did. The comparison between suvorexant and Nag26 highlights the agonist interacting with Thr2315x461, a location which is central to the activation of adrenoceptors, for example. The Nag26 also interacted with the ECL2, and the salt bridge Glu21245x52–Arg3286x59, which crosses the binding site. One could speculate that this interaction with the salt bridge could induce an inward tilt of the extracellular end of the TM6, which, in turn, could pivot the TM6 and open the intracellular binding site. Nag26 was also seen in two simulations pushing between the TMs 4 and 5, which induced a tightening in the TM5 helix and changed the interactions between the TMs 4, 5, and 6. This could also serve in destabilizing the inactive receptor conformation, thus facilitating receptor activation.
Conclusions
We performed extensive molecular dynamics simulations on the OX2 receptor. On the basis of the simulations, we suggest that orexin-A binds the receptor in a configuration where N25 faces the TM7 (Tyr3437x31), H26 points toward the TM5 but interacts either with the ECL2 or the ECL3, A27 faces the ECL1, A28 and G29 pack next to His3507x38, I30 and L31 flank the TM3 and Pro1313x29 with the L31 side chain occupying a pocked beneath the ICL1, T32 faces the TM7 and L33 the TMs 5 and 6. The exposed carbonyls in the last helical turn participate in a hydrogen-bonding network formed by a stable water molecule, Gln1343x32 and Tyr3176x48. The peptide N-terminus interacts with the ECL2 hairpin, if extended, or bends toward the TM5 to lie atop the binding site. The presented binding mode is, however, contingent on the assumption that the bioactive conformation of the orexin peptide C-terminus is helical and not unfolded.
The small molecule simulations highlight the stability of suvorexant binding, and the contrasting flexibility of the Nag26 agonist. The antagonist and agonist have such different interactions patterns that it is difficult to identify definite key interactions for agonism or antagonism, but certain differences arise, such as the suvorexant-induced stabilization of Gln1343x32–Tyr3547x42 hydrogen bond and the binding interactions of Nag26 toward Thr2315x461, Tyr3176x48, and the ECL2 amino acids Cys21045x50, Asp21145x51, and Glu21245x52. Nag26 is also observed pushing the extracellular end of the TM5 into a counterclockwise rotation, which influences the interhelical interactions between the TMs 4, 5, and 6, for example, breaking up a water-binding site.
Acknowledgments
This work was supported by the Academy of Finland (Grant #287963), the Finnish Cultural Foundation, the Finnish Pharmaceutical Society, and the Orion Research Foundation. We thank the Drug Discovery and Chemical Biology network for organizing computational infrastructure in the HX group and CSC−IT Center for Science, Finland, for generous computational resources. The COST action is thanked for organizing European networks on GPCRs (CM1207/GLISTEN and CA18133/ERNEST) and multi-target binding (Mu.Ta.Lig/CA15135).
Glossary
ABBREVIATIONS
- GPCR
G protein-coupled receptor
- POPC
1-palmitoyl-2-oleoylphosphatidylcholine
- SDM
site-directed mutagenesis
- MD
molecular dynamics
- ECL1–3
Extracellular loop 1–3
- ICL1–3
intracellular loop 1–3
- APL
area per lipid
- TM
transmembrane helix
- CCM
cholesterol consensus motif
Supporting Information Available
The Supporting Information is available free of charge on the ACS Publications website at DOI: 10.1021/acs.jpcb.8b10220.
Additional figures and tables of the MD simulations, membrane parameters, receptor RMSD, binding site salt bridges, and simulationwise interaction heatmaps. (PDF)
Gromacs ITP topologies for the small molecules suvorexant and Nag26 (ZIP)
Atomic coordinates for the receptor complex displaying the TM5-mode of binding for the orexin-A C-terminus (PDB)
Author Contributions
The manuscript was written through contributions of all authors. All authors have given approval to the final version of the manuscript.
The authors declare no competing financial interest.
Supplementary Material
References
- Kukkonen J. P.; Leonard C. S. Orexin/Hypocretin Receptor Signalling Cascades. Br. J. Pharmacol. 2014, 171, 314–331. 10.1111/bph.12324. [DOI] [PMC free article] [PubMed] [Google Scholar]
- Cox C. D.; Breslin M. J.; Whitman D. B.; Schreier J. D.; McGaughey G. B.; Bogusky M. J.; Roecker A. J.; Mercer S. P.; Bednar R. a; Lemaire W.; et al. Discovery of the Dual Orexin Receptor Antagonist [(7R)-4-(5-Chloro-1,3-Benzoxazol-2-Yl)-7-Methyl-1,4-Diazepan-1-Yl][5-Methyl-2-(2H-1,2,3-Triazol-2-Yl)Phenyl]Methanone (MK-4305) for the Treatment of Insomnia. J. Med. Chem. 2010, 53, 5320–5332. 10.1021/jm100541c. [DOI] [PubMed] [Google Scholar]
- Roecker A. J.; Cox C. D.; Coleman P. J. Orexin Receptor Antagonists: New Therapeutic Agents for the Treatment of Insomnia. J. Med. Chem. 2016, 59, 504–530. 10.1021/acs.jmedchem.5b00832. [DOI] [PubMed] [Google Scholar]
- Nishino S.; Ripley B.; Overeem S.; Lammers G. J.; Mignot E. Hypocretin (Orexin) Deficiency in Human Narcolepsy. Lancet 2000, 355, 39–40. 10.1016/S0140-6736(99)05582-8. [DOI] [PubMed] [Google Scholar]
- Scammell T. E.; Winrow C. J. Orexin Receptors: Pharmacology and Therapeutic Opportunities. Annu. Rev. Pharmacol. Toxicol. 2011, 51, 243–266. 10.1146/annurev-pharmtox-010510-100528. [DOI] [PMC free article] [PubMed] [Google Scholar]
- Laburthe M.; Voisin T. The Orexin Receptor OX1R in Colon Cancer: A Promising Therapeutic Target and a New Paradigm in G Protein-Coupled Receptor Signalling through ITIMs. Br. J. Pharmacol. 2012, 165, 1678–1687. 10.1111/j.1476-5381.2011.01510.x. [DOI] [PMC free article] [PubMed] [Google Scholar]
- Nagahara T.; Saitoh T.; Kutsumura N.; Irukayama-Tomobe Y.; Ogawa Y.; Kuroda D.; Gouda H.; Kumagai H.; Fujii H.; Yanagisawa M.; et al. Design and Synthesis of Non-Peptide, Selective Orexin Receptor 2 Agonists. J. Med. Chem. 2015, 58, 7931–7937. 10.1021/acs.jmedchem.5b00988. [DOI] [PubMed] [Google Scholar]
- Turku A.; Rinne M. K.; Boije af Gennäs G.; Xhaard H.; Lindholm D.; Kukkonen J. P. Orexin Receptor Agonist Yan 7874 Is a Weak Agonist of Orexin/Hypocretin Receptors and Shows Orexin Receptor-Independent Cytotoxicity. PLoS One 2017, 12, e0178526. 10.1371/journal.pone.0178526. [DOI] [PMC free article] [PubMed] [Google Scholar]
- Rinne M. K.; Leino T. O.; Turku A.; Turunen P. M.; Steynen Y.; Xhaard H.; Wallén E. A. A.; Kukkonen J. P. Pharmacological Characterization of the Orexin/Hypocretin Receptor Agonist Nag 26. Eur. J. Pharmacol. 2018, 837, 137–144. 10.1016/j.ejphar.2018.09.003. [DOI] [PubMed] [Google Scholar]
- Sakurai T.; Amemiya A.; Ishii M.; Matsuzaki I.; Chemelli R. M.; Tanaka H.; Williams S. C.; Richardson J. A.; Kozlowski G. P.; Wilson S.; et al. Orexins and Orexin Receptors: A Family of Hypothalamic Neuropeptides and G Protein-Coupled Receptors That Regulate Feeding Behavior. Cell 1998, 92, 573–585. 10.1016/S0092-8674(00)80949-6. [DOI] [PubMed] [Google Scholar]
- Takai T.; Takaya T.; Nakano M.; Akutsu H.; Nakagawa A.; Aimoto S.; Nagai K.; Ikegami T. Orexin-A Is Composed of a Highly Conserved C-Terminal and a Specific, Hydrophilic N-Terminal Region, Revealing the Structural Basis of Specific Recognition by the Orexin-1 Receptor. J. Pept. Sci. 2006, 12, 443–454. 10.1002/psc.747. [DOI] [PubMed] [Google Scholar]
- Kim H.-Y.; Hong E.; Kim J.-I.; Lee W. Solution Structure of Human Orexin-A: Regulator of Appetite and Wakefulness. J. Biochem. Mol. Biol. 2004, 37, 565–573. 10.5483/BMBRep.2004.37.5.565. [DOI] [PubMed] [Google Scholar]
- Lee J.-H.; Bang E.; Chae K.-J.; Kim J.-Y.; Lee D. W.; Lee W. Solution Structure of a New Hypothalamic Neuropeptide, Human Hypocretin-2/Orexin-B. Eur. J. Biochem. 1999, 266, 831–839. 10.1046/j.1432-1327.1999.00911.x. [DOI] [PubMed] [Google Scholar]
- Malherbe P.; Roche O.; Marcuz A.; Kratzeisen C.; Wettstein J. G.; Bissantz C. Mapping the Binding Pocket of Dual Antagonist Almorexant to Human Orexin 1 and Orexin 2 Receptors: Comparison with the Selective OX1 Antagonist SB-674042 and the Selective OX2 Antagonist N-Ethyl-2-[(6-Methoxy-Pyridin-3-Yl)-(Toluene-2-Sulfonyl)-Amino]-N-Py. Mol. Pharmacol. 2010, 78, 81–93. 10.1124/mol.110.064584. [DOI] [PubMed] [Google Scholar]
- Tran D.-T.; Bonaventure P.; Hack M.; Mirzadegan T.; Dvorak C.; Letavic M.; Carruthers N.; Lovenberg T.; Sutton S. W. Chimeric, Mutant Orexin Receptors Show Key Interactions between Orexin Receptors, Peptides and Antagonists. Eur. J. Pharmacol. 2011, 667, 120–128. 10.1016/j.ejphar.2011.05.074. [DOI] [PubMed] [Google Scholar]
- Darker J. G.; Porter R. A.; Eggleston D. S.; Smart D.; Brough S. J.; Sabido-David C.; Jerman J. C. Structure-Activity Analysis of Truncated Orexin-A Analogues at the Orexin-1 Receptor. Bioorg. Med. Chem. Lett. 2001, 11, 737–740. 10.1016/S0960-894X(01)00043-9. [DOI] [PubMed] [Google Scholar]
- Ammoun S.; Holmqvist T.; Shariatmadari R.; Oonk H. B.; Detheux M.; Parmentier M.; Åkerman K. E. O.; Kukkonen J. P. Distinct Recognition of OX1 and OX2 Receptors by Orexin Peptides. J. Pharmacol. Exp. Ther. 2003, 305, 507–514. 10.1124/jpet.102.048025. [DOI] [PubMed] [Google Scholar]
- Lang M.; Söll R. M.; Dürrenberger F.; Dautzenberg F. M.; Beck-Sickinger A. G. Structure-Activity Studies of Orexin A and Orexin B at the Human Orexin 1 and Orexin 2 Receptors Led to Orexin 2 Receptor Selective and Orexin 1 Receptor Preferring Ligands. J. Med. Chem. 2004, 47, 1153–1160. 10.1021/jm030982t. [DOI] [PubMed] [Google Scholar]
- Asahi S.; Egashira S.-I.; Matsuda M.; Iwaasa H.; Kanatani A.; Ohkubo M.; Ihara M.; Morishima H. Development of an Orexin-2 Receptor Selective Agonist, [Ala(11), D-Leu(15)]Orexin-B. Bioorg. Med. Chem. Lett. 2003, 13, 111–113. 10.1016/S0960-894X(02)00851-X. [DOI] [PubMed] [Google Scholar]
- German N. A.; Decker A. M.; Gilmour B. P.; Thomas B. F.; Zhang Y. Truncated Orexin Peptides: Structure-Activity Relationship Studies. ACS Med. Chem. Lett. 2013, 4, 1224–1227. 10.1021/ml400333a. [DOI] [PMC free article] [PubMed] [Google Scholar]
- Karhu L.; Turku A.; Xhaard H. Modeling of the OX1R-Orexin-A Complex Suggests Two Alternative Binding Modes. BMC Struct. Biol. 2015, 15, 9. 10.1186/s12900-015-0036-2. [DOI] [PMC free article] [PubMed] [Google Scholar]
- Heifetz A.; Barker O.; Morris G. B.; Law R. J.; Slack M.; Biggin P. C. Toward an Understanding of Agonist Binding to Human Orexin-1 and Orexin-2 Receptors with G-Protein-Coupled Receptor Modeling and Site-Directed Mutagenesis. Biochemistry 2013, 52, 8246–8260. 10.1021/bi401119m. [DOI] [PMC free article] [PubMed] [Google Scholar]
- Karhu L.; Weisell J.; Turunen P. M.; Leino T. O.; Pätsi H.; Xhaard H.; Kukkonen J. P.; Wallén E. A. A. Stapled Truncated Orexin Peptides as Orexin Receptor Agonists. Peptides 2018, 102, 54–60. 10.1016/j.peptides.2018.02.004. [DOI] [PubMed] [Google Scholar]
- Hilger D.; Masureel M.; Kobilka B. K. Structure and Dynamics of GPCR Signaling Complexes. Nat. Struct. Mol. Biol. 2018, 25, 4–12. 10.1038/s41594-017-0011-7. [DOI] [PMC free article] [PubMed] [Google Scholar]
- Venkatakrishnan A. J.; Deupi X.; Lebon G.; Heydenreich F. M.; Flock T.; Miljus T.; Balaji S.; Bouvier M.; Veprintsev D. B.; Tate C. G.; et al. Diverse Activation Pathways in Class A GPCRs Converge near the G-Protein-Coupling Region. Nature 2016, 536, 484–487. 10.1038/nature19107. [DOI] [PMC free article] [PubMed] [Google Scholar]
- Manglik A.; Kruse A. C. Structural Basis for G Protein-Coupled Receptor Activation. Biochemistry 2017, 56, 5628–5634. 10.1021/acs.biochem.7b00747. [DOI] [PMC free article] [PubMed] [Google Scholar]
- Latorraca N. R.; Venkatakrishnan A. J.; Dror R. O. GPCR Dynamics: Structures in Motion. Chem. Rev. 2017, 117, 139–155. 10.1021/acs.chemrev.6b00177. [DOI] [PubMed] [Google Scholar]
- Dror R. O.; Arlow D. H.; Maragakis P.; Mildorf T. J.; Pan A. C.; Xu H.; Borhani D. W.; Shaw D. E. Activation Mechanism of the β2-Adrenergic Receptor. Proc. Natl. Acad. Sci. U. S. A. 2011, 108, 18684–18689. 10.1073/pnas.1110499108. [DOI] [PMC free article] [PubMed] [Google Scholar]
- Abraham M. J.; Murtola T.; Schulz R.; Páll S.; Smith J. C.; Hess B.; Lindahl E. GROMACS: High Performance Molecular Simulations through Multi-Level Parallelism from Laptops to Supercomputers. SoftwareX 2015, 1–2, 19–25. 10.1016/j.softx.2015.06.001. [DOI] [Google Scholar]
- Páll S.; Abraham M. J.; Kutzner C.; Hess B.; Lindahl E. Tackling Exascale Software Challenges in Molecular Dynamics Simulations with GROMACS. Solving Softw. Challenges Exascale 2015, 8759, 3–27. 10.1007/978-3-319-15976-8_1. [DOI] [Google Scholar]
- Isberg V.; de Graaf C.; Bortolato A.; Cherezov V.; Katritch V.; Marshall F. H.; Mordalski S.; Pin J.-P.; Stevens R. C.; Vriend G.; et al. Generic GPCR Residue Numbers – Aligning Topology Maps While Minding the Gaps. Trends Pharmacol. Sci. 2015, 36, 22–31. 10.1016/j.tips.2014.11.001. [DOI] [PMC free article] [PubMed] [Google Scholar]
- Yin J.; Mobarec J. C.; Kolb P.; Rosenbaum D. M. Crystal Structure of the Human OX2 Orexin Receptor Bound to the Insomnia Drug Suvorexant. Nature 2015, 519, 247–250. 10.1038/nature14035. [DOI] [PubMed] [Google Scholar]
- Săli A.; Blundell T. L. Comparative Protein Modelling by Satisfaction of Spatial Restraints. J. Mol. Biol. 1993, 234, 779–815. 10.1006/jmbi.1993.1626. [DOI] [PubMed] [Google Scholar]
- Ranganathan A.; Dror R. O.; Carlsson J. Insights into the Role of Asp792.50 in β2 Adrenergic Receptor Activation from Molecular Dynamics Simulations. Biochemistry 2014, 53, 7283–7296. 10.1021/bi5008723. [DOI] [PubMed] [Google Scholar]
- Chen R.; Li L.; Weng Z. ZDOCK: An Initial-Stage Protein-Docking Algorithm. Proteins: Struct., Funct., Genet. 2003, 52, 80–87. 10.1002/prot.10389. [DOI] [PubMed] [Google Scholar]
- Li L.; Chen R.; Weng Z. RDOCK: Refinement of Rigid-Body Protein Docking Predictions. Proteins: Struct., Funct., Genet. 2003, 53, 693–707. 10.1002/prot.10460. [DOI] [PubMed] [Google Scholar]
- Discovery Studio, version 4.5; Biovia: San Diego, CA, 2015.
- Turku A.; Borrel A.; Leino T. O.; Karhu L.; Kukkonen J. P.; Xhaard H. Pharmacophore Model to Discover OX1 and OX2 Orexin Receptor Ligands. J. Med. Chem. 2016, 59, 8263–8275. 10.1021/acs.jmedchem.6b00333. [DOI] [PubMed] [Google Scholar]
- Jo S.; Kim T.; Iyer V. G.; Im W. CHARMM-GUI: A Web-based Graphical User Interface for CHARMM. J. Comput. Chem. 2008, 29, 1859–1865. 10.1002/jcc.20945. [DOI] [PubMed] [Google Scholar]
- Wu E. L.; Cheng X.; Jo S.; Rui H.; Song K. C.; Dávila-Contreras E. M.; Qi Y.; Lee J.; Monje-Galvan V.; Venable R. M.; et al. CHARMM-GUI Membrane Builder toward Realistic Biological Membrane Simulations. J. Comput. Chem. 2014, 35, 1997–2004. 10.1002/jcc.23702. [DOI] [PMC free article] [PubMed] [Google Scholar]
- Jo S.; Lim J. B.; Klauda J. B.; Im W. CHARMM-GUI Membrane Builder for Mixed Bilayers and Its Application to Yeast Membranes. Biophys. J. 2009, 97, 50–58. 10.1016/j.bpj.2009.04.013. [DOI] [PMC free article] [PubMed] [Google Scholar]
- Jo S.; Kim T.; Im W. Automated Builder and Database of Protein/Membrane Complexes for Molecular Dynamics Simulations. PLoS One 2007, 2, e880. 10.1371/journal.pone.0000880. [DOI] [PMC free article] [PubMed] [Google Scholar]
- Jorgensen W. L.; Chandrasekhar J.; Madura J. D.; Impey R. W.; Klein M. L. Comparison of Simple Potential Functions for Simulating Liquid Water. J. Chem. Phys. 1983, 79, 926–935. 10.1063/1.445869. [DOI] [Google Scholar]
- van Meer G.; Voelker D. R.; Feigenson G. W. Membrane Lipids: Where They Are and How They Behave. Nat. Rev. Mol. Cell Biol. 2008, 9, 112–124. 10.1038/nrm2330. [DOI] [PMC free article] [PubMed] [Google Scholar]
- Koehl A.; Hu H.; Maeda S.; Zhang Y.; Qu Q.; Paggi J. M.; Latorraca N. R.; Hilger D.; Dawson R.; Matile H.; et al. Structure of the μ-Opioid Receptor–Gi Protein Complex. Nature 2018, 558, 547–552. 10.1038/s41586-018-0219-7. [DOI] [PMC free article] [PubMed] [Google Scholar]
- Latorraca N. R.; Wang J. K.; Bauer B.; Townshend R. J. L.; Hollingsworth S. A.; Olivieri J. E.; Xu H. E.; Sommer M. E.; Dror R. O. Molecular Mechanism of GPCR-Mediated Arrestin Activation. Nature 2018, 557, 452–456. 10.1038/s41586-018-0077-3. [DOI] [PMC free article] [PubMed] [Google Scholar]
- Dror R. O.; Green H. F.; Valant C.; Borhani D. W.; Valcourt J. R.; Pan A. C.; Arlow D. H.; Canals M.; Lane J. R.; Rahmani R.; et al. Structural Basis for Modulation of a G-Protein-Coupled Receptor by Allosteric Drugs. Nature 2013, 503, 295–299. 10.1038/nature12595. [DOI] [PubMed] [Google Scholar]
- Dror R. O.; Pan A. C.; Arlow D. H.; Borhani D. W.; Maragakis P.; Shan Y.; Xu H.; Shaw D. E. Pathway and Mechanism of Drug Binding to G-Protein-Coupled Receptors. Proc. Natl. Acad. Sci. U. S. A. 2011, 108, 13118–13123. 10.1073/pnas.1104614108. [DOI] [PMC free article] [PubMed] [Google Scholar]
- Gutiérrez-de-Terán H.; Bello X.; Rodríguez D. Characterization of the Dynamic Events of GPCRs by Automated Computational Simulations. Biochem. Soc. Trans. 2013, 41, 205–212. 10.1042/BST20120287. [DOI] [PubMed] [Google Scholar]
- Gutiérrez-de-Terán H.; Massink A.; Rodríguez D.; Liu W.; Han G. W.; Joseph J. S.; Katritch I.; Heitman L. H.; Xia L.; Ijzerman A. P.; et al. The Role of a Sodium Ion Binding Site in the Allosteric Modulation of the A2A Adenosine G Protein-Coupled Receptor. Structure 2013, 21, 2175–2185. 10.1016/j.str.2013.09.020. [DOI] [PMC free article] [PubMed] [Google Scholar]
- Kučerka N.; Tristram-Nagle S.; Nagle J. F. Structure of Fully Hydrated Fluid Phase Lipid Bilayers with Monounsaturated Chains. J. Membr. Biol. 2006, 208, 193–202. 10.1007/s00232-005-7006-8. [DOI] [PubMed] [Google Scholar]
- Leftin A.; Molugu T. R.; Job C.; Beyer K.; Brown M. F. Area per Lipid and Cholesterol Interactions in Membranes from Separated Local-Field 13C NMR Spectroscopy. Biophys. J. 2014, 107, 2274–2286. 10.1016/j.bpj.2014.07.044. [DOI] [PMC free article] [PubMed] [Google Scholar]
- Kučerka N.; Nieh M.-P.; Katsaras J. Fluid Phase Lipid Areas and Bilayer Thicknesses of Commonly Used Phosphatidylcholines as a Function of Temperature. Biochim. Biophys. Acta, Biomembr. 2011, 1808, 2761–2771. 10.1016/j.bbamem.2011.07.022. [DOI] [PubMed] [Google Scholar]
- Pabst G.; Rappolt M.; Amenitsch H.; Laggner P. Structural Information from Multilamellar Liposomes at Full Hydration: Full q-Range Fitting with High Quality x-Ray Data. Phys. Rev. E: Stat. Phys., Plasmas, Fluids, Relat. Interdiscip. Top. 2000, 62, 4000–4009. 10.1103/PhysRevE.62.4000. [DOI] [PubMed] [Google Scholar]
- Gimpl G. Interaction of G Protein Coupled Receptors and Cholesterol. Chem. Phys. Lipids 2016, 199, 61–73. 10.1016/j.chemphyslip.2016.04.006. [DOI] [PubMed] [Google Scholar]
- Marrink S. J.; Risselada H. J.; Yefimov S.; Tieleman D. P.; de Vries A. H. The MARTINI Force Field: Coarse Grained Model for Biomolecular Simulations. J. Phys. Chem. B 2007, 111, 7812–7824. 10.1021/jp071097f. [DOI] [PubMed] [Google Scholar]
- Qi Y.; Ingólfsson H. I.; Cheng X.; Lee J.; Marrink S. J.; Im W. CHARMM-GUI Martini Maker for Coarse-Grained Simulations with the Martini Force Field. J. Chem. Theory Comput. 2015, 11, 4486–4494. 10.1021/acs.jctc.5b00513. [DOI] [PubMed] [Google Scholar]
- Lindorff-Larsen K.; Piana S.; Palmo K.; Maragakis P.; Klepeis J. L.; Dror R. O.; Shaw D. E. Improved Side-Chain Torsion Potentials for the Amber ff99SB Protein Force Field. Proteins: Struct., Funct., Genet. 2010, 78, 1950–1958. 10.1002/prot.22711. [DOI] [PMC free article] [PubMed] [Google Scholar]
- Jämbeck J. P. M.; Lyubartsev A. P. Another Piece of the Membrane Puzzle: Extending Slipids Further. J. Chem. Theory Comput. 2013, 9, 774–784. 10.1021/ct300777p. [DOI] [PubMed] [Google Scholar]
- Rackers J. A.; Wang Z.; Lu C.; Laury M. L.; Lagardère L.; Schnieders M. J.; Piquemal J.-P.; Ren P.; Ponder J. W. Tinker 8: Software Tools for Molecular Design. J. Chem. Theory Comput. 2018, 14, 5273–5289. 10.1021/acs.jctc.8b00529. [DOI] [PMC free article] [PubMed] [Google Scholar]
- Case D. A.; Babin V.; Berryman J. T.; Betz R. M.; Cai Q.; Cerutti D. S.; Cheatham T. E.; Darden T. A.; Duke R. E.; Gohlke H.; et al. Amber 14; University of California: San Francisco, CA, 2014. [Google Scholar]
- Frisch M. J.; Trucks G. W.; Schlegel H. B.; Scuseria G. E.; Robb M. A.; Cheeseman J. R.; Scalmani G.; Barone V.; Mennucci B.; Petersson G. A.; et al. Gaussian 09, Revision E.01; Gaussian, Inc.: Wallingford, CT, 2009. [Google Scholar]
- Kaminski G. A.; Friesner R. A.; Tirado-Rives J.; Jorgensen W. L. Evaluation and Reparametrization of the OPLS-AA Force Field for Proteins via Comparison with Accurate Quantum Chemical Calculations on Peptides. J. Phys. Chem. B 2001, 105, 6474–6487. 10.1021/jp003919d. [DOI] [Google Scholar]
- Jakalian A.; Jack D. B.; Bayly C. I. Fast, Efficient Generation of High-Quality Atomic Charges. AM1-BCC Model: II. Parameterization and Validation. J. Comput. Chem. 2002, 23, 1623–1641. 10.1002/jcc.10128. [DOI] [PubMed] [Google Scholar]
- Massink A.; Gutiérrez-de-Terán H.; Lenselink E. B.; Ortiz Zacarías N. V.; Xia L.; Heitman L. H.; Katritch V.; Stevens R. C.; IJzerman A. P. Sodium Ion Binding Pocket Mutations and Adenosine A2A Receptor Function. Mol. Pharmacol. 2015, 87, 305–313. 10.1124/mol.114.095737. [DOI] [PMC free article] [PubMed] [Google Scholar]
- Humphrey W.; Dalke A.; Schulten K. VMD - Visual Molecular Dynamics. J. Mol. Graphics 1996, 14, 33–38. 10.1016/0263-7855(96)00018-5. [DOI] [PubMed] [Google Scholar]
- Matlab, version R2017b; MathWorks, Inc.: Natick, MA, 2017. [Google Scholar]
- Pluhackova K.; Kirsch S. A.; Han J.; Sun L.; Jiang Z.; Unruh T.; Böckmann R. A. A Critical Comparison of Biomembrane Force Fields: Structure and Dynamics of Model DMPC, POPC, and POPE Bilayers. J. Phys. Chem. B 2016, 120, 3888–3903. 10.1021/acs.jpcb.6b01870. [DOI] [PubMed] [Google Scholar]
- Allen W. J.; Lemkul J. A.; Bevan D. R. GridMAT-MD: A Grid-Based Membrane Analysis Tool for Use with Molecular Dynamics. J. Comput. Chem. 2009, 30, 1952–1958. 10.1002/jcc.21172. [DOI] [PubMed] [Google Scholar]
- Ferreira T. M.; Coreta-Gomes F.; Ollila O. H. S.; Moreno M. J.; Vaz W. L. C.; Topgaard D. Cholesterol and POPC Segmental Order Parameters in Lipid Membranes: Solid State 1H-13C NMR and MD Simulation Studies. Phys. Chem. Chem. Phys. 2013, 15, 1976–1989. 10.1039/C2CP42738A. [DOI] [PubMed] [Google Scholar]
- Hanson M. A.; Cherezov V.; Griffith M. T.; Roth C. B.; Jaakola V.-P.; Chien E. Y. T.; Velasquez J.; Kuhn P.; Stevens R. C. A Specific Cholesterol Binding Site Is Established by the 2.8 Å Structure of the Human β2-Adrenergic Receptor. Structure 2008, 16, 897–905. 10.1016/j.str.2008.05.001. [DOI] [PMC free article] [PubMed] [Google Scholar]
- Huang W.; Manglik A.; Venkatakrishnan A. J.; Laeremans T.; Feinberg E. N.; Sanborn A. L.; Kato H. E.; Livingston K. E.; Thorsen T. S.; Kling R. C.; et al. Structural Insights into μ-Opioid Receptor Activation. Nature 2015, 524, 315–321. 10.1038/nature14886. [DOI] [PMC free article] [PubMed] [Google Scholar]
- Yin J.; Babaoglu K.; Brautigam C. A.; Clark L.; Shao Z.; Scheuermann T. H.; Harrell C. M.; Gotter A. L.; Roecker A. J.; Winrow C. J.; et al. Structure and Ligand-Binding Mechanism of the Human OX1 and OX2 Orexin Receptors. Nat. Struct. Mol. Biol. 2016, 23, 293–299. 10.1038/nsmb.3183. [DOI] [PubMed] [Google Scholar]
- Suno R.; Kimura K. T.; Nakane T.; Yamashita K.; Wang J.; Fujiwara T.; Yamanaka Y.; Im D.; Horita S.; Tsujimoto H.; et al. Crystal Structures of Human Orexin 2 Receptor Bound to the Subtype-Selective Antagonist EMPA. Structure 2018, 26, 7–19. 10.1016/j.str.2017.11.005. [DOI] [PubMed] [Google Scholar]
- Shihoya W.; Nishizawa T.; Okuta A.; Tani K.; Dohmae N.; Fujiyoshi Y.; Nureki O.; Doi T. Activation Mechanism of Endothelin ETB Receptor by Endothelin-1. Nature 2016, 537, 363–368. 10.1038/nature19319. [DOI] [PubMed] [Google Scholar]
- Takashima H.; Mimura N.; Ohkubo T.; Yoshida T.; Tamaoki H.; Kobayashi Y. Distributed Computing and NMR Constraint-Based High-Resolution Structure Determination: Applied for Bioactive Peptide Endothelin-1 To Determine C-Terminal Folding. J. Am. Chem. Soc. 2004, 126, 4504–4505. 10.1021/ja031637w. [DOI] [PubMed] [Google Scholar]
- Kruse A. C.; Ring A. M.; Manglik A.; Hu J.; Hu K.; Eitel K.; Hübner H.; Pardon E.; Valant C.; Sexton P. M.; et al. Activation and Allosteric Modulation of a Muscarinic Acetylcholine Receptor. Nature 2013, 504, 101–106. 10.1038/nature12735. [DOI] [PMC free article] [PubMed] [Google Scholar]
- Haga K.; Kruse A. C.; Asada H.; Yurugi-Kobayashi T.; Shiroishi M.; Zhang C.; Weis W. I.; Okada T.; Kobilka B. K.; Haga T.; et al. Structure of the Human M2 Muscarinic Acetylcholine Receptor Bound to an Antagonist. Nature 2012, 482, 547–551. 10.1038/nature10753. [DOI] [PMC free article] [PubMed] [Google Scholar]
Associated Data
This section collects any data citations, data availability statements, or supplementary materials included in this article.


