

Abstract
Purpose:
The aim of this study was to examine the hyperreflective dots seen in choroid on spectral domain optical coherence tomography (SDOCT) in eyes with diabetic macular edema (DME) and correlate it with visual acuity.
Design:
Consecutive, cross-sectional case series of patients with DME between January 2017 and December 2017.
Methods:
Eyes with DME having central foveal thickness ≥250 μm were included. SDOCT was performed using Spectralis system (Heidelberg Engineering, Germany). Hyperreflective choroidal foci (HCF) were defined as well-circumscribed dots within choroid having reflectivity equal to or higher than adjacent retinal pigment epithelium. HCF were counted manually within 1500 μm of fovea using a horizontal line scan by a blinded observer. Eyes were divided in 3 groups: group A (no HCF), group B (1–10 HCF), and group C (>10 HCF).
Results:
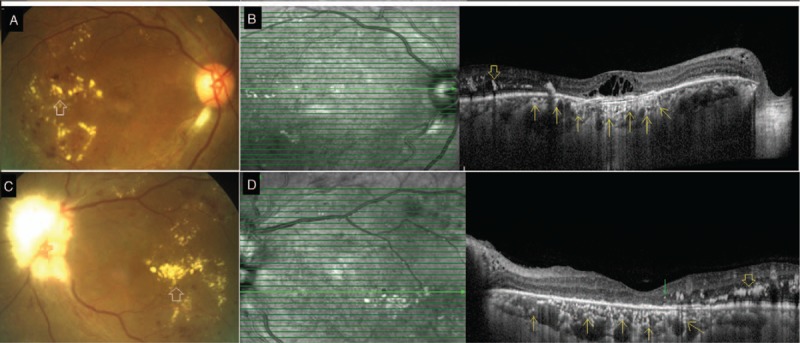
One hundred nineteen eyes of 60 DME patients were included. Sixty (50.4%) eyes were in group A, whereas 42 (33.6%) and 17 (14.2%) eyes belonged to group B and group C, respectively. The mean logMAR best corrected visual acuity was significantly lower in group B (0.76 ± 0.79) and C (1.2 ± 0.78) as compared with group A (0.22 ± 0.49) (P = 0.001). Mean central foveal thickness in group A (300.4 ± 122.4 μm) was significantly lower than group B (455.52 ± 209.1 μm) and group C (529.4 ± 196.4 μm) with P value of 0.001.
Conclusions:
The present study describes HCF as novel prognostic SDOCT biomarker in DME whose presence denotes poor visual acuity. Further longitudinal studies are required to substantiate our findings.
Keywords: biomarker, choroidal hyperreflective foci, diabetic macular edema, SDOCT
Diabetic macular edema (DME) is the leading cause of decreased vision in diabetic retinopathy. Intravitreal antivascular endothelial growth factor (anti-VEGF) is the mainstay of treatment of DME. However, visual outcome remains poor in few cases despite resolution of edema.1,2 Spectral domain optical coherence tomography (SDOCT) features like integrity of ellipsoid zone (EZ), external limiting membrane (ELM), and disorganization of inner retinal layers have been used as prognostic markers in these eyes.3–5 Various studies have described choroidal changes in DME and have correlated choroidal thickness with disease severity. Subfoveal choroidal thickness (SFCT) was reported to increase with the increasing severity of diabetic retinopathy.6 Resolution of DME has been associated with reduction in choroidal thickness which also correlated with improvement in vision.7
Retinal hyperreflective foci (HRF) are punctiform lesions noted in SDOCT spread over various retinal layers. Coscas et al8 reported HRF near intraretinal cystic changes in outer retinal layers in eyes with age-related macular degeneration. They believed that HRF seen on SDOCT were activated microglial cells.8 At the same time, Bolz et al9 reported HRF in eyes with DME and suggested that HRF were actually lipid extravasation which preceded frank hard exudates. HRF have been noted in eyes with diverse retinal conditions like DME, retinal vein occlusion, retinitis pigmentosa, and Stargardt disease which point more toward inflammatory origin than lipid extravasation as their cause.10–12 Besides HRF have been noted in diabetic eyes which did not have diabetic retinopathy which further strengthens the concept of their inflammatory origin.13 The hypothesis that HRF were of inflammatory origin and actually represented activated microglia is supported by the fact that HRF significantly decrease in number or disappear completely after treatment with anti-VEGF.13–15 Vujosevic et al12 have reported that HRF are activated resident microglial cells which are initially present near ganglion cells and other inner retinal layers. With the progression of retinopathy and under the influence of inflammatory mediators which includes VEGF, the inflammatory process spreads to entire retina with outward migration of HRF to outer retinal layers.13 HRF in choroid have been reported in Stargardt disease as deposits of lipofuscin.12 There is no report of HRF in choroid in DME in published literature. In this study, we report similar HRF noted within choroidal layers in eyes with DME which is termed as hyperreflective choroidal foci (HCF). We also report correlation between HCF and other functional and structural parameters in DME.
METHODS
Consecutive patients of DME visiting the retina clinic at a tertiary care center in eastern India were recruited in the study between January 2017 and December 2017. The study was approved by institutional review board and followed the Tenets of Declaration of Helsinki. Demographic data were captured from medical records. Vision was recorded with Snellen visual acuity chart and converted to logMAR reading. All eyes underwent comprehensive ophthalmic examination which included recording visual acuity, anterior segment examination with intraocular pressure measurement, and fundus evaluation with indirect and slit lamp biomicroscopy. Exclusion criteria included high myopia (>6 diopters), glaucoma, media opacities due to cataract or corneal disease, vitreous hemorrhage, history of uveitis, presence of epiretinal membrane or macular hole, age-related macular degeneration, or other ocular pathology that may affect the visual acuity.
Fluorescein angiogram and enhanced depth imaging optical coherence tomography were performed with Spectralis system (Heidelberg Retina Angiograph, HRA2; Heidelberg Engineering). HRF were defined as circumscribed dots within choroid, seen on SDOCT scan having equal or higher reflectivity than retinal pigment epithelium (RPE) band. HRF present between internal limiting membrane and RPE band were defined as HRF and those present beyond RPE band were defined as HCF. The HRF and HCF were manually counted by 2 fellowship-trained retina specialist (R.K.R. and K.S.) using horizontal scan within the 1500 mm centered on the fovea. For the purpose of analysis, data from senior specialist, R.K.R., were taken. Interobserver agreement was recorded. Integrity of ELM and EZ overlying the HCF was recorded. The central foveal thickness (CFT) was measured from the innermost internal limiting membrane to the RPE at the fovea. Patients with CFT >250 μm were included. SFCT was defined as the length of the perpendicular line drawn from the outer border of hyperreflective RPE-Bruch complex to inner margin of choroidal-scleral junction. This measurement was performed using the caliper tool in the SDOCT Heidelberg Eye Explorer software. The retina specialists were blinded to the rest of the patient data. Data were entered to Microsoft Excel version 14.0 (Microsoft Corporation, Redmond, WA) and SPSS version 20.0 statistical software (SPSS; IBM, Chicago, IL) was used for analysis. Analysis of variance test was used to compare the mean values across 3 groups.
RESULTS
One hundred nineteen eyes of 60 patients (36 males and 24 females) were included. Mean age of patients was 56.8 ± 10.9 years. Eighty-seven (73.1%) eyes were phakic and 32 (26.9%) were pseudophakic (Table 1).
TABLE 1.
Demographic Characteristics of Study Eyes
Sixty-five (54.6%) eyes had nonproliferative diabetic retinopathy and 54 (45.4%) had proliferative diabetic retinopathy (PDR). Mean logMAR best corrected visual acuity (BCVA) was 0.66 ± 0.6. Mean CFT was 390.66 ± 190.61 μm. Mean SFCT was 291.35 ± 45.1 μm.
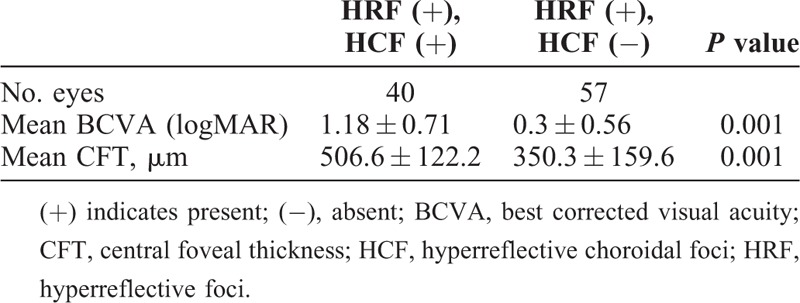
HRF were noted in 97 (81.5%) eyes, whereas HCF was present in 59 (49.5%) eyes. The 59 eyes which had HCF also had HRF. Eyes were divided in 3 groups based on number of HCF: group A (60 eyes), no HCF; group B (42 eyes), 1 to 10 HCF; and group C (17 eyes), more than 10 HCF. Representative images of each group are provided in Figures 1 and 2 (Table 2). The mean logMAR BCVA was 0.22 ± 0.49 in group A which was significantly better than group B (0.76 ± 0.79; P = 0.001) and group C (1.2 ± 0.78; P = 0.001). Twenty (33.3%) patients in group A had PDR which was significantly lower than in group B (22, 52.4%) and group C (12; 70.6%) with a P value of 0.04 and 0.004, respectively. Mean CFT was 300.4 ± 122.4 μm in group A. CFT was significantly higher in group B (455.52 ± 209.1 μm) and group C (529.4 ± 196.4 μm) with a P value of 0.001 and 0.001 respectively. In group A, 59 (98.3%) of total 60 eyes had intact ELM as compared with 28 (66.7%) and 6 (35.3%) each in group B and C, respectively (P = 0.001). Similarly in group A, 59 (98.3%) of total 60 eyes had intact EZ as compared with 29 (69%) and 6 (35.3%) each in group B and C, respectively (P = 0.001). Both HRF and HCF were present in 40 eyes and HRF alone was present in 57 eyes (Table 3). Mean logMAR BCVA in eyes that had both HRF and HCF was 1.18 ± 0.71 whereas it was 0.30 ± 0.56 in eyes which had HRF alone (P = 0.001). Mean CFT in eyes that had both HRF and HCF was 506.6 ± 122.2 μm compared with 350.3 ± 159.6 μm in eyes that had HRF alone (P = 0.001).
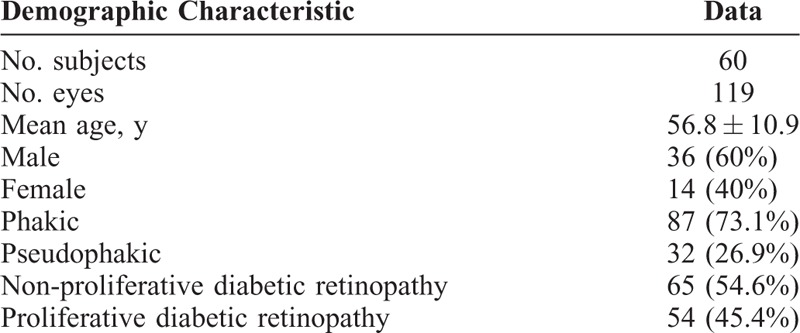
FIGURE 1.
A. Group A: Color fundus photograph of the left eye shows retinal hemorrhages (blank white arrow), cotton wool spots (blank black arrow) and hard exudates (black arrow) suggestive of nonproliferative diabetic retinopathy. B. Spectral-domain optical coherence tomography (SDOCT) line scan through the macula shows macular edema with retinal hyperreflective foci (yellow arrows). Underlying external limiting membrane and ellipsoid zones are intact and choroid does not show any choroidal hyperreflective foci. C. Group B: Color fundus photograph of the right eye shows retinal hemorrhages and hard exudates (blank black arrow) in an eye with nonproliferative diabetic retinopathy. D. SDOCT raster scan through the fovea shows macular edema with retinal hyperreflective foci (green arrow) and choroidal hyperreflective foci (yellow arrows). Choroidal hyperreflective foci are seen as hyperreflective dots within medium and small choroidal vessels (yellow arrows) numbering three hyperreflective foci. Note the focal disruption of external limiting membrane and ellipsoid zone overlying the area of choroidal hyperreflective foci.
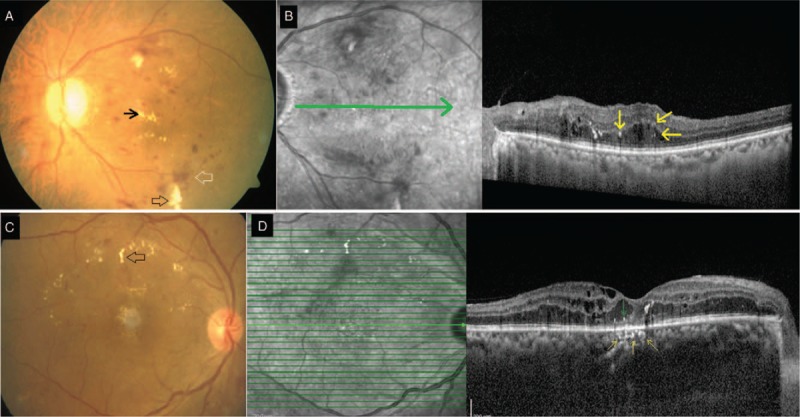
FIGURE 2.
A. Group C: Color fundus photograph of the right eye shows hard exudates (blank white arrow) and retinal hemorrhages due to nonproliferative diabetic retinopathy. B. Spectral-domain optical coherence tomography (SDOCT) raster scan through the macula shows hard exudate (blank yellow arrow) and macular edema. Note the numerous choroidal hyperreflective foci (yellow arrows) seen as discrete hyperreflective dots within medium and small choroidal vessel layers. The disruption of external limiting membrane and ellipsoid zone is limited to the area overlying the choroidal hyperreflective foci. C. Group C: Color fundus photograph of the left eye shows hard exudates (blank white arrow) and few areas of retinal hemorrhages suggestive of nonproliferative diabetic retinopathy. Optic disc is obscured due to myelinated nerve fibers. D. SDOCT raster scan through the macula shows hard exudates (blank yellow arrow) and few retinal hyperreflective foci (green arrow). Numerous discrete hyperreflective dots are noted within medium and small choroidal vessel layer (yellow arrows) suggestive of choroidal hyperreflective foci. Note that the external limiting membrane and ellipsoid zone overlying the choroid with hyperreflective foci is disrupted.
TABLE 2.
Comparative Analysis of Choroidal Hyperreflective Foci
TABLE 3.
Relationship Between HCF and HRF
Interobserver agreement value (kappa) for HCF was >0.9.
DISCUSSION
Diabetic retinopathy is a microangiopathy wherein vascular ischemia plays a major role in the pathogenesis. The pathological changes in the retina are mediated via various inflammatory mediators which includes VEGF. The HRF are SDOCT biomarkers in eyes with DME, believed to be microglial cells which are activated as a result of inflammatory response to retinopathy.13,14 HRF are located in the inner retinal layers in the early spectrum of disease in diabetic retinopathy. With the progression of disease under the influence of various inflammatory mediators which includes VEGF, they migrate toward outer retinal layers.13–15 ELM is intercellular junction between Muller cells and photoreceptor cells. It has got barrier properties and prevents outward passage of macromoleucles from inner retinal layers.16–18 Integrity of ELM and EZ is considered biomarker of better visual acuity in various retinal diseases including diabetic retinopathy.16–19
In our series we have reported HRF within choroid and denote them as HCF. We are of opinion that HCF has similar composition as HRF. ELM and EZ were intact in majority (59/60; 96.3%) eyes which did not have HCF (group A) in the present series. However, ELM and EZ were disrupted in significant number of eyes which had HCF (group B and C) which implies that disruption of ELM and EZ has permitted the migration of HRF into choroid which were noted as HCF. The hypothesis that HCF are actually migrated, HRF is supported by the fact that all 59 eyes with HCF had HRF as well and there was no eye which had HCF in the absence of HRF on SDOCT. Furthermore, we have noted that eyes without HCF (group A) had significantly better mean BCVA (0.22 ± 0.49) compared with eyes which had HCF (0.76 ± 0.79) in group B and (1.12 ± 0.78) in group C. This finding can be explained by the fact that most of the eyes without HCF (group A) had intact ELM and EZ. Among eyes which had HCF, mean BCVA was worse in those with >10 HCF (group C) compared with eyes which had <10 HCF (group B) which further suggests that increasing number of HCF means increasing severity of diabetic retinopathy and worse visual acuity.
Significantly higher number of eyes with HCF had PDR compared with eyes without HCF in the present series (Table 2). The mean CFT was significantly higher in eyes with HCF (455.52 ± 209.1 μm) in group B and (529.4 ± 196.4 μm) in group C than eyes without HCF (300.4 ± 122.4 μm) in group A. These findings go in tandem with the hypothesis that presence of HCF denotes severity of diabetic retinopathy. Further eyes which had both HRF and HCF had significantly lower mean BCVA compared with eyes which had HRF alone (1.18 ± 0.71 vs 0.30 ± 0.5) (Table 3). These eyes with both HRF and HCF also had significantly higher mean CFT (506.6 ± 120.2 μm) compared with eyes with HRF alone (350.3 ± 159.2 μm). Worse mean BCVA and higher mean CFT in eyes with both HRF and HCF compared with eyes with HRF alone buttress role of HCF as a biomarker in DME. Presence of HCF in DME can be a surrogate of disruption of ELM and EZ and can be considered as yet another biomarker of visual acuity and prognosis in eyes with DME. As our understanding of choroid and its role in retinal disorders are increasing, HCF may emerge as a valuable and unique choroidal biomarker in eyes with DME.
There are few limitations of the study. It was a cross sectional, single-center, noncomparative study. A longitudinal study which would study the behavior of HCF with treatment will further strengthen the concept of their generation and their utility as a biomarker. Lack of histological confirmation is another drawback. We believe our report will stimulate further clinical and histological studies and will come up with histological evidence. However, being the first report of HCF in diabetic eyes, the present study has new message to convey.
This present study reports a novel SDOCT biomarker in eyes with DME. Although HRF were known to be present in diabetic eyes, our study reports similar HRF in choroid, considered as HCF. Presence of HCF points toward severe diabetic retinopathy and can be used as a biomarker of disease severity in eyes with diabetic retinopathy.
Footnotes
The authors have no funding or conflicts of interest to declare.
REFERENCES
- 1.Ach T, Hoeh AE, Schaal KB, et al. Predictive factors forchanges in macular edema in intravitreal bevacizumab therapyof retinal vein occlusion. Graefes Arch Clin Exp Ophthalmol 2010; 248:155–159. [DOI] [PubMed] [Google Scholar]
- 2.Daien V, Navarre S, Fesler P, et al. Visual acuity outcome and predictive factors after bevacizumab for central retinal veinocclusion. Eur J Ophthalmol 2012; 22:1013–1018. [DOI] [PubMed] [Google Scholar]
- 3.Serizawa S, Ohkoshi K, Minowa Y, et al. Interdigitation zone band restoration after treatment of diabetic macular edema. Curr Eye Res 2016; 41:1229–1234. [DOI] [PubMed] [Google Scholar]
- 4.Itoh Y, Petkovsek D, Kaiser PK, et al. Optical coherence tomography features in diabetic macular edema and the impact on anti-VEGF response. Ophthalmic Surg Lasers Imaging Retina 2016; 47:908–913. [DOI] [PMC free article] [PubMed] [Google Scholar]
- 5.Das R, Spence G, Hogg RE, et al. Disorganization of inner retina and outer retinal morphology in diabetic macular edema. JAMA Ophthalmol 2018; 136:202–208. [DOI] [PMC free article] [PubMed] [Google Scholar]
- 6.Rewbury R, Want A, Varughese R, et al. Subfoveal choroidal thickness in patients with diabetic retinopathy and diabetic macular oedema. Eye (Lond) 2016; 30:1568–1572. [DOI] [PMC free article] [PubMed] [Google Scholar]
- 7.Nourinia R, Ahmadieh H, Nekoei E, et al. Changes in central choroidal thickness after treatment of diabetic macular edema with intravitreal bevacizumab correlation with central macular thickness and best corrected visual acuity. Retina 2018; 38:970–975. [DOI] [PubMed] [Google Scholar]
- 8.Coscas G, Coscas F, Vismara S, et al. Spectral domain OCT image-related macular degeneration: preliminary results with Spectralis HRA-OCT. J Fr Ophthalmology 2008; 31:353–361. Available at: https://www.ncbi.nlm.nih.gov/pubmed/. [DOI] [PubMed] [Google Scholar]
- 9.Bolz M, Schmidt-Erfurth U, Deak G, et al. Diabetic RetinopathyResearch Group Vienna. Optical coherence tomographic Hyperreflective foci: a morphologic sign of lipid extravasation in diabeticmacular edema. Ophthalmology 2009; 116:914–920. [DOI] [PubMed] [Google Scholar]
- 10.Kuroda M, Hirami Y, Hata M, et al. Intraretinalhyperreflective foci on spectral-domain optical coherence tomographic images of patients with retinitis pigmentosa. Clin Ophthalmol 2014; 8:435–440. [DOI] [PMC free article] [PubMed] [Google Scholar]
- 11.Piri N, Nesmith BL, Schaal S. Choroidal hyperreflective foci in Stargardt disease shown by spectral-domain optical coherence tomography imaging: correlation with disease severity. JAMA Ophthalmol 2015; 133:398–405. [DOI] [PubMed] [Google Scholar]
- 12.Vujosevic S, Bini S, Midena G, et al. Hyperreflective intraretinal spots in diabetics without and with nonproliferative diabetic retinopathy: an in vivo study using spectral domain OCT. J Diabetes Res 2013; 2013:491835. [DOI] [PMC free article] [PubMed] [Google Scholar]
- 13.Framme C, Schweizer P, Imesch M, et al. Behavior of SD-OCT-detected Hyperreflective foci in the retina of anti-VEGF-treated patients with diabetic macular edema. Invest Ophthalmol Vis Sci 2012; 53:5814–5818. [DOI] [PubMed] [Google Scholar]
- 14.Coscas G, de Benedetto U, Coscas F, et al. Hyperreflective dots: a new spectral-domain optical coherence tomography entity for follow-up and prognosis in exudative age-related macular degeneration. Ophthalmologica 2013; 229:32–37. [DOI] [PubMed] [Google Scholar]
- 15.Bunt-Milam AH, Saari JC, Klock IB, et al. Zonulaeadherentes pore size in the external limiting membrane of the rabbit retina. Invest Ophthalmol Vis Sci 1985; 26:1377–1380. [PubMed] [Google Scholar]
- 16.Murakami T, Yoshimura N. Structural changes in individual retinal layers in diabetic macular edema. J Diabetes Res 2013; 2013:920713. [DOI] [PMC free article] [PubMed] [Google Scholar]
- 17.Ito S, Miyamoto N, Ishida K, et al. Association between external limiting membrane status and visual acuity in diabetic macular oedema. Br J Ophthalmol 2013; 97:228–232. [DOI] [PubMed] [Google Scholar]
- 18.Murakami T, Tsujikawa A, Ohta M, et al. Photoreceptor status after resolved macular edema in branch retinal vein occlusion treated with tissue plasminogen activator. Am J Ophthalmol 2007; 143:171–173. [DOI] [PubMed] [Google Scholar]
- 19.Phadikar P, Saxena S, Ruia S, et al. The potential of spectral domain optical coherence tomography imaging based retinal biomarkers. Int J Retina Vitreous 2017; 3:1. [DOI] [PMC free article] [PubMed] [Google Scholar]