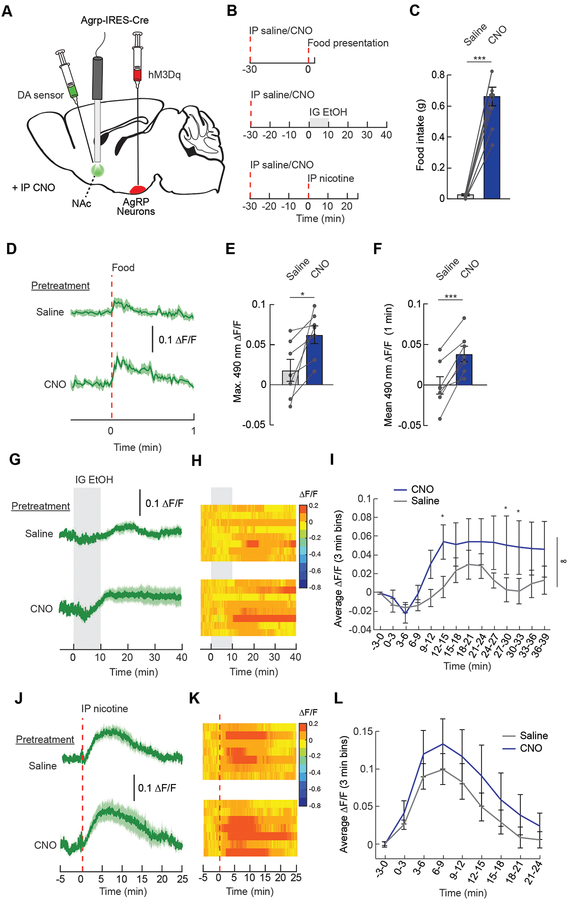
Figure 7. AgRP neuron activity potentiates dopamine signaling in response to food and drugs.
(A) Schematic illustrating the expression of the excitatory DREADD hM3Dq in AgRP neurons and the dopamine (DA) sensor in the nucleus accumbens (NAc). Fiber photometry was used to monitor dopamine signaling in the NAc while manipulating AgRP neuron activity with the DREADD ligand clozapine N-oxide (CNO). (B) Experimental timelines: saline or CNO was injected 30 mins prior to food or drug delivery and NAc dopamine signaling was monitored. (C) Food (chow) intake in ad libitum-fed mice expressing hM3Dq in AgRP neurons and DA sensorin the NAc 1 h following IP injection of saline or CNO (2.5 mg/kg) (n=7/group, paired t-test, p<0.001). (D) Average ΔF/F of DA sensor in ad libitum-fed mice pretreated with IP injections of saline or CNO during food (chow) presentation (n=7/group). Signals are aligned to food presentation. Green, 490-nm signal. Darker lines represent means and lighter shaded areas represent SEMs. (E) Maximum ΔF/F of the 490-nm signal of mice in (D) following food presentation (n=7/group, paired t-test, p<0.05). (F) Mean ΔF/F of the 490-nm signal of mice in (D) from 0 to 1 min following food presentation (n=7/group, paired t-test, p<0.001). (G) Average ΔF/F of DA sensor in ad libitum-fed mice pretreated with IP injections of saline or CNO during gastric infusion of 15% EtOH (n=8/group). (H) Heat maps reporting ΔF/F of the 490-nm signal of the recordings in individual mice in (G). (I) Mean ΔF/F of the 490-nm signal in 3-min bins during gastric infusion of the mice in (G) (n=8/group, two-way repeated measures ANOVA, p<0.05). (J) Average ΔF/F of DA sensor in ad libitum-fed mice pretreated with IP injections of saline or CNO during IP injection of nicotine (1.5mg/kg) (n=7/group). (K) Heat maps reporting ΔF/F of the 490-nm signal of the recordings in individual mice in (J). (L) Mean ΔF/F of the 490-nm signal in 3-min bins from mice injected with nicotine in (J) (n=7/group, two-way repeated measures ANOVA, p=ns). Data are expressed as mean ± SEM, ns p>0.05, t-tests and post-hoc comparisons: *p<0.05, **p<0.01, ***p<0.001; ANOVA interaction: ∞∞∞p<0.001; ANOVA main effect of group: ☼☼p<0.01, ☼☼☼p<0.001. See also Figures S7 and S8.

