Abstract
The concept “density of states” can be given many different meanings when we go beyond the one-electron approximation. In this survey we concentrate on the definition tied to excitation processes, where one electron is added or removed from the solid. We discuss the one-particle spectral function for conduction and core electrons in metals, how it can be approximately calculated, and how it can be related to different types of experiments like x-ray photoemission, x-ray emission and absorption, photoemission and optical absorption in the ultraviolet, and the Compton effect. We also discuss the form of the exchange-correlation potential for use in band structure calculations.
Keywords: Density of states, interacting electrons, one-particle Green function, oscillator strengths, quasi particle density of states, x-ray emission and absorption
1. Introduction
In the one-electron approximation the concept “electronic density of states” is unique and simple and is defined by the formula
| (1) |
where ϵi denotes the single-particle energies. Similarly the optical density of states is given by the joint density of state for electrons and holes, thus
| (2) |
These functions only describe the cruder aspects of experiments such as soft x-ray emission or optical absorption. They must be augmented with the proper oscillator strengths, which provide important selection rules and as well give rise to deviations from the density of state curves.
When one goes beyond the one-electron approximation and considers interactions not included in a self-consistent field theory the situation becomes non-trivial and one encounters a wide variety of density of states functions. The quantity which is most easy to define is the true density of states of the fully interacting systems
| (3) |
where En are the energy levels of the system. Although being a key quantity in thermodynamics it is of no use for the description for e.g. optical, x-ray or energy loss spectra. We rather need the proper extensions of eqs (1) and (2) to describe one- and two-electron properties of the system. A particularly simple case is that of particles having a Lorentzian energy distribution
| (4) |
The density of states is then given by
| (5) |
In cases where the line width Γk is small compared with the width of the band, the formulas (5) and (1) obviously will give similar results.
The simple case just mentioned does not really carry us beyond the one-electron theory. We have in the general case to abandon a concept based on single-particle levels and instead use distribution functions or spectral densities of which the function Ak (ω) given above is a simple and almost trivial case. Such distribution functions include the proper oscillator strengths, and they refer to formally exact many-electron states, properly weighted according to the physical process considered. They are closely related to correlation functions and Green functions. An example is the density-density correlation function 〈ρ(rt)ρ(r′t′)〉, which correlates density fluctuations at different times and different positions. This function is of basic importance for describing optical experiments and energy loss spectra. Unfortunately it is very difficult to analyze its structure and we will here instead concentrate on a simpler entity, the one-particle Green function and its associated spectral function [1].
The one-particle spectral function is a generalization of the usual density of states N1(ω). It gives an asymptotically exact description of x-ray photoemission, is connected with x-ray emission and absorption and also has some relevance for uv photoemission and absorption.
It is, however, not capable to describe edge effects in general, and does not at all account for final state or particle-hole interactions. Such effects, which in their simplest form are described by N2(ω) or generalizations therefrom provide intricate problems upon which we shall only briefly touch here. These questions will be taken up in detail in the lecture by Mahan.
It has recently been noticed that the one-electron spectral function should exhibit some marked and strong structure. This structure is primarily associated with the interaction between the electron and plasmon excitations. It should be quite important in x-ray photoemission, influencing the line shape of the core electron peak and giving low energy satellites both to the core electron and conduction band structures. It is important in x-ray emission and absorption spectra showing up at the threshold, and giving rise to satellite structures. Its effect may also be noticeable in uv photoemission and optical absorption spectra.
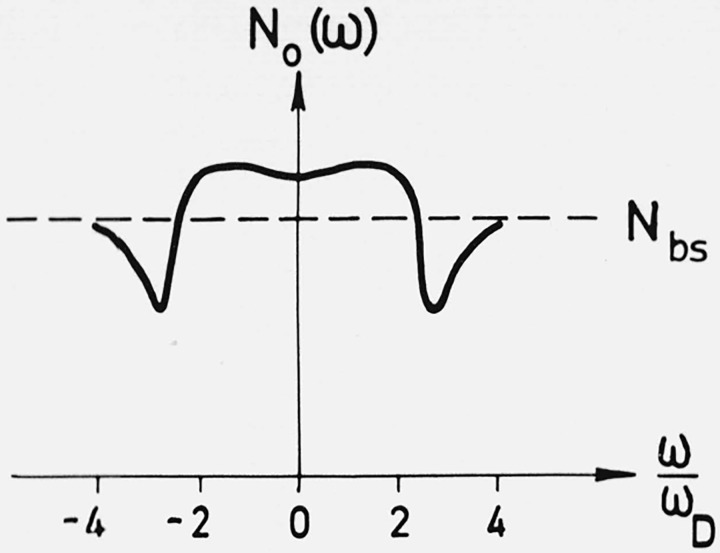
We should also mention the structure in the one-electron spectrum caused by coupling to phonons. This structure is limited to a region of the order of the Debye energy around the Fermi level, but in that region it is quite pronounced, causing e.g. the well-known enhancement of the quasi particle density of states.
In the next section we will discuss the connections between the one-electron spectrum and x-ray photoemission, and with x-ray emission and absorption. In Section 3 we discuss the spectrum of the conduction electrons from calculations to lowest order in the dynamic interaction between the electrons and between the electrons and phonons.
In Section 4 we take up the core electron spectrum and discuss calculations to first order in the dynamic interaction with the valence electrons. We also survey the recent work by Langreth who obtained the exact solution to an important model problem. In Section 5 we give a qualitative discussion of some experimental results for photon absorption and emission, photoemission and Compton scattering. In Section 6 finally we give some concluding remarks.
2. The One-Electron Density of States in an Interacting System and its Connection with X-Ray Photoemission and with X-Ray Emission and Absorption
In this section we introduce some theoretical technicalities, which however seem unavoidable in order to establish a firm connection between theory and experiment.
The one-electron spectral weight function is defined as
| (6) |
In the independent-particle approximation the quantities fs and ϵs are the one-electron wave functions and energies. In an interacting system the oscillator strength function fs is defined as
| (7) |
where ψ(x) is the electron field operator. It gives the probability amplitude for reaching an excited state ∣N − 1, s〉, when an electron is suddenly removed from the ground state ∣N〉. The quantity ϵs is the excitation energy
| (8) |
These definitions apply for ω in eq (6) smaller than the chemical potential μ. For ω larger than μ, states with N + 1 particles are involved.
In applications of the theory it is often practical to represent the spectral function as a matrix in a space spanned by some suitable complete orthonormal set of single-particle states μk(x), thus
| (9) |
The spectral weight function is the general distribution function describing one-electron properties, and is a generalization of the one-electron density matrix, which is obtained after an integration over the frequencies. Distributions with respect to a single variable are in the usual way obtained by summation over all other variables. Thus, the one-electron density of states is defined as
| (10) |
As indicated, the definition is independent of the choice of matrix basis.
The spectral weight function is a key quantity in the Green function formulation of the many-electron problem. A more detailed account is given in many texts, e.g. in sections 9 and 10 of ref. [1].
We next discuss the particular cases of x-ray photoemission and soft x-ray emission, where approximate reductions to the one-electron spectrum can be made.
In the x-ray photoemission experiment (XPS), an energetic photon of energy ω is absorbed, exciting a photoelectron which leaves the system. If the electron has a large enough energy we can write the final state as
| (11) |
where κ refers to a Bloch wave function of energy ϵκ ≈ ℏ2k2/(2m), describing the photoelectron. The probability of this event is, by the Golden rule,
| (12) |
where P is the total momentum and pkk′ the momentum matrix element. For a fast electron, which is outside the region of ground state fluctuations, aκ∣N〉 = 0, and the expression for W reduces to
| (13) |
The energy distribution of photoelectrons is hence given by
| (14) |
taking eκ = ϵ. Using an average momentum matrix element and neglecting nondiagonal terms in A we obtain the simple result
| (15) |
The neglect of nondiagonal terms should be a good approximation if the one-electron functions are carefully chosen Bloch functions and core-electron functions. We note that if the electron is ejected from a core level and if we neglect excitations of the core electron system, the operator ak in eq (13) must destroy a core electron (ak = ac), giving
| (16) |
Here ∣Nv〉 denotes the ground state of the valence electron system, and are excited states in the presence of the core hole. We recognize eq (16) as the result in the sudden approximation.
We next turn to soft x-ray emission. In this case we may write the initial state as [2]
| (17) |
where the star on N indicates that the valence electron system is relaxed towards the core hole. Applying the Golden rule again we have for the x-ray intensity
| (18) |
If we could neglect the relaxation effects in the initial state and replace by ∣Nv〉, we would again have the spectral function A involved. The relaxation effects can be accounted for in an approximate way by only considering particle-hole excitations, thus
| (19) |
Insertion of this expression in eq (18) leads after some further approximations to a very simple expression
| (20) |
where peff involves the coefficients α and is ω-dependent. Such an approximation is however invalid at the Fermi edge, where, as Anderson [3] has pointed out, we need an infinite number of particle-hole pairs to represent .
The edge problem has recently been treated by several people [4–6]. We choose here to give a brief account of Langreth’s version [6] of Nozieres; and de Dominicis’ (ND) treatment of the problem in order to show how the one-electron spectrum enters the problem. The basic quantity needed for the evaluation of eq (18) is the correlation function
| (21) |
To evaluate that function ND study the multiple time function
| (22) |
The simple way, in which the core state operator enters their model Hamiltonian, causes the equation of motion for F to close onto itself and allows a solution as a product,
| (23) |
where Gc is the core electron Green function,
| (24) |
and ϕ a valence electron Green function which obeys an equation with a transient potential from the core hole. The x-ray spectrum is given by a convolution of the core and valence electron spectra. Both spectra are singular at the edge as a power law and so is also the resulting convolution.
The point in keeping the operator ac in eq (22) is that the time dependence of ak(t) then can be given by the same Hamiltonian as that used for ∣N*〉, while when studying , the time evolution of ak(t) is given by a Hamiltonian that does not include the potential from the core hole, and thus the usual many-body techniques do not apply. X-ray absorption can be described in an analogous manner by the function F, only replacing ∣N*〉 by ∣N〉.
It should be mentioned that the ND treatment is based on a model Hamiltonian that does not include interactions between the conduction electrons. This is quite appropriate for their purposes of treating the edge problem but is not sufficient for the spectrum far away from the edge. It is not clear if their treatment can be extended to the more general case. We then have to resort to other methods, such as the approximation in eq (19) or to a frontal attack on the dielectric function itself [7].
We have in this section given a definition of the one-electron density of states and have indicated its relation to some measurable quantities. We conclude from this that a theoretical investigation of this kind of experiments can not avoid the calculation of the one-electron density of states of interacting electrons, but at the same time due to a variety of effects there may be essential modifications of the density of states as it appears in the actual experiment. Explicit results from approximate calculations of the spectral function A and the density of states N(ω) are discussed in sections 3 and 4, and the actual comparison with experiment is made in Section 5.
3. One-Electron Spectrum of Conduction Electrons
The common picture of the one-electron spectra of solids is obtained from energy band calculations, in which the Schrödinger equation of independent electrons in a periodic potential is solved. For the different bands one obtains the electron energy as a function of wave-vector, ϵ(k). The main contribution to the potential seen by an electron is the average electrostatic field or the Hartree field. When going beyond the one-electron approximation the next step would be to include dynamical effects of the interaction as well as exchange effects. Such effects can not be described by an ordinary local potential. A generalized “potential,” non-local in space and time, must be introduced.
Let us for simplicity study the case, where specific effects of the periodicity are of minor importance, and assume the distribution of conduction electrons to be uniform. Due to the non-locality of the generalized “potential,” its Fourier transform to momentum-energy space will show a dependence on both wave-vector k and energy ϵ, Σ (k, ϵ). The quantity Σ is called the self-energy of the electron.
Adding the self-energy to the average potential, we have to solve the equation
| (25) |
The self-energy includes all the interactions between the electron state considered and the system. This necessarily includes dissipative effects, which lead to the decay of the state. Consequently the self-energy must be a complex quantity, thus
| (26) |
The spectral weight function defined in Section 2 is related to the self-energy according to the formula 1, Section 1
| (27) |
In the simple case that the self-energy Σ is independent of energy, the spectral function for fixed k will have a Lorentzian shape and ΣI determines the width of the line. When Σ depends on energy there are no a priori restrictions on the shape of the spectrum.
Most of our present knowledge about the self-energy has been based on calculations, where vertex corrections have been neglected, i.e. using the formulae [9–13]
| (28) |
where
| (29) |
is the propagator for a non-interacting electron, and
| (30) |
is the bare Coulomb potential. The constant kF means the Fermi momentum, and δ is a positive infinitesimal.
To make connection with another approximation, we note that the Hartree-Fock approximation corresponds to the choice ϵ = 1 in eq (28). As it stands, eq (28) expresses the lowest order coupling to the density fluctuations of the conduction electrons, described by the wave-vector- and frequency-dependent dielectric function ϵ(k,ω). This function contains information about the static screening, given by ϵ(k,0), but also important effects of the dynamic behavior of the density fluctuations. The typical small-k-behavior of the spectral function for this kind of excitations, −Im e−1(k,ω), is indicated in figure 1. The clearcut classification of the excitations into electron-hole pairs and plasmons is characteristic for the Linearized Time dependent Hartree (LTH) or Random Phase Approximation [14]. For small wave-lengths the electron-hole pair excitations become of increasing importance, while in the k → 0-limit the plasmon exhausts completely the sum rule for Im ϵ−1, i.e. it is the only excitation. The latter property follows from general arguments about charge conservation and translation invariance [8, p. 288], and should be valid for any useful approximation for ϵ(k,ω). In the LTH approximation the plasmon is undamped for wave-numbers smaller than a critical value kc, which at metallic densities is of the same order of magnitude as kF.
Figure 1.
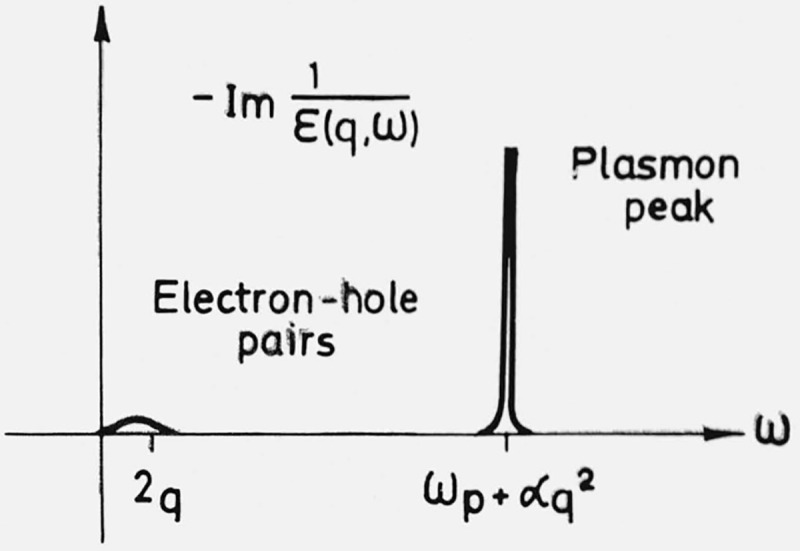
Qualitative behavior of Im ϵ−1 (q,ω) for small q.
A great part of the literature about the electron gas is devoted to the search for an improved dielectric function [15–20], particularly because of the failure of the LTH formula to describe interaction effects at short distances. The last word remains to be said in this question, but it is interesting to note the relative insensibility of the self-energy to the choice of dielectric function [11,12,21]. An approximation, which has proved to be most useful, is to take a plasmon-like sharp absorption for all k according to the formula
| (31) |
where ωp is the classical plasma frequency and ω(k) the resonance frequency at wave number k. The frequency ω(k) reduces to ωp when ∣k∣→0 and is proportional to ∣k∣2 for large ∣k∣. This formula correctly represents the small and large ω-limits and gives a quite reasonable interpolation for intermediate ω values [1, 1]. With this choice one can perform the frequency integration in eq (28) and obtain
| (32) |
The first term in eq (32) is a screened exchange potential, n0(k) being the momentum distribution for independent electrons, and the second term describes the correlation hole around the electron [12,22].
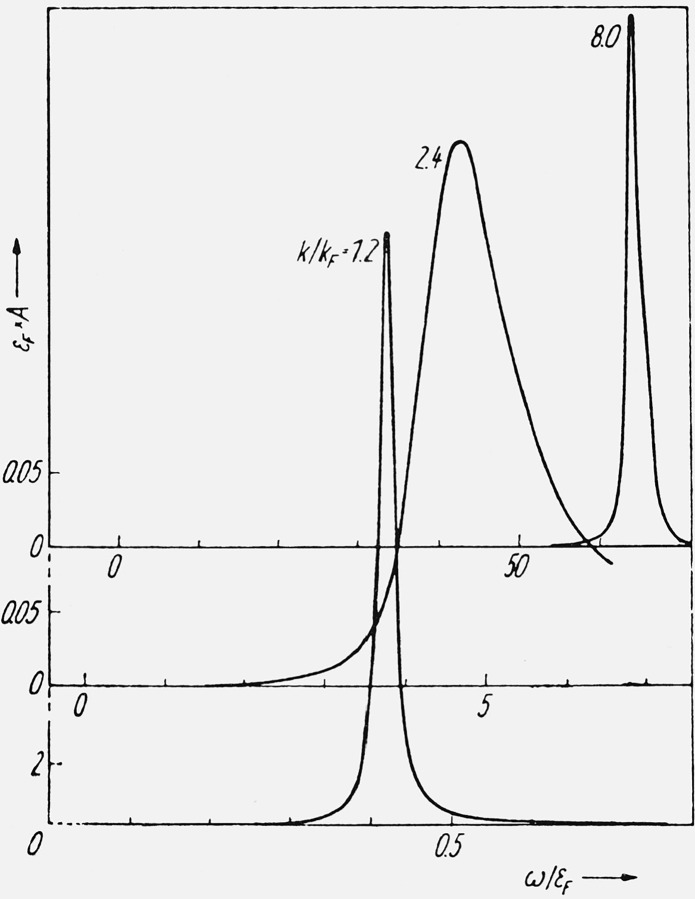
Because of the plasma resonance in the dielectric function there will be a rapid variation in the real part of Σ at the frequency ω = ϵ(k) + ωp for electrons and at ω = ϵ(k) − ωp for holes. This behavior of the electron gas seems to have been first noticed and discussed by Hedin et al. [23] and has been studied in great detail by Lundqvist [13,21]. Typical curves for Σ obtained with this dielectric function are shown in the upper half of figure 2. In the lower part of figure 2 we have given the results for A(k,ω) calculated from eq (27).
Figure 2.
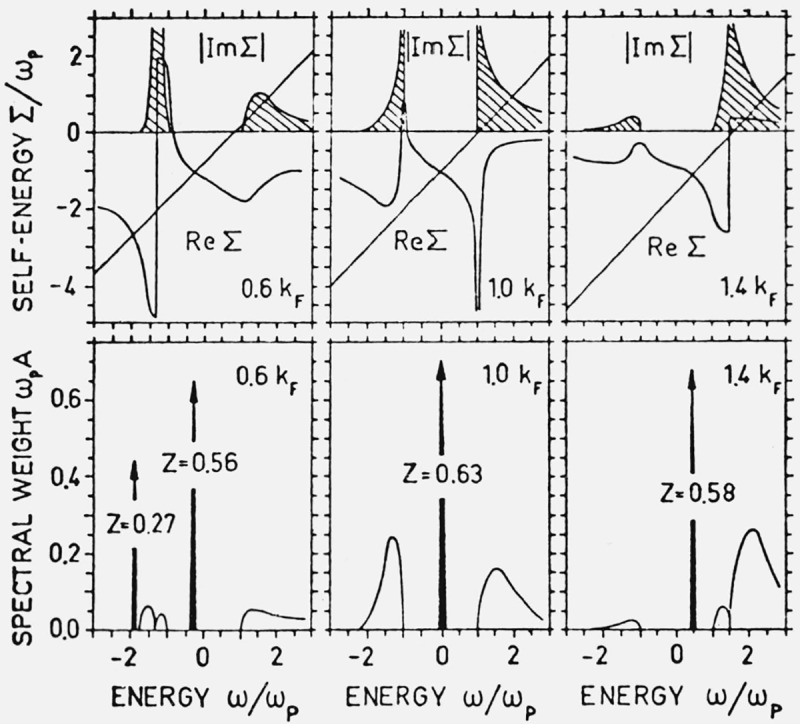
The self-energy Σ and the corresponding spectral function A for rs = 5 [21]. The crossings between the Re Σ curves and the straight lines give the solutions to the Dyson equation. The numbers at the peaks indicate the strengths of the lines.
For k = kF there is only one strong peak in the spectral function, corresponding to the usual quasi particle. For the other k-values in the figure, we find three solutions of the Dyson equation
| (33) |
One of them, however, falls at ω = ϵ(k) ± ωp, where the damping is very strong, and therefore this solution is effectively suppressed. Of the two remaining solutions, one corresponds to the usual quasi particle, i.e. a bare electron surrounded by a cloud of virtual plasmons and electron-hole excitations. For hole states, i.e. for k < kF, a new state appears which has an energy lower than that corresponding to a hole plus a plasmon, i.e. ϵ(k)− ωp. This result from a low order treatment corresponds to a coherent state of hole-plasmon pairs, and may be thought of as holes coupled to real plasmons. This coupled state, which has been called a plasmaron, has a large oscillator strength, and thus gives an essential contribution to the sum rule for the one-electron spectrum. For electron states, k > kF, there is no sharp state but a broad resonance with a sharp onset at ω = ϵ(k) + ωp.
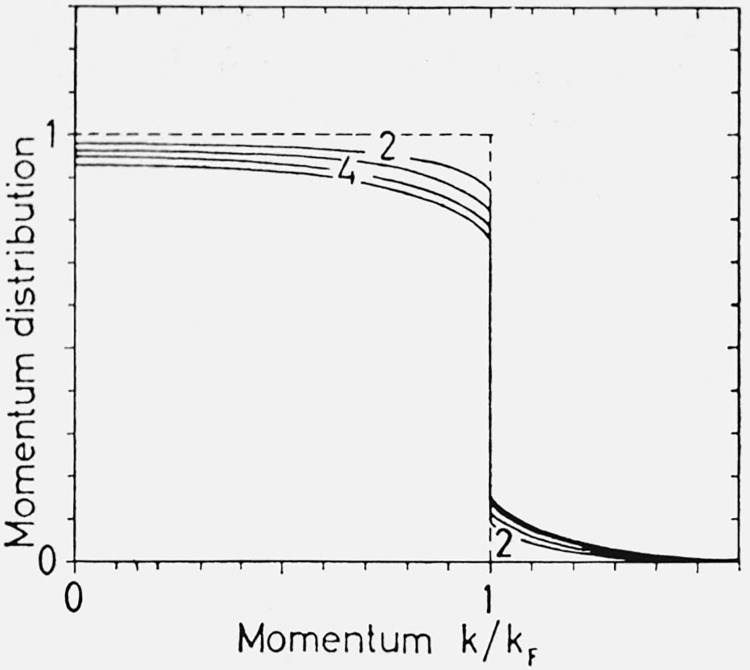
Figure 3 illustrates how the parabolic quasi particle dispersion law is accompanied by a second branch of the spectrum, the plasmaron. In figure 4 the momentum distribution function for the interacting electrons is given.
Figure 3.
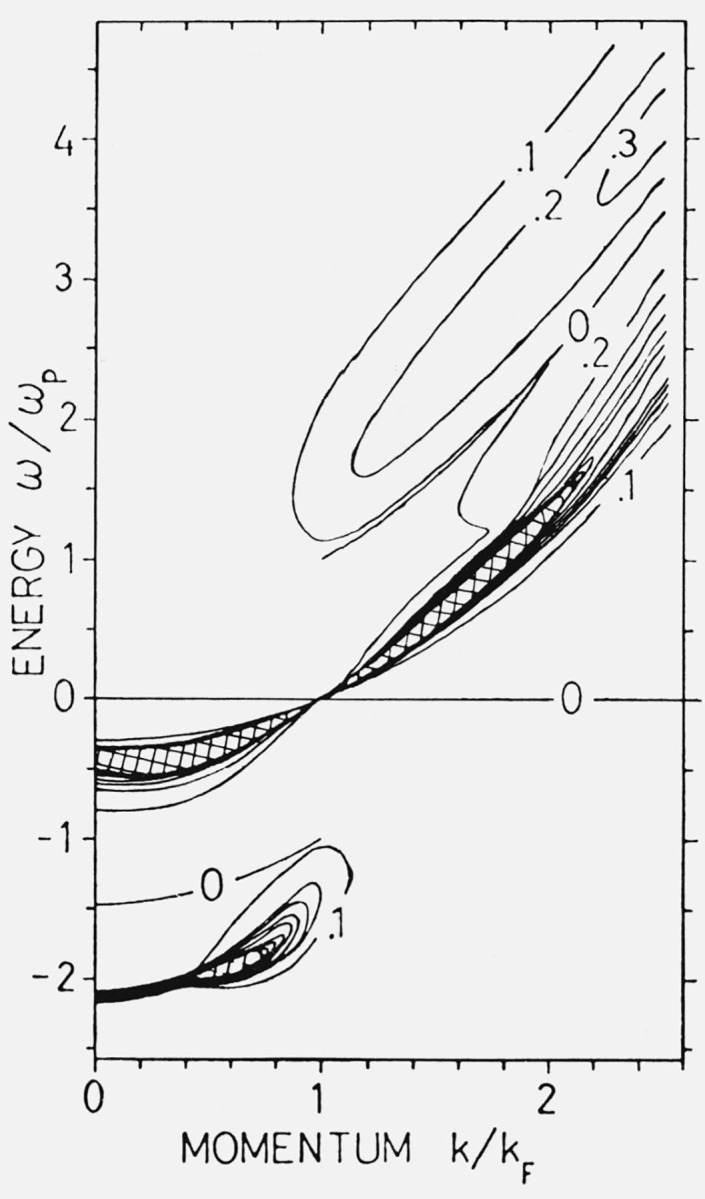
The spectral weight function A(k,ω) given by level curves indicating the value of ℏωpA, at rs = 4 (ℏωp = 0.435 Ry) [13].
Figure 4.
The momentum distribution function n(k) at rs = 2,3,4 and 5 [13].
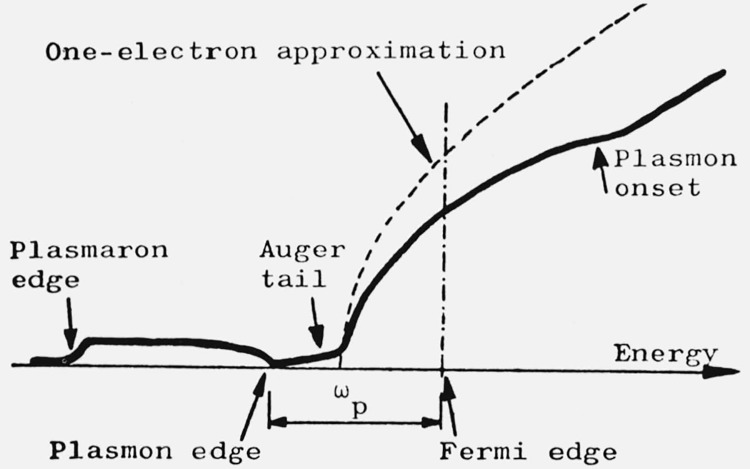
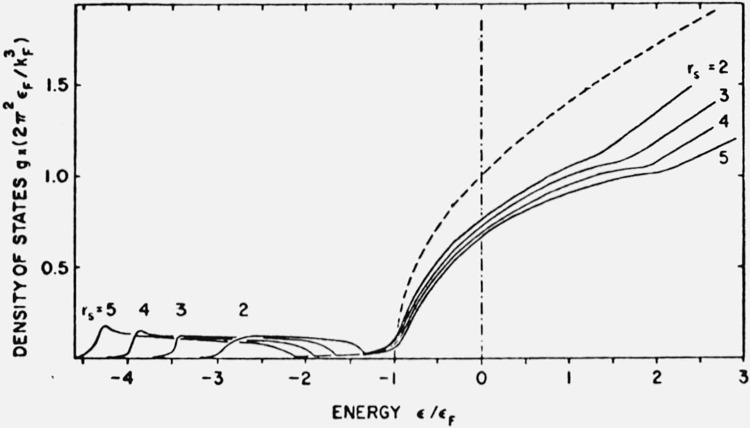
The characteristic structure due to plasmon effects will modify the density of states. This is demonstrated schematically in figure 5. The conduction band will retain approximately its parabolic shape. At an energy ωp below the Fermi edge there is the onset of the second band due to the plasmaron states. This band is terminated at low energies with a rather distinct edge. For unoccupied states there is an extra contribution to the density of states starting at an energy ωp above the Fermi level. Figure 7 gives a survey of the density of state curves at four different values of the electron gas parameter rs (rs = 2 corresponding roughly to the electron density of Al, and rs. = 4 to that of Na).
Figure 5.
Density of states for conduction electrons.
Figure 7.
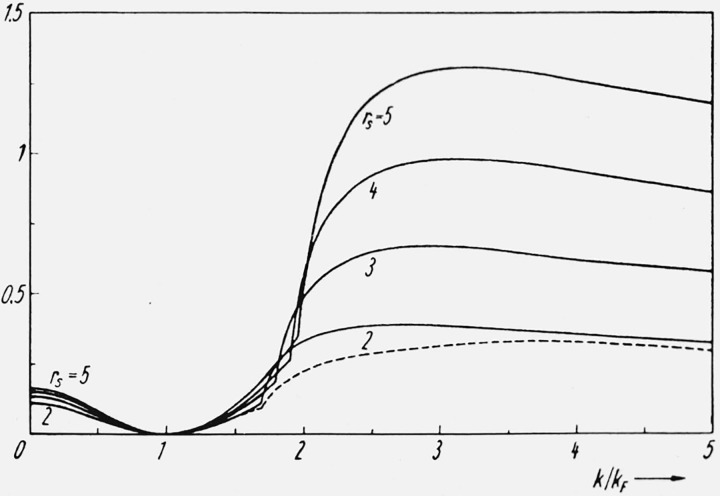
The imaginary part of the quasi-particle self-energy Im Σ(k,ϵ(k))/EF as a function of the momentum k of the electron at different metallic densities (EF = 0.921, 0.409, 0.230, and 0.147 Ry at rs = 2, 3, 4 and 5, respectively). The dashed curve is Quinn’s result at rs = 2 [10,13].
So far we have discussed the gross effects due to the coupling between electrons and plasmons. These are quite well represented by the plasmon-pole approximation for the dielectric function in eq (31). Electron-hole pair excitations are however not included, to represent them we must turn to the LTH dielectric function or higher approximations. These excitations are responsible for the broadening of the quasi particle peak and the Auger tail at the bottom of the main band in figures 5 and 7 as well as the broad spectral weight contours in figure 3.
Figure 6 shows ΣI(k,ϵ(k)) calculated from (eq 28) and is an indication of the high damping rate for quasi particles with k greater than kF + kc, i.e., in the region where they can decay into plasmons [10,24]. However, as illustrated by the typical spectral forms for the quasi particle peak in figure 8, the quasi particle peak is always distinguishable from the spectral background, its width Γ(k) is smaller than its excitation energy E(k) − μ.
Figure 6.
The density of states for the values of the electron gas parameter rs = 2, 3, 4, 5. The dashed curve is the result of the one-electron theory, and the vertical broken line indicates the Fermi level [13].
Figure 8.
Typical spectral forms for the quasi-particle peak of the spectral weight function in different momentum regions. The scales are different for the three curves, the energy ω is measured from the Fermi level μ, and the curves are drawn for rs = 4 [24].
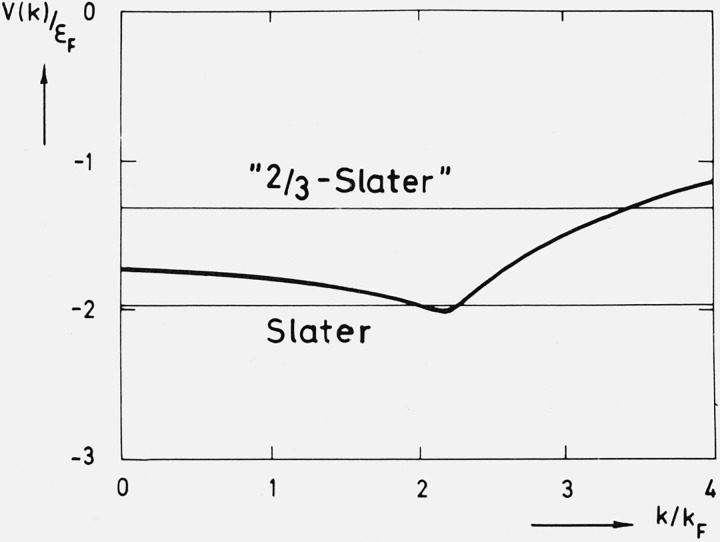
From eq (28) one can also draw information about the exchange and correlation “potential” for the quasi particles. The inadequacy of the Hartree-Fock approximation in a metal is well-known, and in band calculations the effects of exchange and correlation are commonly simulated by using a local potential, such as the Slater [25] or the Caspar [26,27] expressions. After solving the Dyson equation one can write the resulting quasi-particle energy in the form
| (34) |
where V(k) can be interpreted as an effective exchange and correlation potential. In figure 9 such a potential is shown. It has a remarkably weak k-dependence for moderate wave vectors, its value lying roughly halfway between the Slater [25] and “2/3 Slater” values [26,27].
Figure 9.
Exchange-correlation potential for an electron gas at rs = 4 compared with the Slater and the Gáspár (2/3 Slater) approximations [28].
One of the shortcomings of the Hartree-Fock approximation is its prediction of a large bandwidth. The width of the occupied part of the main band deduced from eq (28) is practically the same as the Hartree value ϵ(kF), a result which is in accord with the experimental findings.
For large momenta (k ≳ kF + kc) there is a characteristic k-dependence of V(k), which might influence properties of electrons involved in photoemission and LEED experiments. It is not clear, however, how much of this structure that may be observed due to the short-lifetime of the electrons at these energies.
We want to stress again that the discussion we have given of the one-electron spectrum is based on the assumption that vertex corrections are small. As discussed in the next section recent work by Langreth [29] shows that vertex corrections in the core electron problem can have a quite large effect on the form of satellite structures, while their effect on the quasi particle properties seems to be small. Preliminary investigations by one of us (L.H.) show similar strong vertex effects on the conduction band satellite. The details of the plasmaron structure should thus not be taken very seriously.
The quasi particle states close to the Fermi surface are of particular interest due to their importance for thermal and transport properties [30]. To study these problems the quasi particle density of states or density of levels rather than the one-electron density of states is of importance. Because of interactions the quasi-particle dispersion law is distorted, corresponding to the well-known mass enhancement at the Fermi surface. The corrections to the free-electron mass m due to the electron-electron interaction, as derived from eq (28), are small [11,12], e.g. δme/m ≈ −.01 for Al and δme/m ≈ .06 for Na, and the properties of the quasi particles close to the Fermi surface are dominated by the electron-phonon interaction.
The effects of the electron-phonon interaction on the quasi-particle dispersion law follow in a straightforward way using perturbation theory in the Brillouin-Wigner form, thus
| (35) |
In this equation gk−p is the matrix element for the electron-phonon coupling and ω(k − p) the phonon frequency.
The qualitative effect of the phonons is to flatten out the dispersion curve in the immediate neighborhood of the Fermi surface, and this gives rise to the enhancement of the density of states (fig. 10), or, equivalently, of the thermal effective mass and one obtains from eq (35)
| (36) |
where N0(EF) is the density of states without electron-phonon interaction, ∣p∣ = ∣k∣ = kF and the integration extends over the full solid angle.
Figure 10.
Density of quasi-particle levels for Na at T = 0°K [31].
Ashcroft and Wilkins [32] first calculated the corrections for Na, Al and Pb using eq (36), and several similar calculations have been published over the last few years. The most accurate values of λ are those deduced from tunneling data by McMillan and Rowell [33]. For example, the two methods give the values λ = 0.49 and 0.38, respectively, for Al; λ = 1.05 and 1.3, respectively, for Pb.
It is obvious that the enhancement varies with temperature and that no enhancement is left at high temperatures, where the phonon system behaves like a fluctuating classical medium.
Similarly to the case of electron-electron interaction the electron-phonon interaction gives a characteristic structure to the spectral function. Engelsberg and Schrieffer [34] pointed out that in the neighborhood of the Fermi surface the quasi particle picture will no longer apply. They calculated the spectral function for an Einstein model and for a Debye spectrum and obtained a spectral function with a very complex structure in the region close to the Fermi surface. For sodium no dramatic effects occur because of the rather weak electron-phonon interaction [31].
We conclude this section by noting that inclusion of dynamical and exchange effects, in particular consideration of the electron-electron interaction tells us why the one-electron theory works so well in explaining many gross features of metals and what limitations it has. However, at least in a low-order treatment there are also new structures introduced by the interaction, schematically characterized as due to the resonant coupling between electrons and plasmons. In Section 5 we will discuss possibilities to observe this structure.
4. One-Electron Spectrum of Core Electrons
The preceding discussion has emphasized the strong effects of the electron-plasmon coupling on the spectrum of conduction electrons. Similar strong effects occur in the spectra of core electrons. For simplicity we limit the discussion to simple metals with small cores, so that the core electrons can be physically distinguished from the valence electrons and be well localized to a particular ion. The wave function of a core electron depends only weakly on the state of the outer electrons. The energy levels on the other hand are shifted by an appreciable amount compared to the corresponding atomic levels, typically of the order of 5 to 10 eV, which is large on the scale of valence electron energies but is a small relative change in the energy of a core electron. The core shifts can be measured accurately by the method of x-ray photoemission spectroscopy as well as by x-ray absorption and inelastic scattering of fast electrons.
The shift of the quasi particle energy of a core electron comes partly from changes in the average Coulomb field, partly from polarization effects. The Coulomb shift is due to the different valence charge distribution relative to that in a free atom. It generally results in a decrease of the binding energy. The polarization shift comes from the relaxation of the valence charge distribution around the hole created when we remove the electron. The valence electrons are drawn in towards the positive hole in the ion. This effect decreases the binding energy by half of the change in the Coulomb potential calculated at the core site, i.e. precisely the amount obtained if we calculate the self-energy of the hole using electrostatics. The shift in the core energy thus contains information about the valence electron distribution and polarizability, measured with the core electron as a probe. Theoretical calculations for simple metals (Li, Na, K, Al) are in very good agreement with the experimentally observed peaks in the XPS spectra [35].
In analogy with the strong effects of the interaction between particles and plasmons previously discussed, there is a corresponding coupling between a hole in the core and the density fluctuations of the conduction electrons. This leads to a strong structure in the core electron spectrum [36].
We assume for simplicity that we can neglect the spatial extension of the core electron wave function. Calculation of the self-energy to lowest order in the screened interaction gives the formula
| (37) |
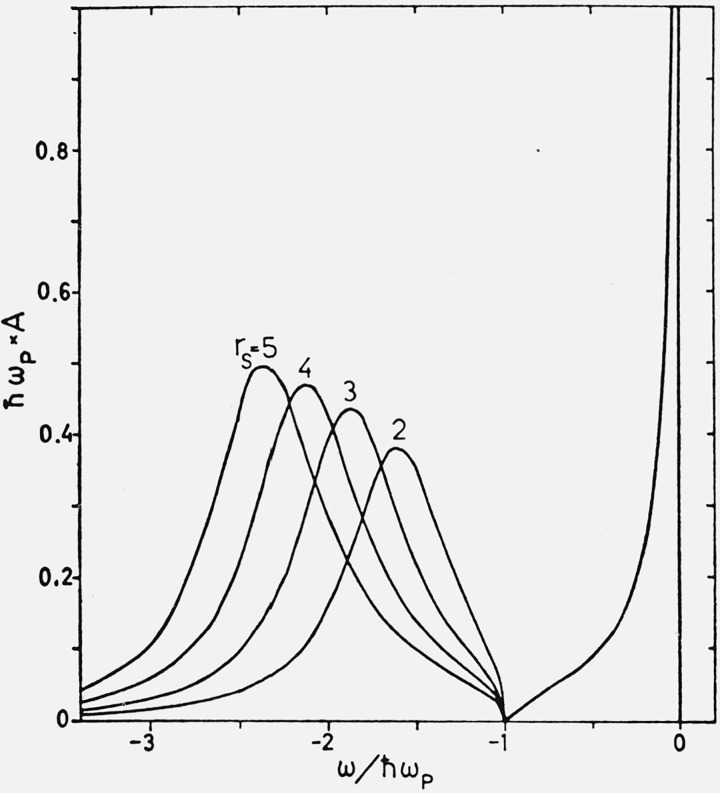
where ϵn is the core quasi-particle energy. Remembering that ϵ−1(q, ω) has a strong resonance in the plasmon regime, we see that after integration over the frequency, the self-energy will show a resonance behavior in the energy region ϵ ≃ ϵn − ωp. This rapid variation will give rise to two solutions of the Dyson equation. The second solution, however, gives a quite broad peak in the spectral function. The results for different densities of the electron gas are illustrated in figure 11. The spectrum is measured from the shifted quasi particle energy, i.e. the zero of energy corresponds to complete relaxation of the electrons around the hole.
Figure 11.
Quasi-particle peak in the spectral function for a core electron and the associate plasmon satellite structure for different densities of the conduction electrons, measured by the electron gas parameter rs [36].
We summarize the characteristic features of the core spectrum
A large polarization shift of the core quasi particle level.
The shape of the spectrum is independent of the core level considered. This results from neglecting the actual size of the core wave function.
A pronounced satellite structure, which starts at ω = − ωp and has a broad peak.
An extended tail on the low energy side of the quasi-particle peak. This tail is due to the coupling between the hole and screened electron-hole pair excitations, and corresponds to states of the whole system involving two holes, one in the core and one in the conduction band plus one excited electron above the Fermi sea.
There is an appreciable reduction of the spectral strength of the quasi particle. Approximately half of the spectral strength corresponds to excitations close to the quasi particle state and approximately the same strength corresponds to high excitations of the conduction electrons as described by the broad satellite structure.
As discussed in Section 2 the spectral function has the form (cf. eq (16))
| (38) |
and shows a powerlaw singularity at the Fermi edge. The first order theory correctly predicts a singularity but of a somewhat different form, namely (ωln2ω)−1.
The core electron spectrum can be obtained exactly if we use a simple model Hamiltonian
| (39) |
Here a+ is the creation operator for a core electron of energy ϵ and bq+ the creation operator for a plasmon of energy ωq. The exact solution of this problem has been given by Langreth [29], and we now give a brief account of his work, which also shows the close resemblance of the problem to the Mössbauer or the impurity-phonon problem.
The self-energy Σ in this model is given by the sum of all diagrams where the core electron is dressed with plasmons (fig. 12). For the true Hamiltonian including all electron-electron interactions we have the same set of diagrams, where the plasmon propagator is replaced by a screened interaction v(q) ϵ−l (q,ω). Except for the first diagram the bare Coulomb potential gives no contribution (the hole propagates in only one direction) and we can thus replace ϵ−1 by (ϵ−1 − 1). By choosing the dielectric function in eq (31) and the coupling
| (40) |
the plasmon diagrams and the screened interaction diagrams become the same. The core Green function
| (41) |
can be written as (cf. eq (38))
| (42) |
where ∣0〉 is the plasmon vacuum state and is the Hamiltonian for the plasmon in the presence of the core hole,
| (43) |
A canonical transformation shifts the zero point of the plasmon vibrations, thus
| (44) |
where
| (45) |
We may hence write
| (46) |
where
| (47) |
Figure 12.
Diagrams for the core electron self-energy.
By applying the well-known formula
| (48) |
repeated times the exact solution follows,
| (49) |
This gives for the spectral function
| (50) |
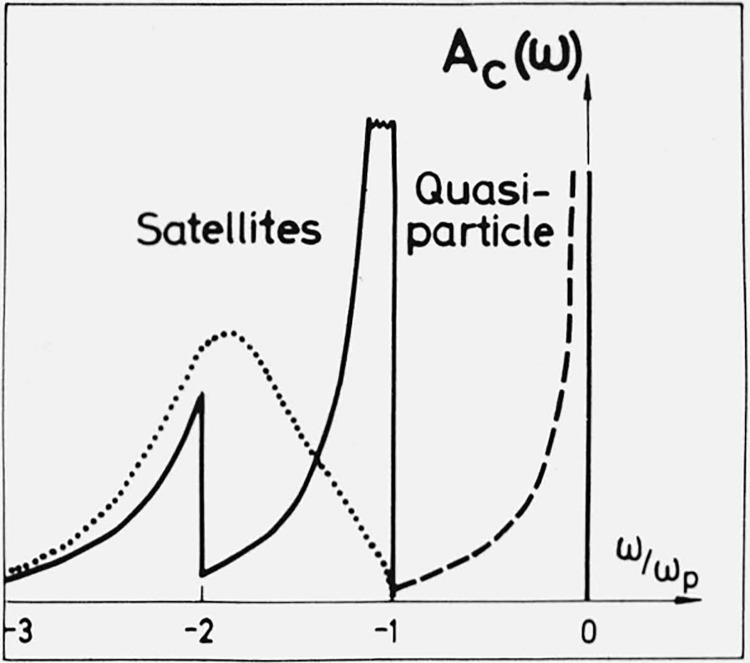
To compare the first order results (the first diagram in fig. 12) with the exact solution we have used the simple dispersion law ωq= ωp+ q2 (in units of the Fermi energy and the Fermi momentum), which allows an analytic solution. The result for the electron density of sodium metal (rs = 4) is given in figure 13.
Figure 13.
Comparison of the first order (dotted line) and the exact result (full curve) for the core spectral function from the model Hamiltonian in eq (39). In this model the quasi-particle peak is a δ-function. The dashed curve indicates a more realistic form of that peak. The results are for rs = 4.
Since the dielectric function in eq (31) contains no particle-hole pairs, the quasi particle peak is a δ-function. A more realistic shape of the peak is indicated in the figure. The exact solution has structure also at −3ωp, −4ωp, etc., which is not shown in the figure. This structure, however, has weak edges and carries only a few percent of the oscillator strength.
Comparing the results of the first order calculation and the exact solution we note:
The energy shift Δϵ is exactly the same.
The oscillator strengths in the satellites are closely the same.
In the exact solution the satellite has two marked peaks instead of one, and the peaks are sharper.
The large difference between the first order result and the exact solution for this model case should be a warning against taking the details of a low order calculation too seriously. Knowing the importance of the higher order diagrams in this case one may ask if not other higher order diagrams, like those of the paramagnon problem, may play a role also for the core spectrum. Finally, it should be stressed that while the satellite structure may be poorly accounted for in the first order theory, the position and singular nature of the quasi particle are quite well represented.
5. Qualitative Discussion of Some Experiments
We shall discuss some different types of experiments utilizing the connections with the one-electron spectrum discussed in Section 2 and the results from the approximate calculations reported in sections 3 and 4. We can really not put forward much more than guesses about where many-body effects may possibly occur. The difficulty is that the predictions by the one-electron approximation have seldom been worked out in enough detail to give reliable level densities and matrix elements, and this knowledge is required both to evaluate the many-body effects per se as well as to find out how much of the experimental structure that is accounted for by the one-electron approximation. Also the experimental data are sometimes not as accurate and reliable as one would need. Thus surface conditions are often not under good enough control, background effects are poorly known and disturbing secondary effects are not carefully analyzed and subtracted.
The discussion will neglect the effects of final state interactions between the electron and hole. This means that the treatment is a simple extension of the usual theory for interband transitions in which the density of states for electrons and holes in band theory is replaced by the corresponding quantities including many-electron interactions as illustrated in figures 7, 11, and 13. Although certainly of restricted validity it seems that the predictions of such an approach are worthwhile to summarize.
5.1. X-Ray Photoemission (XPS)
This experiment has a fairly clearcut relation to the one-electron spectrum. Ideally the energy distribution of photoelectrons will be given by eq (15). However, this equation is valid only if the photoelectrons leave the solid without being scattered. Structure due to satellites in the density of states will thus be mixed with structure due to energy losses.
The losses to volume excitations are proportional to the sample thickness, while the intensity of the satellite structure in the one-electron spectrum has a definite relation to the intensity of the quasi particle peak. Thus by varying the sample thickness one should be able to separate the two kinds of processes.
Theory predicts an asymmetric form of the core-quasi particle peak [4,5,6,29,36,37] and satellite structure starting at ωp below the main peak. According to the Langreth model solution there should be two satellites also with an asymmetric line shape (cf. fig. 13), while the first order theory predicts the satellite in figure 11. There should be a satellite structure in the conduction band, as well. Even if the exact shape of this structure might differ from the results of the low-order theory discussed in Section 3, the total intensity of the satellite band should be appreciable.
An experimental verification of the many-body structure would be of great aid for the further development of the theory. As regards the position of the core levels there seems to be a good agreement between theory and experiments but further experimental and theoretical work on this problem would help to clarify how point defects polarize and distort their surroundings.
5.2. Soft X-Ray Emission
We consider only the simplest possible case where we can assume complete relaxation of the Fermi gas around the hole before the emission takes place. This limits the approximate validity to the light metallic elements such as Li, Be, Na, Mg, Al and K and excludes e.g. all transition metals.
Through the recent work by Nozières and de Dominicis and others [4–6] the possibility of a singular structure at the Fermi edge seems to be well established. The magnitude of this Fermi edge peak and the influence of this effect on the intensity at energies outside the immediate vicinity of the edge is however so far unsettled, although important progress has been made [38]. As regards the main band it is clear that the presence of the core hole will give an enhancement of the intensity [1]. The actual magnitude of this enhancement factor and its variation over the main band is so far not well-known. To obtain the one-electron density of states in the main band from experiments seems to require both careful calculations of dipole matrix elements and better estimates of the enhancement factor.
Below the main band the edge for plasmon production is well established experimentally [1,39]. The intensity of the satellite structure is strongly affected by intricate cancellation mechanisms due to the presence of the core hole and the theoretical predictions are uncertain. The plasmaron edge (cf. figs. 5 and 7) has been searched for in Al, but the experiment was not conclusive [40]. As discussed in Section 3, it is not clear whether this edge is a feature of an exact solution of the problem or just a result of the low order treatment. A clear experimental confirmation or dismissal would be of great aid for the further study of these many-body effects.
5.3. X-Ray Absorption
Consideration of these experiments requires a treatment of final state interactions but in the absence of a detailed theory for these we shall here take a simple point of view and treat the structure in the one-electron spectra as additional levels or groups of levels in a one-electron scheme. A similar discussion of plasmon effects in x-ray absorption in metals was given by Ferrell [41]. Due to the presence of satellite structure in both core and conduction band spectra there should be a characteristic structure above the threshold [36].
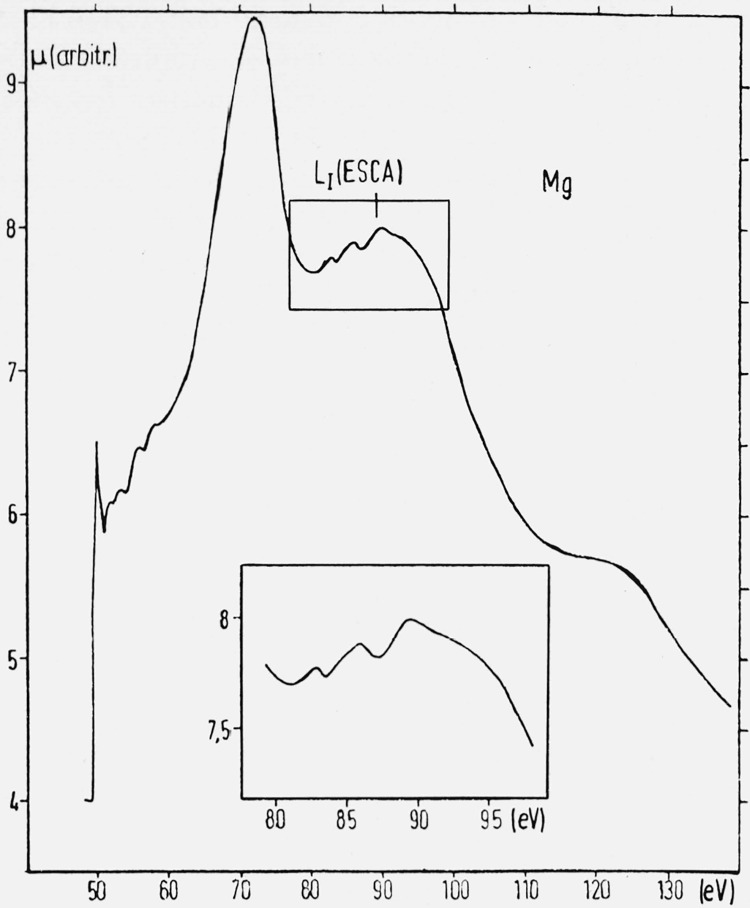
Accurate x-ray absorption spectra for simple metals have recently [42] been obtained, which show an edge anomaly very similar to what one may expect from the Mahan exciton effect [4–6]. The fine structure of the absorption coefficient for the LII,III transition in magnesium is shown in figure 14 [43]. Immediately above the edge there is more detailed structure which possibly could be due to ordinary band structure effects in the final state.
Figure 14.
The fine structure of the absorption coefficient for the LII,III transition in magnesium [43].
At still higher energies comes a strong peak [43–45]. We will argue that this peak may be a many-body effect. In table 1 we give results for the positions of the peaks measured from the threshold [43], and compare with the position of the core plasmaron peak discussed in Section 3 (cf. fig. 11). There is good agreement for aluminum but not for the other metals.
Table 1.
Position of the strong peak in soft x-ray absorption and comparison with the location of the satellite peak (ϵpm) in figure 11.
| Element | rs | ∈peak, eV | ∈peak/ωp | ∈pm/ωp |
|---|---|---|---|---|
| Al | 2.07 | 24 | 1.6 | 1.7 |
| Mg | 2.66 | 22 | 2.1 | 1.8 |
| Na | 4.00 | 18 | 3.2 | 2.1 |
The important point, however, is that ϵpeak/ωp is a very smooth function of the electron density. Actually its value is closely 0.8 rs in all cases. This indicates that the peak is associated with properties of the electron gas rather than being due to oscillator strength effects. The latter would be connected with the properties of the ion core and there is then no obvious reason to expect a regular variation with the conduction electron density. The position of the plasmaron peak should be given better at higher densities and the discrepancy with experiment at lower densities is in no way alarming. More serious is the fact that Langreth’s calculation has shown the higher order effects to be strong. The strong peak could of course also be due to many-body effects involving final-state interactions.
5.4. Photoemission in the Ultraviolet
The basic mechanisms of the photoemission process are still not well understood. It may be regarded in one extreme as a pure surface effect and in another as a pure volume effect. In the latter case we have to account for the very important inelastic scattering effects of the outgoing photoelectrons. If the surface effects are not too strong, and if we can sort out the inelastically scattered electrons, the photoemission results in the ultraviolet should reflect structure due to the satellite band of the conduction electrons. There is some hint of such a structure in the recent results for cesium [46] (fig. 15) at an energy of about 4 eV below the Fermi edge. However, the structure could also be due to a loss of two surface plasmons [46].
Figure 15.
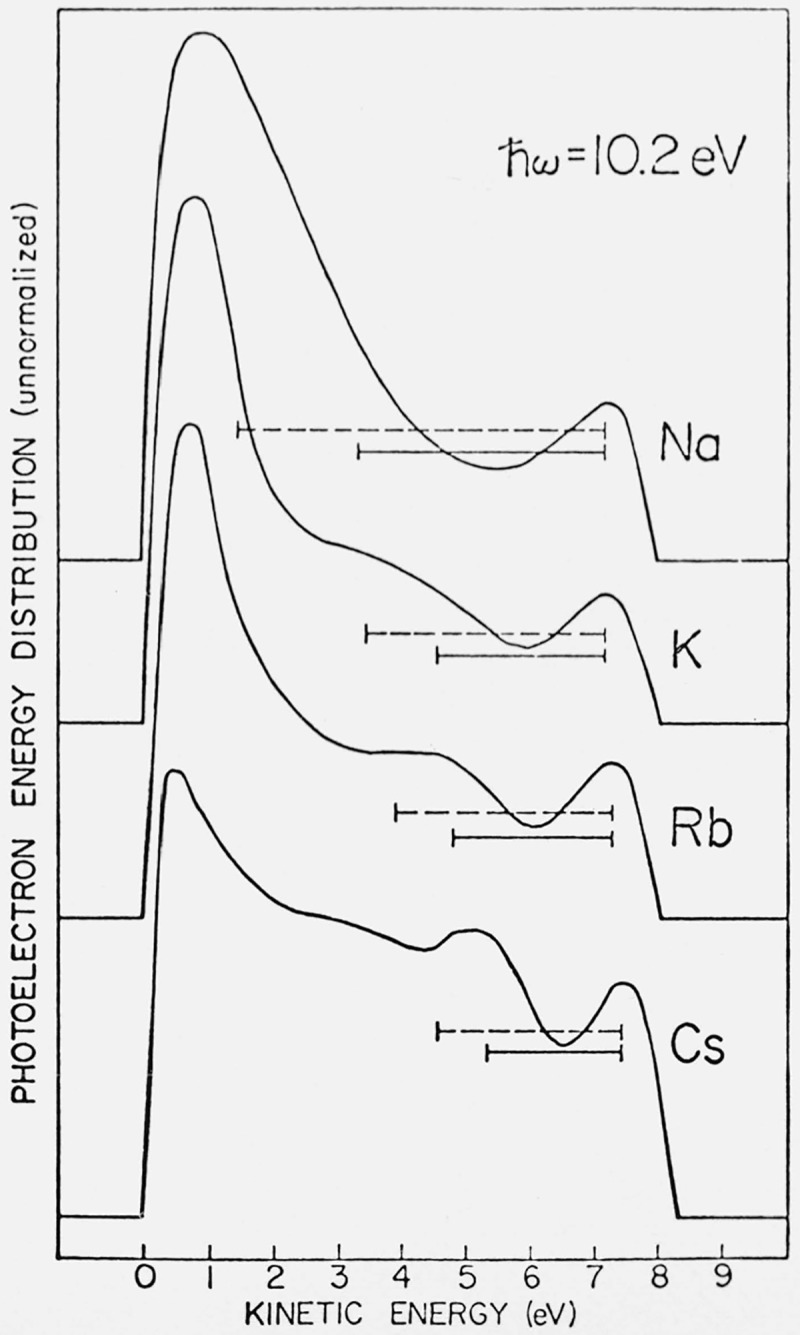
Photoelectron energy distribution curves at hω = 10.2 eV for Na, K, Rb and Cs [46]. The horizontal bars indicate the values of the surface (full curve) and volume (dashed) plasmons.
5.5. Optical Absorption in the Ultraviolet
The description of optical properties of metals in terms of Drude (see e.g. refs 47,48) and interband contributions is often in qualitative agreement with experiment. To go beyond that description we need to know the dielectric function including final state interactions. The many-body effects may show up as changes in intensity and as new structures. Attempts to account for the former have been made e.g. by Mahan [49], who considered the contributions from virtually exchanged plasmons. Absorption caused by electron gas effects has been considered by Hopfield [50]. He observed that while the electron gas by itself cannot absorb radiation the effect of a weak perturbing potential from phonons or disorder is enough to provide the necessary momentum conservation for the absorption process and thus allow the plasmon resonances of the electron gas to show up.
A straightforward way to extend the one-electron joint density of states expression is to make a convolution of the spectral weights of occupied and unoccupied states. This has been done for semiconductors by Bardasis and Hone [51] who in addition considered vertex corrections. They obtained improved agreement with experiment. Calculations for metals by the convolution approximation indicate the existence of a plasmon-induced structure at photon energies above Eg + ωp [52], where Eg is the interband threshold energy. There are some experimental indications of structure beyond the ordinary interband absorption in this energy region.
5.6. The Compton Effect
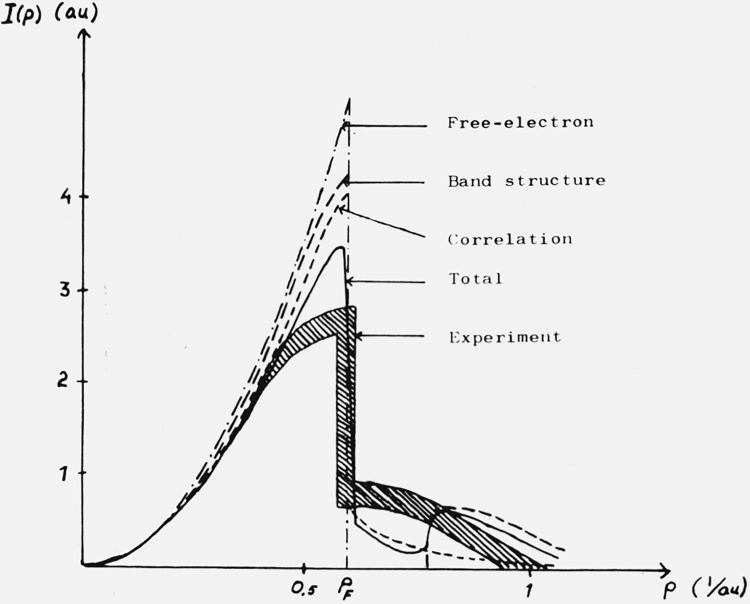
X-ray scattering from an electron gas in the regime of large momentum transfer is a direct measure of the one-dimensional momentum distribution [53]. From recent measurements of the Compton profiles of Li, Na and Al the linear momentum distribution has been derived [54]. The result for Li is shown in figure 16.
Figure 16.
In Section 3 approximate values of the momentum distribution for an electron gas have been shown (fig. 4). The corresponding linear momentum distribution shows a too small reduction compared to the free-electron case to reproduce the experimental results for Li (fig. 16) and Al, while for Na the electron gas curve falls almost entirely within the experimental region.
As band structure effects could be expected to be more important in Li and Al than in Na, this kind of correction has also been calculated using the OPW method [55]. As shown in figure 16 these effects reduce the discrepancy, even if a quantitative agreement has not been obtained.
This kind of experiment provides a way of illuminating another aspect of the distribution of electrons in metals and provides a useful way of checking theoretical models including many-body interactions.
6. Concluding Remarks
This paper has presented a discussion of the possible nature of many-electron effects on the density of states. It is based on a study of the one-electron spectrum including interactions and points out the existence of characteristic satellite structure in the density of states of electrons and holes in simple metals. Considering the joint density of states of electrons and holes as in the theory of interband transitions certain predictions about possible effects in x-ray and optical spectra can be made. All this material is however only qualitative and tentative. The structure in the one-particle spectrum has been calculated in low order and considerable changes may result by including higher-order effects. Further, the convolution of the electron and hole spectrum implies neglecting the final state interaction between the electron and the hole. The final state interactions may partly cancel out the structure in the electron and hole spectrum, and it leads to characteristic new effects such as edge singularities, and of course also gives an overall distortion of the spectrum. With all these reservations, however, the discussion points out the existence of a number of possible interesting effects which offer a challenge for further study. In assessing the possibility of pursuing this approach to obtain quantitative theoretical results one has to consider critically the present state of the art with regard to ordinary band theory. Indeed, rather little has yet been done in a quantitative way to calculate spectra especially with regard to oscillator strengths. Such more detailed knowledge from energy band calculations also forms a necessary prerequisite for making quantitative statements about many-electron effects.
Footnotes
An invited paper presented at the 3d Materials Research Symposium, Electronic Density of States, November 3–6, 1969, Gaithersburg, Md.
7. References
- [1].For a general review, see Hedin L.and Lundqvist S., Solid State Physics 23, (Seitz F., Turnbull D.and Ehrenreich H., Editors (Academic Press, New York, 1969). [Google Scholar]
- [2].Hedin L., in “Soft X-Ray Spectra and the Electronic Structure of Metals and Materials,” Fabian D., Editor (Academic Press, New York, 1968). [Google Scholar]
- [3].Anderson P. W., Phys. Rev. Letters 18, 1049 (1967). [Google Scholar]
- [4].e.g., Mahan G. D., Phys. Rev. 163, 612 (1967): Bergersen, B., and Brouers, F., J. Phys. Chem. 2, 651 (1969); Mizuno, Y., and Ishikawa, K., J. Phys. Soc. Japan 25, 627 (1968). [Google Scholar]
- [5].Nozières P., and de Dominicis C. J., Phys. Rev. 178, 1097 (1969). [Google Scholar]
- [6].Langreth D. C., Phys. Rev. 182, 973 (1969). [Google Scholar]
- [7].Longe P., and Glick A. J., Phys. Rev. 177, 526 (1969). [Google Scholar]
- [8].Nozières P., Theory of Interacting Fermi Systems (W. A. Benjamin, Inc., New York: 1964). [Google Scholar]
- [9].Quinn J. J., and Ferrell R. A., Phys. Rev. 112, 812 (1958). [Google Scholar]
- [10].Quinn J. J., Phys. Rev. 126, 1453 (1962). [Google Scholar]
- [11].Rice T. M., Ann. Phys. (N.Y.) 31, 100 (1965). [Google Scholar]
- [12].Hedin L., Phys. Rev. 139, A796 (1965). [Google Scholar]
- [13].Lundqvist B. I., Phys. Kondens. Materie 7, 117 (1968). [Google Scholar]
- [14].Lindhard J., Dan. Math. Phys. Medd. 28, No. 8 (1954). [Google Scholar]
- [15].Hubbard J., Proc. Roy. Soc. A243, 336 (1957). [Google Scholar]
- [16].Wick A. J., Phys. Rev. 129, 1399 (1963). [Google Scholar]
- [17].Geldart D. J. W., and Vasko S. H., Can. J. Phys. 44, 2137 (1966). [Google Scholar]
- [18].Singwi K. S., Tosi M. P., Land R. H., and Sjölander A., Phys. Rev. 176, 589 (1968). [Google Scholar]
- [19].Kleinman L., Phys. Rev. 172, 383 (1968). [Google Scholar]
- [20].Langreth D. C., Phys. Rev. 181, 753 (1969). [Google Scholar]
- [21].Lundqvist B. I., Phys. Kondens. Materie 6, 193 (1967); 6, 206 (1967). [Google Scholar]
- [22].Hedin L., Lundqvist B. I., and Lundqvist S., Intern. J. Quantum Chem. IS (1967) 791. [Google Scholar]
- [23].Hedin L., Lundqvist B. I., and Lundqvist S., Solid State Comm. 5, 237 (1967). [Google Scholar]
- [24].Lundqvist B. I., Phys. Stat. Sol. 32, 273 (1969). [Google Scholar]
- [25].Slater J. C., Phys. Rev. 81, 385 (1951). [Google Scholar]
- [26].Gáspár R., Acta Phys. Hung. 3, 263 (1954). [Google Scholar]
- [27].Kohn W., and Sham L. J., Phys. Rev. 140, Al133 (1965). [Google Scholar]
- [28].Hedin L., Lundqvist B. I., and Lundqvist S. (to be published).
- [29].Langreth D. C. (to be published).
- [30].e.g., Pines D., and Nozières P., “The Theory of Quantum Liquids,” Vol. I, (Benjamin, New York: 1966). [Google Scholar]
- [31].Grimvall G., J. Phys. Chem. Solids 29, 1221 (1968); Phys. Kondens. Materie 6, 15 (1967). [Google Scholar]
- [32].Ashcroft N. W., and Wilkins J. W., Phys. Letters 14, 285 (1965). [Google Scholar]
- [33].McMillan W. L., and Rowell J. M., in “Superconductivity,” Parks R. D., Editor (Dekker, Inc., New York, 1969). [Google Scholar]
- [34].Engelsberg S., and Schrieffer J. R., Phys. Rev. 131, 993 (1963). [Google Scholar]
- [35].Hedin L., Ark. Fys. 30, 231 (1965). [Google Scholar]
- [36].Lundqvist B. I., Phys. Kondens. Materie 9, 236 (1969). [Google Scholar]
- [37].Doniach S., and Sunjić M. (to be published).
- [38].Ausman G. A. Jr., and Glick A. (to be published).
- [39].Rooke G. A., Phys. Letters 3, 234 (1963). [Google Scholar]
- [40].Cuthill J. R., Dobbyn R. C., McAlister A. J., and Williams M. L., Phys. Rev. 174, 515 (1968). [Google Scholar]
- [41].Ferrell R. A., Rev. Mod. Phys. 28, 308 (1956). [Google Scholar]
- [42].Haensel R., Keitel G., Schrciber P., Sonntag B., and Kunz C. (to be published).
- [43].Haensel R., and Kunz C. (private communication). [Google Scholar]
- [44].Fomichev V. A., and Lukirskii A. P., Soviet Physics – Solid State 8, 1674 (1967); Sagawa, T., Iguchi, Y., Sasanuma, M., Ejiri, A., Fujiwara, S., Yokota, M., Yamaguchi, S., Nakamura, M., Sasaki, T., and Oshio, T., J. Phys. Soc. Japan 21, 2602 (1966); Codling, K., and Madden, R. P., Phys. Rev. 167, 587 (1968). [Google Scholar]
- [45].Watanabe H., J. Appl. Phys. 3, 804 (1964); Swanson, N., and Powell, C. J., Phys. Rev. 167, 592 (1968). [Google Scholar]
- [46].Smith N. V., and Spicer W. E., Phys. Rev. Letters 23, 769 (1969). [Google Scholar]
- [47].Nettel S. J., Phys. Rev. 150, 421 (1966); Miskovsky, N. M., and Cutler. P. H., Solid State Comm. 7. 253 (1969). [Google Scholar]
- [48].Haga E., and Aisaka T., J. Phys. Soc. Japan 22, 987 (1967). [Google Scholar]
- [49].Mahan G. D., Phys. Letters 24A, 708 (1967). [Google Scholar]
- [50].Hopfield J. J., Phys. Rev. 139, A419 (1965). [Google Scholar]
- [51].Bardasis A., and Hone D., Phys. Rev. 153, 849 (1967); see also Brust, D., and Kane, E. O., Phys. Rev. 176, 894 (1968). [Google Scholar]
- [52].Lundqvist B. I., and Lydén C. (to be published).
- [53].Platzman P. M., and Tzoar N., Phys. Rev. 139, A410 (1965). [Google Scholar]
- [54].Phillips W. C., and Weiss R. J., Phys. Rev. 171, 790 (1968). [Google Scholar]
- [55].Lundqvist B. I., and Lyden C. (to be published).


