

Abstract
The societal benefits of coral reef ecosystems include shoreline protection, habitat provision for reef fish, tourism, and recreation. Rarely considered in valuation of reefs is the considerable contribution of marine natural products (MNP) to both human health and the economy. To better understand the relation of MNP discovery with the characteristics and condition of coral reef ecosystems, we initiated a study to track the collection location and taxonomic identity of organisms that have provided pharmacological products. We reviewed collection information and associated data from 298 pharmacological products originating from marine biota during the past 47 years. The products were developed from 232 different marine species representing 15 phyla, and the 1,296 collections of these specimens occurred across 69 countries and seven continents. Our evaluation of the collection data was hampered by sundry observational and reporting issues, including imprecise location descriptions and omission of collection dates. Nonetheless, the study provides an important synopsis and appraisal of years of study and exploration by the marine natural product community. Understanding and quantifying the benefits of MNP discovery will depend upon improved reporting of collections, including accurate taxonomic identification, collection dates, and locations.
INTRODUCTION
Coral reef ecosystems are widely seen to provide numerous valuable ecosystem goods and services (EGS). Until recently, those EGS had not been sufficiently cataloged and quantified to be included in policy and decision-making assessments. To remedy this gap, the U.S. Environmental Protection Agency (EPA) prepared a series of reports that described and quantified these benefits to the extent possible. In preparing these reports, we observed that the pharmacological potential of marine natural products (MNPs) was rarely (if ever) included in policy or decision support documents, probably because assessors are generally unaware of the potential and no metric or predictive model exists for estimating that potential. Importantly, such a metric or model might be based on the condition or state of the ecosystem being assessed. To determine whether a plausible basis existed for creating such a pharmacological potential metric or model, we first had to establish where and when the specimens were collected that yielded MNPs with pharmacological potential (for which we used clinical status as a surrogate). This review provides that necessary foundation for future investigations seeking a predictor of pharmacological potential.
This perspective, the spatial distribution of collections, does not appear to have garnered much attention in the literature. There have been a few country-focused reviews (see below) and some work by Leal and colleagues1 to estimate trends in the discovery of new MNPs at the fairly aggregated levels of Exclusive Economic Zones (EEZ), Large Marine Ecosystems (LME), and Marine Ecosystems of the World (MEOW).2 Mukherjee and colleagues3 demonstrated the potential of depicting collection data in a geospatial system such as Google Earth, but their emphasis was on demonstrating the available tools and datasets.
Reviews related to MNPs tend to fall into two broad categories: (1) temporally based reviews that appear annually or biennially or cover a multi-year period; and, (2) topically based reviews that focus on a chemical family, a taxonomic group, a therapeutic use, a country, or some other categorical basis. Probably the best example of the first category are Faulkner’s annual reviews of newly isolated MNPs of pharmacological interest that began in 1984 and continued until his untimely death in 2002.4 Blunt and colleagues have continued this annual review.5 From 2003 to 2013, Hill published an annual review of the highlights of the MNP literature organized around the MNPs’ chemical structures and that focused on synthetic aspects.6 Mayer and colleagues published annual and biennial reviews of preclinical research on MNPs covering the period from 1998 to 2011, usually in two parts: one covering MNPs demonstrating anticancer potential and a second covering MNPs showing potential for all other therapeutic uses.7 Butler and colleagues have published periodic reviews of MNPs in clinical testing covering from the end of 2004 to the end of 2015.8 There are several examples of reviews that cover 20 to 30 years: Faulkner published two such reviews9 and Cragg and Newman and colleagues have published several such reviews10 that cover both marine and terrestrial natural products, as well as numerous useful reviews of natural products in various stages of development.11 While these temporal reviews rarely provide collection data (such as locations and collection dates), they are a rich source of information about chemical structures, pharmacological effects, clinical trials, efficacy, ownership, patents, and the primary sources that do report collection data.
Topical reviews covering MNPs are numerous in both quantity and variety. Most common are reviews that focus on a chemical family,12 a phylum,13 or a therapeutic use.14 Less common reviews focus on a genus or family,15 a country,16 or biodiversity.17 As with the temporal reviews, we used these topical reviews mainly to identify primary sources of collection data as well as to provide information about chemical structures, pharmacological effects, clinical trials, efficacy, and ownership.
Our approach was to first identify MNPs that had received Food and Drug Administration (FDA) approval for therapeutic use or that reached the clinical testing stage of development. We assumed that clinical status was a reasonable surrogate for pharmacological potential (i.e., the likelihood that the MNP would be approved by the FDA, and in turn yield market and nonmarket economic benefits). We later added MNPs identified in the literature as in preclinical testing or as promising leads. The goal was not to have a representative sample of chemical structures or geographic locations, but rather to identify locations yielding the MNPs with demonstrated value or potential value. Then, we identified the species from which those MNPs had been isolated and the locations where the specimens yielding those MNPs had been collected. We report here our findings to date and the data on which they are based, covering 298 MNPs and 1,296 specimen collections (Table 1). The spatial distributions of those collections are summarized in several tables. In the process of compiling the collection data, we were surprised to find that many articles reported incomplete, vague, or inaccurate location descriptions or collection data, which would impede any attempt to replicate the collections and could adversely affect the accuracy and usefulness of any metric or model based on those data. We briefly discuss some examples of these uncertainties in the hope that investigators will be encouraged to report accurate and complete collection data. Finally, we describe potential lines of future investigation that could lead to the development of a metric or model for estimating a location’s of pharmacological potential, and we suggest the need to establish a process for maintaining the data.
Table 1.
Overall Statistics for the Compiled Data
| MNPs reviewed | 298 |
| Species collected | 232 |
| Phyla represented | 15 |
| Specimen collections documented | 1,296 |
| Countries where collections occurred | 69 |
| Continents where collections occurred | 7 |
| Years in which specimens collected | 47 |
| Clinical status of MNPs | |
| Approved by the FDA | 16 |
| In clinical trials | 55 |
| In preclinical testing | 51 |
| Lead or probe | 176 |
DESCRIPTION OF THE SUPPORTING INFORMATION DOCUMENTS
The compiled data and analyses are available in the Supporting Information (SI) documents (Table 2). The Ancillary Tables document (SI#1) contains three tables that are only referenced in this article: a list of the MNPs having incomplete data; an expanded list of review articles; and, a table of examples of the problems we encountered in reports of collections. The Overview (SI#2) has three chapters: Chapter 1 is a brief review of the origins of this research; Chapter 2 has background information for the five ensuing documents (SI#3-SI#7); and, Chapter 3 has extensive summary tables and figures of the compiled data. The Marine Pharmaceuticals Table (MPT), the Species Collections and Distributions Table (SCT), and the Gazetteer repeat the document-specific background information from the Overview’s Chapter 2. Note that the two worksheets of the Collections Database (CDc and CDs) contain identical data, but the CDc is organized by the country of collection, while the CDs is organized by the species collected (Table 2). The reference standards we used are discussed immediately below, followed by a synopsis of each of the Supporting Information documents (except Ancillary Tables), beginning with the MPT (SI#3) then continuing seriatim to cover the SCT, the Collections Database, the Gazetteer, and the Google Earth Spatial Database of Collections (GEDB) (SI#7) before turning to the Overview (SI#2) for several summary tables of the collection data. This ordering approximates the workflow of compiling the data.
Table 2.
Supporting Information Documents (n.b.: the five PDFs are combined in a single file)
| Code | Document Name | Type | Document Contents |
|---|---|---|---|
| SI#1 | Ancillary Tables | Three tables cited only in this article: MNPs with incomplete data; MNP reviews bibliography; and, collection reporting problems | |
| SI#2 | Overview and Summary Tables (Overview) | background information on how we processed the data and summary tables and figures of the data collected | |
| SI#3 | Marine Pharmaceuticals Table (MPT) | a table of MNPs with their clinical status, chemical class, source species, therapeutic uses, and source references | |
| SI#4 | Species Collections and Distributions Table (SCT) | a table of source species listing their phylum, distribution, and collections; collection source citations listed in table | |
| SI#5 | Collections Database (by Country [CDc] & by Species [CDs]) | XLS | a spreadsheet database with one sheet sorted by country and a second sheet sorted by species; each collection has an entry on each sheet; see Table 4 for data list; the CDc and CDs have identical data |
| SI#6 | Gazetteer of Collection Geography (Gazetteer) | a table of relevant sites listing the BGN Approved Names and Name Variants and lat-lon coordinates in both DMS and decimal notation | |
| SI#7 | Google Earth Spatial Database of Collections (GEDB) | KMZ | a spatial database of collection sites using the Google Earth application; placemark icons show the degree of locational certainty |
REFERENCE STANDARDS
Given the diversity of sources and locations, we believed it prudent to rely on several reference standards, as described below. It should be noted that even reference standards can create interpretive challenges and cannot be followed blindly.
World Register of Marine Species (WoRMS).18
WoRMS provided binomial names, taxonomic characterizations, and species’ distributions. WoRMS is inherently mutable, because it tracks changes in genus/species names and assignments. Given that the highest priority for WoRMS is taxonomic tracking, the species distributions listed in WoRMS may be incomplete.19
GeoNet Names Server (GNS) & Geographic Names Information System (GNIS).20
Reference standards for location names and geographic coordinates were provided by two databases, both being official repositories of standard spellings specified by the U. S. Board on Geographic Names (BGN): (1) the GeoNet Names Server (GNS) maintained by the U. S. National Geospatial-Intelligence Agency (NGA); and, (2) the Geographic Names Information System (GNIS) maintained by the U. S. Geological Survey (USGS). The GNIS contains location data for sites in the United States, its dependent areas (e.g., Guam, Puerto Rico), and Antarctica, while the GNS contains similar data for all other countries. When collection sources used a name or spelling other than an Approved Name, the reported name or spelling is provided in the Notes field. The Gazetteer (SI#6), contains entries for the approved names as well as cross-references for commonly used name variants and other names reported in collection sources.
Japanese Geographic Suffixes.
These suffixes can be confusing or inconsistent in translation. For example, the Japanese suffix -wan (Kanji character  ) can mean either “bay” or “gulf’, so Sagami-wan has been reported as both “Sagami Bay” and “Gulf of Sagami”. While “Gulf of Sagami” may refer to the area further offshore (closer to the Pacific Ocean), that area is sometimes referred to as Sagami-nada, where the suffix -nada (Kanji character
  ) can mean either “gulf’ or “sea”. The GNS is not consistent in its treatment of these suffixes. Many approved names (e.g., Iwate-ken, Ago-wan, Kuro-shima, etc.) have the suffix hyphenated and in lower case. However, some approved names (e.g., Aomori Ken, Sendai Wan, Mage Shima, etc.) capitalize and do not hyphenate the suffix. For consistency and to minimize confusion, we have used the hyphenated-lowercase format in all tables and databases; however, in the Gazetteer, the entry for the approved name(s) is in the form reported by the GNS. A list of Japanese language geographic suffixes can be found in the front matter of the Overview, the MPT, the SCT, and the Gazetteer, as can a list of non-English geographic terms found in placenames.
Country, Province, & State Codes.
Country name abbreviations are normally the three-letter country code used by the International Olympic Committee (IOC).21 These codes were chosen over the ISO 3166–1 alpha-3 country codes,22 because the IOC codes tend to be more evocative of the country name (hence, easier to remember). In a very few instances where the ISO code better evokes the country name, that code is used rather than the IOC code. When there is no IOC country code, the ISO code is used. When neither an IOC code or an ISO code is available, we created a three-letter code. The abbreviations used for provinces and states in Australia, Canada, and the United States are the two-letter or three-letter postal abbreviations. A table listing the abbreviations used can be found in the Overview (Table SI#2–2), the SCT (Table SI#4–2), and the Gazetteer (Table SI#6–2).
SI#3 MARINE PHARMACEUTICALS TABLE (MPT)
The Marine Pharmaceuticals Table (MPT) lists the 298 MNPs (or MNP families [e.g., brevetoxins]) shown in Table 3 that were the focus of our analyses. The type of data found in the MPT is shown in Table 4. Also listed in the MPT are 363 MNPs or MNP families (Table SI#1–1) that may have pharmacological potential, but for which we have only partial information at this time. All of the sources cited in the MPT can be found in the bibliography following it.
Table 3.
Marine Natural Products Reviewed
| aaptamines | chlorovulone | ω-conotoxin CnVIIA | ethyl icosapentatea |
| AB-5 | chondroitin sulfate | ω-conotoxin CVIDb | eunicidiol |
| abeohyousterone | chondropsins | ω-conotoxin MVIIAc | fascaplysin |
| abyssomicin C | ciliatamides | contignasterold | floxuridinee |
| acyclovif | clavulone | contulakin-Gg | fluorouracilh |
| adociasulfate-2i | cometins | Thr10-contulakin-Gj | FR290581k |
| agelasphins | conantokin-Gl | cortistatins | frondoside A |
| agosterol A | conantokin-Tm | cryptophycins | fucoxanthin |
| amphimedine | α-conotoxin AnIA | curacins | GA3 polysacchariden |
| anabaseine | α-conotoxin AnIB | cytarabine ocfosfateo | geodiamolides |
| aplidinep | α-conotoxin AnIC | Dacinostatq | geoditins |
| aplyronine A | α-conotoxin ArIA | dehydrothyrsiferols | girodazole |
| Ara-Ar | α-conotoxin ArIB | deoxyamphimedine | girolline |
| Ara-Cs | α-conotoxin CnIA | 1 –deoxynojirimycint | glembatumumab vedotinu |
| arenastatin A | α-conotoxin CnIB | deoxyvariolin Bv | globostellatic acids |
| arenjimycin | α-conotoxin EpI | dermatan sulfatesw | globostelletins |
| arenosclerins A–C | α-conotoxin ImI | diazepinomicinx | halichondramide |
| ascidiacyclamide | α-conotoxin PnIA | diazonamide A | halichondrin B |
| ascidideminy | α-conotoxin PnIB | dichlorolissoclimide | haliclonacyclamine E |
| ASG-5ME | α-conotoxin Vc1.1z | dictyodendrins A–J | (–)-haliclonadiamine |
| aurilides | α-conotoxin cVc1.1aa | dictyostatin-1 | haligramides |
| avarol | α4/7-conotoxin Lp1.1 | didemnin B | halimidebb |
| axinelloside A | α4/7-conotoxin TxIA | dideoxypetrosynol | haouamine A |
| barbamide | αA-conotoxin PIVA | dihydromotuporamine | haouamine B |
| bastadins | γ-conotoxin TxVIIA | discodermins | haterumaimides |
| bengamides | δ-conotoxin PVIA | discodermolide | hemiasterlincc |
| bengazoles | δ-conotoxin TxVIA | DMMC | herbadysidolides |
| bistramides | ε-conotoxin TxIX | DMXBAdd | homophymines |
| bistratamides | ϰ-conotoxin PVIIAee | dolastatin 10 | (+)-8-hydroxymanzamine A |
| bistratenes | ϰA-conotoxin CcTx | dolastatin 15 | (–)-8-hydroxymanzamine A |
| brentuximab vedotinff | ϰA-conotoxin SIVA | dysidenins | hyousterones A-D |
| brevetoxins | ϰI(2)-conotoxin ViTx | dysidins | ianthelliformisamines |
| bromovulone | μ-conotoxin CnIIIB | dysiherbaines | iodovulone |
| bryostatin 1 | μ-conotoxin CnIIICgg | eilatin | IPL-512602hh |
| bursatellanin-P | μ-conotoxin SIIIAii | elcatoninjj | IPL-550260 |
| callipeltins | μO-conotoxin MrVIBkk | eleutherobin | IPL-576092ll |
| callystatin A | ϱ-conotoxin TIA | elisidepsinmm | isofagominenn |
| Cemadotinoo | χ-conotoxin MrIApp | ER-076349 | jaspamideqq |
| cephalostatins | χ-conotoxin MrIBrr | ER-086527 | jaspolides |
| chlorolissoclimide | ψ-conotoxin PIIIE | eribulin mesylatess | jorumycin |
| kahalalide F | miglustattt | phakellistatins | stelliferins |
| kahalalide O | mirabalins | philinopside A | stolonic acids |
| keenamide A | mirabamides | pibocin B | stolonoxides |
| kottamides A–E | mirabilins | Plinabulinuu | stylisins |
| KRN-7000vv | mollamides | poecillastrins | styloguanidinesww |
| LAF-389 | monomethylauristatin Exx | polybrominated diphenyl ethersyy | superstolides |
| lamellarins | monomethylauristatin Fzz | psammaplins | swinholides |
| largazole | motuporamines | psammaplysins | Taltobulinaaa |
| latrunculins | mycalamides | R-135853 | tamandarin A |
| laulimalidesbbb | mycalosides | reidispongiolides | tamandarin B |
| laurenditerpenol | mycothiazole | renieramycins | Tasidotinccc |
| lissoclibadin 1 | namenamicin | rhabdastrellic acid–A | tawicyclamides |
| lissoclibadin 2 | neoamphimedine | rhabdastrellins | tetrodotoxinddd |
| lissoclinamides | neodysiherbaines | rhabdastrins | thiocoraline |
| lissoclinolides | neosiphoniamolides | (–)-salicylihalamides | Trabectedineee |
| lissoclinotoxin | neosurugatoxin | saliniquinones A–F | trodusqueminefff |
| lophotoxin | Neovastatggg | sansalvamide | trunkamide A |
| Lovazahhh | norsegoline | sarcodictyin A | tuberatolide A |
| luffariellins | okadaic acid | sarcodictyin B | tuberatolide B |
| luffariellolides | onnamides | saxitoxin | ulicyclamide |
| lurbinectediniii | (–)-palau’amine | SGN-75 | ulithiacyclamides |
| makaluvamines | panobinostatjjj | shishijimicins | variolin Bkkk |
| manoalides | papuamides | soblidotinlll | viequeamides |
| manzamine | (–)-papuamine | sphinxolides | vitilevuamide |
| marizomibmmm | patellamides | spirodysin | wakayin |
| meridianins | patellazoles | spisulosinennn | Xen-2174ooo |
| methopterosinppp | patellins | Spongistatinsqqq | Zalypsisrrr |
| methyleudistomins | peloruside A | Squalaminesss | zidovudinettt |
| miglitoluuu | peptidolipins | stelletins | |
Unless otherwise noted, these are synonyms:
EPA-E, EPA ethyl ester, Epadel, ethyl eicosapentaenoic acid.
AM336, CNSB004, leconotide.
AMM336, C1002, SNX-III, Prialt, ziconotide.
IZP-94005.
FUDR.
Zovirax; made by total synthesis with MNP pharmacophore.
CGX-1160.
5-FU, Adrucil, Efudex, Fluroplex. There is some doubt that fluorouracil is an MNP, given the rarity of fluorinated natural products and a lack of replication of the isolation by Xu et al., plus that a biosynthesis pathway to add fluorine to pyrimidines has not been discovered.
AS-2.
CGX-1063.
AS-1710313.
CGX-1007.
CGX-100.
GA3P.
fosteabine, SPAC, Starasid, YNK-01; sometimes misspelled Starsaid.
Aplidin, dehydrodidemnin B, DDB, plitidepsin.
NVP-LAQ824.
arabinofuranosyladenine, adenine arabinoside, vidarabine, Vira-A; see f.
arabinosyl cytosine, cytosine arabinoside, cytarabine, Cytosar U, DepoCyt, Tarabine PFS; see f.
AT2200, moranoline.
CDX-011, CR011-vcMMAE.
PM01218.
KRX-101, sulodexide.
EC0–4601, TLN-4601.
sometimes spelled ascididemnin.
ACV1.
IMB-007.
NPI-2350, (−)-phenylahistin.
E7974.
DMXB-anabaseine, GTS-21; sometimes misspelled DMBXA.
CGX-1051.
Adcetris, SGN-35.
XEP-018.
AVE 0547.
PEG-SIIIA.
Calcimar, carbocalcitonin, Miacalcin.
CGX-1002.
HMR-4011A.
Irvalec, PM02734.
AT2101, IFG, Plicera.
LU-103793; sometimes misspelled cematodin.
CMrVIB, χ-conopeptides, χ-CTX MrIA, mr10a.
jasplakinolide.
χ-conopeptide.
E7389, Halaven, norhalichondrin B.
OGT 918, Zavesca.
NPI-2358.
agelasphin, α-galactosylceramide, α-GalCer.
isopalau’amines.
MMAE.
PBDE.
MMAF.
HTI-286.
fijianolides.
ILX651, synthatodin.
Tectin, tetrodin, TTX.
ecteinascidin 743, ET-743, Yondelis.
MSI-1436.
Ӕ-941.
ω-3-acid ethyl esters.
PM01183.
Farydak [ex- Faridak], LBH-589.
PM-01220.
auristatin PE, TZT-1027.
NPI-0052, salinosporamide A.
ES-285.
χ-conopeptide.
0AS-1000, pseudopterosin A methyl ether.
altohyrtins, cinachyrolides.
PM00104.
Evizon, MSI-1256F.
AZT, Retrovir; see f.
Diastabol, Glyset.
Table 4.
Contents of Major Tables
| No. |
SI#3 MPT Columns |
SI#4 SCT Columns |
SI#5 CDc / CDs Columns |
SI#6 Gazetteer Columns |
|---|---|---|---|---|
| 1 | Chemicala | Species & AphialD | Collection Country | Country |
| 2 | Status Category | Phylum & MNPs | CDc ID | Site or Feature |
| 3 | Chemical Class | Distribution | CDs ID | Feature Type |
| 4 | Source Species | Collection Locationsb | Collection Location | BGN Approved Names |
| 5 | Therapeutic Uses | Notes | Species | BGN Name V ariants |
| 6 | Clinical Status Details | Phylum | Other Names | |
| 7 | Source References | AphiaID | GNS/GNIS lat-lon DMS | |
| 8 | Chemical | GNS/GNIS lat-lon decimal | ||
| 9 | Clinical Status | Unique Feature Identifier | ||
| 10 | Collection Source | Description & Notes | ||
| 11 | Source Page | |||
| 12 | Collection Date | |||
| 13 | Year Collected | |||
| 14 | Month Collected | |||
| 15 | Year Rcvd by Journal | |||
| 16 | Year Published | |||
| 17 | Depth of Collection | |||
| 18 | Reported Location Lat | |||
| 19 | Reported Location Lon | |||
| 20 | Placemark Decimal Lat | |||
| 21 | Placemark Decimal Lon | |||
| 22 | Placemark Lat/Lon Source | |||
| 23 | Placemark Location Name | |||
| 24 | Placemark Label | |||
| 25 | Icon | |||
| 26 | Icon in Words | |||
| 27 | Double Entries | |||
| 28 | Notes | |||
includes synonyms and sponsors.
includes source reference, collection date, and collection depth
Names of MNPs.
The MNPs in the MPT are most often identified by their common (or trivial) names, while their semisystematic, testing, and trademarked names are usually listed as synonyms. For example, the common name panobinostat is used for sorting, while the testing name (LBH-589) and the trademark name (Farydak) are reported as synonyms (see also Table SI#3–3). The use of trivial names, while convenient, presents some offsetting pitfalls. Most common are misspellings (e.g., ascididemin vs. ascididemnin; cemadotin vs. cematodin; DMXBA vs. DMBXA; Staracid vs. Starsaid). In several instances, there have been competing names for a compound when different research groups working independently isolate and name the same compound (e.g., irciniastatin vs. psymberin; laulimalides vs. fijianolides; altohyrtins vs. cinachyrolides vs. spongistatins). In one instance, the same name was given to different MNPs, so one had to be renamed (mirabalin and mirabilin).
Therapeutic Uses of MNPs.
These uses are limited to those we found in the literature. Although a large number of bioassays are reported in this table, few specimens have been thoroughly tested in the whole range of possible bioassays. Because almost all of the specimen collections were conducted by academic researchers with limited resources, virtually all of the specimens have only been tested in bioassays for cancer cytotoxicity. Consequently, their potential use in treating cardiovascular diseases, central nervous system disorders, diabetes, infections (e.g., HIV, tuberculosis, parasites, malaria, etc.), asthma, and immunological disorders remains largely unexplored.23
Clinical Status of MNPs.
The 298 MNPs are categorized according to their clinical status: (1) Lead or Probe; (2) Preclinical Testing; (3) Clinical Testing; or, (4) Approved. Except for approved drugs, determining the clinical status of an MNP can be difficult, because pharmaceutical companies tend to closely hold such information. Similarly, determining the chemical’s owner/controller/sponsor can be quite complicated.
SI#4 SPECIES COLLECTIONS AND DISTRIBUTIONS TABLE (SCT)
The Species Collections Table (SCT) lists the 232 marine species (or genera) (Table 5) from which the 298 MNPs were isolated. The type of data found in the SCT is shown in Table 4. All of the source references can be found in the bibliography that follows the SCT.
Table 5.
Collections by Species
| Aaptos aaptos | 137 | Conus anemone | 2 | Ecteinascidia turbinata | 25 |
| Aaptos ciliata | 1 | Conus arenatus | 15 | Elysia ornata | 2 |
| Aaptos suberitoides | 7 | Conus catus | 12 | Elysia rufescens | 3 |
| Aaptos sp. | 5 | Conus consors | 2 | Erythropodium caribaeorum | 7 |
| Acanthaster planci | 6 | Conus episcopatus | 8 | Eudistoma bituminis | 1 |
| Acanthostrongylophora sp. | 6 | Conus geographus | 7 | Eudistoma gilboviride | 2 |
| Agelas mauritiana | 7 | Conus imperialis | 12 | Eudistoma sp. | 4 |
| Amphimedon sp. | 2 | Conus leopardus | 14 | Eunicea fusca | 1 |
| Amphiporus angulatus | 1 | Conus magus | 5 | Eunicella cavolini | 2 |
| Amphiporus lactifloreus | 1 | Conus marmoreus | 13 | Fusarium sp. | 2 |
| Antillogorgia elisabethaea | 5 | Conus pennaceus | 7 | Geodia corticostylifera | 5 |
| Aplidium albicans | 1 | Conus purpurascens | 1 | Geodia gibberosa | 1 |
| Aplidium haouarianum | 1 | Conus striatus | 16 | Geodia sp. | 2 |
| Aplidium meridianum | 1 | Conus textile | 15 | Gymnodinium A3 | 1 |
| Aplysia kurodai | 3 | Conus tulipa | 6 | Halichondria (Halichondria) sp. | 1 |
| Aplysinella rhax | 3 | Conus victoriae | 1 | Halichondria melanadocia | 1 |
| Aplysinella strongylata | 1 | Conus virgo | 5 | Halichondria okadai | 2 |
| Aplysinella sp. | 1 | Coriocella hibyae | 1 | Halichondria sp. | 1 |
| Arenosclera brasiliensis | 9 | Cucumaria frondosa | 4 | Haliclona (Reniera) sp. | 3 |
| Auletta sp. | 1 | Cymbastela cantharella | 4 | Haliclona nigra | 1 |
| Axinella corrugata | 2 | Cymbastela sp. | 6 | Haliclona sp. | 12 |
| Axinella brevistyla | 1 | Cystodytes dellechiajei | 4 | Halimeda copiosa | 6 |
| Axinella infundibula | 1 | Cystodytes sp. | 1 | Halimeda lacrimosa | 1 |
| Axinella sp. | 3 | Dendrilla cactos | 3 | Halocynthia pyriformis | 1 |
| Babylonia japonica | 1 | Diazona angulata | 1 | Hapalochlaena maculosa | 2 |
| Bellonella albiflora | 1 | Dictyodendrilla verongiformis | 1 | Hemiasterella minor | 1 |
| Botryllus tuberatus | 1 | Didemnum chartaceum | 2 | Histodermella sp. | 1 |
| Bryopsis pennata | 1 | Didemnum cuculliferum | 2 | Holothuria (Halodeima) grisea | 1 |
| Bugula neritina | 18 | Didemnum fragile | 1 | Homophymia sp. | 1 |
| Bursatella leachii | 5 | Didemnum molle | 6 | Hymeniacidon sp. | 7 |
| Cacospongia mycofijiensis | 2 | Didemnum obscurum | 2 | Hyrtios altus | 2 |
| Callipelta sp. | 2 | Didemnum sp. | 5 | Hyrtios communis | 1 |
| Callyspongia truncata | 1 | Discodermia dissoluta | 1 | Hyrtios erectus | 4 |
| Calthropella (Calthropella) sp. | 1 | Discodermia kiiensis | 1 | Ianthella basta | 14 |
| Cephalodiscus gilchristi | 2 | Discodermia sp. | 3 | Ianthella flabelliformis | 2 |
| Chondropsis sp. | 1 | Dolabella auricularia | 29 | Ianthella quadrangulata | 2 |
| Cinachyra sp. | 1 | Dysidea arenaria | 2 | Ianthella reticulata | 1 |
| Clathria sp. | 1 | Dysidea avara | 2 | Ianthella sp. | 1 |
| Clavelina sp. | 1 | Ircinia ramosa | 4 | ||
| Clavularia viridis | 1 | Ircinia sp. | 3 | ||
| Colochirus quadrangularis | 1 | ||||
| Jaspis digonoxea | 1 | Neopetrosia exigua | 2 | Spongia sp. | 6 |
| Jaspis johnstoni | 8 | Neopetrosia sp. | 1 | Squalus acanthias | 1 |
| Jaspis serpentina | 1 | Neosiphonia superstes | 2 | Stelletta clavosa | 1 |
| Jaspis splendens | 6 | Niphates caycedoi | 2 | Stelletta sp. | 4 |
| Jaspis sp. | 5 | Ochrophytab | — | Stolonica socialis | 3 |
| Jorunna funebris | 3 | Pachypellina sp. | 1 | Stolonica sp. | 1 |
| Kirkpatrickia variolosa | 5 | Paranemertes peregrina | 1 | Styela clava | 1 |
| Lamellaria sp. | 1 | Parasphaerasclera albiflora | 2 | Styela plicata | 2 |
| Lamellodysidea herbacea | 61 | Parasphaerasclera aurea | 1 | Stylissa caribica | 1 |
| Laurencia intricata | 1 | Petrosia (Petrosia) ficiformis | 1 | Stylissa carteri | 8 |
| Laurencia viridis | 3 | Petrosia sp. | 4 | Stylissa constricta | 1 |
| Lendenfeldia chondrodes | 6 | Phakellia costata | 4 | Stylissa massa | 8 |
| Leptoclinides sp. | 3 | Phakellia fusca | 3 | Suberea ianthelliformis | 5 |
| Lissoclinum badium | 3 | Phakellia sp. | 5 | Suberea sp. | 1 |
| Lissoclinum bistratum | 8 | Phallusia nigra | 4 | Suberites domuncula | 1 |
| Lissoclinum patella | 33 | Pleurobranchus albiguttatus | 1 | Suberites sp. | 2 |
| Lissoclinum timorense | 2 | Pleurobranchus forskalii | 2 | Symploca hydnoides | 11 |
| Lissoclinum sp. | 8 | Poecillastra sp. | 1 | Symploca sp. | 1 |
| Lissodendoryx sp. | 4 | Polysyncraton lithostrotum | 2 | Synoicum adareanum | 2 |
| Lophogorgia sp. | 10 | Prorocentrum belizeanum | 1 | Takifugu chrysops | 4 |
| Luffariella variabilis | 60 | Prorocentrum concavum | 1 | Takifugu niphobles | 2 |
| Luffariella sp. | 6 | Prorocentrum lima | 10 | Takifugu oblongus | 16 |
| Mactromeris polynyma | 1 | Psammoclema sp. | 1 | Takifugu pardalis | 6 |
| Melophlus sp. | 1 | Pseudoceratina purpurea | 10 | Tectitethya crypta | 2 |
| Micromonospora aurantiaca | 1 | Pycnoclavella kottae | 1 | Theonella mirabilis | 3 |
| Micromonospora marina | 1 | Raspailia (Clathriodendron) arbuscula | 2 | Theonella swinhoei | 42 |
| Micromonospora sp. | 2 | Raspailia (Parasyringella) elegans | 1 | Theonella sp. | 9 |
| Microscleroderma sp. | 3 | Rhabdastrella distinca | 1 | Thorecta reticulata | 1 |
| Monanchora arbuscula | 4 | Rhabdastrella globostellata | 35 | Trachycladus spinispirulifer | 8 |
| Monanchora unguiculata | 4 | Rhaphoxya sp. | 1 | Trididemnum cyanophorum | 2 |
| Moorea producensc | 64 | Rivularia sp. | 1 | Trididemnum cyclops | 1 |
| Mycale (Arenochalina) laxissima | 2 | Salinispora arenicola | 20 | Trididemnum orbiculatum | 1 |
| Mycale (Arenochalina) mirabilis | 1 | Salinispora tropica | 7 | Trididemnum solidum | 6 |
| Mycale hentscheli | 21 | Sarcodictyon roseum | 1 | Verrucosispora maris | 9 |
| Negombata magnifica | 24 | Siliquariaspongia mirabilis | 2 | Xestospongia sp. | 4 |
| Neopetrosia carbonaria | 5 | Siliquariaspongia sp. | 1 | Zopfiella marina | 1 |
| Neopetrosia contignata | 1 | Siphonochalina sp. | 1 | Zyzzya fuliginosa | 6 |
| Smenospongia aurea | 1 |
The genus Pseudopterogorgia was transferred to Antillogorgia in 2012. See Table SI#4–3 for other such transfers. Also see SCT (SI#4).
Fucoxanthin is found in most or all species of the classes Phaeophyceae (brown algae), Chrysophyceae (golden algae), and Bacillariophyceae (diatoms) in the phylum Ochrophyta plus some species in the phyla Dinoflagellata and Haptophyta, possibly as many as 16,000 species in total. These species and their collections are not included in the analyses presented here. See fucoxanthin entry in the MPT (SI#4) for references.
The genus Moorea, proposed in 2012, includes many specimens attributed to Lyngbya majuscula. See Table SI#4–3 and SCT (SI#4).
Species Names.
The taxonomic identification of species can be complicated, particularly when reporting collections from 30–50 years ago, coupled with the dynamic nature of taxonomic classification. For example, in the past 25 years, sponges identified as Acanthella carteri, Acanthella aurantiaca, Axinella carteri, and Phakellia carteri have all been transferred to Stylissa carteri. WoRMS did not have an entry for Phakellia carteri until August 2014. Table SI#4–3 lists examples of name changes and taxonomic reassignments related to the 232 species. In the SCT itself, superseded names are given with the prefix “ex-”. The superseded names are often more common in the literature than the newer names. The “ex-” prefix is also used in other situations, such as when an MNP’s owner or sponsor changes.
Species Distributions.
The distributions of the species and genera listed in the SCT come from the WoRMS Taxon Details web page for the species (or genus). In some instances, the Distribution Details popup links provide more specific locational detail. We did not include locations marked “inaccurate” by WoRMS. Choosing among the various names for locations or geounits to include in the distributions involves numerous choices and assumptions, which are described in Section 1.2.7 of the SCT. Aside from certain Japanese names, the locations listed in the distributions represent the only exception to our use of BGN Approved Names. The distributions in the SCT use the names reported by WoRMS to minimize confusion when comparing locations in the SCT with those on the WoRMS Taxon Details web pages.
Unfortunately, for some species there seems to be little or no overlap between the distribution locations and the collection locations. This situation could arise because the distribution is incomplete or because the specimen was misidentified. The sponge Aaptos aaptos is as an example (Table SI#4–7). WoRMS reports that Aaptos aaptos is confined to European waters, but its distribution listing identifies numerous locations (all marked “inaccurate”) outside of European waters where Aaptos aaptos specimens were supposedly collected. Interestingly, all of the collection locations we report in the SCT are also outside of European waters. A Species Overview linked to on the WoRMS Taxon Detail webpage for Aaptos aaptos states that the species “has been reported from many areas of the world, but it is almost certain that these concern other species of Aaptos.”24 So, with respect to identifying the species from which MNPs have been isolated, it is unclear whether the collected specimens were Aaptos aaptos, a single new Aaptos species, or several new Aaptos species, and the matter will remain unresolved until comparative taxonomic examinations of the voucher samples are conducted. In this and similar instances, the SCT and the Collections Database use the identification reported by the investigators, unless a more recent identification has superseded the original.
Specimen Collections.
The collection locations within a species (or genus) are listed in chronological order of the collection date, with two exceptions: (1) when no collection date is reported, the publication date of the source reference is used for ordering; and, (2) when a species has a very large number of collections, the collections are first grouped by country, then the countries are ordered chronologically by earliest collection, and then collections are ordered chronologically within countries. The publication date is often a poor approximation of the collection date (frozen preserved specimens may be analyzed 10 or more years after being collected), but it seemed to be the best surrogate available. The placenames of the collection locations are the BGN Approved Names (except for certain Japanese names; see Reference Standards supra). Reported placenames that are not the BGN Approved Name are provided in a note. Although collection depths are commonly reported as negative numbers, indicating distance below sea level, the SCT and the Collections Database report these values without the negative signs, primarily so that depth ranges are clearer.
Problem Resolution.
To the greatest extent possible, we endeavored to provide additional information for context and to explain our resolution of data discrepancies and conflicts in the Notes columns of the SCT, the Collections Database, and the Gazetteer (Table 4). The types of problems we addressed in this fashion fall into five broad categories and multiple subcategories (Table 6). Usually when there were two or more possible collection locations, we added a double entry so that both the reported location and our surmised location are represented. In the Collections Database, the double entry is noted in a separate column (column 27) and explained in the Notes column (Table 4). In the GEDB Spatial Database, these doubled locations are both displayed with a question mark icon (Table SI#2–15).
Table 6.
Types of Collection Reporting Problems Encountered
| Type | Subcategory | Description |
|---|---|---|
| Collection Uncertainty | ||
| Collection Date Uncertainty | The collection date(s) is(are) not reported or reported in vague or nonspecific terms in the source reference. If the voucher specimen number is reported, it may be possible to infer an approximate collection date. | |
| Collection Depth Uncertainty | The collection depth is described in qualitative terms. | |
| Same Collection or Separate Collections? | It is uncertain whether specimens came from the same collection or separate collections. | |
| Lat-Lon Errors | ||
| Arcminutes or Arcseconds Value Exceeds 60 | Neither arcminutes nor arcseconds values can exceed 60, but occasionally larger values are reported in source references and must be interpreted. | |
| Lat-Lon Transcription Error | An error is likely to have been made in transcribing the lat-lon coordinates. | |
| Simplified Lat-Lon | The lat-lon coordinates point to an unlikely location probably due to rounding or simplifying the lat-lon values. | |
| Location Uncertainty | ||
| Contradictory Location Description | The location description contains contradictory information, such as naming the collection location and the station number, but the two are at different sites. | |
| Incorrect Directional Description | The reported directions describing the collection location are incorrect or incomplete. | |
| Location Name Change | Subsequent to publication, the name of the collection location is changed. | |
| Multiple Locations with Identical Name | Multiple locations in the same region or country have the same name, and it is unclear which was the location of the collection. | |
| Location A Very Large Area | The reported location is a very large area (e.g., Australia). When a specific location is used to represent the collection location, an explanation is provided in the Notes field. | |
| Unknown Location | The named collection location is not shown on maps and does not appear in the usual geographic resources. | |
| Name Uncertainty | ||
| Name Ambiguity | The collection location may have multiple names from different source references, or the reported name may not be found in the usual geographic resources. | |
| Name/Lat-Lon Mismatch | The reported collection location and the reported lat-lon coordinates do not coincide. | |
| Non-BGN Approved Name | The placename reported for the collection location is not the BGN Approved Name; the reported placename is provided in a numbered note. | |
| Specimen Identification | ||
| Binomial Name Change | Subsequent to publication, the specimen’s taxonomic classification changed; the reported binomial name is provided in a numbered note along with contextual information about the accepted name. | |
| Binomial Name Error | The reported binomial name for the specimen is incorrect; the reported binomial name is provided in a note along with contextual information about the accepted name. | |
| Binomial Name Uncertainty | The specimen’s correct binomial name cannot be ascertained with certainty. | |
When a series of collections are made, source references rarely, if ever, report specific collection dates. For example, a source reference might report that collections were made every two weeks from January to June without specifying start and end dates; or, that collections were made from July to December without specifying the number of collections or their frequency; or, that collections were made at several locations over several years. These situations required that we surmise the collection dates, and we provide our reasoning in estimating the collection dates in the Notes column.
SI#5 Collections Database (by Country [CDc] and by Species [CDs])
The collections database consists of two worksheets with identical data, one sorted by country of collection and the second sorted by the binomial name of the species collected. The two worksheets contain much of the collection-related data in the MPT, the SCT, and the GEDB (Table 2). The data for each of the 1,296 reported collections (plus 36 duplicate entries due to locational uncertainty) are contained in a row with 28 columns (Table 4). All of the references listed in the Collection Source column and the Notes column can be found in the SCT bibliography. In the Collections Database, we do not use numbered notes, because they would conflict with some of the operations of the spreadsheet. Instead, cells for which there is an explanatory note have bolded text and yellow fill.
SI#6 GAZETTEER OF COLLECTION GEOGRAPHY
While compiling these collections, we discovered that there are many instances where reported location names did not coincide with names found on maps or in geographic references. This gazetteer provides the geographic data (Table 4) for 1,365 collection locations and nearby sites and locales. To minimize confusion, we have used the BGN Approved Names for all collections, except as noted above for certain Japanese names.
SI#7 GOOGLE EARTH SPATIAL DATABASE OF COLLECTIONS (GEDB)
The GEDB was created using the data in the Collections Database and can be viewed using the Google Earth application. When viewed in Google Earth, the GEDB provides a sense of the spatial distribution of the 1,296 collection sites for all 232 species. Figure 1 is an example of the GEDB showing the Great Barrier Reef near Townsville, Queensland, Australia.
Figure 1.
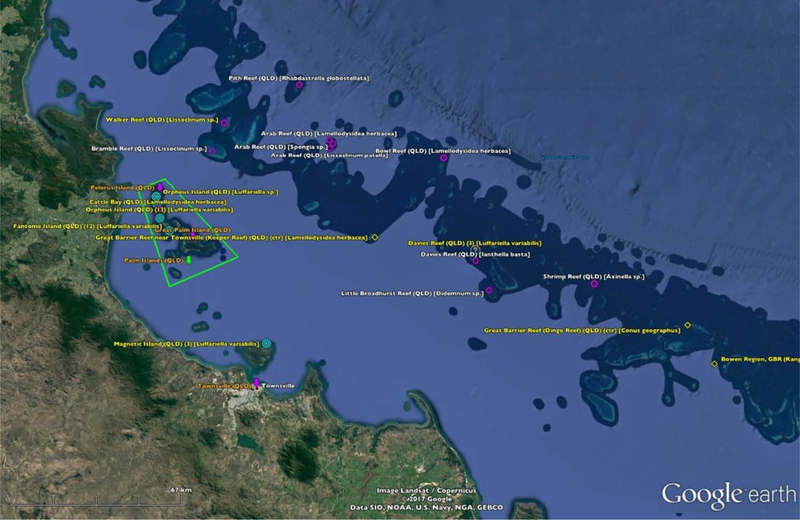
An Example of the Google Earth Database Showing Collections Made From the Great Barrier Reef near Townsville, Queensland, Australia.
Placemark Icons.
Each unique species-collection location is represented by an icon (or placemark). Because multiple collections were made at some sites, the 1,296 collections (and 36 duplicate entries) are represented by just over 800 placemarks. The icon used for the placemark indicates the degree of locational certainty we associated with the collection (Table SI#2–15). For example, when latitude and longitude coordinates are reported by the investigators, the icon is a bullseye, but when we had to surmise a location based on a name alone, the icon is a circle. However, when the location named is a large area, such as an entire country, the icon is a diamond. For those instances when we had great uncertainty (usually due to misreporting of latitude or longitude coordinates), the icon is a question mark. The icons used are from Google Earth’s default icon set, so the GEDB can be used on any platform with minimal configuration issues.
Placemark Labels.
The placemark labels are mostly straightforward in content: the placename, the country code, and the binomial name of the species collected. Two fairly common additions are the notation {ctr} when the icon is a diamond (i.e, the placemark represents a large area) and the notation {n}, where “n” is the number of collections of the named species at the named location. An example placemark label having these elements is: Okinawa-ken (JPN) {ctr} {2} [Acanthaster planci]25 When the reported collection location does not match the reported latitude-longitude coordinates, question mark icons are placed at both locations, and the notation “{actual}” added to the reported location placemark label and the notation “{reported}” added to the reported latitude-longitude placemark label. Labels with yellow text indicate that additional information can be viewed by double-clicking the placemark icon.
SI#2 OVERVIEW AND SUMMARY TABLES
The Overview describes the form, content, and methods of each of the six followingSupporting Information documents and provides 19 summary statistical tables and 12 figures to describe the data therein.
Collections by Country.
The first perspective taken for the collections is a “by country” comparison. It should be noted that not all of the “countries” we have used for organizational purposes are, in fact, countries (Table 7). Except for Antarctica, which is a bit of an anomaly, the non-countries are used because they provide a better sense of the collection location than the proper country (e.g., Cura9ao vs. the Netherlands, and New Caledonia vs. France). For the purposes of our analyses, all of these entities are referred to as countries, regardless of their actual political status.
Table 7.
Locations That Are Not Sovereign Countries
| Location | Status |
|---|---|
| Antarctica | a de facto condominium under the Antarctic Treaty System |
| Bermuda | a British Overseas Territory |
| British Virgin Islands | a British Overseas Territory |
| Curaçao | a constituent country of the Kingdom of the Netherlands |
| French Polynesia | an overseas collectivity of France |
| Guadeloupe | an overseas region of France |
| Guam | a territory of the United States |
| New Caledonia | a special collectivity of France |
| Paracel Islands | disputed sovereignty between China, the Philippines, and Taiwan |
| Puerto Rico | a territory of the United States |
| South Georgia | a British Overseas Territory |
| United States Virgin Islands | a territory of the United States |
There are also locations that are included within other locations. The Coral Sea Islands are included in Australia, as is the Torres Strait. Île Europa and Mayotte are included in France, and the Îles Chesterfield are included in New Caledonia. Both the Balearic Islands and Canary Islands are included in Spain, and the Palmyra Atoll is included in the USA. Many seas and gulfs that are adjacent to multiple countries are categorized under Oceans (e.g., the Gulf of Aqaba).
The collections by country entries shown in Table 8 are not certain values, because many source references are unclear regarding the number or frequency of collections. As a result, these values are our best estimate of the number of collections based on the descriptions provided by the investigators. In each such instance, we explain our estimation method in the Notes fields of the SCT and the Collections Database (Table 4). In addition, these values should not be taken as suggesting the relative size of different countries’ pharmacological potential from MNPs. Many different factors influence the choice of a locale to explore for MNPs, including the overall diversity of reef life, known populations of specific species, accessibility of the reefs, established working relationships with local institutions and vendors, cost of collecting specimens (including travel, equipment rental, contract services, etc.), national policies on collecting, ease of obtaining collection permits, etc. Consequently, the relative number of collections among countries seems most likely to result from observational bias (looking where it is most convenient, sometimes referred to as the “streetlight effect”).26
Table 8.
Collections by Country and Clinical Status
| Collections | Approved | Clinical | Preclinical | Lead | |
|---|---|---|---|---|---|
| Antarctica | 7 | — | — | 5 | 2 |
| Australia | 147 | 3 | 66 | 11 | 67 |
| The Bahamas | 21 | 1 | 16 | 1 | 3 |
| Bangladesh | 3 | — | 3 | — | — |
| Belize | 13 | 6 | 2 | 2 | 3 |
| Bermuda | 1 | — | 1 | — | — |
| Brazil | 33 | — | 4 | 3 | 26 |
| British Virgin Islands | 1 | — | — | — | 1 |
| Cambodia | 1 | — | 1 | — | — |
| Canada | 3 | — | — | 3 | — |
| China | 6 | — | — | — | 6 |
| Colombia | 3 | 2 | 1 | — | — |
| Comoros | 6 | 4 | 2 | — | — |
| Croatia | 1 | — | — | — | 1 |
| Cuba | 1 | — | — | — | 1 |
| Cura§ao | 18 | — | 18 | — | — |
| Djibouti | 1 | — | — | — | 1 |
| Dominica | 1 | — | — | 1 | — |
| Egypt | 9 | — | 1 | 1 | 7 |
| Eritrea | 2 | — | — | — | 2 |
| Fed. States of Micronesia | 30 | 6 | — | 8 | 16 |
| Fiji | 51 | 1 | 15 | 3 | 32 |
| France | 3 | — | — | 1 | 2 |
| French Polynesia | 1 | — | — | — | 1 |
| Greece | 1 | 1 | — | — | — |
| Guadeloupe | 2 | — | 2 | — | — |
| Guam | 14 | 1 | 4 | 1 | 8 |
| Honduras | 7 | 3 | 1 | — | 3 |
| India | 19 | — | 14 | 2 | 3 |
| Indonesia | 82 | 5 | 5 | 8 | 64 |
| Italy | 5 | 1 | — | 2 | 2 |
| Jamaica | 7 | — | 1 | 2 | 4 |
| Japan | 113 | 7 | 46 | 13 | 47 |
| Kiribati | 1 | — | 1 | — | — |
| Madagascar | 3 | 1 | 1 | — | 1 |
| Malaysia | 3 | — | — | — | 3 |
| Maldives | 4 | — | — | 2 | 2 |
| Marshall Islands | 8 | — | 5 | 2 | 1 |
| Mauritius | 6 | — | 6 | — | — |
| Mexico | 32 | 2 | 14 | — | 16 |
| Mozambique | 2 | — | — | — | 2 |
| New Caledonia | 22 | — | 7 | 3 | 12 |
| New Zealand | 161 | 4 | 2 | 20 | 135 |
| Nicaragua | 1 | 1 | — | — | — |
| Oceans | 33 | — | 3 | 3 | 27 |
| Palau | 73 | 4 | 14 | 8 | 47 |
| Panama | 7 | 1 | 3 | — | — |
| Papua New Guinea | 152 | 2 | 60 | 3 | 87 |
| Paracel Islands | 5 | 1 | 1 | — | 3 |
| Philippines | 24 | — | 5 | 3 | 16 |
| Puerto Rico | 10 | 5 | 3 | — | 2 |
| Russia | 1 | — | — | 1 | — |
| Seychelles | 6 | — | — | 2 | 4 |
| Singapore | 4 | — | 1 | — | 3 |
| Solomon Islands | 14 | — | 2 | 1 | 11 |
| Somalia | 1 | — | — | — | 1 |
| South Africa | 13 | — | 2 | 1 | 10 |
| South Georgia | 1 | — | — | — | 1 |
| South Korea | 5 | — | — | 3 | 2 |
| Spain | 17 | — | 1 | 4 | 12 |
| Taiwan | 3 | — | — | — | 3 |
| Thailand | 18 | — | 4 | 1 | 13 |
| Tonga | 2 | 1 | — | — | 1 |
| Trinidad & Tobago | 2 | — | — | — | 2 |
| Tunisia | 2 | — | — | 2 | — |
| USA | 44 | 6 | 29 | 3 | 6 |
| Vanuatu | 3 | 1 | — | — | 2 |
| Vietnam | 1 | — | — | — | 1 |
| Virgin Islands | 2 | — | — | 1 | 1 |
| Totals | 1296 | 70 | 367 | 130 | 729 |
| 5.4% | 28.3% | 10.0% | 56.3% | ||
Short-term intensive collections and long-term collections can influence the total number of collections for a country. For example, Ayling made biweekly collections of Aaptos aaptos at two sites in New Zealand for two and a half years (1976–1978).27 Those 130 collections are greater than the total collections for all but two countries and more than twice the number of collections of the next most collected species. Similar examples are the 50 collections of Conus species in 1963 over two months in Thai and Indonesian waters and the 64 collections also of Conus species in 1997 from Papua New Guinea.28 Not all of the collections were made to investigate MNPs; some collections were part of research projects on reef or species ecology or habitat extents.
Keeping all these caveats in mind, six countries had the most collections: New Zealand (161 collections; Ayling’s collections are 81% of the total), Papua New Guinea (152; Kohn’s collections are 42% of the total), Australia (147; 80% from the Great Barrier Reef), Japan (113), Indonesia (82), and Palau (73) (see also Figure SI#2–1).
Collections by Year.
The collection dates for the 1,296 collections span the years from 1945 to 2011, with the bulk occurring from 1976 to 2008 (Table 9). The temporal distribution of the collections, which peaked in the 1990s to early 2000s, is unsurprising given that our investigation focused on MNPs in more advanced stages of clinical testing. More recent collections tend to focus MNPs that are not included here. The potentially misleading effect of Ayling’s Aaptos aaptos collections (1976–1978)27 can be seen if they are subtracted from the annual totals. Kohn’s 1963 and 1997 Conus collections28 both create large peaks for those two years.
Table 9.
Collections by Year: Reported, Predicted, and Total (doubles omitted)
| Year | Rep.a | Pred.b | Total | Year | Rep.a | Pred.b | Total | Year | Rep.a | Pred.b | Total |
|---|---|---|---|---|---|---|---|---|---|---|---|
| Pre-1960 | 2 | 0 | 2 | ||||||||
| 1960 | 0 | 0 | 0 | 1980 | 8 | 1 | 9 | 2000 | 31 | 7 | 38 |
| 1961 | 0 | 0 | 0 | 1981 | 17 | 5 | 22 | 2001 | 13 | 5 | 18 |
| 1962 | 1 | 0 | 1 | 1982 | 9 | 4 | 13 | 2002 | 25 | 15 | 40 |
| 1963 | 50c | 0 | 50 | 1983 | 15 | 5 | 20 | 2003 | 36 | 14 | 50 |
| 1964 | 0 | 0 | 0 | 1984 | 6 | 10 | 16 | 2004 | 50 | 2 | 52 |
| 1965 | 0 | 0 | 0 | 1985 | 24 | 9 | 33 | 2005 | 22 | 2 | 24 |
| 1966 | 0 | 0 | 0 | 1986 | 20 | 8 | 28 | 2006 | 35 | 4 | 39 |
| 1967 | 1 | 0 | 1 | 1987 | 20 | 18 | 38 | 2007 | 10 | 2 | 12 |
| 1968 | 2 | 0 | 2 | 1988 | 24 | 10 | 34 | 2008 | 32 | 0 | 32 |
| 1969 | 0 | 0 | 0 | 1989 | 21 | 12 | 33 | 2009 | 4 | 0 | 4 |
| 1970 | 1 | 0 | 1 | 1990 | 17 | 7 | 24 | 2010 | 4 | 0 | 4 |
| 1971 | 0 | 0 | 0 | 1991 | 36 | 15 | 51 | 2011 | 3 | 0 | 3 |
| 1972 | 2 | 1 | 3 | 1992 | 30 | 10 | 40 | 2012 | 0 | 0 | 0 |
| 1973 | 3 | 0 | 3 | 1993 | 32 | 10 | 42 | 2013 | 0 | 0 | 0 |
| 1974 | 2 | 2 | 4 | 1994 | 21 | 9 | 30 | 2014 | 0 | 0 | 0 |
| 1975 | 4 | 4 | 8 | 1995 | 28 | 14 | 42 | Total | 1035 | 261 | 1296 |
| 1976 | 39d | 1 | 40 | 1996 | 27 | 20 | 47 | ||||
| 1977 | 68d | 2 | 70 | 1997 | 92c | 11 | 103 | ||||
| 1978 | 85d | 2 | 87 | 1998 | 31 | 6 | 37 | ||||
| 1979 | 13 | 11 | 24 | 1999 | 19 | 3 | 22 | ||||
collection dates reported by source reference.
collection dates predicted due to lack of reported collection date.
Kohn collections of Conus spp.: 1963 – 50; 1997 – 64.
Ayling collections of Aaptos aaptos: 1976 – 30; 1977 – 52; 1978 – 48.
Predicting Collection Dates.
As shown in Table 9 (bottom right corner), 261 collections (about 20 percent) were reported without collection dates. We explored the possibility of using the source article’s publication date as a predictor of the collection date by developing an ordinary least squares regression model. Despite the possibility that some of the reports are based on frozen specimens collected years prior to the publication, the model yields reasonable results (R2 = 0.86) (details can be found in Section 3.2 of the Overview). The combined annual totals of collections with reported dates and with predicted dates are shown in Table 9.
Collections by Species.
We are using the term “species” in a broad sense to include specimens that could only be identified to the genus level. Of the 232 species reported here, 56 (24%) are only identified by their genus, and collectively they represent 166 (13%) collections. As described above and shown in Table 5, the dozen species with the greatest number of collections are Aaptos aaptos (137 collections), Moorea producens (64), Lamellodysidea herbacea (61), Luffariella variabilis (60), Theonella swinhoei (40), Rhabdastrella globostellata (35), Lissoclinumpatella (33), Dolabella auricularia (29), Ecteinascidia turbinata (25), Negombata magnifica (24), Mycale hentscheli (21), and Salinispora arenicola (20). Of the remaining species, 174 species (75%) have five or fewer collections, and 93 species (40%) have only one collection.
Collections by Phylum.
Most of the classification units we refer to as a phylum are in fact a phylum, but there are several exceptions that result from unsettled taxonomy or a disconnect between common associations and current taxonomic classifications: Fish is a paraphyletic group in the phylum Chordata;29 Fungi is a kingdom within domain Eukaryota; Green Algae is a paraphyletic group of division Chlorophyta and division Charophyta; Rhodophyta is a phylum, but that classification appears to be an unsettled taxonomic issue;30 and, Tunicata is a subphylum of phylum Chordata.31 Table 10 shows both the phylum totals and the percentage of total collections the phylum totals represent.
Table 10.
Collections by Phyluma
| Actinobacteriab | 40 | 3.1% |
| Bryozoac | 18 | 1.4% |
| Cnidariad | 31 | 2.4% |
| Cyanobacteriae | 77 | 5.9% |
| Dinoflagellataf | 13 | 1.0% |
| Echinodermatag | 12 | 0.9% |
| Fish | 29 | 2.2% |
| Fungi | 3 | 0.2% |
| Green Algae | 8 | 0.6% |
| Hemichordatah | 2 | 0.2% |
| Mollusca | 195 | 15.1% |
| Nemerteai | 3 | 0.2% |
| Poriferaj | 716 | 55.2% |
| Rhodophytak | 4 | 0.3% |
| Tunicatal | 145 | 11.2% |
Fucoxanthin is found in most or all species of the classes Phaeophyceae (brown algae), Chrysophyceae (golden algae), and Bacillariophyceae (diatoms) in the phylum Ochrophyta plus some species in the phyla Dinoflagellata and Haptophyta, possibly as many as 16,000 species in total. These species and their collections are not included in the analyses presented here. See fucoxanthin entry in the MPT (SI#3) for references.
Gram-positive bacteria.
mostly colonial filter feeders.
includes octocorals.
ex-blue-green algae.
mostly marine plankton.
includes starfish, sea urchins, & sea cucumbers.
acorn worms.
ribbon worms.
sponges.
red algae.
tunicates.
Collections by Clinical Status.
As described above, we categorized MNPs according to the most advanced stage of pharmacological investigation they reached for any of their potential therapeutic uses. For collections of specimens that yielded multiple MNPs having different clinical status, we assigned them to the most advanced category. For example, collections of Aplysinella rhax, the source of panobinostat (Approved) and psammaplin A (Lead/Probe), are categorized as Approved. The distribution of collections can be found at the bottom of Table 8, which also provides the clinical status distributions of collections by country.
COMMON ERRORS AND OMISSIONS FOUND IN COLLECTION REPORTS
As has been described above, collections data reported by source references sometimes contain errors of commission or omission. We attempted to correct errors and surmise missing data. In some instances, this meant including two or more possible locations for a collection; in others, the number of collections or the collection location is just our best estimate. We created some broad categories and subcategories (Table 6) to organize prominent examples, which can be found in Table SI#1–3, which lists over 165 such examples. Some of the problems are unavoidable, such as when a specimen’s taxonomic classification is revised or the collection location’s placename is changed. Other problems are created by advances in technology, such as the significant advances in geolocation technology that make pinpoint determinations of location possible with a handheld device or the click of a mouse. A goodly number of problems (mainly omitted data) likely result from a belief that the data are unimportant or unnecessary. Finally, there are a small number of typographic errors that were missed by the many pairs of eyes that read the text prior to publication (such as arcminute values greater than 60).
It is understandable that the focus of most investigators is on issues related to the chemistry and pharmacology of the MNPs, but we would urge them to strive for complete and accurate reporting of their collections (e.g., use BGN Approved Names or Recognized Name Variants, report accurate lat-lon coordinates, report dates of collections, etc.). Blunt and colleagues and Leal and colleagues have made similar suggestions in the past.32
DEVELOPING A METRIC OR MODEL OF PHARMACOLOGICAL POTENTIAL
The large quantity of data and information in this series of documents makes summarization difficult, but we would suggest that several observations can be made:
MNPs currently provide ecosystem services as clinically useful drugs and probes, and potentially many more MNPs could become pharmacologically useful.
Consequently, benefits assessments of marine ecosystems, particularly coral reefs, should include existing and potential pharmacological benefits from MNPs.
MNPs with pharmacological potential have been found in marine ecosystems of every continent and every ocean.
MNPs with pharmacological potential are found in many marine phyla, but Porifera (sponges) and microorganisms (including symbiotic microorganisms of Porifera and other phyla) are the most frequently identified sources for the collections reviewed here.
The data reported here represent the first, necessary step in a multi-step process of exploration. The data lay the foundation for the development of methods for predicting, qualitatively or quantitatively, a location’s pharmacological potential and the ecosystem services that could arise therefrom. The data may afford the possibility of defining pharmacological potential in terms of either a single endpoint (FDA approval) or a combination of mid-points and endpoints (e.g., an experimentally useful lead or probe, clinical testing but not approval, etc.). One avenue of exploration would combine the collection location data with the species distributions to pinpoint hotspots within the species distribution and to identify inconsistencies that merit further examination. This path could reduce uncertainties related to taxonomic and specimen identification. Another avenue of investigation would combine the spatial collections data with reef condition data and predictions of reef condition to explore whether there is a relationship between reef condition and pharmacological potential. If such a relationship is discovered, it could lead to a metric or model for predicting a location’s pharmacological potential.
LONG-TERM MAINTENANCE OF THE DATA
Large data sets such as the one described in this article are ephemeral unless they are maintained and regularly updated. If the data contained in the Supporting Information documents are seen as sufficiently valuable to warrant regular updating, it will be incumbent on the MNP community to devise a means of accomplishing that (perhaps as Faulkner and then Blunt and colleagues provide annual surveys of new MNPs).
Supplementary Material
ACKNOWLEDGMENTS
We thank D. M. Holland, A. J. Macpherson, D. A. Trembath, and R. E. Baumgardner for their internal review of this document and their very helpful comments. We would also like to thank N. A. Principe and J. R. Wills for Japanese language assistance. We gratefully acknowledge the support of L. D. Worthy, Jr., T. G. Roberts, and C. Giri. We appreciate the efforts of the Vlaams Instituut voor de Zee (Flanders Marine Institute) for its creation and maintenance of the World Register of Marine Species (WoRMS) and of the U. S. Board of Geographic Names (BGN), the U. S. National Geospatial-Intelligence Agency (NGA), and U. S. Geological Survey (USGS) for their ongoing support and maintenance of the GeoNet Names Server (GNS) and the Geographic Names Information System (GNIS). The U.S. Environmental Protection Agency through its Office of Research and Development funded the research described herein. It has been subjected to the Agency’s peer and administrative review and has been approved for publication. Mention of trade names or commercial products does not constitute endorsement or recommendation for use. The views expressed in this article are those of the authors and do not necessarily represent the views or policies of the U. S. Environmental Protection Agency. This is a contribution to the EPA Office of Research and Development’s Sustainable and Healthy Communities Research Program.
Footnotes
ASSOCIATED CONTENT
Supporting Information
The Supporting Information is available free of charge on the ACS Publications website at DOI: 10.1021/acs.jnatprod.8b00288 (n.b.: SI#1–SI#4 & SI#6 are combined in a single file.)
The authors declare no competing financial interest.
REFERENCES
- (1).(a) Leal MC; Puga J; Serôdio J; Gomes NCM; Calado R PLoS ONE 2012, 7, e30580. [DOI] [PMC free article] [PubMed] [Google Scholar]; (b) Leal MC; Madeira C; Brandão CA; Puga J; Calado R Molecules 2012, 17, 9842–9854. [DOI] [PMC free article] [PubMed] [Google Scholar]; (c) Leal MC; Munro MHG; Blunt JW; Puga J; Jesus B; Calado R; Rosa R; Madeira C Nat. Prod. Rep. 2013, 30, 1380–1390. [DOI] [PubMed] [Google Scholar]
- (2).Spalding MD; Fox HE; Allen GR; Davidson N; Ferdana ZA; Finlayson M; Halpern BS; Jorge MA; Lombana A; Lourie SA; Martin KD; McManus E; Molnar J; Recchia CA; Robertson J BioScience 2007, 57, 573–583. [Google Scholar]
- (3).Mukherjee J; Llewellyn LE; Evans-Illidge EA A. Mar. Drugs 2008, 6, 550–577. [DOI] [PMC free article] [PubMed] [Google Scholar]
- (4). The first of Faulkner’s reviews was published in two parts in 1984. The next review was published in 1986 and annually thereafter through 2002. The citations for the reviews of 1984, 1986, and 2002 are given below; the citations for the intervening years can be found in Table SI#1–2. [Google Scholar]; (a) Faulkner D J. Nat. Prod. Rep 1984, 1, 251–280. [Google Scholar]; (b) Faulkner DJ Nat. Prod. Rep. 1984, 1, 551–598. [Google Scholar]; (c) Nat. Prod. Rep. 1986, 3, 1–33. [DOI] [PubMed] [Google Scholar]; (d) 2002, 19, 1–49. [Google Scholar]
- (5). Blunt and colleagues have published annual reviews from 2003 to the present. The citations for the reviews of 2018 are given below, and the citations for the intervening years can be found in Table SI#1–2. [Google Scholar]; (a) Blunt JW; Copp BR; Munro MHG; Northcote PT; Prinsep MR Nat. Prod. Rep. 2003, 20, 1–48. [DOI] [PubMed] [Google Scholar]; (b) Blunt JW; Carroll AR; Copp BR; Davis RA; Keyzers RA; Prinsep MR Nat. Prod. Rep. 2018, 35, 8–53. [DOI] [PubMed] [Google Scholar]
- (6). Hill published 11 annual reviews beginning in 2003 and ending in 2013.The citations for the first and last years are below, and the citations for the intervening years can be found in Table SI#1–2. [Google Scholar]; (a) Hill RA Annu. Rep. Prog. Chem, Sect. B: Org. Chem. 2003, 99, 183–207. [Google Scholar]; (b) 2013, 109, 146–166. [Google Scholar]
- (7). Mayer and colleagues published annual and biennial reviews of preclinical findings from 1998 to 2006 for potential anticancer MNPs and from 1998 to 2011 for all other therapeutic uses. The citations for the 1999 reviews are below, and the citations for the other reviews can be found in Table SI#1–2. [Google Scholar]; (a) Mayer AMS; Lehmann VKB Anticancer Res. 2001, 21, 2489–2500. [PubMed] [Google Scholar]; (b) Mayer AMS; Hamann MT Comp. Biochem. Physiol., Part C: Toxicol. Pharmacol. 2002, 132, 315–339. [DOI] [PubMed] [Google Scholar]
- (8). Butler and colleagues have published periodic reviews of MNPs in clinical testing from 2005 to 2017, covering from the end of 2004 to the end of 2015. The citations for the first and most recent reviews are below, and the citations for the other reviews can be found in Table SI#1–2. [Google Scholar]; (a) Butler MS Nat. Prod. Rep. 2005, 22, 162–195. [DOI] [PubMed] [Google Scholar]; (b) Butler MS; Blaskovich MA; Cooper MA J. Antibiot. 2017, 70, 3–24. [DOI] [PubMed] [Google Scholar]
- (9).(a) Faulkner DJ Nat. Prod. Rep. 2000, 17, 1–6. [DOI] [PubMed] [Google Scholar]; (b) Faulkner DJ Antonie van Leeuwenhoek 2000, 77, 135–145. [DOI] [PubMed] [Google Scholar]
- (10).(a) Newman DJ; Cragg GM; Snader KM J. Nat. Prod. 2003, 66, 1022–1037. [DOI] [PubMed] [Google Scholar]; (b) Newman DJ; Cragg GM J. Nat. Prod. 2007, 70, 461–477. [DOI] [PubMed] [Google Scholar]; (c) Newman DJ; Cragg GM J. Nat. Prod. 2012, 75, 311–335. [DOI] [PMC free article] [PubMed] [Google Scholar]; (d) Newman DJ; Cragg GM J. Nat. Prod. 2016, 79, 629–661. [DOI] [PubMed] [Google Scholar]
- (11). Citations for five reviews by Cragg, Newman, and colleagues are below. A more extensive list can be found in Table SI#1–2. [Google Scholar]; (a) Cragg GM; Newman DJ; Snader KM J. Nat. Prod. 1997, 60, 52–60. [DOI] [PubMed] [Google Scholar]; (b) Cragg GM; Newman DJ Phytochem. Rev. 2009, 8, 313–331. [Google Scholar]; (c) Newman DJ; Cragg GM J. Nat. Prod. 2004, 67, 1216–1238. [DOI] [PubMed] [Google Scholar]; (d) Newman DJ; Cragg GM; Battershill CN Diving Hyperb. Med. 2009, 39, 216–225. [PubMed] [Google Scholar]; (e) Newman DJ; Giddings L-A Phytochem. Rev. 2014, 13, 123–137. [Google Scholar]
- (12). Citations for five reviews based on chemical families are below. A more extensive list can be found in Table SI#1–2. [Google Scholar]; (a) Delfourne E, Bastide, J. Med. Res. Rev. 2003, 23, 234–252. [DOI] [PubMed] [Google Scholar]; (b) Ebada SS, Lin W, Proksch P Mar. Drugs 2010, 8, 313–346. [DOI] [PMC free article] [PubMed] [Google Scholar]; (c) Han TS; Teichert RW; Olivera BM; Bulaj G Curr. Pharm. Des. 2008, 14, 2462–2479. [DOI] [PubMed] [Google Scholar]; (d) Molinski TF Chem. Rev. 1993, 93, 1825–1838. [Google Scholar]; (e) White KN; Tenney K; Crews PJ Nat. Prod. 2017, 80, 740–755. [DOI] [PMC free article] [PubMed] [Google Scholar]
- (13). Citations for five reviews based on a phylum are below. A more extensive list can be found in Table SI#1–2. [Google Scholar]; (a) Cooper EL; Yao D Drug Discovery Today 2012, 17, 636–648. [DOI] [PubMed] [Google Scholar]; (b) Fiedler H; Bruntner C; Bull A; Ward A; Goodfellow M; Potterat O; Puder C; Mihm G Antonie van Leeuwenhoek 2005, 87, 37–42. [DOI] [PubMed] [Google Scholar]; (c) Jensen PR; Fenical W In Drugs from the Sea; Fusetani N, Ed.; Karger: Basel, 2000; pp 6–29. [Google Scholar]; (d) Menna M; Fattorusso E; Imperatore C Molecules 2011, 16, 8694–8732. [Google Scholar]; (e) Sipkema D; Franssen MCR; Osinga R; Tramper J; Wijffels RH Mar. Biotechnol. 2005, 7, 142–162. [DOI] [PMC free article] [PubMed] [Google Scholar]
- (14). Citations for five reviews based on therapeutic use are below. A more extensive list can be found in Table SI#1–2. [Google Scholar]; (a) Alonso D; Castro A; Martinez A Expert Opin. Ther. Pat. 2005, 15, 1377–1386. [Google Scholar]; (b) Dembitsky VM; Gloriozova TA; Poroikov VV Mini-Rev. Med. Chem. 2005, 5, 319–336. [DOI] [PubMed] [Google Scholar]; (c) Donia M; Hamann MT Lancet Infect. Dis. 2003, 3, 338–348. [DOI] [PMC free article] [PubMed] [Google Scholar]; (d) Simmons TL; Andrianasolo E; McPhail K; Flatt P; Gerwick WH Mol. Cancer Ther. 2005, 4, 333–342. [PubMed] [Google Scholar]; (e) Tohme R; Darwiche N; Gali-Muhtasib H Molecules 2011, 16, 9665–9696. [DOI] [PMC free article] [PubMed] [Google Scholar]
- (15). Citations for five reviews based on genus, family, or order are below. A more extensive list can be found in Table SI#1–2. [Google Scholar]; (a) Bewley CA; Faulkner DJ Angew. Chem, Int. Ed. 1998, 37, 2162–2178. [DOI] [PubMed] [Google Scholar]; (b) D’Auria MV; Zampella A; Zollo F In Bioactive Natural Products; Atta-ur-Rahman, Ed.; Studies in Natural Products Chemistry, Vol. 26, Part G; Elsevier: San Diego, 2002; pp 1175–1258. [Google Scholar]; (c) Erpenbeck D; Hooper JNA; Bonnard I; Sutcliffe P; Chandra M; Perio P; Wolff C; Banaigs B; Wörheide G; Debitus C; Petek S Mar. Biol. 2012, 159, 1119–1127. [Google Scholar]; (d) Fenical WJ Nat. Prod. 1987, 50, 1001–1008. [DOI] [PubMed] [Google Scholar]; (e) Yamada K; Kigoshi H Bull. Chem. Soc. Jpn. 1997, 70, 1479–1489. [Google Scholar]
- (16). Citations for three reviews based on country are below. A more extensive list can be found in Table SI#1–2. [Google Scholar]; (a) Berlinck RGS; Hajdu E; da Rocha RM; de Oliveira JHHL; Hernández ILC; Seleghim MHR; Granato AC; de Almeida ÉVR; Nuñez CV; Muricy G; Peixinho S; Pessoa C; Moraes MO; Cavalcanti BC; Nascimento GGF; Thiemann O; Silva M; Souza AO; Silva CL; Minarini PRR J. Nat. Prod. 2004, 67, 510–522. [DOI] [PubMed] [Google Scholar]; (b) Faulkner DJ; Newman DJ; Cragg GM Nat. Prod. Rep. 2004, 21, 50–76. [DOI] [PubMed] [Google Scholar]; (c) Feussner K-D; Ragini K; Kumar R; Soapi KM; Aalbersberg WG; Harper MK; Carté B; Ireland CM Nat. Prod. Rep. 2012, 29, 1424–1462. [DOI] [PubMed] [Google Scholar]
- (17). Citations for five reviews based on biodiversity are below (see also note 13d). A more extensive list can be found in Table SI#1–2. [Google Scholar]; (a) Cragg GM; Newman DJ Pure Appl. Chem. 2005, 77, 7–24. [Google Scholar]; (b) Engene N; Choi H; Esquenazi E; Rottacker EC; Ellisman MH; Dorrestein PC; Gerwick WH Environ. Microbiol. 2011, 13, 1601–1610. [DOI] [PMC free article] [PubMed] [Google Scholar]; (c) Gontang EA; Fenical W; Jensen PR Appl. Environ. Microbiol. 2007, 73, 3272–3282. [DOI] [PMC free article] [PubMed] [Google Scholar]; (d) Hay ME; Fenical W Oceanography 1996, 9, 10–20. [Google Scholar]; (e) Olivera BM J. Biol. Chem. 2006, 281, 31173–31177. [DOI] [PubMed] [Google Scholar]
- (18).WoRMS Editorial Board. World Register of Marine Species. 2016. Available from URL:https://www.marinespecies.org_at_Flanders_Marine_Institute (Vlaams Instituut voor de Zee [VLIZ]), Ostend, West Flanders, Belgium. [Google Scholar]
- (19).Vanhoorne Bart, Flanders Marine Institute (VLIZ), Ostend, West Flanders, Belgium: Personal communication, 2015. [Google Scholar]
- (20).GNS: URL:http://geonames.nga.mil/namesgaz/; GNIS: URL:https://geonames.usgs.gov/.
- (21).International Olympic Committee (IOC). List of National Olympic Committees in IOC Protocol Order. 2013; URL:https://stillmed.olympic.org/media/Document%20Library/OlympicOrg/Documents/National-Olympic-Committees/List-of-National-Olympic-Committees-in-IOC-Protocol-Order.pdf; also, URL:https://en.wikipedia.org/wiki/List_of_IOC_country_codes.
- (22).International Organization for Standardization (ISO). International Standard ISO 3166–1 Codes for the representation of names of countries and their subdivisions — Part 1: Country codes; Reference number ISO 3166–1:2013(E/F); ISO: Geneva, Switzerland, 2013, Third edition; ~70 pp; URL:https://www.iso.org/obp/ui/#search/code/ [online search engine]; URL:https://www.iso.org/obp/ui/#iso:std:iso:3166:−1:ed-3:v1:en,fr [publication/purchase information]; also, URL:https://en.wikipedia.org/wiki/ISO_3166-1_alpha-3. [Google Scholar]
- (23).Fenical William, Scripps Institution of Oceanography, University of California, San Diego, San Diego, CA: Personal communication, 2015. [Google Scholar]
- (24).Aaptos aaptos taxon details page: URL:http://www.marinespecies.org/aphia.php?p=taxdetails&id=134241#links under Links, direct PDF download: URL:http://www.marinespecies.org/aphia.php?p=linkget&id=338949
- (25).Note that in the GEDB placemark labels, binomial names are not italicized.
- (26).Also called the drunkard’s search: “.. .a drunkard would look for keys under the street light because it is easy to do so, not because the keys are likely to be there.” Keren G; Wu G In The Wiley Blackwell Handbook of Judgment and Decision Making; Keren G; Wu G, Eds.; John Wiley & Sons, Ltd.: Chichester, UK, 2015; pp 1–39 (p 25). [Google Scholar]
- (27).Ayling AL Biol. Bull. 1980, 158, 271–282. [Google Scholar]
- (28).(a) Kohn AJ Atoll Res. Bull. 1971, 140, 1–29. [Google Scholar]; (b) Kohn AJ; Nybakken JW Mar. Biol. 1975, 29, 211–234. [Google Scholar]; (c) Kohn AJ Coral Reefs. 2001, 20, 25–38. [Google Scholar]
- (29).URL:https://www.marinespecies.org/aphia.php?p=taxdetails&id=11676
- (30).URL:https://www.marinespecies.org/aphia.php?p=taxdetails&id=852 URL:https://en.wikipedia.org/wiki/Red_algae#Taxonomy.
- (31).URL:https://www.marinespecies.org/aphia.php?p=taxdetails&id=146420.
- (32).(a) Blunt JW; Copp BR; Munro MHG; Northcote PT; Prinsep MR Nat. Prod. Rep. 2011, 28, 196–268. [DOI] [PubMed] [Google Scholar]; (b) Leal MC; Hilario A; Munro MHG; Blunt JW; Calado R Nat. Prod. Rep. 2016, 33, 747–750. [DOI] [PubMed] [Google Scholar]
Associated Data
This section collects any data citations, data availability statements, or supplementary materials included in this article.