

Abstract
The release of the hormones oxytocin (OT) and vasopressin (VP) into the circulation is dictated by the electrical activity of hypothalamic magnocellular neurosecretory cells (MNCs). In the paraventricular nucleus of the hypothalamus (PVN), MNC neuronal activity is exquisitely sensitive to changes in input from inhibitory GABAergic synapses. To explore the hypothesis that efficacy at these synapses is dictated by the rate at which a given synapse is activated, we obtained whole-cell recordings from MNCs in postnatal day 21–27 male Sprague Dawley rat brain slices. IPSCs were elicited by electrically stimulating GABAergic projections from either the suprachiasmatic nucleus or putative interneuron populations immediately ventral to the fornix at 5, 10, 20, and 50 Hz. Short-term plasticity was observed at 88% of the synapses tested. Of this group, synaptic depression was observed in 58%, and synaptic facilitation was observed in 41%. Identification of cells using a combined electrophysiological and immunohistochemical approach revealed a strong correlation between cell phenotype and the nature of the plasticity. Short-term facilitation was observed preferentially in OT cells (86%), whereas short-term depression was predominant in VP neurons (69%). We next examined the effects of dopamine, which increases MNC excitability, on short-term plasticity. Activation of presynaptic D4 receptors decreased the frequency of miniature IPSCs and prevented the development of synaptic depression at higher rates of activity. Synaptic facilitation, however, was unaffected by dopamine. These findings demonstrate that, by lowering GABA release probability, dopamine confers high-pass filtering properties to the majority of inhibitory synapses onto MNCs in PVN.
Keywords: magnocellular, GABA, neuroendocrine, SCN, PVN, synaptic
Introduction
The electrical activity of hypothalamic magnocellular neurosecretory cells (MNCs) that determines the release of the hormones oxytocin (OT) and vasopressin (VP) from axon terminals in the neurohypophysis (Bourque et al., 1993; Hatton and Li, 1998) is sensitive to changes in synaptic input to these cells. Both anatomical (Decavel and Van den Pol, 1990, 1992) and physiological (Moos, 1995; Bains and Ferguson, 1997) studies demonstrate a critical role for inhibitory GABAergic synapses in regulating the activity of MNCs. This input to MNCs in the paraventricular nucleus of the hypothalamus (PVN) can originate from a number of different areas. The most well defined projections arise from cells in the suprachiasmatic nucleus (SCN) (Buijs et al., 1994; Hermes et al., 1996; Cui et al., 2000) and local interneurons that relay inputs from higher cortical and limbic structures (Boudaba et al., 1996).
In addition to prominent GABAergic inputs, PVN is also densely innervated by dopaminergic fibers (Buijs et al., 1984; Liposits, 1993; Cheung et al., 1998). These fibers may originate from incertohypothalamic dopamine neurons located in the zona incerta (Cheung et al., 1998), a region that is important in regulating fluid homeostasis (Mok and Mogenson, 1986). Immunohistochemical evidence also indicates the presence of D2, D3, and D4 receptors in PVN (Buijs et al., 1984). Dopamine augments the release of OT during lactation (Moos and Richard, 1982), facilitates the release of VP (Bridges et al., 1976; Forsling and Williams, 1984; Rossi, 1998), and increases the excitability of MNCs (Moos and Richard, 1982; Mason, 1983). Furthermore, in the supraoptic nucleus (SON), dopamine directly depolarizes MNCs (Yang et al., 1991) and decreases the release of both GABA (Azdad et al., 2003) and the excitatory neurotransmitter glutamate (Price and Pittman, 2001).
In other brain regions, neurotransmitter release is also regulated dynamically by the rate at which the nerve terminal is activated (Tsodyks and Markram, 1997; Thomson and Bannister, 1999; Dittman et al., 2000; Kreitzer and Regehr, 2000; Hefft et al., 2002; Telgkamp and Raman, 2002). We hypothesized that a similar, short-term synaptic plasticity may be an important determinant of information transfer at hypothalamic synapses. Furthermore, because this plasticity is sensitive to changes in the release probability (Pr) (Tsodyks and Markram, 1997; Kreitzer and Regehr, 2000), we reasoned that a compound, such as dopamine, should affect the development of this plasticity. To test this hypothesis, we obtained whole-cell recordings from MNCs in the PVN. Electrical stimulation of afferents at varying frequencies elicited IPSCs that exhibited short-term plasticity, in the form of either synaptic depression or facilitation. Dopamine decreased GABA release and prevented the development of synaptic depression at high rates of activity.
Materials and Methods
All experiments were performed according to protocols approved by the University of Calgary animal care and use committee in accordance with guidelines established by the Canadian Council on Animal Care.
Slice preparation. Hypothalamic slices containing the PVN were prepared from postnatal day 21 (P21) to P27 male Sprague Dawley rats. Animals were anesthetized with sodium pentobarbitol (30–50 mg/kg) and decapitated, and the brains were rapidly removed into ice-cold high-sucrose slicing solution (saturated with 95% O2–5% CO2) and allowed to cool for ∼3 min. The slicing solution contained the following (in mm): 87 NaCl, 2.5 KCl, 25 NaHCO3, 0.5 CaCl2, 7 MgCl2, 1.25 NaH2PO4, 25 glucose, and 75 sucrose. The brain was then blocked, mounted on a vibrating slicer (Leica, Nussloch, Germany), and submerged in slicing solution that was constantly bubbled with 95% O2–5% CO2. The brain was cut in the coronal plane, and hemisected slices of 300 μm thickness, containing the hypothalamus, were incubated at 32.5°C in a submerged chamber of oxygenated artificial CSF (aCSF) for a minimum of 90 min before recording. The aCSF contained the following (in mm): 126 NaCl, 2.5 KCl, 26 NaHCO3, 2 CaCl2, 2 MgCl2, 1.25 NaH2PO4, and 10 glucose. In some experiments, to increase the release probability, the relative ratio of the divalent cations was altered as follows: Ca2+ was increased to 2.5 mm, and Mg2+ was lowered to 1.5 mm. To decrease the release probability, 10 μm CdCl2 was added to the bath. This concentration has been shown to decrease, but not completely block, GABA release (Hefft et al., 2002).
Electrophysiological recordings. Whole-cell recordings were obtained from MNCs visually identified using an upright microscope [Zeiss (Oberkochen, Germany) AxioskopII FS Plus or Olympus Optical (Tokyo, Japan) BX51W] fitted with infrared differential interference contrast optics. All recordings were obtained at 32.5°C using borosilicate glass microelectrodes (tip resistance of 3–7 MΩ) filled with intracellular solution containing the following (in mm): 123 K-gluconate, 2 MgCl2, 8 NaCl, 1 EGTA, 0.3 K2ATP, and Na2GTP, buffered with 16 HEPES. The internal solution was filtered before use.
With the exception of the initial verification of cell type based on the electrical fingerprint in bridge mode, all experiments were performed in voltage-clamp mode, and recordings were accepted when access resistance changes were limited to <15%. All experiments were performed on PVN MNCs first identified visually and then confirmed by their prominent delay to first spike in response to depolarizing current steps from hyperpolarized potentials (Tasker and Dudek, 1991). The perfusate always contained DNQX (10 μm; Tocris Cookson, Ellisville, MO) to block excitatory AMPA-mediated synaptic currents. The membrane potential was clamped to –80 mV to prevent activation of NMDA receptors. All remaining events were blocked by bicuculline methiodide (10 μm; n = 5) or picrotoxin (100 μm; n = 3), confirming that they were the result of chloride flux through the GABAA receptor channel. Stimuli were applied using a bipolar stimulating electrode that was positioned directly in the SCN (Hermes et al., 1996; Cui et al., 2000), in the ventral region of the slice immediately adjacent to the ventricle between SCN and PVN, or immediately ventral to the fornix, the approximate location of GABA interneurons (Boudaba et al., 1996) (see Fig. 1). Stimulus trains, consisting of individual 50 μsec pulses at one of the following frequencies, 0.1, 5, 10, 20, and 50 Hz, were generated using a Grass Instruments (Quincy, MA) P88 stimulator. All data points represent a minimum of 14 sweeps at the given test frequency. Each 1 sec sweep was separated by a 10 sec interval. Signals were amplified with the Multiclamp 700A amplifier (Axon Instruments, Foster City, CA), low-pass filtered at 1 kHz, and digitized at 5–10 kHz using the Digidata 1322 (Axon Instruments).
Figure 1.

Evoked GABAergic IPSCs in PVN MNCs. A, Schematic depicts experimental configuration with three different stimulating electrode positions. Electrical stimulation in any of the three regions elicits a monosynaptic IPSC in MNCs (shown on right). The complete abolition of the synaptic event by 100 μm picrotoxin confirms that it is mediated by GABAA receptors. B, Evoked synaptic currents at different postsynaptic membrane potentials are shown. Plotting the current (peak)–voltage relationship reveals a reversal potential of –58 mV. Calibration: A, 50 pA, 5 msec; B, 100 pA, 10 msec.
Data analysis. Data were digitized (pClamp 9; Axon Instruments) and stored on computer for off-line analysis. Evoked currents were analyzed using Clampex 9 (Axon Instruments). Before calculating the amplitude of individual IPSCs in the train, traces were examined by eye, and those in which spontaneous IPSCs obscured the peak of the evoked response were discarded. The amplitude of the synaptic current was calculated from the baseline (current before the first evoked response) to the peak of each evoked response. For clarity, the stimulus artifacts have been removed digitally from the traces depicted. Miniature IPSCs (mIPSCs) were analyzed using MiniAnalysis 4.5 (Synaptosoft, Decatur GA). Events were detected when they crossed a threshold set at three times the baseline noise. The detected events were confirmed as synaptic events by eye. mIPSCs in individual cells were compared between groups using a Kolmogorov–Smirnov statistic. All other values shown are mean ± SEM. Data points were compared using ANOVA with a post hoc Newman–Keuls test (multiple groups) or Student's t test (two groups).
Immunohistochemistry. For immunohistochemical identification of the recorded cell, biocytin (1 mg/ml) was included in the internal solution. Before terminating the experiment, depolarizing current was injected (in bridge mode) to generate action potentials in the neuron at 20–40 Hz for 5 min to facilitate the filling of cells with biocytin (Hirasawa et al., 2003). The slice was fixed in 4% paraformaldehyde and 0.1 m PBS at a pH of 7.4 for 24 hr, transferred to 20% sucrose–PBS, and cut into 12 μm sections. Alternate sections were treated with either OT-neurophysin mouse monoclonal antibody (CRL-1800; American Type Culture Collection, Manassas, VA) or AVP-neurophysin mouse monoclonal antibody (CRL-1799; American Type Culture Collection), at 1:2000 dilution in 0.1 m PBS with 10% BSA and 0.1% Triton X-100, and incubated overnight at room temperature. Slices were then washed with PBS, and a 1:500 dilution of cyanine 3-conjugated goat anti-mouse secondary antibody (Amersham Biosciences, Baie d'Urfe, Québec, Canada) was added with a 1:500 dilution of avidin-conjugated fluorescein isothiocyanate (FITC) (Vector Laboratories, Burlingame, CA) (to label biocytin) for 2 hr at room temperature. The sections were examined under a laser confocal fluorescence microscope (BX61; Olympus Optical) for the presence of OT or VP immunoreactivity (cyanine 3) and biocytin labeling (FITC).
Chemicals. Dopamine (Sigma, St. Louis, MO) was stored in frozen 1 mm aliquots and prepared fresh for each experiment. Because catecholamines oxidize quickly when exposed to light, all experiments were conducted in darkness and the dopamine syringe was wrapped in aluminum foil to shelter it from stray light. The D2 and D4 receptor agonists quinpirole and PD168077, respectively, and the D4 receptor antagonist L-745,870 (all from Tocris Cookson) were stored in frozen 10 mm aliquots and diluted to the appropriate concentrations as required. All remaining drugs and chemicals were purchased from Sigma.
Results
Recordings were obtained from 143 neurons in the PVN. All of the cells in the present study exhibited a prominent delay to first spike when depolarized from negative potentials and failed to show spike-frequency accommodation in response to strong depolarizing pulses. These criteria have been used to classify neurons in PVN as putative MNCs (Tasker and Dudek, 1991). Stimulation in any one of three different regions in the coronal slice (Fig. 1) elicited monosynaptic IPSCs in MNCs that were completely abolished by picrotoxin, which antagonizes the actions of GABA (100 μm; n = 3) (Fig. 1A), and reversed polarity near the predicted reversal potential for Cl– (–60 mV) (Fig. 1B).
Use-dependant plasticity of inhibitory synapses
We first examined the behavior of inhibitory inputs from SCN to MNCs in PVN during stimulus trains given at 20 Hz, a frequency that is representative of firing rates exhibited by SCN cells in vivo in response to flashes of light (Aggelopoulos and Meissl, 2000). We tested responses in 32 cells to stimulation of the SCN. Short-term plasticity, which we defined as a change in the amplitude of the synaptic response during the 1 sec train, was observed in 28 of 32 cells (91%) tested in this manner. No change in the IPSC amplitude was observed in the remaining four cells, and these were not included for additional analysis. In the cell population in which plasticity was observed, the majority of cells (n = 16; 57%) exhibited a robust depression of synaptic responses (Fig. 2A) to ∼50% by the fifth stimulus (Fig. 2B). In a smaller fraction (n = 13; 46%), we observed a prominent facilitation (Fig. 2A). The IPSCs late in the train increased in amplitude almost three-fold when compared with the first IPSC (Fig. 2B). To determine whether these responses were an exclusive function of the SCN to PVN connection or whether they represented a more general property of GABAergic inputs to MNCs in PVN, we stimulated in two additional regions in the coronal slice (Fig. 1). Activation of the fiber pathway immediately ventral to the PVN, which is primarily composed of SCN efferents intermingled with fibers originating in the arcuate nucleus, revealed a similar distribution of synaptic responses. In 24 cells tested, short-term plasticity was observed in 21 (88%). Of these cells, synaptic depression was again the predominant form of plasticity, being present in 12 cells (57%), whereas synaptic facilitation was observed in nine cells (43%). In addition to a direct inhibitory projection from the SCN (Buijs et al., 1994; Hermes et al., 1996; Cui et al., 2000), MNCs in PVN also receive inhibitory input from GABAergic interneurons positioned just outside the nucleus, ventral to the fornix (Boudaba et al., 1996). In an effort to activate this putative pathway, we positioned the stimulating electrode immediately ventral to the fornix and examined synaptic responses to 20 Hz stimulation in 43 cells. Again, short-term plasticity was present in an overwhelming majority of cells (n = 38). Of these cells, synaptic depression was observed in 22 (58%), and facilitation was observed in 16 (42%).
Figure 2.
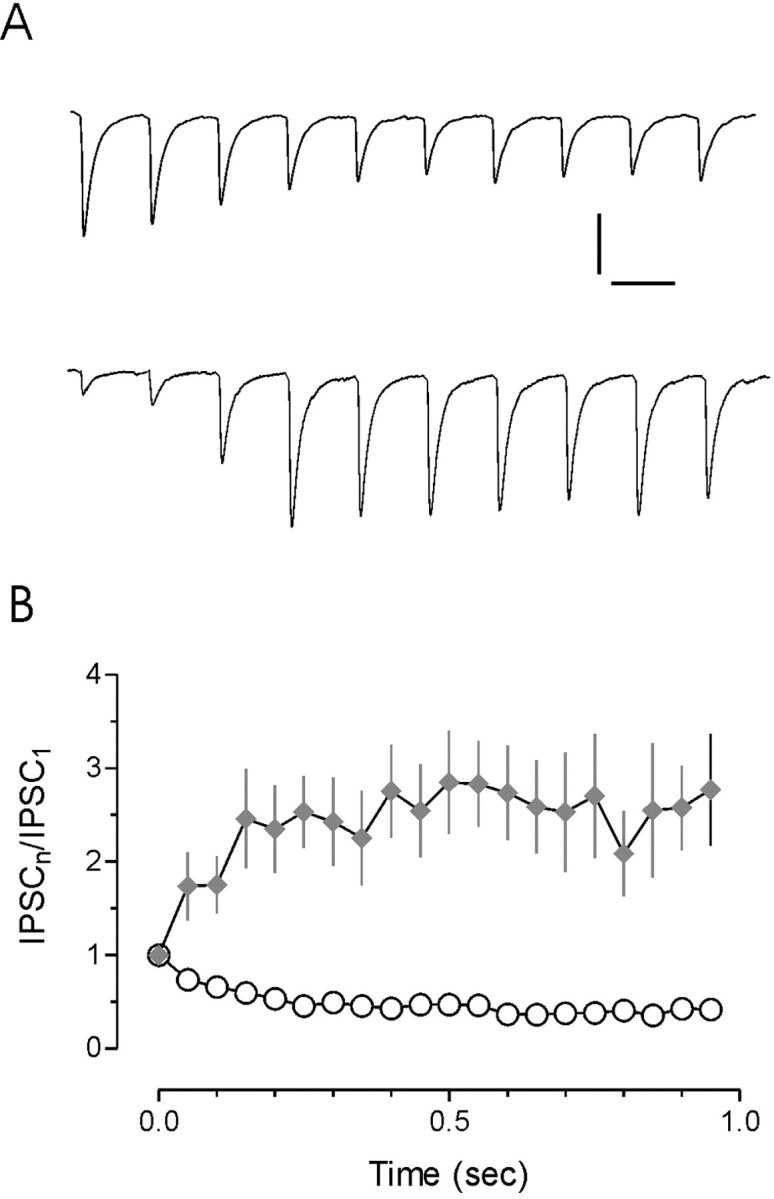
Non-uniform responses to stimulation at physiological frequency. A, Representative traces of synaptic responses evoked by pulse trains of 20 Hz in two different magnocellular neurons. Short-term plasticity was observed in 88% of all synapses tested. In the majority of these cells, short-term synaptic depression was observed (58%; n = 50 of 87; top trace). Synaptic facilitation was observed in 41% of the cells tested (n = 36 of 87; bottom trace). B, Summary of synaptic facilitation and depression at 20 Hz is plotted with respect to time. Calibration: 50 pA, 50 msec.
Release probability and short-term synaptic plasticity
Short-term plasticity is sensitive to changes in Pr (Tsodyks and Markram, 1997; Kreitzer and Regehr, 2000). To examine whether Pr was a determinant of synaptic dynamics at hypothalamic synapses, we first lowered Pr by the addition of 10 μm CdCl2 to the bath solution. As an indicator of the efficacy of CdCl2, we noted a 79 ± 11% (n = 8; p < 0.05) decrease in the amplitude of the first IPSC in the train. We then examined the effects of lowering Pr on facilitation and depression independently. The extent of the plasticity was quantified by examining the relative amplitude of the 10th IPSC as a function of the first IPSC (IPSC10/IPSC1). At facilitating synapses, there was no change in the relative level of IPSC facilitation (control IPSC10/IPSC1, 2.54 ± 0.50; CdCl2 IPSC10/IPSC1, 2.29 ± 0.58; p > 0.05; n = 4) (Fig. 3Ai). In contrast, at depressing synapses, lowering Pr altered the synaptic responses during the train, such that facilitation, rather than depression, was evident (control IPSC10/IPSC1, 0.47 ± 0.05; CdCl2 IPSC10/IPSC1, 1.04 ± 0.34; n = 4; p < 0.05) (Fig. 3Aii).
Figure 3.

Plasticity during trains is dictated by release probability. Release probability was decreased by adding 10 μm CdCl2 to the bath or increased by manipulating the Ca2+/Mg2+ ratio. A, Decreasing the Pr had no effect on the development of synaptic facilitation (Ai) in four cells tested. In contrast, synaptic depression (Aii) was attenuated (n = 4). B, Increasing Pr prevented the development of synaptic facilitation (Bi). After this manipulation, synapses were seen to depress rather than facilitate (n = 4). In contrast, increasing Pr had no effect on the development of synaptic depression (Bii). The dashed lines represent mean facilitation and depression plots obtained from Figure 2.
We next examined the effects of increasing Pr on the two forms of short-term synaptic plasticity. Once the presence of short-term plasticity was established in a given cell, the ratio of divalent cations was altered from 2 Ca2+/2 Mg2+ to 2.5 Ca2+/1.5 Mg2+. As an indicator of the efficacy of this manipulation in increasing Pr, we noted a 27 ± 10% (n = 8; p < 0.05) increase in the amplitude of the first IPSC in the train. We then examined the effects of increasing Pr on facilitating and depressing synapses independently. At depressing synapses, this manipulation had no effect on the development of short-term plasticity (control IPSC10/IPSC1, 0.57 ± 0.07; high Pr IPSC10/IPSC1, 0.54 ± 0.05; n = 4; p > 0.05) (Fig. 3Bi). In contrast, at facilitating synapses, increasing Pr attenuated the development of short-term facilitation, and, in three of the four cells tested, a clear synaptic depression was evident (control IPSC10/IPSC1, 2.54 ± 0.50; high Pr IPSC10/IPSC1, 0.52 ± 0.1; n = 4; p < 0.05) (Fig. 3Bii). We also conducted experiments in which slices were never exposed to 2 Ca2+/2 Mg2+ solution, but rather a 2.5 Ca2+/1.5 Mg2+ solution was used for the entire experiment. Under these conditions (n = 9; data not shown), there was little change in the ratio of depressing (n = 5) to facilitating synapses (n = 4).
Cell phenotype and short-term synaptic plasticity
Given that the dynamics of release at inhibitory synapses can be dictated by the postsynaptic cell (Gupta et al., 2000) and because the MNC population is composed of two phenotypically distinct cell populations (OT and VP), we examined whether one modality of plasticity was uniquely coupled to a specific cell type. Using electrophysiological criteria for differentiating OT and VP cells (Stern and Armstrong, 1997; Hirasawa et al., 2003), combined with immunohistochemical identification of peptide content, we probed the relationship between putative cell phenotype and short-term synaptic plasticity. Consistent with the findings from previous work in the SON (Hirasawa et al., 2003), we observed two types of current–voltage relationships when cells were hyperpolarized from –40 mV (Fig. 4A). The current–voltage relationship was either linear or exhibited inward rectification (Fig. 4B). Immunohistochemical analysis revealed that cells with the former electrical fingerprint (linear I–V) were immunopositive for VP (n = 7) (Fig. 4C), whereas those showing inward rectification were immunopositive for OT (n = 5) (Fig. 4D). We were unable to identify the phenotype of three cells that exhibited a linear I–V relationship and two cells that exhibited inward rectification. We then examined whether there was a relationship between cell phenotype and the dynamics of the inhibitory synaptic responses. During these experiments, synaptic facilitation was observed in 16 cells. Of this population, 13 (86%) were classified, according to electrical fingerprint, as OT cells. The remaining three (14%) were classified as VP cells. Synaptic depression was observed in 26 of the cells tested. Of this group, 18 (69%) were identified as VP cells and eight (31%) as OT cells.
Figure 4.
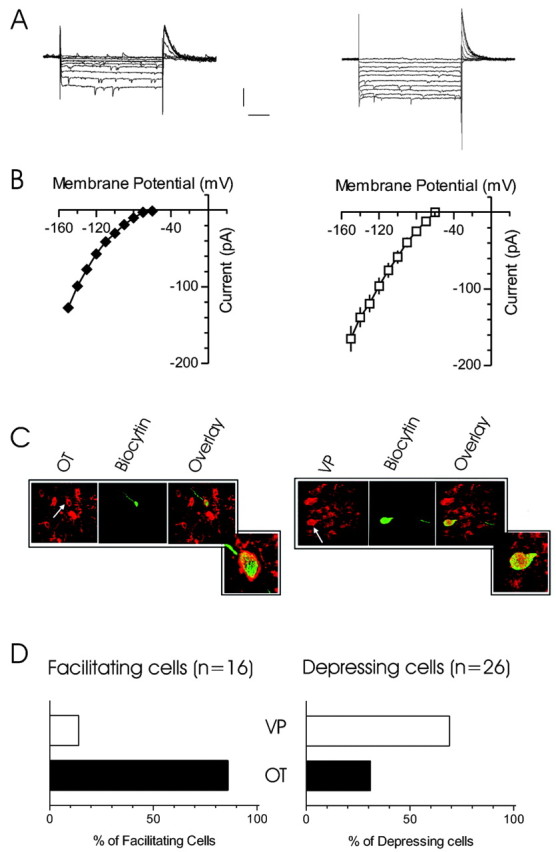
Relationship of synaptic response with cell phenotype. A, Voltage-clamp records show currents evoked by hyperpolarizing current steps in two different cells. The cells were held at –40 mV and subjected to 10 mV, 500 msec steps. The sharp downward deflections evident in the current traces are spontaneous synaptic events. The cell on the left exhibits a prominent inward rectification at negative potentials, and the cell on the right shows no rectification. B, I–V plots from these two cell types demonstrate the relationship between membrane potential and whole-cell current. C, Immunohistochemical examination demonstrates that cells with rectifying I–V relationships (left) are immunopositive for OT, whereas cells with linear I–V relationships (right) are immunopositive for VP. D, Analysis of cell phenotype and synaptic response to pulse trains demonstrates that OT was the predominant phenotype for cells in which facilitation was observed (13 of 16; 86%). In contrast, the VP phenotype was observed in the majority of cells in which depression was evident (18 of 26; 69%). Calibration: 100 pA, 100 msec.
Frequency dependence of short-term synaptic plasticity
We next examined the two different forms of short-term plasticity more carefully by stimulating GABAergic fibers at four different frequencies, 5, 10, 20, and 50 Hz (Fig. 5A,B). We first examined the depressing synapses. No depression was observed at 5 Hz, and thus the responses at this frequency were not analyzed further. For 10 Hz stimulation, the depression was 0.49 ± 0.04 (n = 10) (Fig. 5C). A similar level of depression was observed at 20 Hz (0.41 ± 0.05; n = 22; p > 0.05). At 50 Hz, however, the extent of the depression (0.28 ± 0.03; n = 17) (Fig. 5C) was more robust than at either 10 Hz (p < 0.01) or 20 Hz (p < 0.05). A single-exponential fit to the data was used to generate a time constant for the initial phase of the depression. The time constants in response to 10, 20, and 50 Hz stimulus trains were 0.21, 0.09, and 0.02 sec, respectively (data not shown).
Figure 5.

Plasticity of transmission at different stimulation frequencies. A, Traces show representative examples of synaptic depression evoked in response to synaptic stimulation at 10, 20, and 50 Hz. The extent of the depression is quantified below (B). The depression is frequency dependant, developing more quickly at higher rates of activity. C, A comparison of the relative IPSC evoked by the 10th pulse at each of the three frequencies. Fractionally greater depression was observed at 50 Hz (*p < 0.05 vs 20 Hz; **p < 0.01 vs 10 Hz). D, Traces show representative examples of synaptic facilitation evoked in response to 10, 20, and 50 Hz stimulation. The facilitation is frequency dependant (compare 10 with 20 Hz), but, as is clear in E, there appears to be a saturation of the response at higher frequencies. F, A plot of the relative IPSC frequencies demonstrates greater facilitation at 20 and 50 Hz compared with 10 Hz (*p < 0.05 and **p < 0.01, respectively). No difference was evident when comparing between IPSC10 at 20 and 50 Hz. Calibration: 50 pA, 50 msec.
At facilitating synapses, the rate and extent of the plasticity was also frequency dependent (Fig. 5D,E). The extent of the facilitation was quantified as IPSC10/IPSC1 for each of the three different frequencies. At 10 Hz, the facilitation was 1.78 ± 0.43 (n = 6). Greater facilitation was observed at 20 Hz (2.54 ± 0.50; n = 10; p < 0.05), whereas at 50 Hz, the most robust facilitation was observed (2.90 ± 0.53; n = 12; p < 0.01 compared with 10 Hz). There was no difference in IPSC10/IPSC1 between the 20 and 50 Hz stimulations (p > 0.05). The time constants for the initial phase of the facilitation in response to 10, 20, and 50 Hz stimulus trains were 1.86, 0.07, and 0.02 sec, respectively (data not shown).
Dopamine reversibly decreases Pr
Dopamine decreases the release of GABA at inhibitory synapses onto MNCs in the SON by activating presynaptic D4 receptors (Azdad et al., 2003). To determine whether inhibitory synapses onto MNCs in PVN were similarly affected, we bath applied dopamine and examined the effect on evoked and mIPSCs. Dopamine (100 μm) inhibited evoked IPSCs in all cells tested (n = 16) (Fig. 6A). The synaptic response recovered completely during washout of dopamine (minimum of 20 min) (Fig. 6A,B). On average, IPSCs were depressed by 81.3% (control IPSC amplitude, 110.2 ± 26.2; dopamine IPSC amplitude, 20.7 ± 4.5; n = 16; p < 0.01) (Fig. 6C). Consistent with findings in the SON (Azdad et al., 2003), we also observed an inhibition of IPSCs by the D4 receptor agonist PD168077 (30 μm; 69.3 ± 11.5% depression; n = 7; data not shown) but not by quinpirole, an agonist for the D2-like receptor family (90 μm; 5.2 ± 9.3% depression; n = 5; data not shown).
Figure 6.

Dopamine reversibly depresses evoked IPSCs. A, Voltage-clamp traces (each is an average of 20 individual synaptic responses) demonstrate the effect of dopamine and the subsequent recovery of the response. B, The effect of dopamine on IPSC amplitude with respect to time is shown. Bath application of dopamine (100 μm) reversibly depresses IPSC amplitude. C, Summary graph of dopamine effects on IPSC amplitude. The responses of individual cells are superimposed on the bar graph. IPSC amplitude decreased from 110.3 ± 26.2 to 20.7 ± 4.5 pA (n = 16; **p < 0.01). Calibration: 25 pA, 25 msec.
We next examined the effects of dopamine on quantal transmission. Consistent with a presynaptic site of action, dopamine (100 μm) reversibly depressed mIPSC frequency (65.9 ± 3.6%; n = 28) (Fig. 7A–C) but had no effect on the amplitude of individual events (Fig. 7B). The effects of dopamine were completely abolished by pretreatment of the slice with the D4 receptor antagonist L-745,870 (50 μm; 0.6 ± 9%; n = 7; p < 0.01 compared with dopamine) (Fig. 7C) and mimicked by the D4 receptor agonist PD168077 (mIPSC frequency depressed by 58.7 ± 6.6%; n = 10; p > 0.05 compared with dopamine) (Fig. 7C). The effects of dopamine and the D4 agonist were significantly different from those observed after application of quinpirole (15.0 ± 4.3% depression; n = 6; p < 0.05 compared with dopamine or D4 agonist) (Fig. 7C).
Figure 7.
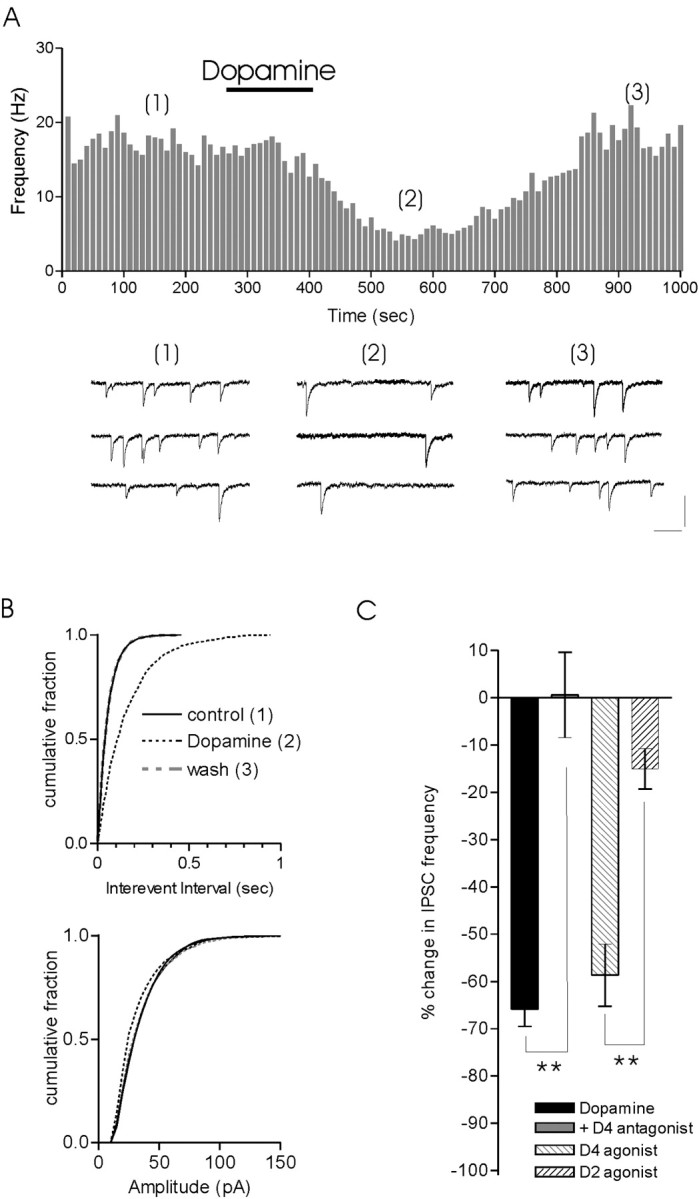
Dopamine effects are presynaptic. A, Bath application of dopamine (100 μm) reversibly decreases the frequency of mIPSCs. Representative traces from control, dopamine, and wash are shown below. B, Quantification of this data demonstrates a significant increase in the interevent interval (Kolmogorov–Smirnov statistic; p < 0.01) but no change in amplitude. C, Bar graph summarizes effects of dopamine that are blocked by the D4 antagonist L-745,870 (50 μm) and mimicked by the D4 receptor agonist PD168077 (30 μm) but not the D2 receptor agonist quinpirole (90 μm). Calibration: 20 pA, 100 msec.
Facilitation and depression are uniquely affected by dopamine
Our observations above (Fig. 3) indicate that altering release probability changes the pattern of synaptic response during a train of stimuli. Because dopamine lowers the probability of GABA release in PVN, we examined how this would affect the development of short-term plasticity at these synapses. At all frequencies tested, the first synaptic response was uniformly attenuated by dopamine in both facilitating and depressing cells (Fig. 8A,B). At facilitating synapses, a similar level of attenuation was evident for the 10th synaptic response in a train at all test frequencies (10 Hz, 26.4 ± 4.6% of control, n = 3; 20 Hz, 28.6 ± 8.3% of control, n = 6; 50 Hz, 32.7 ± 14, n = 5). In other words, at facilitating synapses, dopamine uniformly attenuated synaptic responses in a manner that was independent of their position in a stimulus train or the frequency at which the synapses were activated. This is consistent with our observation that CdCl2, which also lowers Pr, had no effect on the dynamics of release at facilitating synapses. In contrast, at depressing synapses, dopamine was less effective late in a high-frequency train. Although it decreased the amplitude of IPSC10 to ∼33 ± 12% of control IPSC10 at 10 Hz (p > 0.05; n = 4), the effect was less profound at higher frequencies. At 20 Hz, IPSC10 in dopamine was 42 ± 6% of IPSC10 in control (p < 0.05; n = 8), and more than one-half (57 ± 9%) of the control synaptic current was still present at 50 Hz (p < 0.01; n = 6).
Figure 8.

Dopamine depresses synaptic responses uniformly only in facilitating trains. A, A comparison of relative synaptic depression of the 1st and 10th IPSCs observed in response to dopamine at different stimulation frequencies. Traces show the 1st and 10th control IPSCs at 10, 20, and 50 Hz (solid line) and the IPSC in dopamine (dotted line) in cells in which synaptic facilitation was observed. The plot below demonstrates relatively little effect of stimulation frequency on the relative amount of depression by dopamine. B, IPSCs are compared in a cell that exhibited synaptic depression in response to a high-frequency stimulation train. The plot of the fractional IPSC in dopamine with respect to stimulation frequency demonstrates that the effects of dopamine are non-uniform. A greater fraction of the IPSC remains (less inhibition by dopamine) at the tail end of synaptic response in high-frequency trains. To facilitate comparison, all control traces have been peak scaled to the same amplitude. The traces in dopamine have also been scaled to represent the relative depression. All traces depicted are the average of 14–20 responses. *p < 0.05; **p < 0.01.
Dopamine prevents the development of depression at higher frequencies
Finally, we wanted to examine the consequences of this non-uniform synaptic depression on transmission throughout stimulus trains of different frequencies. Dopamine depressed responses in all trains that exhibited pulse-train depression (Fig. 9A–C). During 10 Hz stimulation trains (Fig. 9A), the fractional depression of evoked responses by dopamine was uniform throughout the train. The IPSC10/IPSC1 ratio in the presence of dopamine (0.41 ± 0.10) was not different from the IPSC10/IPSC1 ratio in control (0.48 ± 0.04; n = 4; p > 0.05) (Fig. 9D). In contrast, at 20 Hz, depression was less pronounced toward the end of the train (Fig. 9B). The IPSC10/IPSC1 ratio in the presence of dopamine (0.97 ± 0.28) was significantly different from the IPSC10/IPSC1 ratio in control (0.47 ± 0.05; n = 8; p < 0.05) (Fig. 9D). Similarly, during the 50 Hz train, the IPSC10/IPSC1 ratio (1.02 ± 0.12) was significantly different from control (0.28 ± 0.03; n = 6; p < 0.01) (Fig. 9D). Furthermore, analyzing the responses to stimuli 2–5 revealed the development of robust, intratrain facilitation (1.75 ± 0.15 compared with the first IPSC) in the presence of dopamine.
Figure 9.
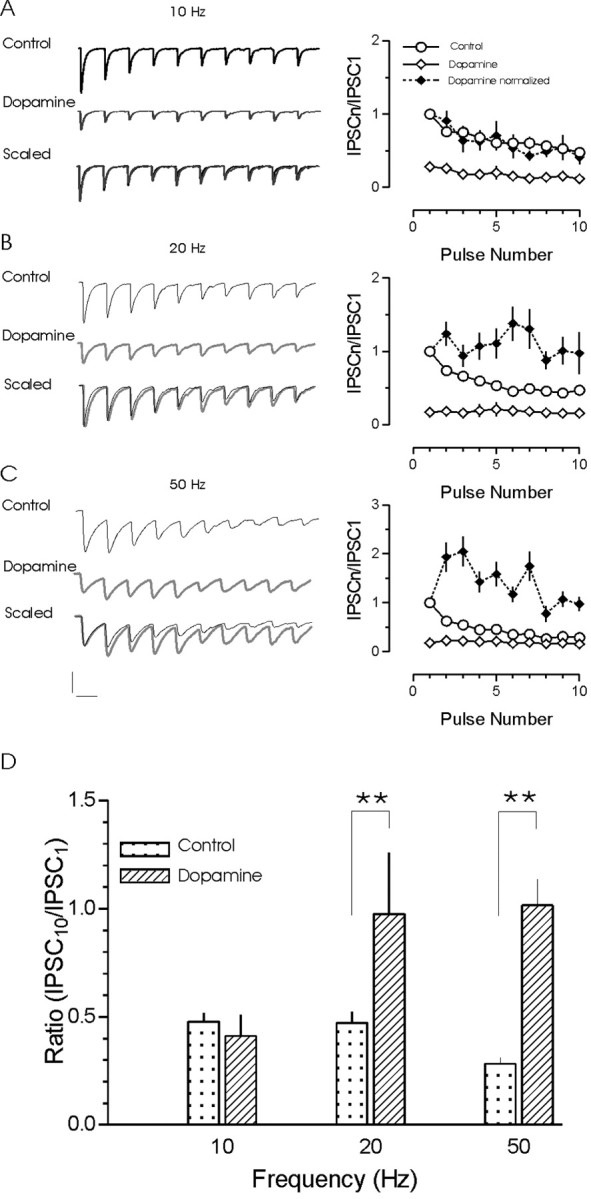
Dopamine prevents the development of use-dependent depression at higher rates of activity. Representative traces of synaptic responses evoked by pulse trains of 10 (A), 20 (B), and 50 (C) Hz in control (top trace) and dopamine (middle trace). The first IPSCs in each trace were scaled, and the traces were then overlaid (bottom). Plots of the effect of dopamine on pulse-train depression at 10 Hz (n = 3), 20 Hz, and 50 Hz (n = 8) are shown on the right. Dopamine depresses individual IPSCs at all stimulation frequencies tested and alters the development of depression during the 20 and 50 Hz trains. A shift from depression to facilitation is evident as stimulation frequency is increased. D, Summary graph of the ratio of IPSC10 to IPSC1 at each of the three different frequencies tested. The ratio increased during the 20 and 50 Hz trains by dopamine (**p < 0.01). Calibration: A, 50 pA, 100 msec; B, 50 pA, 50 msec; C, 50 pA, 20 msec.
Discussion
Inhibitory synaptic input powerfully regulates the activity patterns of MNCs in the PVN (Bains and Ferguson, 1997). Although there is increasing appreciation for the importance of the patterns of activity in influencing the strength of synaptic connections (Tsodyks and Markram, 1997), little is known about the impact of afferent activity on synaptic transmission in PVN. The findings presented here demonstrate that GABAergic synapses exhibit robust short-term plasticity when activated at frequencies ranging from 10 to 50 Hz. In the majority of the cells examined, high-frequency trains of synaptic stimuli elicited a rapid synaptic depression. Similar examples of low-pass filtering have been described at a number of inhibitory synapses in the CNS, including those in the cerebellum (Kreitzer and Regehr, 2000; Telgkamp and Raman, 2002), hippocampus (Poncer et al., 2000; Hefft et al., 2002), and neocortex (Gupta et al., 2000). The mechanisms that contribute to the development of short-term depression at hypothalamic synapses were not examined explicitly, but a number of possibilities have been invoked on the basis of work at other synapses. These include the depletion of release-ready vesicles (Dobrunz and Stevens, 1997), release sites becoming refractory during repetitive activation (Dittman et al., 2000), or activation of presynaptic autoreceptors (Cui et al., 2000; Zucker and Regehr, 2002). We did note, however, that decreasing Pr affected the manifestation of synaptic depression, consistent with reports from other brain areas, suggesting that depression may be a fundamental property of the synapse (Gupta et al., 2000; Poncer et al., 2000; Hefft et al., 2002; Telgkamp and Raman, 2002). Although there have been clear demonstrations that depression is both release and activity dependent at some neocortical (Thomson and Bannister, 1999) and hippocampal (Kim and Alger, 2001; Hefft et al., 2002) synapses, our data favor the idea that short-term depression at hypothalamic synapses is a release-dependent process. Although this evidencestrongly supports a presynaptic locus for the plasticity during trains, we cannot explicitly rule out the possible contributions of postsynaptic mechanisms, such as saturation (Kirischuk et al., 2002) or desensitization of GABAA receptors (Jones and Westbrook, 1996; Overstreet et al., 2000), which may also contribute to the abrogation of successive responses during a train.
In addition to short-term depression, we also observed a robust synaptic facilitation in a fraction of the cells. Synaptic facilitation has been attributed to increases in residual Ca2+ in the nerve terminal (Katz and Miledi, 1968; Thomson, 2000; Zucker and Regehr, 2002). This mechanism is likely responsible for the increase in synaptic strength that was observed in a fraction of the SCN to PVN synapses. Additionally, the small amplitude of the first response in a facilitating train raises the possibility that the amount of GABA released early in the train is not sufficient to saturate or desensitize postsynaptic GABAA receptors or, alternatively, to activate presynaptic inhibitory receptors that would contribute to depression. Consistent with this concept, we demonstrate that facilitation is compromised when Pr is increased by altering the Ca2+/Mg2+ ratio but is not affected when Pr is lowered with CdCl2.
We also investigated why synapses onto MNCs exhibit depression whereas others display facilitation. Either the source cell (Thomson et al., 1993; Dittman et al., 2000; Poncer et al., 2000) or the target cell (Thomson et al., 1993; Gupta et al., 2000) may dictate release dynamics during trains. Our results indicating that the ratio of facilitating and depressing responses is independent of the position of stimulating electrode argue that the mode of the short-term plasticity is likely not determined presynaptically. Furthermore, we noted a correlation between cell phenotype and the type of plasticity. Synaptic depression was observed primarily in VP cells, whereas OT cells almost exclusively exhibited synaptic facilitation. Although the relationship between cell phenotype and short-term plasticity is not absolute, it does hint at an important role for the postsynaptic cell in determining Pr. We can only speculate as to the precise nature of this role, but one intriguing possibility is that the postsynaptic cell signals the presynaptic terminal to regulate the pulse-to-pulse release of neurotransmitter precisely. The importance of dendritically released retrograde messengers in regulating synaptic strength is well established in both the SON (Kombian et al., 1997; Pittman et al., 2000; de Kock et al., 2003; Ludwig and Pittman, 2003) and PVN (Bains and Ferguson, 1997). One putative scenario is that tonic release of OT from dendrites lowers the probability of GABA release (de Kock et al., 2003) and promotes the development of facilitation. Because the release of endogenous OT would be sporadic (dictated by firing in the postsynaptic cell), this effect may only manifest itself when OT has accumulated sufficiently in the extracellular space. This may help explain why we observed both depression and facilitation in slices that were incubated in the high Pr solution, whereas acutely changing the solution during a recording completely abolished facilitation. A similar effect would not be expected at inhibitory synapses onto VP cells, because VP has been shown to inhibit TTX-insensitve glutamate but not GABA release (Kombian et al., 2000). Interestingly, VP has been shown to increase the frequency of spontaneous (TTX-sensitive) IPSCs in MNCs in PVN (Hermes et al., 2000), raising the possibility that it may regulate evoked release in a manner opposite to that of OT.
Finally, we present findings showing that dopamine depresses neurotransmission at these synapses through the activation of presynaptic D4 receptors. This is consistent with previous reports demonstrating a similar D4-mediated mechanism responsible for decreasing the release of both GABA (Azdad et al., 2003) and glutamate (Price and Pittman, 2001) at terminals in the SON. It is interesting that, although a specific agonist of the D4 receptor inhibits both GABA and glutamate release, there is little effect of quinpirole, a nonselective agonist of the D2-like family (including D4) of dopamine receptors in either the current study or previous work (Price and Pittman, 2001). One possible explanation for this discrepancy is that, whereas both D2 and D4 subtypes couple almost exclusively to pertussis toxin-sensitive G-proteins (Gi), the D3 receptors also couple to Gs (Obadiah et al., 1999; Ilani et al., 2002). This would mean that activation of D3 along with D2 and D4 (by quinpirole) could have competing effects on the release of GABA, with the D2 and D4 receptors inhibiting release and the D3 receptor increasing release. An additional possibility is that the D4 receptor in PVN is activated more effectively by dopamine or the D4-specific agonist than by quinpirole. Consistent with this idea is evidence from the CCL39 cell expression system in which dopamine and quinpirole both inhibit PKA, but dopamine alone stimulates [35S]GTP (S binding in homogenates (Gazi et al., 2000). This loss of activity of the D2 agonist may reflect differing sensitivities of dopamine and quinpirole in activating certain subtypes of D4 receptors. In addition to decreasing the probability of GABA release at low rates of activity, dopamine also attenuated the development of synaptic depression during high rates of afferent discharge. Similar effects have been documented after the activation of presynaptic GABAB receptors during high rates of transmission in the chick nucleus magnocellularis (Brenowitz et al., 1998; Brenowitz and Trussell, 2001). The mechanisms that underlie this change in the dynamics of the synaptic response are unclear, but one possibility is that inhibition of release by G-protein-coupled receptors may be overcome by a voltage-dependant facilitation of presynaptic Ca2+ channels during a burst of presynaptic activity (Park and Dunlap, 1998; Brody and Yue, 2000). These findings are further supported by recent simulations demonstrating that alleviating the Gβγ-mediated inhibition of N-type Ca2+ channels by high-frequency stimulation (Bertram et al., 2002) provides a means by which low-frequency signals can be attenuated selectively (Bertram et al., 2003) and high-frequency signals are conveyed efficiently. Our data also demonstrate a pronounced facilitation during the 50 Hz trains (pulses 2–5) in the presence of dopamine. It is tempting to speculate that this may reflect a method used by the synapses to not only filter signals according to rate but also to limit the number of spikes in a discharge that transfer information.
Physiological significance
The circulating concentrations of VP and OT exhibit a diurnal variation, but, interestingly, these variations are not in-phase (Windle et al., 1992). Recent work demonstrating that SCN input to OT neurons in the SON is differently regulated by the light/dark cycle than input to VP neurons has led to the suggestion that there may be differences in the neural pathways that relay light cues to these two cell types (Saeb-Parsy and Dyball, 2004). Because the synaptic input from SCN neurons to MNCs in PVN is almost exclusively inhibitory (Buijs et al., 1994; Hermes et al., 1996; Cui et al., 2000), it is difficult to envision a difference in the relative balance of inhibitory to excitatory input as a contributing factor. Our findings suggest an alternate explanation for a potential difference in the way light cues are relayed to MNCs: a difference in the Pr of inhibitory synapses on the two different magnocellular cell types. When coupled with the differential modulating effects of dopamine during high-frequency activity, this provides individual MNCs with a great deal of flexibility when integrating light-relevant signal from SCN neurons with other afferent information.
In addition to SCN input, inhibitory afferents from surrounding areas also exhibit a similar form of postsynaptic, cell-dependent short-term plasticity. This has important implications for deciphering the cellular and synaptic mechanisms invoked by neuromodulators, such as dopamine, to alter the excitability of these neuronal circuits. Although the “disinhibition” resulting from a decrease in tonic GABA release (Azdad et al., 2003) in tandem with the postsynaptic depolarizing actions of dopamine (Yang et al., 1991) promotes spiking in MNCs, the decrease in glutamate release (Price and Pittman, 2001) and frequency dependence of dopamine actions at inhibitory synapses hint at a more complex series of interactions. By lowering Pr, dopamine allows inhibition to build during high-frequency trains, which in turn, may allow for longer, sustained pauses in the electrical activity of MNCs and lead to the emergence of high-frequency bursts of spikes. Interestingly, both dopamine (Moos and Richard, 1982) and GABA (Moos, 1995) have been shown to increase the propensity for burst-like discharges in vivo. In addition to increasing the signal-to-noise ratio by dampening tonic release of both GABA and glutamate, dopamine imparts very precise signaling characteristics to the inhibitory synapses, effectively recruiting multiple cellular and synaptic mechanisms to sculpt the electrical output of MNCs.
Footnotes
This work was supported by grants from the Canadian Institutes for Health Research (CIHR), the Alberta Heritage Foundation for Medical Research (AHFMR), the Canadian Psychiatric Research Foundation, and the Novartis Chair for Schizophrenia Research. J.S.B. is supported by salary awards from CIHR and the AHFMR. S.A.H. is supported by an award from the Novartis Chair in Schizophrenia Research. We thank Dr. Q. J. Pittman and G. R. J. Gordon for comments on this manuscript.
Correspondence should be addressed to Jaideep S. Bains, Neuroscience Research Group, Department of Physiology and Biophysics, University of Calgary, 3330 Hospital Drive Northwest, Calgary, Alberta, Canada T2N 4N1. E-mail: jsbains@ucalgary.ca.
DOI:10.1523/JNEUROSCI.4979-03.2004
Copyright © 2004 Society for Neuroscience 0270-6474/04/245162-10$15.00/0
References
- Aggelopoulos NC, Meissl H (2000) Responses of neurones of the rat suprachiasmatic nucleus to retinal illumination under photopic and scotopic conditions. J Physiol (Lond) 523: 211–222. [DOI] [PMC free article] [PubMed] [Google Scholar]
- Azdad K, Piet R, Poulain DA, Oliet SH (2003) Dopamine D4 receptor-mediated presynaptic inhibition of GABAergic transmission in the rat supraoptic nucleus. J Neurophysiol 90: 559–565. [DOI] [PubMed] [Google Scholar]
- Bains JS, Ferguson AV (1997) Nitric oxide regulates NMDA-driven GABAergic inputs to type I neurones of the rat paraventricular nucleus. J Physiol (Lond) 499: 733–746. [DOI] [PMC free article] [PubMed] [Google Scholar]
- Bertram R, Arnot MI, Zamponi GW (2002) Role for G protein Gbeta-gamma isoform specificity in synaptic signal processing: a computational study. J Neurophysiol 87: 2612–2623. [DOI] [PubMed] [Google Scholar]
- Bertram R, Swanson J, Yousef M, Feng ZP, Zamponi GW (2003) A minimal model for G protein-mediated synaptic facilitation and depression. J Neurophysiol 90: 1643–1653. [DOI] [PubMed] [Google Scholar]
- Boudaba C, Szabo K, Tasker JG (1996) Physiological mapping of local inhibitory inputs to the hypothalamic paraventricular nucleus. J Neurosci 16: 7151–7160. [DOI] [PMC free article] [PubMed] [Google Scholar]
- Bourque CW, Oliet SH, Kirkpatrick K, Richard D, Fisher TE (1993) Extrinsic and intrinsic modulatory mechanisms involved in regulating the electrical activity of supraoptic neurons. Ann NY Acad Sci 689: 512–519. [DOI] [PubMed] [Google Scholar]
- Brenowitz S, Trussell LO (2001) Minimizing synaptic depression by control of release probability. J Neurosci 21: 1857–1867. [DOI] [PMC free article] [PubMed] [Google Scholar]
- Brenowitz S, David J, Trussell L (1998) Enhancement of synaptic efficacy by presynaptic GABA(B) receptors. Neuron 20: 135–141. [DOI] [PubMed] [Google Scholar]
- Bridges TE, Hillhouse EW, Jones MT (1976) The effect of dopamine on neurohypophysial hormone release in vivo and from the rat neural lobe and hypothalamus in vitro. J Physiol (Lond) 260: 647–666. [DOI] [PMC free article] [PubMed] [Google Scholar]
- Brody DL, Yue DT (2000) Relief of G-protein inhibition of calcium channels and short-term synaptic facilitation in cultured hippocampal neurons. J Neurosci 20: 889–898. [DOI] [PMC free article] [PubMed] [Google Scholar]
- Buijs RM, Geffard M, Pool CW, Hoorneman EM (1984) The dopaminergic innervation of the supraoptic and paraventricular nucleus. A light and electron microscopical study. Brain Res 323: 65–72. [DOI] [PubMed] [Google Scholar]
- Buijs RM, Hou YX, Shinn S, Renaud LP (1994) Ultrastructural evidence for intra- and extranuclear projections of GABAergic neurons of the suprachiasmatic nucleus. J Comp Neurol 340: 381–391. [DOI] [PubMed] [Google Scholar]
- Cheung S, Ballew JR, Moore KE, Lookingland KJ (1998) Contribution of dopamine neurons in the medial zona incerta to the innervation of the central nucleus of the amygdala, horizontal diagonal band of Broca and hypothalamic paraventricular nucleus. Brain Res 808: 174–181. [DOI] [PubMed] [Google Scholar]
- Cui LN, Coderre E, Renaud LP (2000) GABAB presynaptically modulates suprachiasmatic input to hypothalamic paraventricular magnocellular neurons. Am J Physiol Regul Integr Comp Physiol 278: R1210–R1216. [DOI] [PubMed] [Google Scholar]
- de Kock CP, Wierda KD, Bosman LW, Min R, Koksma JJ, Mansvelder HD, Verhage M, Brussaard AB (2003) Somatodendritic secretion in oxytocin neurons is upregulated during the female reproductive cycle. J Neurosci 23: 2726–2734. [DOI] [PMC free article] [PubMed] [Google Scholar]
- Decavel C, Van den Pol AN (1990) GABA: a dominant neurotransmitter in the hypothalamus. J Comp Neurol 302: 1019–1037. [DOI] [PubMed] [Google Scholar]
- Decavel C, Van den Pol AN (1992) Converging GABA- and glutamateimmunoreactive axons make synaptic contact with identified hypothalamic neurosecretory neurons. J Comp Neurol 316: 104–116. [DOI] [PubMed] [Google Scholar]
- Dittman JS, Kreitzer AC, Regehr WG (2000) Interplay between facilitation, depression, and residual calcium at three presynaptic terminals. J Neurosci 20: 1374–1385. [DOI] [PMC free article] [PubMed] [Google Scholar]
- Dobrunz LE, Stevens CF (1997) Heterogeneity of release probability, facilitation, and depletion at central synapses. Neuron 18: 995–1008. [DOI] [PubMed] [Google Scholar]
- Forsling ML, Williams H (1984) Central effects of dopamine on vasopressin release in the normally hydrated and water-loaded rat. J Physiol (Lond) 346: 49–59. [DOI] [PMC free article] [PubMed] [Google Scholar]
- Gupta A, Wang Y, Markram H (2000) Organizing principles for a diversity of GABAergic interneurons and synapses in the neocortex. Science 287: 273–278. [DOI] [PubMed] [Google Scholar]
- Hatton GI, Li Z (1998) Mechanisms of neuroendocrine cell excitability. Adv Exp Med Biol 449: 79–95. [DOI] [PubMed] [Google Scholar]
- Hefft S, Kraushaar U, Geiger JR, Jonas P (2002) Presynaptic short-term depression is maintained during regulation of transmitter release at a GABAergic synapse in rat hippocampus. J Physiol (Lond) 539: 201–208. [DOI] [PMC free article] [PubMed] [Google Scholar]
- Hermes ML, Coderre EM, Buijs RM, Renaud LP (1996) GABA and glutamate mediate rapid neurotransmission from suprachiasmatic nucleus to hypothalamic paraventricular nucleus in rat. J Physiol (Lond) 496: 749–757. [DOI] [PMC free article] [PubMed] [Google Scholar]
- Hermes ML, Ruijter JM, Klop A, Buijs RM, Renaud LP (2000) Vasopressin increases GABAergic inhibition of rat hypothalamic paraventricular nucleus neurons in vitro. J Neurophysiol 83: 705–711. [DOI] [PubMed] [Google Scholar]
- Hirasawa M, Mouginot D, Kozoriz MG, Kombian SB, Pittman QJ (2003) Vasopressin differentially modulates non-NMDA receptors in vasopressin and oxytocin neurons in the supraoptic nucleus. J Neurosci 23: 4270–4277. [DOI] [PMC free article] [PubMed] [Google Scholar]
- Jones MV, Westbrook GL (1996) The impact of receptor desensitization on fast synaptic transmission. Trends Neurosci 19: 96–101. [DOI] [PubMed] [Google Scholar]
- Katz B, Miledi R (1968) The role of calcium in neuromuscular facilitation. J Physiol (Lond) 195: 481–492. [DOI] [PMC free article] [PubMed] [Google Scholar]
- Kim J, Alger BE (2001) Random response fluctuations lead to spurious paired-pulse facilitation. J Neurosci 21: 9608–9618. [DOI] [PMC free article] [PubMed] [Google Scholar]
- Kirischuk S, Clements JD, Grantyn R (2002) Presynaptic and postsynaptic mechanisms underlie paired pulse depression at single GABAergic boutons in rat collicular cultures. J Physiol (Lond) 543: 99–116. [DOI] [PMC free article] [PubMed] [Google Scholar]
- Kombian SB, Mouginot D, Pittman QJ (1997) Dendritically released peptides act as retrograde modulators of afferent excitation in the supraoptic nucleus in vitro. Neuron 19: 903–912. [DOI] [PubMed] [Google Scholar]
- Kombian SB, Mouginot D, Hirasawa M, Pittman QJ (2000) Vasopressin preferentially depresses excitatory over inhibitory synaptic transmission in the rat supraoptic nucleus in vitro. J Neuroendocrinol 12: 361–367. [DOI] [PubMed] [Google Scholar]
- Kreitzer AC, Regehr WG (2000) Modulation of transmission during trains at a cerebellar synapse. J Neurosci 20: 1348–1357. [DOI] [PMC free article] [PubMed] [Google Scholar]
- Liposits Z (1993) Ultrastructure of hypothalamic paraventricular neurons. Crit Rev Neurobiol 7: 89–162. [PubMed] [Google Scholar]
- Ludwig M, Pittman QJ (2003) Talking back: dendritic neurotransmitter release. Trends Neurosci 26: 255–261. [DOI] [PubMed] [Google Scholar]
- Mason WT (1983) Excitation by dopamine of putative oxytocinergic neurones in the rat supraoptic nucleus in vitro: evidence for two classes of continuously firing neurones. Brain Res 267: 113–121. [DOI] [PubMed] [Google Scholar]
- Mok D, Mogenson GJ (1986) Contribution of zona incerta to osmotically induced drinking in rats. Am J Physiol 251: R823–R832. [DOI] [PubMed] [Google Scholar]
- Moos F, Richard P (1982) Excitatory effect of dopamine on oxytocin and vasopressin reflex releases in the rat. Brain Res 241: 249–260. [DOI] [PubMed] [Google Scholar]
- Moos FC (1995) GABA-induced facilitation of the periodic bursting activity of oxytocin neurones in suckled rats. J Physiol (Lond) 488: 103–114. [DOI] [PMC free article] [PubMed] [Google Scholar]
- Overstreet LS, Jones MV, Westbrook GL (2000) Slow desensitization regulates the availability of synaptic GABAA receptors. J Neurosci 20: 7914–7921. [DOI] [PMC free article] [PubMed] [Google Scholar]
- Park D, Dunlap K (1998) Dynamic regulation of calcium influx by G-proteins, action potential waveform, and neuronal firing frequency. J Neurosci 18: 6757–6766. [DOI] [PMC free article] [PubMed] [Google Scholar]
- Pittman QJ, Hirasawa M, Mouginot D, Kombian SB (2000) Neurohypophysial peptides as retrograde transmitters in the supraoptic nucleus of the rat. Exp Physiol 85: 139S–143S. [DOI] [PubMed] [Google Scholar]
- Poncer JC, McKinney RA, Gahwiler BH, Thompson SM (2000) Differential control of GABA release at synapses from distinct interneurons in rat hippocampus. J Physiol 528: 123–130. [DOI] [PMC free article] [PubMed] [Google Scholar]
- Price CJ, Pittman QJ (2001) Dopamine D4 receptor activation inhibits presynaptically glutamatergic neurotransmission in the rat supraoptic nucleus. J Neurophysiol 86: 1149–1155. [DOI] [PubMed] [Google Scholar]
- Rossi NF (1998) Dopaminergic control of angiotensin II-induced vasopressin secretion in vitro. Am J Physiol 275: E687–E693. [DOI] [PubMed] [Google Scholar]
- Saeb-Parsy K, Dyball RE (2004) Responses of cells in the rat supraoptic nucleus in vivo to stimulation of afferent pathways are different at different times of the light/dark cycle. J Neuroendocrinol 16: 131–137. [DOI] [PubMed] [Google Scholar]
- Stern JE, Armstrong WE (1997) Sustained outward rectification of oxytocinergic neurones in the rat supraoptic nucleus: ionic dependence and pharmacology. J Physiol (Lond) 500: 497–508. [DOI] [PMC free article] [PubMed] [Google Scholar]
- Tasker JG, Dudek FE (1991) Electrophysiological properties of neurones in the region of the paraventricular nucleus in slices of rat hypothalamus. J Physiol (Lond) 434: 271–293. [DOI] [PMC free article] [PubMed] [Google Scholar]
- Telgkamp P, Raman IM (2002) Depression of inhibitory synaptic transmission between Purkinje cells and neurons of the cerebellar nuclei. J Neurosci 22: 8447–8457. [DOI] [PMC free article] [PubMed] [Google Scholar]
- Thomson AM (2000) Facilitation, augmentation and potentiation at central synapses. Trends Neurosci 23: 305–312. [DOI] [PubMed] [Google Scholar]
- Thomson AM, Bannister AP (1999) Release-independent depression at pyramidal inputs onto specific cell targets: dual recordings in slices of rat cortex. J Physiol (Lond) 519: 57–70. [DOI] [PMC free article] [PubMed] [Google Scholar]
- Thomson AM, Deuchars J, West DC (1993) Large, deep layer pyramid-pyramid single axon EPSPs in slices of rat motor cortex display paired pulse and frequency-dependent depression, mediated presynaptically and self-facilitation, mediated postsynaptically. J Neurophysiol 70: 2354–2369. [DOI] [PubMed] [Google Scholar]
- Tsodyks MV, Markram H (1997) The neural code between neocortical pyramidal neurons depends on neurotransmitter release probability. Proc Natl Acad Sci USA 94: 719–723. [DOI] [PMC free article] [PubMed] [Google Scholar]
- Windle RJ, Forsling ML, Guzek JW (1992) Daily rhythms in the hormone content of the neurohypophysial system and release of oxytocin and vasopressin in the male rat: effect of constant light. J Endocrinol 133: 283–290. [DOI] [PubMed] [Google Scholar]
- Yang CR, Bourque CW, Renaud LP (1991) Dopamine D2 receptor activation depolarizes rat supraoptic neurones in hypothalamic explants. J Physiol (Lond) 443: 405–419. [DOI] [PMC free article] [PubMed] [Google Scholar]
- Zucker RS, Regehr WG (2002) Short-term synaptic plasticity. Annu Rev Physiol 64: 355–405. [DOI] [PubMed] [Google Scholar]