

Abstract
In the insect olfactory system the antennal lobe generates oscillatory synchronization of its output as a framework for coincidence detection by its target, the mushroom body (MB). The intrinsic neurons of the MB (Kenyon cells, KCs) are thus a good model system in which to investigate the functional relevance of oscillations and neural synchronization. We combine electrophysiological and modeling approaches to examine how intrinsic and circuit properties might contribute to the preference of KCs for coincident input and how their decoding of olfactory information is affected by the absence of oscillatory synchronization in their input. We show that voltage-dependent subthreshold properties of KCs bring about a supralinear summation of their inputs, favoring responses to coincident EPSPs. Abolishing oscillatory synchronization weakens the preference of KCs for coincident input and causes a large reduction in their odor specificity. Finally, we find that a decoding strategy that is based on coincidence detection enhances both noise tolerance and input discriminability by KCs.
Keywords: mushroom body, Kenyon cell, coincidence detection, oscillations, synchrony, coding
Introduction
In many sensory systems the mean firing rate of neurons contains information about the stimulus (Adrian, 1926; Hubel and Wiesel, 1962; Britten et al., 1992). For this information to be “read,” downstream neurons must integrate their inputs over time, in effect averaging any temporal patterns occurring in time scales shorter than their integration window. Neurons, however, could act as coincidence detectors integrating their inputs over much shorter time frames, therefore responding selectively to correlated input (Abeles, 1982; Carr and Konishi, 1990; Softky and Koch, 1993; Konig et al., 1996). In many different systems the selectivity for coincident inputs has been linked to different intrinsic and circuit neuronal properties, including active dendritic conductances (Margulis and Tang, 1998; Larkum et al., 1999; Schiller and Schiller, 2001; Williams and Stuart, 2002; Ariav et al., 2003), feedforward inhibition (Grothe and Sanes, 1994; Pouille and Scanziani, 2001; Brand et al., 2002), and oscillatory activity (Singer and Gray, 1995; Engel et al., 2001; Lucke and von der Malsburg, 2004). In the locust olfactory system all of these properties act together, conveying coincidence detection attributes to the decoders of olfactory information (Perez-Orive et al., 2002). To understand better how information is decoded in this system, we further explore its intrinsic and circuit properties both in control conditions and after oscillatory synchronization has been abolished.
Each locust antennal lobe (AL) has 830 excitatory projection neurons (PNs) that synapse onto the dendrites of the intrinsic cells of the ipsilateral mushroom body (MB), called Kenyon cells (KCs) (Laurent and Naraghi, 1994; Leitch and Laurent, 1996). Odor-evoked PN responses exhibit coherent 20-30 Hz oscillations and slow modulations of firing rate that are odor- and PN-specific (Laurent and Davidowitz, 1994; Laurent et al., 1996; Wehr and Laurent, 1996). Information contained in the oscillatory synchronization of PNs has been shown to be functionally and behaviorally relevant (Stopfer et al., 1997; MacLeod et al., 1998). This odor representation becomes drastically sparsened in the MB (Perez-Orive et al., 2002), a brain area involved in the formation, retrieval, and extinction of olfactory memories (Heisenberg et al., 1985; McGuire et al., 2001; Schwaerzel et al., 2002; Heisenberg, 2003).
Previous intracellular recordings of KCs have indicated that these cells can generate sharp spikelets suggestive of active conductances that could summate coincident input supralinearly (Laurent and Naraghi, 1994; Perez-Orive et al., 2002). By using both intracellular recordings and computer simulations, we wanted to explore further these intrinsic properties and their potential role in the detection of coincident inputs. To examine circuit behavior, we developed a network model that takes into account KC intrinsic and circuit properties and is capable of reproducing the olfactory representation observed experimentally in the MB (Perez-Orive et al., 2002). We used this MB model to gain insight into the possible advantages of a decoding system that is based on coincidence detection. To test the role of oscillatory synchronization in the decoding of olfactory information, we abolished AL oscillations pharmacologically and used experiments and models to understand the effect of disrupted AL temporal dynamics on KC odor tuning.
Materials and Methods
Experimental preparation and stimuli. Electrophysiological experiments were conducted on locusts (Schistocerca americana) from an established, crowded colony. Young adults of either sex were immobilized, with one antenna left intact for olfactory stimulation. The brain was exposed, desheathed, and superfused with locust saline, as described previously (Laurent and Naraghi, 1994). Odors were delivered by injection of a controlled volume of odorized air within a constant stream of desiccated air. Teflon tubing was used at and downstream from the mixing point to prevent odor lingering and cross-contamination. Several compounds commonly associated in nature with green plants were used as odor stimuli. The complete set of odors that were used included the following: 1-hexen-3-ol, trans-2-hexen-1-ol, cis-3-hexen-1-ol, 1-hexanol, 1-heptanol, 1-octanol, hexanal, octanal, nonanal, 3,7-dimethyl-2,6-octadiene-nitrile, 3-pentanone, 2-heptanone, 3-heptanone, 5-nonanone, 6-undecanone (Sigma, St. Louis, MO), cherry, mint, and geraniol (LorAnn Oils, Lansing, MI). Odors were used at 10% vapor pressure (90% of KCs) or 100% vapor pressure (10% of KCs), further diluted (∼1:10) in the desiccated air stream. Electrical stimulation of PN axons was performed in the AL, using 25 μm tungsten wire bipolar electrodes and a WPI A360 stimulus isolator (World Precision Instruments, Sarasota, FL) at 300 μsec pulses; typical stimulus amplitudes were 20-100 μA.
Electrophysiology. Intracellular sharp electrode recordings of KCs (see Fig. 1) were made with borosilicate glass micropipettes (World Precision Instruments) filled with 0.2 m K-acetate (DC resistance >200 MΩ). KC input resistance at the soma was usually ∼1 GΩ. Signals were recorded with an Axoclamp 2B (Axon Instruments, Union City, CA) and acquired (10 kHz, 12 bits) with a PCI-MIO-16E-4 data acquisition board and LabVIEW software (National Instruments, Austin, TX). For extracellular recordings (see Figs. 4, 5, 8) wire tetrodes were constructed with 0.0005 and 0.0004 inch (12.7 and 10.2 μm, respectively) insulated nichrome wire (REDIOHM wire with PAC insulation; Kanthal Palm Coast, Palm Coast, FL). Four strands of wire were twisted together and heated to partially melt the insulation. The tip was cut with fine scissors, and each channel tip was electroplated with gold solution (SIFCO, Cleveland, OH) to reduce the impedance to between 200 and 350 kΩ at 1 kHz. Tetrode recordings were made with custom-built 16-channel preamplifiers (unitary gain) and amplifiers (10,000×). Data from each tetrode were filtered (in custom-built amplifiers, bandpass 300-6000 Hz), acquired continuously (15 kHz/channel, 12 bits), and stored. Electrodes (either sharp glass or 1-3 simultaneous tetrodes) were placed within the MB soma layer, dorsal to the neuropils, at depths <200 μm. Cell identification was unambiguous because all of the somata located in the layer above the MB calyx belong to KCs. Local field potentials (LFPs) were recorded in the MB calyx, using wire tetrodes (bandpass-filtered 1-6000 or 3-6000 Hz).
Figure 1.
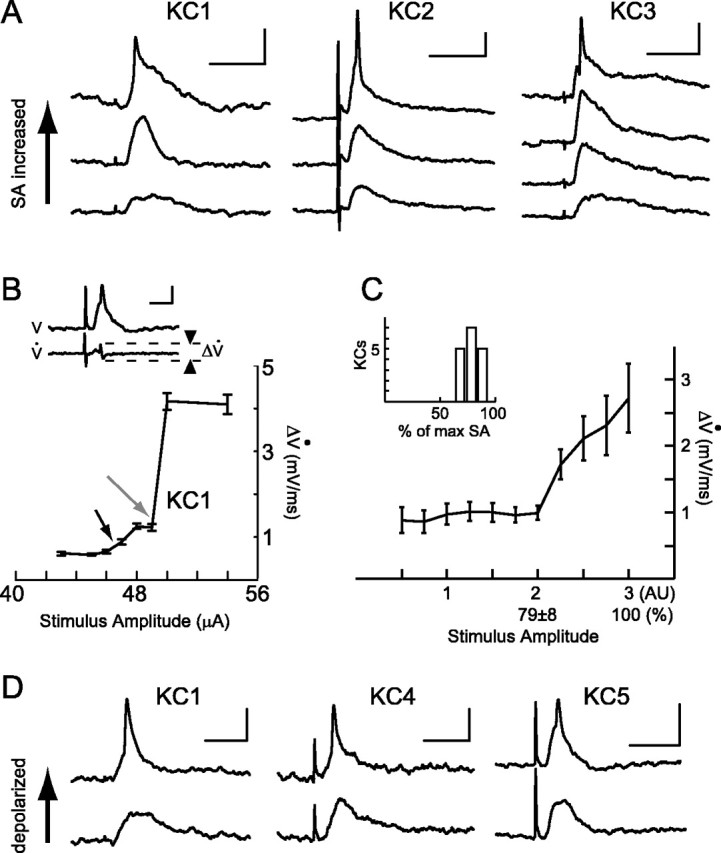
Subthreshold nonlinearities in KCs observed with intracellular recordings from KC somata in vivo. A, Influence on KC EPSP shape of increasing SA to PNs. Shown are examples for three different KCs. Increasing SA causes appearance of spikelet with distinct change in the waveform of the EPSPs (top traces). Calibration: 50 msec, 5 mV. Stimulus artifacts of different sizes (caused by different SAs that varied across experiments because of slight differences in the placement of the stimulating electrode within the AL) can be observed before the EPSPs in all raw data traces. B, Shape metric capturing transition in EPSP waveform by measuring rate of voltage change. Inset, Voltage trace (top) and its time derivative, Vdot (bottom). Calibration: 30 msec, 3 mV; 3 mV/msec. The shape metric, ΔVdot, is defined as the maximal difference in Vdot. Main plot, ΔVdot as a function of SA (always below action potential threshold) for KC1 from A. Gray arrow indicates abrupt nonlinear transition in shape metric as spikelet occurs. Smaller black arrow indicates smaller change in EPSP wave form that can be observed in the middle traces in A. C, Nonlinear behavior in KC EPSPs. Shape metric (mean ± SEM) was measured for 17 KCs. Because each KC had a different SA sensitivity (because of positioning of PN stimulating electrode), SAs are normalized (arbitrary units, AU) at two points; SA = 3 is 100% of the SA before action potential threshold, and SA = 2 is 79 ± 8% (mean ± SD) of this maximum at which the largest stepwise increase in ΔVdot occurred in each series. Inset, Histogram showing the point in which this largest stepwise increase occurred for all 17 KCs; the nonlinearity (SA = 2) occurs within a limited range of SA percentage values throughout the population of recorded KCs. D, Influence of holding current on EPSP shape. Shown are examples for three different KCs. EPSPs for each KC are evoked by the same SA. Spikelets appear in a voltage-dependent manner at more depolarized potentials (top traces). Calibration: 50 msec, 5 mV.
Figure 4.

Extracellular recordings of KC odor responses in vivo while fast inhibition is blocked in the AL. A, Responses of two different KCs to five different odors, recorded both before and after local PCT injection into the AL. Odor pulses (shaded area), 1 sec; 10 trials per odor, top to bottom. che, Cherry; hxa, hexanal; hx3, 1-hexen-3-ol; nnn, 5-nonanone; oca, octanal; oco, 1-octanol; pnn, 3-pentanone; thx, trans-2-hexen-1-ol. B, Frequency distribution of KC response probabilities (across all odors tested) before and after PCT injection into AL (n = 16 KCs recorded both before and after PCT treatment). Most KCs decrease their odor specificity after PCT injection. C, Frequency distribution of KC response intensities as measured by the number of spikes in a 3 sec window after PCT treatment (n = 17 KCs). Spike counts were computed only for cell-odor pairs with a detected response. Top, Gray bars depict median, twenty-fifth, and seventy-fifth percentiles for KC populations (control, n = 53 KCs with responses; PCT, n = 17 KCs with responses). Response intensity does not change significantly after PCT treatment.
Figure 5.
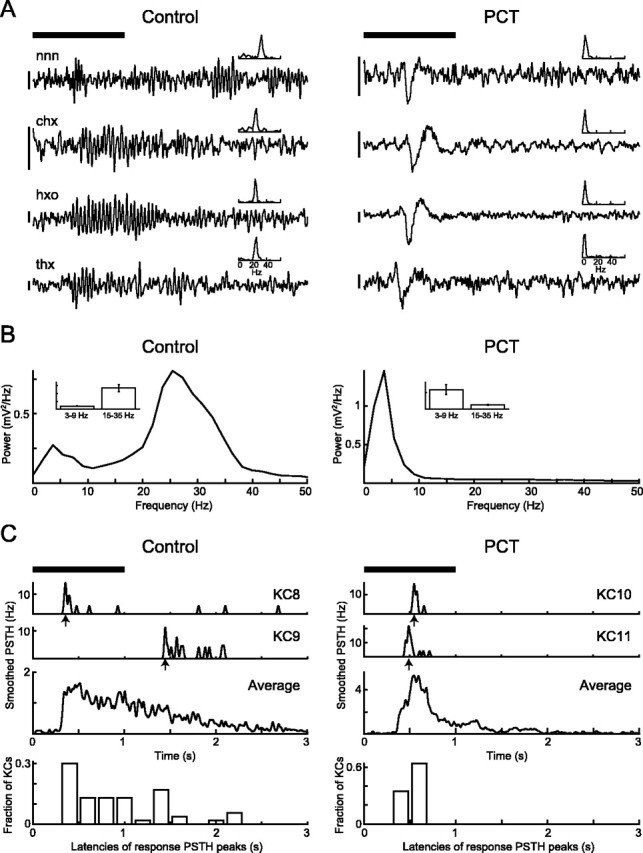
Changes to LFP and KC response latency in vivo while fast inhibition is blocked in the AL. A, Examples of four pairs of LFP recordings (3-55 Hz bandpass-filtered) from four different animals, each pair recorded with the same odor before and after PCT injection into the AL. Top bar indicates 1-sec-long odor presentation; calibration bar: 80 μV. Insets, Power spectrum for each LFP recording, calculated from a 1 sec window starting 300 m sec after the odor stimulus trigger (300 m sec is the approximate time it takes for the odor to reach the animal). nnn, 5-Nonanone; chx, cis-3-hexen-1-ol; hxo, 1-hexanol; thx, trans-2-hexen-1-ol. B, Power spectrum averages for all recorded traces (same odors before and after PCT treatment; for each condition, n = 468 trials from 52 animal-odor pairs). Insets, Mean ± SEM for 3-9 and 15-35 Hz frequency bands in each condition. After PCT treatment the power in the 15-35 Hz band is greatly reduced [because of abolishing of PN synchrony as described in MacLeod and Laurent (1996)], whereas power in the 3-9 Hz band increases (p < 0.02; n = 52; two-sided paired t test). C, KC odor response latencies. Shown from the top are PSTHs (smoothed with 10 msec Gaussian) of odor responses: examples of two KCs for each condition (arrows indicate latencies for each response measured at the time of PSTH maxima), population average, and frequency distribution of response latencies (control, n = 53 KCs with responses; PCT, n = 17 KCs with responses). In control condition the response latencies are distributed more widely, whereas after PCT treatment all latencies occur close to odor onset, corresponding to the time of the low-frequency LFP activity. All panels in A and C use the same temporal scale on the abscissa.
Figure 8.

Relationship between degree of KC phase-locking and odor specificity. Shown are polar phase plots of 10 specific and 10 promiscuous KCs; LFP cycle maxima defined as 0 rad and minima asπ rad. Thicker gray bar indicates average phase and vector magnitude for each group. Although average phases are similar, vector magnitude for the promiscuous cells is 48% of that for the specific cells. Gridlines represent 0.10 (probability per bin).
Picrotoxin microinjections. Patch pipettes were backfilled with a solution containing 5 mm picrotoxin (PCT) and 0.3% fast green (Sigma). The pipette was introduced into the AL, and a pneumatic picopump (World Precision Instruments) was used to apply a series of three or four 100 msec, 10 psi pressure pulses. Each pulse injected ∼1 pl of solution (as measured by previous injection into a drop of oil). Injected solution remained localized exclusively to the AL, as verified by dispersal of the fast green.
Analysis of experimental data. Data were analyzed with MatLab (Math-Works, Natick, MA) and IgorPro (WaveMetrics, Lake Oswego, OR). Single unit activity was obtained from extracellular data by using a modified expectation maximization algorithm and an empirically characterized noise model (Pouzat et al., 2002), which allowed us to perform several statistical tests so as to select only well isolated units meeting rigorous quantitative criteria (Pouzat et al., 2002). A KC was classified as responding (e.g., in Fig. 4) if its firing behavior during a 3 sec window starting at odor onset met two independent criteria of response amplitude and reliability (Perez-Orive et al., 2002). The amplitude criterion was satisfied in a given trial if at least one 200 msec bin had a firing rate that exceeded by 3 SDs the mean baseline rate. Baseline rate was measured for each cell-odor pair over a period of 3 sec preceding stimulus onset over all trials with that odor. To ensure that detected responses were reliable even at low firing rates, the reliability criterion required that the amplitude criterion be satisfied in more than one-half of all trials with each odor. Several variations of this response definition were tested and yielded nearly identical results (Perez-Orive et al., 2002). Phases of KC spikes with respect to LFP oscillations were measured by linearly interpolating the time between the maximum (0 or 360°) and minimum (180°) of the bandpass-filtered (15-45 Hz) LFP.
Computational model: intrinsic currents. KCs and lateral horn interneurons (LHIs) (Perez-Orive et al., 2002) were modeled as a single compartment with channels governed by Hodgkin-Huxley kinetics as follows: CmdV/dt = gL(V - EL) - Iint - Isyn, where Cm is the membrane capacitance, gL is the leakage conductance, EL is the leak reversal potential, V is the membrane potential, Iint is the sum of active intrinsic currents, and Isyn is the sum of synaptic currents. The KC model included a transient Ca2+ current, ICa (Laurent et al., 1993), a Ca2+-dependent K+ current, IK(Ca) (Sloper and Powell, 1979), and a transient (A-type) K+ current, IK,A (Grunewald, 2003); fast Na+, INa, and delayed rectified K+, IK, currents were included to account for spike generation (Traub, 1982). Current kinetics were adjusted to 23°C. The LHI model included only INa and IK. The intrinsic currents were described as follows: Iintj = gj mMhN(V - Ej), where gj is the maximal conductance for current j, Ej is its reversal potential, and m(t) and h(t) are activation and inactivation variables. In most of the simulations the maximal conductances and passive properties were Cm = 2.9·10-4 μF, gL = 2.9·10-3 μS, EL = - 65 mV, gKL = 1.16·10-3 μS(K+ component of the leak current), gNa = 26.1 μS, gK = 2.9 μS, gCa = 0.029 μS, gK(Ca) = 0.29 μS, and gK,A = 0.0145 μS for KCs; Cm = 1.43·10-4 μF, gL = 7.15·10-3 μS, gKL = 7.15·10-4 μS, gNa = 14.3 μS, and gK = 1.43 μS for LHIs. EL values for LHIs were taken from a random distribution with 10 mV variability (EL = -70 ± 5 mV), which led to variability in resting membrane potential across them. Many of the maximal conductances indicated above were varied systematically in our study to find the limits of observed phenomena.
The ICa current used for KCs had M = 2, N = 1, m∞ = 1/(1 + exp(-(V + 40)/10.0)), τm = 0, h∞ = 1/(1 + exp((V + 50)/4)), τh = [30.8 + (211.4 + exp((V + 115.2)/5))/(1 + exp((V + 86)/3.2))]/18. The IK,A current used for KCs had M = 1, N = 0, m∞ = 1/(1 + exp(-(V + 60)/1)), τm = [1/(exp((V + 35.82)/19.69) + exp(-(V + 79.69)/12.7)) + 0.37]/3.74. The IK(Ca) current used for KCs had M = 2, N = 0, m∞ = 3333[Ca]2/(3333[Ca]2 + 1), τm = 0. INa and IK were modeled as by Traub (1982). For all cells ENa = 50 mV, EK = -95 mV, ECa = 12.8 log([Ca]O/[Ca]), and [Ca]O = 2mm. For KCs the intracellular Ca2+ dynamics were described by a simple first-order model as follows: d[Ca]/dt = -A ICa - ([Ca] - [Ca]∞)/τ, where [Ca]∞ = 2.4·10-4 mm is the equilibrium intracellular Ca2+ concentration, A = 1.7862 mm/(msec·μA), and τ = 100 msec.
Computational model: synaptic currents. All synaptic currents were calculated according to Isyn = gsyn [O] (V - Esyn), where gsyn is the maximal conductance, [O](t) is the fraction of open channels, and Esyn is the reversal potential. EsynnACh = 0 mV for nicotinic receptors; EsynGABA-A = -74 mV for GABAA receptors. Synaptic currents were modeled by first-order activation schemes (Destexhe et al., 1994) as follows: d[O]/dt = α(1 - [O])[T] - β[O], where [T] represents the concentration of transmitter (Bazhenov et al., 2001a). The rate constants, α and β, were α = 10 msec-1 and β = 0.12 msec-1 for GABAA synapses and α = 0.94 msec-1 and β = 0.18 msec-1 for cholinergic synapses. The maximal conductances were gnACh(KC) = 0.044 μS for AL afferents into KCs, gnACh(LHI) = 0.0044 μS for AL afferents into LHIs, and gGABA-A = 0.05 μS for synapses from LHIs to KCs.
Network geometry and stimulation. The MB model consisted of populations of 20 KCs and 20 LHIs. Each KC received 20 inputs from the AL, with an overlap of 10 inputs between neighboring KCs (see Fig. 3A). Thus a total of 210 afferents from the AL (PNs) were modeled. Each LHI received the sum of all AL afferents. Random time delays (mean = 15 msec; SD = 7 msec) were introduced to the LHI inputs to provide a response delay and some variability across LHI firing (Perez-Orive et al., 2002). GABAergic synapses from all 20 LHIs projected then to each KC. Each “odor” stimulus was represented by an input vector characterized by a unique spatiotemporal pattern of activity across the 210 PNs. Typically, approximately one-half of the PNs were active at each instant of a given odor presentation. Additionally, ∼50% of the active PNs were synchronized with each other, producing 20 Hz oscillations in the population average (representing the LFP). The identities of the active PNs changed slowly over the stimulus duration to model the slow temporal structure of PN responses. Similarly, the identities of the PNs that were synchronized at each oscillation cycle varied to model transient spike synchronization. More specifically, we assumed that ∼50% of all PNs are active at the first cycle of odor-induced oscillations. Any active PN then could become silent at the next cycle and vice versa. However, to maintain a realistic correlation between PN activity patterns in successive cycles (Stopfer et al., 2003), we assigned a higher probability (p = 0.6) for PNs to stay in their current activation state. This created a temporal structure with excitatory and inhibitory epochs lasting on average 150-200 msec, consistent with experimental findings (Laurent et al., 1996; Stopfer et al., 2003) and our previous results of AL modeling (Bazhenov et al., 2001b).
Figure 3.
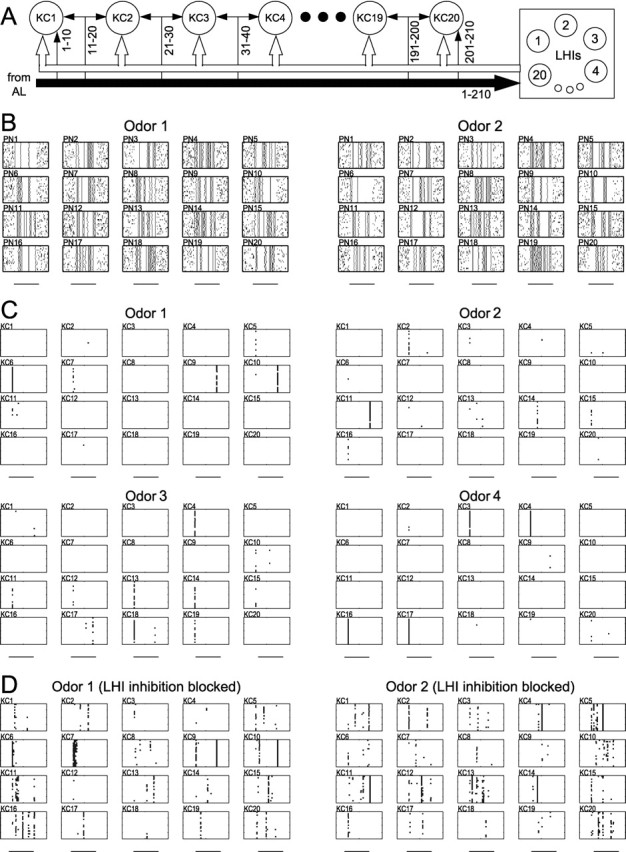
Odor specificity of KC responses in network model. A, Network model geometry. Each KC received 20 PN inputs from the AL; inputs were partially shared with neighboring KCs in the network (numbers indicate input PN indices). A network of 20 LHIs, each cell receiving all 210 inputs from the AL and contacting all 20 KCs, provided feedforward inhibition to the KCs (see Materials and Methods). B, Firing patterns of 20 representative PNs are shown for two different odors. Each box represents activity for one PN. Each stimulus (horizontal bars, 1 sec) was presented 20 times and included small variations between trials. Approximately one-half of the inputs were synchronized at each oscillation cycle, and identities of the synchronized inputs changed slowly over the stimulus duration (see Materials and Methods). C, KC responses to four different stimuli (horizontal bars, 1 sec). Each box represents one KC with 20 trials. Twenty cells are shown for each odor. Two to four KCs fired reliably in response to each stimulus. D, Removing LHI-mediated inhibitory input significantly reduced KC odor specificity. More than one-half of the KCs in the network responded reliably for each stimulus (20 trials; horizontal bars, 1 sec).
The specific spike timing of active PNs at different trials was calculated from Gaussian distributions for which the SDs, σ, were a function of PN and cycle numbers. Narrow distributions (small σ) characterized PN spikes locked to the same phase of the LFP oscillation across trials. Wide distributions characterized nonsynchronized spikes (for a given PN and time during the response). For a given neuron σ changed from one oscillation cycle to the next to model transient patterns of spike synchronization (Wehr and Laurent, 1996). To avoid abrupt transitions between synchronous and asynchronous states, we gave higher probabilities for PN spikes to maintain their assigned σ from one cycle to the next. In this way ∼50% of all active neurons were synchronized at each oscillation cycle. Finally, to simulate multiple trials with the same odor, we included small variations (from one trial to another) in the identities and synchronization patterns of active PNs. Random low-frequency spiking (4 ± 2 Hz) was modeled to simulate baseline AL activity between odor presentations. “Different” odors were modeled by completely different spatiotemporal patterns of PN activation, whereas “similar” odors were represented by inputs having the same slow temporal structure (the same PNs were active at each cycle of oscillations) but different patterns of synchronization (i.e., although the same PNs were activated at a given cycle, the identities of those that were synchronized to the LFP were different). This choice of similar versus different odors was motivated by experiments showing that PCT application to the locust AL eliminated PN oscillatory synchronization while preserving the slow temporal structure of PN firing (MacLeod and Laurent, 1996; MacLeod et al., 1998) and showing that this intervention disrupts the behavioral ability of the animal to discriminate among odors belonging to the same chemical group (“similar” odors) but preserves the ability to discriminate among chemically different odors (Stopfer et al., 1997). To model the effect of PCT application to the AL, we eliminated oscillatory synchrony across PNs and increased the probability of PN firing at odor onset so that the simulated LFP displayed the early low-frequency peak observed experimentally and predicted by a full AL model when fast inhibition is blocked (Bazhenov et al., 2001b). To accomplish this, we assumed that within the first 50 msec of odor presentation each PN can produce up to four spikes (vs 1 spike in control conditions) with a probability P = P0 + 0.6(1 - P0), where P0 is the probability of spiking in control conditions. To maintain a similar number of total PN spikes during the complete odor presentation, we reduced the probability of spiking during the rest of the stimulus (after the first 50 msec) to p = 0.5P0.
Results
KC subthreshold properties (experiments)
We performed intracellular recordings on KC somata in vivo to study their subthreshold responses to PN input. Monosynaptic EPSPs were evoked in the KCs by applying single-pulse electrical stimulation to the AL, the PNs of which send axons to the MB calyx, where they make direct excitatory connections with KC dendrites (Leitch and Laurent, 1996; Hansson and Anton, 2000). Because more PNs were recruited by increasing the electrical stimulus amplitude (SA), the EPSPs recorded from a KC increased in amplitude, indicating that several PNs converge on individual KCs. Eventually, an action potential was evoked (data not shown). Very often, particularly if the KC was held slightly hyperpolarized by DC current injection, we observed sharp “spikelets” with a SA threshold smaller than that required to evoke a full-blown action potential (Fig. 1A).
To characterize this property across all recorded KCs, we used a metric of postsynaptic potential shape, ΔVdot, that can be thought of as quantifying its “sharpness,” taking into account both rising and falling phases of an EPSP (Fig. 1B). When EPSPs are slow, ΔVdot will be small, regardless of EPSP amplitude. ΔVdot increases as the EPSP rises or decays faster. ΔVdot for a KC recorded with a series of increasing SAs is shown in Figure 1B.As the kinetics of the EPSP begin to change, ΔVdot increases slightly (Fig. 1A, middle traces, 1B, smaller black arrow) until an abrupt nonlinearity occurs (gray arrow). At this SA the cell receives enough PN inputs to generate a spikelet. This nonlinear sub-spike threshold behavior appears consistently across the population of intracellularly recorded KCs (Fig. 1C). The value of SA at which this nonlinearity occurs (expressed as a percentage of the maximum SA before action potential generation) lies within a relatively narrow range (Fig. 1C, inset). Spikelets also could be elicited by holding the KC at more depolarized potentials while applying a constant SA, recruiting a fixed number of PNs (Fig. 1D). This supports the idea that the nonlinear behavior is attributable to the recruitment of voltage-dependent conductances by depolarization.
Single Kc And Network Models
We explored the functional significance of this coincidence detection behavior in a simplified model of a KC with realistic “active” conductances (see Materials and Methods) tuned to replicate the EPSP waveforms recorded in vivo (Fig. 2A). At small stimulus amplitudes the EPSPs were not sufficient to depolarize the membrane potential to potentials in which the Ca2+ current could be activated; only passive responses were exposed. When the EPSP amplitude was increased twofold, ICa activation, followed by IK,A and IK(Ca), sharpened the EPSP (activation of the calcium current increased the speed of depolarization, the potassium currents ensured fast repolarization). The sharp “peak” riding on the otherwise smooth EPSP became more obvious at larger stimulus amplitudes. At a stimulation amplitude just below Na+ action potential threshold, the EPSP contained a sharp spikelet for which the return to baseline was accelerated and for which the half-width was similar to those observed in vivo (Fig. 1) (Perez-Orive et al., 2002). Besides sharpening the EPSP, the interaction between active depolarizing and hyperpolarizing conductances increased the firing threshold and reduced the delay between EPSP onset and spike.
Figure 2.

Effect of modeled intrinsic conductances on KC responsiveness. A, Nonlinear response properties of the KC. The maximum synaptic conductance, gsyn, was increased in integer multiples of the lowest value when only a passive response was found (black line with smallest peak), until a Na+ spike was generated (clipped gray line). For clarity, black and gray lines are alternated as synaptic conductance is increased. Calibration: 100 msec, 10 mV. B, A train of 14 spikes was delivered through the cholinergic synapse to two different versions of a single KC model. To examine the effect of “active” intrinsic conductances on the temporal window of integration of the KC, we took different spike arrival times of the PN inputs from Gaussian distributions with different SDs, σ. For the complete model, which included active conductances (see Materials and Methods), the firing probability falls rapidly as σ increases, whereas in the reduced model, including only INa and IK, the firing probability remains high for much larger values of σ. C, Responses of the complete (left) and reduced (right) KC models to similar inputs as described in B. In the reduced model an input spike train with temporal jitter σ = 25 msec elicits a spike from the KC, whereas in the complete model it does not. Calibration: 50 msec, 25 mV.
If we assume that several EPSPs of similar amplitudes occur independently on the dendrites of a KC, then jitter in the arrival times of the presynaptic spikes may determine critically whether or not the KC will reach threshold. Figure 2, B and C, illustrates the responses of two different KC models: one with active properties as described above (control) and the other without any active conductances other than INa and IK. A train of 14 spikes was delivered to each model, with arrival times taken from a Gaussian distribution with SD σ. The synaptic weights from the PNs to the KCs were adjusted so that the same minimal number of coincident EPSPs (with σ = 0 msec) was necessary to trigger a KC spike (reducing them by 37% in the model without active conductances). Thus both models displayed a Na+ spike when all input spikes were synchronized (σ = 0 msec). As the jitter of spike arrival times increased (Fig. 2B), the model with the complete set of active conductances failed to generate a spike starting at σ ∼12 msec, whereas the reduced model showed reliable spiking up to σ ∼35 msec. For the reduced model the window of integration was determined solely by the membrane time constant and was much larger than in the complete model, which was more sensitive to coincident inputs.
The KC units were used to construct a network model consisting of 20 KCs receiving excitatory input from 210 PNs and feedforward inhibition from 20 LHIs (Fig. 3A). The PN activity of the model (Fig. 3B) (see Materials and Methods) includes dynamic ensembles of synchronized neurons replicating the behavior of PNs recorded in vivo (Laurent et al., 1996; Wehr and Laurent, 1996; Perez-Orive et al., 2002) as well as of PNs in a complete AL model (Bazhenov et al., 2001a,b). Figure 3C shows the responses of the KCs to four different “odors,” each represented by a unique input PN pattern. For each stimulus one to four KCs responded reliably with a Na+ spike on most trials despite small variations in the inputs (in spike number and timing) from one trial to the next. Different KCs spiked at different times (e.g., compare responses of KC6 and KC10 to odor 1), depending on the timing of transient correlations between their respective PN inputs (Stopfer et al., 2003). In the majority of cases the KCs were silent or fired only very few action potentials, which occurred when a few input spikes coincided. In this model the KC responses depended both on their intrinsic properties (active conductances) and on a feedforward inhibitory circuit (Perez-Orive et al., 2002), the effect of which was to reduce the integration window of KCs. When LHI-mediated feedforward inhibition was removed, many KCs responded with one to three spikes for each odor (Fig. 3D), consistent with experimental findings (Perez-Orive et al., 2002). These results indicate that a network of KCs with a simple set of active conductances and realistic circuit connectivity can respond with high specificity to different inputs, decoding the correlation structure contained in the input spike trains.
Odor responses of KCs with disrupted AL dynamics (experiments)
To test the effect of AL dynamics on KC tuning, we performed in vivo experiments in which PCT, a chloride channel blocker, was injected into the AL. Extracellular single unit tetrode recordings of KCs were made before and after PCT treatment. Blocking of fast GABA-mediated inhibition in the AL has been shown to abolish PN oscillatory synchronization without significantly affecting mean PN firing rate or slow response patterning (on a time scale of hundreds of milliseconds) (MacLeod and Laurent, 1996; MacLeod et al., 1998).
We tested KCs with a panel of odors (on average, 12 odors per cell; range for each cell, 5-17; 10 trials with 1 sec odor pulses; 20 sec interstimulus interval; n = 16 KCs) before and immediately after PCT injection into the AL. Figure 4A shows representative examples of two cells and five odors. Although neither cell showed a strong odor response in the control condition, both cells responded consistently to many odors after PCT treatment. Although most KCs responded to zero or one odor in control conditions (as in Perez-Orive et al., 2002), disrupting AL oscillatory dynamics with PCT in the AL increased the probability of odor response of KCs (median probability of response for control, 0.00; PCT, 0.42) (Fig. 4B). Response intensity, however (measured as the number of spikes produced during an odor response), did not increase significantly with PCT treatment (Fig. 4C). Because we observed few odor responses in control condition in the cells recorded both before and after PCT (n = 16 KCs), this comparison includes additional KCs that were recorded in only one of the two conditions (control, n = 53 KCs with responses; PCT, n = 17 KCs with responses).
Given that KCs appear to act as coincidence detectors, this result is counterintuitive, for it suggests that KCs fire more easily if their input is desynchronized. It can be explained, however, by considering the change in the instantaneous firing properties of PNs induced by PCT and the contribution of LHIs to KC firing. The intrinsic and circuit properties of KCs confer on them a preference for coincident input (Figs. 1, 2, 3) (Perez-Orive et al., 2002). Under control conditions this input arises in the form of periodic waves of excitation (from PNs) interspersed with periodic waves of inhibition (from LHIs). The LFP recorded in the MB reflects the overall influence of the PN population onto KCs. LFPs recorded during odor responses exhibit prominent 20-30 Hz oscillations reflecting the oscillatory synchronization of PN ensembles (Fig. 5A) (Laurent and Davidowitz, 1994; Laurent and Naraghi, 1994; MacLeod and Laurent, 1996). Disruption of AL dynamics with PCT abolishes this oscillatory synchronization (MacLeod and Laurent, 1996; Stopfer et al., 1997; MacLeod et al., 1998) and causes an increase, at odor onset, of LFP power in the 3-9 Hz frequency band (Fig. 5 A,B). This increase in low-frequency power at odor onset with block of fast inhibition also was observed in an AL model (Bazhenov et al., 2001b) and reflects an excess of PN activity at odor onset, but not later in the response (MacLeod and Laurent, 1996; Bazhenov et al., 2001b), which is explained by the loss of fast inhibition, but not slow inhibition; slow inhibition contributes to the sculpting of PN responses occurring in the presence of PCT (MacLeod and Laurent, 1996; MacLeod et al., 1998).
We examined whether this small change in PN response profile could explain the change in KC response probability induced by PCT. Our prediction was that the slight shift in PN activity toward the early phases of odor response might cause the excess KC responses seen in PCT conditions. If so, KC responses after PCT treatment would tend to occur at odor onset, whereas those in control conditions would be distributed more widely in time. This is indeed what we observed. The top three traces in Figure 5C show smoothed peristimulus time histograms (PSTHs; two examples and group data) of KC odor responses before (left) and after (right)
PCT treatment. The latencies of all recorded responses in both conditions (control, n = 53 KCs with responses of 122 KCs recorded without treatment; PCT, n = 17 KCs with responses of 22 KCs recorded after PCT treatment; different populations of KCs had to be used here given that, among the population of 16 KCs recorded both before and after PCT treatment, there were too few responses in the control condition for a significant comparison to be made) are shown in the bottom panels of Figure 5C. Although responses in the control condition occurred throughout the stimulus period and even beyond it, all responses under PCT conditions occurred at the time of the low-frequency power increase in the LFP (Fig. 5, compare A, C).
Model of KC responses with desynchronized AL input
We next used our network model to examine the possible contribution of different circuit effects on KC odor responses in PCT. To reproduce the effect of injecting PCT into the AL, we modified odor-evoked PN firing activity in two ways: (1) oscillatory synchronization was eliminated, and (2) the probability of PN firing at odor onset was increased (see Materials and Methods) so that the simulated LFP (obtained by summing all PN activity) displayed the early low-frequency peak observed experimentally (Fig. 5A) and predicted by the full AL model when fast inhibition was blocked (Bazhenov et al., 2001b). The PNs maintained their overall slow temporal patterns (Fig. 6A), as observed experimentally (MacLeod and Laurent, 1996; MacLeod et al., 1998), and the 20 Hz oscillations disappeared from the LFP (Fig. 6B).
Figure 6.
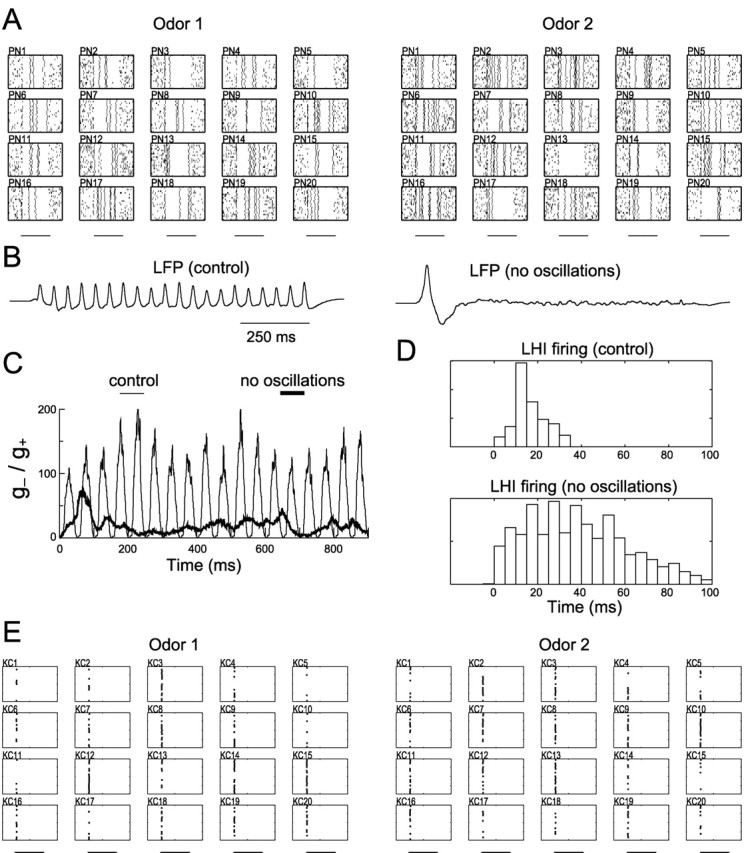
Effects of abolishing PN oscillatory synchronization in the network model. A, Firing patterns of 20 representative PNs simulating PCT treatment of AL (20 trials for each PN). Horizontal bars, 1 sec odor stimulus. Oscillatory synchronization has been abolished, but slow temporal patterns remain. B, LFP presents oscillations in the control condition (left) and a flatter pattern with a low-frequency onset wave after PN oscillatory synchrony is blocked (right). C, Ratio of inhibitory (g-) to excitatory (g+) instantaneous synaptic conductances (gsyn[O]; see Materials and Methods) of an average KC under control conditions (thin) and abolished oscillatory synchronization (thick). The 1 sec odor stimulus starts at time = 0 msec. D, PSTHs of all LHIs in the intact model (top; 0 msec, LFP maxima) and after PN oscillatory synchronization is abolished (bottom; 0 msec, odor onset). When synchronization is disrupted, LHI activity is distributed more broadly in time. E, KCs exhibit a loss of odor specificity when AL oscillatory synchronization is abolished (20 trials for each KC). Horizontal bars, 1 sec odor stimulus.
One effect of disrupting AL oscillatory dynamics is that the LHIs, which are driven by PNs, also lose their oscillatory synchronization. Figure 6C shows the instantaneous ratio of inhibitory (LHI-mediated) to excitatory (PN-mediated) synaptic conductance on an average KC as a function of time during an odor stimulation. Given the observed phase lag between feedforward inhibition and PN excitation in control conditions (Perez-Orive et al., 2002), this ratio directly reflected the 20 Hz periodicity of the excitatory PN drive. Most LHIs fired at a similar phase of the oscillation cycle, providing strong inhibitory input to their postsynaptic KCs (Fig. 6D) in antiphase with PN excitation. After oscillatory synchronization in the AL was blocked, LHI firing times were distributed broadly (Fig. 6D) and the instantaneous contribution to KCs of inhibition relative to excitation was reduced (Fig. 6C, thick line). Because LHI inhibition normally limits the temporal window over which a KC can integrate its PN inputs (Perez-Orive et al., 2002), this relative reduction of feedforward inhibition will lengthen this integration window across oscillation cycles, reducing the preference of KCs for coincident input. Indeed, under these conditions the model KCs lost much of their odor specificity (Fig. 6E). Furthermore, these responses occurred at odor onset (Fig. 6E), as observed experimentally (Fig. 5C). If, however, PNs were desynchronized without a slight increase in PN firing probability at odor onset (see Materials and Methods), the KCs remained silent (data not shown). This suggests that the active properties of KCs alone could limit the duration of the integration window and that an increase in random correlated PN spikes is required. When KC active conductances also were blocked under these conditions (and EPSP size properly adjusted as described above), no other mechanisms remained in the model to select for coincident input, and odor specificity was reduced further (data not shown).
Coincidence detection versus temporal integration (modeling)
Theoretically, the high specificity of KCs to odors (Perez-Orive et al., 2002) might result not from their ability to detect coincident input but from appropriately tuned integrative properties. We wanted to test whether there is an intrinsic advantage to using coincidence detection instead of classical integration over longer time windows to generate sparse response patterns. Past behavioral work indicated that disrupting oscillatory synchronization of PNs impairs the discrimination of molecularly similar odors (Stopfer et al., 1997). A set of similar input vectors (simulated odors), which differed only in the fast temporal structure of evoked PN activity (see Materials and Methods), was tested on two versions of our network model: a complete “coincidence detector” model, as in Figure 3A, and an “integrator” model in which the active conductances of the KCs (other than those for Na+ spike generation) and feedforward inhibition were removed. The synaptic weights from the PNs to the KCs were adjusted so that the same minimal number of EPSPs was necessary to trigger a KC spike in both models. The coincidence detector model responded to these odors in a highly specific way, with distinct KCs responding to different odors (Fig. 7A, top). Conversely, in the integrator model the same set of KCs responded to all similar odors, losing their ability to discriminate among them (Fig. 7A, bottom).
Figure 7.
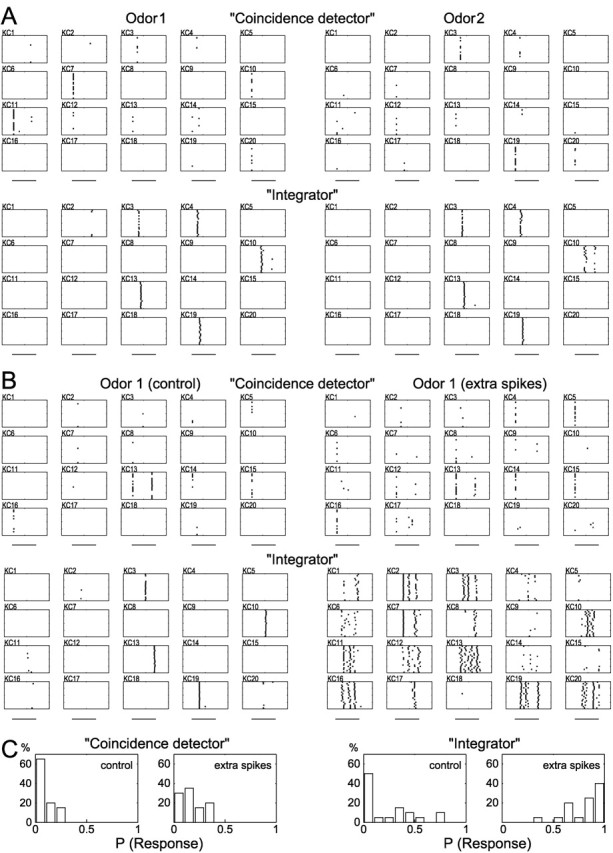
Effects of coincidence detection versus temporal integration in the network model. A, Sets of “similar” inputs (differing only in the fine temporal structure of PN firing) were presented to the models. The control network (coincidence detector, top) responded with specific response patterns for each of these odors (2 representative examples are shown). The model network with neither active conductances nor feedforward inhibition (integrator, bottom) responded with the same pattern of active KCs for each of these odors (same 2 odors as at top are shown). B, Effect of additional PN “noise” spikes on KC responses. Left, Control input; right, 25% extra spikes were added randomly to the input spike trains. Coincidence detection model (top) responded with minor changes in firing patterns after the extra spikes were added. In contrast, the response of the integrator model (bottom) changed dramatically, and odor specificity was lost. C, Frequency distribution of KC response probabilities in both models after the extra spikes were added. The coincidence detector model shows only a slight increase in response probabilities, whereas the integrator model exhibits a drastic reduction in response specificity.
In another set of tests we used very dissimilar input vectors, differing by the identities of the PNs that fired at different epochs of the odor responses. That is, not only the fast temporal structure (as in Fig. 7A) but also the slower temporal structure varied among odors. In our model this corresponds to molecularly diverse odors belonging to distinct chemical groups. In this case we observed that different KCs responded to different odors in both the coincidence detector and the integrator models (data not shown). The fact that “integrator” KCs retain their specificity for these odors is a reflection of their long time windows of integration, which are able to distinguish between input vectors that differed in these longer time scales. Conversely, when the differences between the input vectors consist only in changes in their fast temporal structure (i.e., whether they synchronize with each other at certain oscillation cycles or not), only the coincidence detector models (with short temporal windows of integration) will be able to discriminate between them.
To explore the sensitivity to noise of these two types of models, we used two modeled stimuli: a pure one and a “noisy” one, in which 25% extra PN action potentials were added randomly. The model responses for the “pure” and “noisy” odors were compared. The coincidence detector model responded with minor differences to the control and noisy inputs, whereas the integrator model was affected drastically by the extra spikes, losing most of its odor specificity (Fig. 7B). Figure 7C shows the distribution of the probabilities of odor responses for KCs from the two models. After extra spikes were added to the input, KCs from the coincidence detector model retained their odor specificity, whereas those from the integrator model responded to most odors that were tested. In the coincidence detector model an additional PN spike potentially can impact the KC response only if it is placed within a small time window, which is a rare event if the extra spikes come from uncorrelated noise. Conversely, in the integrator model additional spikes occurring in much larger time windows can contribute to the KC responses. These modeling results suggest that the preference of KCs for coincident input confers on them the ability to discriminate among similar odors as well as an increased robustness to input noise.
KC tuning specificity and phase-locking (experiments)
Some of the mechanisms conferring coincidence detection properties to KCs (oscillatory drive, subthreshold active properties, phase-delayed feedforward inhibition) also contribute to the phase-locking of their action potentials to the cycles of LFP oscillations (Perez-Orive et al., 2002). However, the precision of phase-locking varies among KCs, as does their degree of odor specificity. We analyzed the relationship between odor responsiveness and phase-locking in individual KCs and found that the more odor-specific KCs display tighter phase-locking than the more promiscuous KCs. Figure 8 illustrates the degree of phase-locking for the 10 most specific KCs (having P(Response)<0.06, which is typical for KCs), compared with 10 promiscuous KCs (having 0.35<P(Response)<0.48, which was less common). These KCs were the 10 most promiscuous KCs with the exception of a few KCs with P(Response)≥0.7; these had similarly poor phase-locking but might be considered outliers because they were exceptional. Although the average phase of KC spikes was the same in both groups, the degree of phase-locking, as reflected by the polar histograms and vector magnitudes, was stronger in the specific than in the promiscuous KCs (Fig. 8). Throughout the population of recorded responses in KCs, we found a significant negative correlation between the probability of odor response and the phase vector magnitude of individual KCs (r = -0.43; p < 0.005; n = 42 KCs with responses and simultaneously recorded LFPs; two-sided correlation t test).
Discussion
Active dendritic conductances have been shown, in culture and slices, to contribute to coincidence detection by nonlinear summation of synchronized input in hippocampal and neocortical pyramidal cells (Margulis and Tang, 1998; Williams and Stuart, 2002; Ariav et al., 2003). Our in vivo experiments show that KCs in the locust exhibit highly nonlinear subthreshold properties. In particular, they indicate that coincident EPSPs can summate supralinearly, favoring coincidence detection. Many of these observed subthreshold nonlinearities are likely attributable to the active conductances observed in KCs in culture (Schafer et al., 1994; Grunewald, 2003). These nonlinearities can amplify coincident EPSPs (as in the case of spikelets). Other nonlinear properties appear to be caused by feedforward inhibition (e.g., Fig. 1A, middle traces, 1B, smaller black arrow), as suggested by whole-cell patch-clamp recordings in which inhibition to KCs was blocked (Perez-Orive et al., 2002). In this sense both intrinsic and inhibitory mechanisms appear to act together at the subthreshold level to confer KCs with a preference for coincident input.
The active conductances that have been observed in cultured KCs (Schafer et al., 1994; Grunewald, 2003) were included in a Hodgkin-Huxley type KC model (see Materials and Methods). This simple model of a KC with realistic active conductances can produce EPSP waveforms similar to those observed in vivo and demonstrates the important effect that these active properties have on the temporal window in which a neuron integrates its input. In particular, the active repolarizing currents decrease the width of postsynaptic potentials, narrowing the temporal window in which the active depolarizing currents can summate inputs supralinearly (Johnston et al., 1996; Fricker and Miles, 2000; Galarreta and Hestrin, 2001). In agreement with these results, theoretical studies have found that the temporal duration of EPSPs is a critical factor determining whether neurons selectively detect coincident input (Abeles, 1982; Gerstner et al., 1996; Kempter et al., 1998). When realistic PN activity is injected into a network model that includes these active KC conductances and feedforward inhibition, KCs are silent most of the time, and their responses are highly specific and brief, indicating that these mechanisms are sufficient to explain the sparsening of the odor representation observed in vivo (Perez-Orive et al., 2002).
Disruption of PN oscillatory synchronization has been shown to decrease odor discriminability behaviorally (Stopfer et al., 1997) and physiologically at the output neurons of the MB (β-lobe neurons, directly downstream of KCs) but, interestingly, not at the level of PNs themselves (MacLeod et al., 1998). The present results shed light on the location and possible mechanisms involved in this loss of discriminability. Our in vivo recordings indicate that the loss of specificity exists first at the level of KCs. A loss of information under these conditions therefore must occur in the decoding of PN output by KCs. The increase in LFP low-frequency power at odor onset, together with the fact that all KC responses occur at this time, suggests that an increase in instantaneous PN firing at odor onset contributes to the loss of specificity. A complete AL model in which fast inhibition is blocked without disrupting slow inhibition predicted similar changes in the LFP as those observed here in vivo (Bazhenov et al., 2001b). In the AL model these LFP changes reflect a small increase in PN activity exclusively at odor onset before slow inhibition has been activated (Bazhenov et al., 2001b).
Our network model supports the idea that a slight increase in PN activity that is time-locked to odor onset is important for generating the observed KC loss of specificity. Furthermore, the model predicts that a disruption of LHI feedforward inhibition contributes as well to the observed increase in KC responsiveness; this inhibition is driven by PN activity, and when PN oscillatory synchronization disappears, the net inhibitory drive on KCs is reduced (Fig. 6C), disrupting the periodic resetting of KC postsynaptic potentials. Under control conditions KCs respond selectively to coincident PN input that is synchronized within an oscillation cycle (Perez-Orive et al., 2002). When oscillatory synchronization is abolished by blocking fast inhibition in the AL, this coincident input can arise from spurious correlations caused by a small (and non-odor-specific) increase in PN activity that is time-locked to odor onset. Furthermore, if the net effect of feedforward inhibition is weakened, as suggested by the model, the selectivity for coincident input is reduced, allowing KCs to integrate over larger temporal windows. Experimental findings in the hippocampus (Pouille and Scanziani, 2001) and auditory systems (Grothe and Sanes, 1994; Brand et al., 2002; Wehr and Zador, 2003) support the idea that feedforward inhibition can be critical for allowing a neuron to detect temporal differences in its inputs.
We found a significant correlation between the degree of phase-locking of individual KCs and their odor specificity: the more odor specific a KC is, the tighter its phase-locking tends to be. Given that in this system phase-locking and coincidence detection share common mechanisms (PN oscillatory drive, KC active properties, feedforward inhibition) (Perez-Orive et al., 2002) and therefore are likely to be correlated, our current results suggest a possible link between the sensitivity of individual KCs to coincidence detection and their odor specificity.
The sparsening of the olfactory representation in the MB arises as a result of the selectivity of KCs for input that is coincident within an oscillation cycle (Perez-Orive et al., 2002). Given that theoretically the sparsening could have resulted from different mechanisms relying on integration of inputs over longer time windows, it is important to consider the possible computational advantages that can arise from coincidence detection over classical integration strategies (Sherrington, 1906; Adrian, 1926; Eccles, 1957; Shadlen and Newsome, 1998). Two difficult problems an olfactory system must solve are the discrimination between similar odors and robustness of odor classification in a highly noisy environment (Cain and Potts, 1996; Laurent, 2002); other sensory modalities need to solve analogous problems (Dusenbery, 1992), and, to the extent that they face comparable constraints, it is possible that they use similar strategies. Our modeling results indicate that a coincidence detector strategy presents important advantages in both of these problems over a classical integrator model. By being sensitive to the timing of incoming action potentials on a fine time scale, a coincidence detector allows for an extra coding dimension with which to solve these complex problems (Laurent, 1999). Our modeling results show that this extra dimension can allow an olfactory system to discriminate between similar odors, which differ only in the fine temporal structure of the AL input, in a manner beyond the capabilities of a decoding system integrating over longer time scales. Moreover, our current experimental results indicate that oscillatory synchronization is required for the sparsening of the olfactory representation that occurs in the MB. Abolishing these oscillations has been shown to affect behavioral odor discriminability (Stopfer et al., 1997), supporting the idea that a decrease in sparseness implies a reduced capacity of the system to represent distinct odors (Marr, 1969; Kanerva, 1988; Laurent, 2002). In addition to this, by focusing on specific time windows within an oscillation cycle, the coincidence detector model is less sensitive to uncorrelated noise in its input, in agreement with theoretical studies in other systems (Konig et al., 1996; Salinas and Sejnowski, 2000). In the locust these coincidence detection mechanisms provide a powerful strategy with which to solve complex problems every olfactory system encounters.
Footnotes
This work was supported by Sloan and Swartz Foundation fellowships (J.P.-O.) and grants from the National Institute on Deafness and Other Communication Disorders (M.B. and G.L.) and the National Science Foundation (G.L.). We thank the Laurent Laboratory and Terry Sejnowski for helpful discussions and Athanasios Siapas for help with wire tetrodes.
Correspondence should be addressed to Gilles Laurent, Computation and Neural Systems, Mail Code 139-74, California Institute of Technology, Pasadena, CA 91125. E-mail: laurentg@caltech.edu.
Copyright © 2004 Society for Neuroscience 0270-6474/04/246037-11$15.00/0
References
- Abeles M (1982) Role of the cortical neuron: integrator or coincidence detector? Isr J Med Sci 18: 83-92. [PubMed] [Google Scholar]
- Adrian E (1926) The impulses produced by sensory nerve endings. J Physiol (Lond) 61: 49-72. [DOI] [PMC free article] [PubMed] [Google Scholar]
- Ariav G, Polsky A, Schiller J (2003) Submillisecond precision of the input-output transformation function mediated by fast sodium dendritic spikes in basal dendrites of CA1 pyramidal neurons. J Neurosci 23: 7750-7758. [DOI] [PMC free article] [PubMed] [Google Scholar]
- Bazhenov M, Stopfer M, Rabinovich M, Huerta R, Abarbanel HD, Sejnowski TJ, Laurent G (2001a) Model of transient oscillatory synchronization in the locust antennal lobe. Neuron 30: 553-567. [DOI] [PMC free article] [PubMed] [Google Scholar]
- Bazhenov M, Stopfer M, Rabinovich M, Abarbanel HD, Sejnowski TJ, Laurent G (2001b) Model of cellular and network mechanisms for odor-evoked temporal patterning in the locust antennal lobe. Neuron 30: 569-581. [DOI] [PMC free article] [PubMed] [Google Scholar]
- Brand A, Behrend O, Marquardt T, McAlpine D, Grothe B (2002) Precise inhibition is essential for microsecond interaural time difference coding. Nature 417: 543-547. [DOI] [PubMed] [Google Scholar]
- Britten KH, Shadlen MN, Newsome WT, Movshon JA (1992) The analysis of visual motion: a comparison of neuronal and psychophysical performance. J Neurosci 12: 4745-4765. [DOI] [PMC free article] [PubMed] [Google Scholar]
- Cain WS, Potts BC (1996) Switch and bait: probing the discriminative basis of odor identification via recognition memory. Chem Senses 21: 35-44. [DOI] [PubMed] [Google Scholar]
- Carr CE, Konishi M (1990) A circuit for detection of interaural time differences in the brainstem of the barn owl. J Neurosci 10: 3227-3246. [DOI] [PMC free article] [PubMed] [Google Scholar]
- Destexhe A, Mainen ZF, Sejnowski TJ (1994) Synthesis of models for excitable membranes, synaptic transmission, and neuromodulation using a common kinetic formalism. J Comput Neurosci 1: 195-230. [DOI] [PubMed] [Google Scholar]
- Dusenbery DB (1992) Sensory ecology. New York: Freeman.
- Eccles JC (1957) The physiology of nerve cells. Baltimore: Johns Hopkins.
- Engel AK, Fries P, Singer W (2001) Dynamic predictions: oscillations and synchrony in top-down processing. Nat Rev Neurosci 2: 704-716. [DOI] [PubMed] [Google Scholar]
- Fricker D, Miles R (2000) EPSP amplification and the precision of spike timing in hippocampal neurons. Neuron 28: 559-569. [DOI] [PubMed] [Google Scholar]
- Galarreta M, Hestrin S (2001) Spike transmission and synchrony detection in networks of GABAergic interneurons. Science 292: 2295-2299. [DOI] [PubMed] [Google Scholar]
- Gerstner W, Kempter R, van Hemmen JL, Wagner H (1996) A neuronal learning rule for sub-millisecond temporal coding. Nature 383: 76-81. [DOI] [PubMed] [Google Scholar]
- Grothe B, Sanes DH (1994) Synaptic inhibition influences the temporal coding properties of medial superior olivary neurons: an in vitro study. J Neurosci 14: 1701-1709. [DOI] [PMC free article] [PubMed] [Google Scholar]
- Grunewald B (2003) Differential expression of voltage-sensitive K+ and Ca2+ currents in neurons of the honeybee olfactory pathway. J Exp Biol 206: 117-129. [DOI] [PubMed] [Google Scholar]
- Hansson BS, Anton S (2000) Function and morphology of the antennal lobe: new developments. Annu Rev Entomol 45: 203-231. [DOI] [PubMed] [Google Scholar]
- Heisenberg M (2003) Mushroom body memoir: from maps to models. Nat Rev Neurosci 4: 266-275. [DOI] [PubMed] [Google Scholar]
- Heisenberg M, Borst A, Wagner S, Byers D (1985) Drosophila mushroom body mutants are deficient in olfactory learning. J Neurogenet 2: 1-30. [DOI] [PubMed] [Google Scholar]
- Hubel DH, Wiesel TN (1962) Receptive fields, binocular interaction, and functional architecture in the cat's visual cortex. J Physiol (Lond) 160: 106-154. [DOI] [PMC free article] [PubMed] [Google Scholar]
- Johnston D, Magee JC, Colbert CM, Christie BR (1996) Active properties of neuronal dendrites. Annu Rev Neurosci 19: 165-186. [DOI] [PubMed] [Google Scholar]
- Kanerva P (1988) Sparse distributed memory. Cambridge, MA: MIT.
- Kempter R, Gerstner W, van Hemmen JL, Wagner H (1998) Extracting oscillations. Neuronal coincidence detection with noisy periodic spike input. Neural Comput 10: 1987-2017. [DOI] [PubMed] [Google Scholar]
- Konig P, Engel AK, Singer W (1996) Integrator or coincidence detector? The role of the cortical neuron revisited. Trends Neurosci 19: 130-137. [DOI] [PubMed] [Google Scholar]
- Larkum ME, Zhu JJ, Sakmann B (1999) A new cellular mechanism for coupling inputs arriving at different cortical layers. Nature 398: 338-341. [DOI] [PubMed] [Google Scholar]
- Laurent G (1999) A systems perspective on early olfactory coding. Science 286: 723-728. [DOI] [PubMed] [Google Scholar]
- Laurent G (2002) Olfactory network dynamics and the coding of multidimensional signals. Nat Rev Neurosci 3: 884-895. [DOI] [PubMed] [Google Scholar]
- Laurent G, Davidowitz H (1994) Encoding of olfactory information with oscillating neural assemblies. Science 265: 1872-1875. [DOI] [PubMed] [Google Scholar]
- Laurent G, Naraghi M (1994) Odorant-induced oscillations in the mushroom bodies of the locust. J Neurosci 14: 2993-3004. [DOI] [PMC free article] [PubMed] [Google Scholar]
- Laurent G, Seymour-Laurent KJ, Johnson K (1993) Dendritic excitability and a voltage-gated calcium current in locust nonspiking local interneurons. J Neurophysiol 69: 1484-1498. [DOI] [PubMed] [Google Scholar]
- Laurent G, Wehr M, Davidowitz H (1996) Temporal representations of odors in an olfactory network. J Neurosci 16: 3837-3847. [DOI] [PMC free article] [PubMed] [Google Scholar]
- Leitch B, Laurent G (1996) GABAergic synapses in the antennal lobe and mushroom body of the locust olfactory system. J Comp Neurol 372: 487-514. [DOI] [PubMed] [Google Scholar]
- Lucke J, von der Malsburg C (2004) Rapid processing and unsupervised learning in a model of the cortical macrocolumn. Neural Comput 16: 501-533. [DOI] [PubMed] [Google Scholar]
- MacLeod K, Laurent G (1996) Distinct mechanisms for synchronization and temporal patterning of odor-encoding neural assemblies. Science 274: 976-979. [DOI] [PubMed] [Google Scholar]
- MacLeod K, Backer A, Laurent G (1998) Who reads temporal information contained across synchronized and oscillatory spike trains? Nature 395: 693-698. [DOI] [PubMed] [Google Scholar]
- Margulis M, Tang CM (1998) Temporal integration can readily switch between sublinear and supralinear summation. J Neurophysiol 79: 2809-2813. [DOI] [PubMed] [Google Scholar]
- Marr D (1969) A theory of cerebellar cortex. J Physiol (Lond) 202: 437-470. [DOI] [PMC free article] [PubMed] [Google Scholar]
- McGuire SE, Le PT, Davis RL (2001) The role of Drosophila mushroom body signaling in olfactory memory. Science 293: 1330-1333. [DOI] [PubMed] [Google Scholar]
- Perez-Orive J, Mazor O, Turner GC, Cassenaer S, Wilson RI, Laurent G (2002) Oscillations and sparsening of odor representations in the mushroom body. Science 297: 359-365. [DOI] [PubMed] [Google Scholar]
- Pouille F, Scanziani M (2001) Enforcement of temporal fidelity in pyramidal cells by somatic feed-forward inhibition. Science 293: 1159-1163. [DOI] [PubMed] [Google Scholar]
- Pouzat C, Mazor O, Laurent G (2002) Using noise signature to optimize spike-sorting and to assess neuronal classification quality. J Neurosci Methods 122: 43-57. [DOI] [PubMed] [Google Scholar]
- Salinas E, Sejnowski TJ (2000) Impact of correlated synaptic input on output firing rate and variability in simple neuronal models. J Neurosci 20: 6193-6209. [DOI] [PMC free article] [PubMed] [Google Scholar]
- Schafer S, Rosenboom H, Menzel R (1994) Ionic currents of Kenyon cells from the mushroom body of the honeybee. J Neurosci 14: 4600-4612. [DOI] [PMC free article] [PubMed] [Google Scholar]
- Schiller J, Schiller Y (2001) NMDA receptor-mediated dendritic spikes and coincident signal amplification. Curr Opin Neurobiol 11: 343-348. [DOI] [PubMed] [Google Scholar]
- Schwaerzel M, Heisenberg M, Zars T (2002) Extinction antagonizes olfactory memory at the subcellular level. Neuron 35: 951-960. [DOI] [PubMed] [Google Scholar]
- Shadlen MN, Newsome WT (1998) The variable discharge of cortical neurons: implications for connectivity, computation, and information coding. J Neurosci 18: 3870-3896. [DOI] [PMC free article] [PubMed] [Google Scholar]
- Sherrington CS (1906) Integrative action of the nervous system. New Haven, CT: Yale UP.
- Singer W, Gray CM (1995) Visual feature integration and the temporal correlation hypothesis. Annu Rev Neurosci 18: 555-586. [DOI] [PubMed] [Google Scholar]
- Sloper JJ, Powell TP (1979) Ultrastructural features of the sensori-motor cortex of the primate. Philos Trans R Soc Lond B Biol Sci 285: 124-139. [PubMed] [Google Scholar]
- Softky WR, Koch C (1993) The highly irregular firing of cortical cells is inconsistent with temporal integration of random EPSPs. J Neurosci 13: 334-350. [DOI] [PMC free article] [PubMed] [Google Scholar]
- Stopfer M, Bhagavan S, Smith BH, Laurent G (1997) Impaired odour discrimination on desynchronization of odour-encoding neural assemblies. Nature 390: 70-74. [DOI] [PubMed] [Google Scholar]
- Stopfer M, Jayaraman V, Laurent G (2003) Intensity versus identity coding in an olfactory system. Neuron 39: 991-1004. [DOI] [PubMed] [Google Scholar]
- Traub RD (1982) Simulation of intrinsic bursting in CA3 hippocampal neurons. Neuroscience 7: 1233-1242. [DOI] [PubMed] [Google Scholar]
- Wehr M, Laurent G (1996) Odour encoding by temporal sequences of firing in oscillating neural assemblies. Nature 384: 162-166. [DOI] [PubMed] [Google Scholar]
- Wehr M, Zador AM (2003) Balanced inhibition underlies tuning and sharpens spike timing in auditory cortex. Nature 426: 442-446. [DOI] [PubMed] [Google Scholar]
- Williams SR, Stuart GJ (2002) Dependence of EPSP efficacy on synapse location in neocortical pyramidal neurons. Science 295: 1907-1910. [DOI] [PubMed] [Google Scholar]