

Abstract
Patients with Parkinson's disease (PD) exhibit impairments in several cognitive functions similar to those observed in patients with prefrontal cortex (PFC) lesions. The physiological origins of these cognitive deficits are not well documented. Two mechanisms have been proposed: disruptions in corticostriatal circuits or a deficiency in frontal dopamine. We previously used functional magnetic resonance imaging (fMRI) in young healthy subjects to separate patterns of PFC and striatum activity during distinct phases of performance of the Wisconsin Card Sorting Task, a set-shifting task that reveals deficits in patients with PD. Here, the same fMRI protocol was used in PD patients and matched controls. Decreased activation was observed in the PD group compared with the matched control group in the ventrolateral PFC when receiving negative feedback and the posterior PFC when matching after negative feedback. In controls, these prefrontal regions specifically coactivated with the striatum during those stages of task performance. In contrast, greater activation was found in the PD group compared with the matched control group in prefrontal regions, such as the posterior and the dorsolateral PFC when receiving positive or negative feedback, that were not coactivated with the striatum in controls. These results suggest that both nigrostriatal dopamine depletion and intracortical dopamine deficiency may play a role in cognitive deficits in PD, depending on the involvement of the striatum in the task at hand.
Keywords: set-shifting, Parkinson's disease, prefrontal cortex, striatum, fMRI, Wisconsin card sorting
Introduction
Parkinson's disease (PD) is characterized by a loss of dopamine projections to the striatum (Kish et al., 1988). Patients with PD show impairments across a range of cognitive functions resembling those observed in patients with prefrontal cortex (PFC) lesions (Taylor et al., 1986; Owen et al., 1992; Dubois et al., 1994). It has been proposed (Owen et al., 1998; Dagher et al., 2001; Cools et al., 2002) that these cognitive deficits may be caused by a disruption of basal ganglia outflow resulting in frontal dysfunction in the different loops connecting the PFC, basal ganglia, and thalamus (Alexander et al., 1986).
One well-documented deficit both in patients with PD and PFC lesions is in set-shifting, that is the ability to alter a behavioral response mode in the face of changing contingencies (Gotham et al., 1988; Cools et al., 2001). The Wisconsin Card Sorting Task (WCST) is the most commonly used test of set-shifting in humans (Milner, 1963; Nelson, 1976). In this task, the subject is asked to match test cards to reference cards according to one of three classification rules to be acquired using feedback provided after each matching response. After a fixed number of correct matches, the rule is changed without notice and the subject must shift to a new mode of classification (set-shifting). The exact anatomical origins of the deficits observed in PD during WCST performance remain unclear. Previous studies using positron emission tomography (PET) had shown increased activity in various cortical areas in PD patients compared with matched control subjects during motor and cognitive tasks (Samuel et al., 1997; Owen et al., 1998; Dagher et al., 2001; Cools et al., 2002), and it has been suggested that this increased activity may reflect compensation in PD. However, depending on the task being studied, both decreases and increases (Samuel et al., 1997; Owen et al., 1998; Sabatini et al., 2000) of PFC activity have been reported in unmedicated PD patients compared with controls. A neural network model of the WCST involving the PFC and basal ganglia predicted that reduced activation within a particular PFC region occurs in PD only if the striatal area with which it is connected is of special importance for the task at hand (Monchi et al., 2000).
In the WCST, two types of trials occur: those after negative feedback, requiring a set-shift, and those after positive feedback, requiring the maintenance of the current rule of classification. Two distinct temporal periods can be distinguished within each trial: receiving feedback, when the subject has to use the information provided to choose whether to maintain or change the rule of classification, and matching after feedback, when the subject executes the response based on the chosen rule. Thus, four different stages of the task can be defined: receiving negative feedback, matching after negative feedback, receiving positive feedback, and matching after positive feedback. We have previously used event-related functional magnetic resonance imaging (fMRI) in young healthy subjects to study patterns of brain activation during the four stages of the WCST defined above. Here, the same fMRI design was used to test early-stage PD patients and matched controls to study the consequences of striatal dopamine depletion on the patterns of activation during performance of this task. There were two predictions regarding frontal activation in PD. First, areas that coactivated with the striatum during task performance in our previous study (Monchi et al., 2001) would show reduced activity in PD patients compared with matched controls. Second, areas that were activated independently of the striatum would show similar or increased activation in PD.
Materials and Methods
Subjects. Eight right-handed patients at Hoehn and Yahr stages 1 and 2 of PD (mean age, 56.6 years; range, 43-65; six males and two females) participated in this study. All patients met the core assessment program for surgical interventional therapy criteria for the diagnosis of idiopathic PD (Langston et al., 1992; Defer et al., 1999), namely two of the three cardinal signs of PD (bradykinesia, tremor, rigidity), response to l-dopa or dopamine agonists, and lack of evidence of other medical conditions associated with parkinsonism. All PD patients were asked to stop taking any medication prescribed for their condition (dopamine agonist or l-dopa) at least 12 hr before the scanning session. Their mean score on the motor subset of the Unified Parkinson's Disease Rating Scale before scanning (off medication) was 12.3 of a maximum of 56. Patients were screened for dementia and depression using the Mini-Mental State Examination (MMSE) and the Beck Depression Inventory (BDI), respectively.
Nine right-handed control subjects (mean age, 54 years; range, 47-68; seven males and two females) with no history of neurological or psychiatric disorder also participated in this study. The control subjects were also screened for dementia and depression using MMSE and BDI. For both the patients and the matched control subjects, the exclusion criteria were a score ≤25 on the MMSE and a score ≥9 on the BDI. All participants gave informed consent after reading the protocol, which was reviewed and approved by the Research Ethics Committee of the Montréal Neurological Institute.
Cognitive task. A computerized version of the WCST (Monchi et al., 2001) was administered using stimulus presentation software (Media Control Function, Digivox, Montréal). Throughout the task, four fixed reference cards were present in a row on the top part of the screen, displaying one red triangle, two green stars, three yellow crosses, and four blue circles, respectively. On each test trial, a new test card was presented in the middle of the screen below the reference cards (Figs. 1A, 2A). Subjects were then required to match the test card to one of the reference cards based on the color, the shape, or the number of the stimuli shared between the test and reference cards. Two mouse buttons were used by the subjects to indicate their response. The left button was used to move a cursor to point to one of the reference cards, and the right button was used to confirm the selection. In addition to the test trials, there were control trials, during which the test card was identical to one of the four reference cards. On each of the control trials, subjects were asked to match the test card to the identical reference card. During the scanning session, the subjects performed four types of trials: WCST trials that required matching according to color, shape, or number, and control trials.
Figure 1.
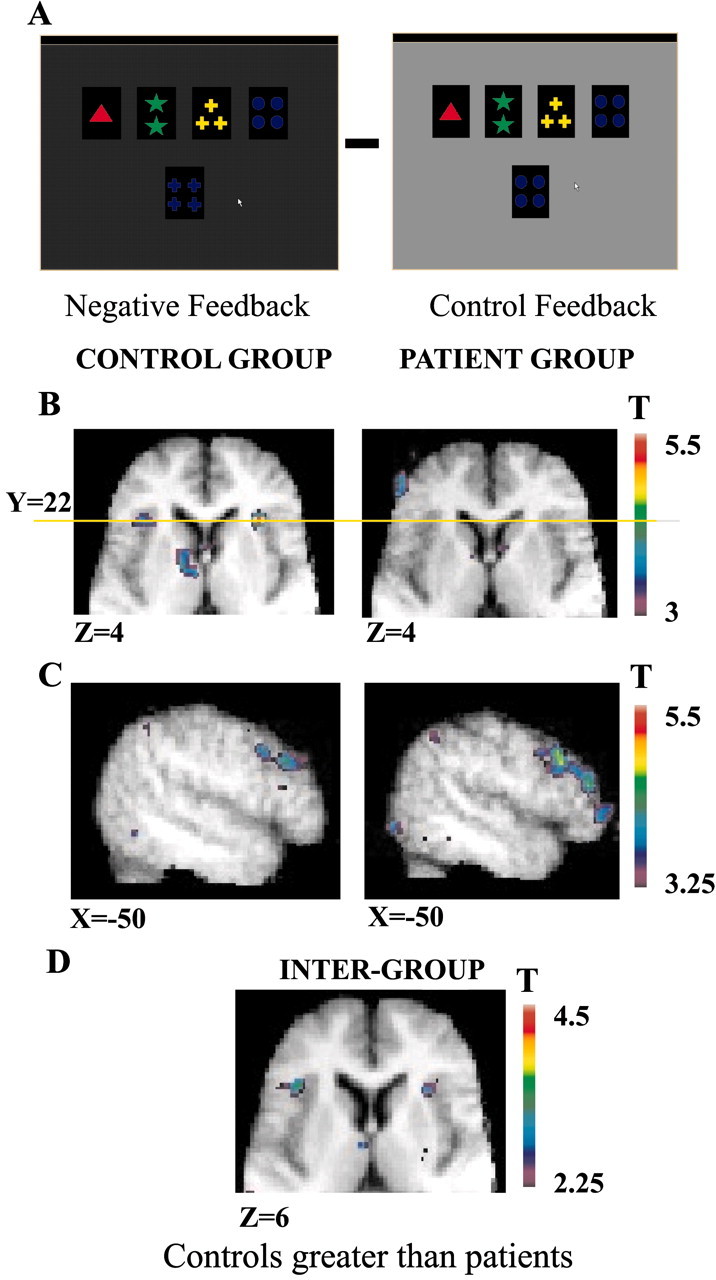
Patterns of activation in the ventrolateral, the posterior, and the dorsolateral PFC when receiving negative feedback compared with control feedback. A, Appearance of the computer monitor during negative feedback and during control feedback. B, Horizontal sections (Z = 4) in the matched control group and the PD patient group show the mid-ventrolateral activity at Y = 22 (yellow line) and the caudate nucleus in the control group and the absence of such activity in the PD patient group. C, Sagittal sections (X = -50) in the matched control group and the PD patient group show the greater and spatially extended activity in the dorsolateral and the posterior PFC in the PD patient group compared with the matched control group. D, Horizontal section (Z = 6) showing greater activation in the mid-ventrolateral PFC in the matched control group compared with the PD patient group.
Figure 2.
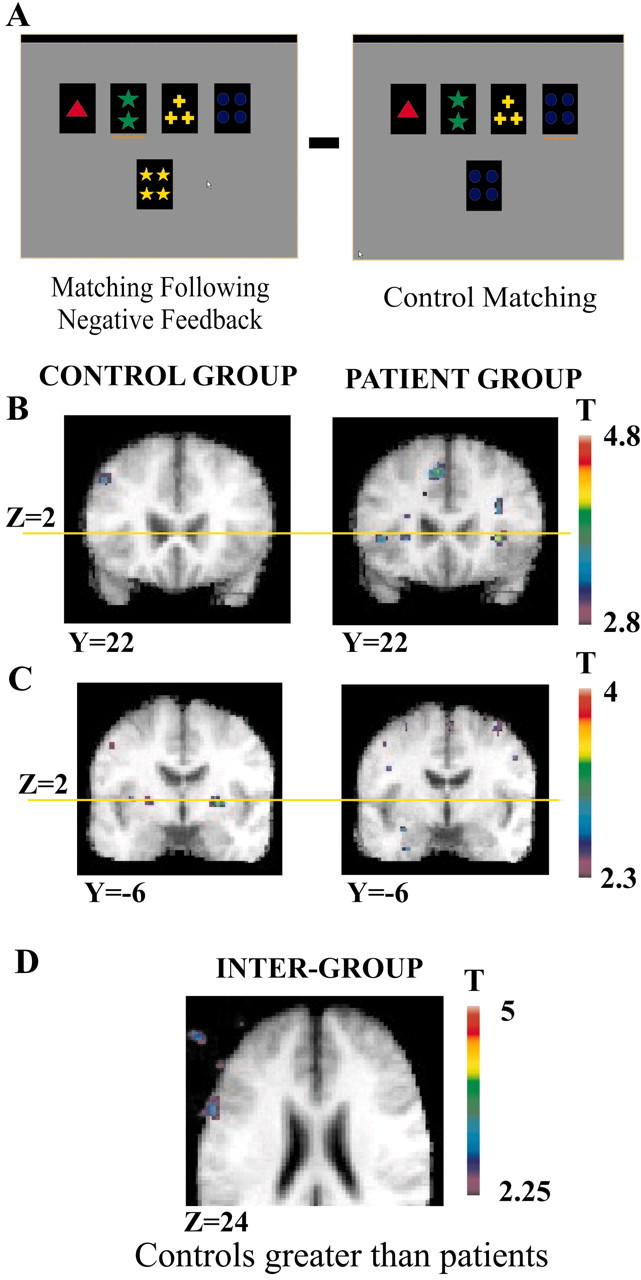
Patterns of activation in the putamen, ventrolateral, and posterior PFC when matching after negative feedback is compared with control matching. A, Appearance of the computer monitor during matching after negative feedback and during control matching. B, Coronal sections (Y = 22) in the matched control group and the PD patient group show the location of the mid-ventrolateral PFC activity (Z = 2; yellow line) in the PD patient group and the absence of such activity in the matched control group. C, Coronal sections (Y = -6) in the matched control group and the PD patient group to show the location of the putamen activity (Z = 2, yellow line) in the matched control group and the absence of such activity in the PD patient group. D, Horizontal section (Z = 6) showing significantly greater activation in the posterior PFC (intersection of areas 6, 8, and 44) in the matched control group compared with the PD group.
To study the pattern of activation during the different stages of performance of the WCST, four experimental time periods and two control time periods were defined: (1) Receiving negative feedback (Fig. 1A). This period starts immediately after a wrong selection is made and finishes when a new test card is presented. During this period, the screen becomes dark, indicating that a set-shift is required. (2) Matching after negative feedback (Fig. 2A). This period starts from the moment a new test card is presented after negative feedback and ends when the subject completes her/his selection. (3) Receiving positive feedback. This period starts immediately after a correct selection is made and finishes when a new test card is presented. During this period, the screen becomes brighter than usual, indicating that the current matching criterion must continue to be used. (4) Matching after positive feedback. This period starts from the moment a new test card is presented after positive feedback and ends when the subject completes her/his selection (maintaining the current rule for classification). (5) Control feedback (Fig. 1A). This period starts from the moment a selection is made during a control trial and finishes when a new control card is presented. The original brightness of the screen is maintained during this period. (6) Control matching (Fig. 2A). This period starts from the moment a new control card is presented and ends when the selection is completed.
Each feedback period lasts 1.9 sec. The length of each matching period depends on the subject's response time. During scanning, it varied between 0.52 and 10.09 sec (mean, 2.18) in the PD group and between 0.61 and 9.7 sec (mean, 1.85) in the control group.
Activity in the appropriate period of the control trials was subtracted from that of the different experimental event periods for the color, shape, and number trials combined to generate the following four contrasts for statistical analysis: (1) receiving negative feedback minus control feedback; (2) matching after negative feedback minus control matching; (3) receiving positive feedback minus control feedback; and (4) matching after positive feedback minus control matching.
All subjects had been fully trained on the task before the scanning session. Training was performed until no additional improvement on the task could be observed. During scanning, the computer display was back-projected onto a mirror in the MRI scanner. Each scanning session contained five functional runs. Within each run, blocks of each of the four trial types (color, shape, number, and the control trials) were presented in random order within each run, with the restriction that no one trial block could be repeated before all four trial types had occurred. In the experimental WCST trial blocks, six correct matching responses in a row had to be completed before a change in dimension occurred. The control trial blocks consisted of eight trials. Individuals were asked to perform the task continuously during the scanning period, and their responses were recorded by a computer.
fMRI scanning. Subjects were scanned using a 1.5T Siemens Vision MRI scanner. Each scanning session began with a high-resolution T1-weighted three-dimensional volume acquisition for anatomical localization (voxel size, 1 × 1 × 1 mm3). This was followed by acquisitions of echoplanar T2*-weighted images with blood oxygenation level-dependent (BOLD) contrast (echo time, 50 msec; flip angle, 90°). Functional images were acquired in five runs in a single session. One hundred twenty-five volumes were acquired continuously every 3.5 sec within each run. Volumes contained 16 slices of 7 mm thickness each (matrix size, 128 × 128 pixels; voxel size, 2.35 × 2.35 × 7 mm3). The stimulus presentation and the scanning were synchronized at the beginning of each run.
Data analysis. The first three frames in each run were discarded because the BOLD signal does not reliably reach steady state during those frames. Images from each run were first realigned using the fourth frame as reference. They were then smoothed using a 6 mm full-width half-maximum (FWHM) isotropic Gaussian kernel. The data analysis was performed using fmristat (Worsley et al., 2002) (available at http://www.bic.mni.mcgill.ca/users/keith/). The statistical analysis of the fMRI data were based on a linear model with correlated errors. The design matrix of the linear model was first convolved with a difference of two gamma hemodynamic response functions with a mean lag of 5.4 sec timed to coincide with the acquisition of each slice (Glover, 1999). Drift was removed by adding polynomial covariates in the frame times, up to degree 3, to the design matrix. Because the response times of the subjects in each trial varied, we were able to obtain BOLD signal at different time points for each type of trial, allowing us to reconstruct the previously defined six events. The length of each period (matching and feedback) was explicitly included in the design matrix for each of the trials of each of the conditions (negative, positive, and control) and was used as a covariate in the analysis. Thus, under the assumption of linearity, a change in differential BOLD response could not be attributed to a difference in reaction times across the various conditions or the two groups. In any case, it should be noted that the matching periods were comparable in length across conditions and patient groups. The correlation structure was modeled as an autoregressive process of degree 1 (Bullmore et al., 1996). At each voxel, the autocorrelation parameter was estimated from the least squares residuals using the Yule-Walker equations, after a bias correction for correlation induced by the linear model. The autocorrelation parameter was first regularized by spatial smoothing with a 15 mm FWHM Gaussian filter and was then used to “whiten” the data and the design matrix. The linear model was reestimated using least squares on the whitened data to produce estimates of effects and their SEs. The resulting effects and standard effect files were then spatially normalized by nonlinear transformation into the standard proportional stereotaxic space described by Talairach and Tournoux (1988) using the algorithm of Collins et al. (1994).
In a second step, runs and then subject data were combined using a another linear model for the effects (as data) with fixed effects SDs taken from the previous analysis. A random effects analysis was performed by first estimating the ratio of the random effects variance to the fixed effects variance, then regularizing this ratio by spatial smoothing with a 15 mm FWHM Gaussian filter for runs and a 10 mm FWHM Gaussian filter for subjects. The variance of the effect was then estimated by the smoothed ratio multiplied by the fixed effects variance to achieve higher degrees of freedom. It should be noted here that the smoothing is applied only to the ratio of variances and not to the data (or effects), nor their SD. The smoothing only aims to reduce noise in the SD, so that the degrees of freedom are higher (Worsley et al., 2002). Intergroup analyses were also performed by making direct comparisons between the resulting average data of the patient and the control groups.
The resulting t statistic images were thresholded using the minimum given by a Bonferroni correction and random field theory to account for multiple comparisons (Worsley et al., 1996). The threshold was calculated based on an estimated gray matter volume scanned of 600 cm3. For a single voxel, this yields a threshold of t > 4.70, which corresponds to p < 0.05 corrected. Significance was also assessed based on the spatial extent of clusters of contiguous voxels, which yields a cluster size >500 mm3 for p < 0.05 corrected with the method described by Friston et al. (1995). The significance of peaks is reported using the minimum p value of the single peak analysis and cluster analysis. All peaks that reached p < 0.05 corrected are reported. Predicted peaks that reached p < 0.001 uncorrected are also reported. A region was predicted if it was significant in our study using the same fMRI protocol on young healthy subjects (Monchi et al., 2001).
Results
Behavioral performance
The healthy control subjects completed an average of 53.30 experimental WCST trial blocks (color, number, or shape) and 18.15 control blocks during the five runs. They made on average 0.11 perseverative errors (i.e., errors attributable to the fact that the subject incorrectly used the same classification rule after negative feedback) and 0.29 nonperseverative (set-loss) errors per WCST trial block. They made an average of 1.22 incorrect classifications per experimental WCST trial block after a change in the rule. Note that these incorrect classifications are not considered as errors, because subjects could not know the new classification rule on the first attempt after a set-shift.
The PD patients completed an average of 44.85 experimental WCST trial blocks and 14.65 control blocks during the scanning session. They made on average 0.26 perseverative errors and 0.80 nonperseverative (set-loss) errors per experimental WCST trial block. They made an average of 1.19 incorrect classifications per experimental WCST trial block after a change in the rule for classification. The number of set-loss errors proved to be significantly larger in the PD group than the control group (t(15) = 4.49; p < 0.001). The number of perseverative errors was also significantly larger in the PD group (t(15) = 3.23; p = 0.006), although it should be noted that the number of perseverative errors was very low in both groups. The number of incorrect classifications after a change in the rule for classification was not significantly different between the two groups (t(15) = 0.428; p = 0.67).
fMRI results
Here, “activations” during a cognitive event will signify greater BOLD signal than in the corresponding control condition. For each group, we compared the BOLD signal obtained during the trials requiring matching according to color, shape, and number (combined) with that obtained during the corresponding periods in the control trials (Tables 1, 2, 3, 4). We also performed intergroup analysis (see Table 5). As predicted, the results revealed decreased activation in the PD group compared with age-matched controls in PFC regions that had shown coactivation with the striatum in our previous study on young healthy subjects (Monchi et al., 2001). In contrast, an increase in activation was observed in other parts of the PFC in the PD group compared with the aged-matched control group.
Table 1.
Receiving negative feedback minus control feedback in both matched control and PD patient groups
|
|
|
Control subjects |
PD patients |
||||||||
|---|---|---|---|---|---|---|---|---|---|---|---|
| Anatomical area |
|
X,Y,Z
|
T statistic |
Cluster |
X,Y,Z
|
T statistic |
Cluster |
||||
| Positive peaks | |||||||||||
| DLPFC (46, 9/46) | L | −42,32,28 | 3.70 | 1168 | −52,36,18 | 5.33 | 1692 | ||||
| R | 48,26,32 | 3.85* | 256 | ||||||||
| VLPFC (47/12) | L | −34,22,4 | 3.87* | 352 | |||||||
| R | 32,22,4 | 5.27 | 560 | ||||||||
| Anterior CC (32 rostral) | L | −8,20,46 | 4.82 | 2512 | −6,30,42 | 4.43 | 536 | ||||
| R | 6,28,46 | 5.29 | 2184 | 6,26,40 | 3.52* | sc | |||||
| Posterior PFC (6,8,44) | L | −50,18,36 | 4.9 | 2952 | |||||||
| Lateral PMC (6 rostral) | L | −44,8,36 | 5.41 | 2752 | −28,10,52 | 4.7 | 1136 | ||||
| R | 44,8,36 | 4.52 | 1288 | 34,14,56 | 4.19* | 136 | |||||
| PMC (6 caudal) | R | 24,2,48 | 3.61* | 160 | |||||||
| PPC (40) | L | −44, −50,42 | 4.12 | 552 | −36, −54,42 | 5.18 | 3120 | ||||
| R | 40, −42,42 | 3.66* | 280 | ||||||||
| PPC (7) | L | −38, −76,40 | 5.53 | 3360 | |||||||
| R | 28, −58,54 | 4.83 | 1600 | 34, −64,50 | 3.71* | 152 | |||||
| Prestriate cortex (19) | L | −28, −66,38 | 5.41 | 3024 | −10, −84, −4 | 6.53 | >5000 | ||||
| −26, −94,2 | 4.69 | 2112 | |||||||||
| R | 20, −76,40 | 3.73* | 120 | 8, −76,6 | 6.05 | >5000 | |||||
| Caudate/thalamus | L | −12, −2,2 | 4.76 | 856 | |||||||
| −10, −6,2 | 3.91 | sc | |||||||||
| Negative peaks | |||||||||||
| Frontopolar cortex (10) | R | 2,58,12 | 3.96* | 136 | |||||||
| Insula | R | 34,8,12 | 4.88 | 1206 | |||||||
| Lateral PMC (6 caudal) | L | −40,0,12 | 4.73 | 1448 | |||||||
| R | 52,2,10 | 5.2 | 1396 | ||||||||
| Motor CC (24) | L | −2, −12,52 | 5.04 | 3192 | |||||||
| R | 2, −12,62 | 5.75 | 4304 | ||||||||
| 10, −6,38 | 3.6 | 504 | |||||||||
| Motor cortex (4) | L | −34, −22,56 | 4.04 | 616 | −44, −22,58 | 5.75 | 2560 | ||||
| PPC (40) | L | −62, −24,20 | 4.16 | 776 | |||||||
| R | 58, −24,26 | 5.24 | 2800 | 44, −32,24 | 4.63 | 3168 | |||||
| MTC (21) | R | 62, −44,4 | 4.72 | 792 | |||||||
| Posterior CC (23) | R | 6, −48,28 | 4.50 | 1752 | |||||||
| Anterior insular cortex | L | −30,4,14 | 4.72 | 1816 | |||||||
| Posterior insular cortex |
R |
|
|
|
32, −16,16 |
4.32 |
920 |
||||
L, Left; R, right; DL, dorsolateral; VL, ventrolateral; CC, cingulate cortex; MTC, middle temporal cortex; OFC, orbitofrontal cortex; PMC, premotor cortex; PPC, posterior parietal cortex. When no asterisk is indicated, p < 0.05 corrected; * p < 0.001 uncorrected. Cluster sizes are reported in mm3. scindicates that the peak is part of the same cluster as the peak listed immediately above in the table and that its size, therefore, is included in the preceding reported volume. The numbers in parentheses refer to architectonic areas.
Table 2.
Matching after negative feedback minus control matching in both the matched control and PD patient groups
|
|
|
Control subjects |
PD patients |
||||||||
|---|---|---|---|---|---|---|---|---|---|---|---|
| Anatomical area |
|
X,Y,Z
|
T statistic |
Cluster |
X,Y,Z
|
T statistic |
Cluster |
||||
| Positive peaks | |||||||||||
| DLPFC (9/46) | R | 34,42,26 | 4.18* | 120 | |||||||
| Posterior PFC (8, 9) | L | −44,26,38 | 4.01* | 264 | |||||||
| (6,8,44) | L | −56,8,28 | 3.11* | sc | |||||||
| Anterior CC (32) | L | −6,24,44 | 4.21 | 536 | |||||||
| VLPFC (47/12) | R | 32,20,2 | 4.41* | 280 | |||||||
| PPC (40) | L | −48, −48,26 | 3.71* | 192 | |||||||
| R | 28, −42,30 | 4.96 | 504 | ||||||||
| PPC (7) | R | 32, −66,52 | 3.46* | 184 | 26, −64,36 | 4.05* | 240 | ||||
| Prestriate cortex (9) | L | −12, −92, −12 | 3.55* | 200 | −8, −82,42 | 4.64 | 1304 | ||||
| −34, −64,46 | 4.58 | 2712 | |||||||||
| R | 36, −84, −8 | 4.25* | 488 | 2, −88,32 | 4.38 | 1888 | |||||
| 14, −92, −10 | 5.14 | 1784 | |||||||||
| 46, −70,6 | 5.07 | 1232 | |||||||||
| Putamen | L | −24, −8,2 | 3.15* | 8 | |||||||
| R | 26, −4,4 | 4.12* | 208 | ||||||||
| Negative peaks | |||||||||||
| Posterior CC (31) |
R |
6, −34,42 |
5.36 |
752 |
|
|
|
||||
For abbreviations, see Table 1.
Table 3.
Receiving positive feedback minus control feedback in both the matched control and PD patient groups
|
|
|
Control subjects |
PD patients |
||||||||
|---|---|---|---|---|---|---|---|---|---|---|---|
| Anatomical area |
|
X,Y,Z
|
T statistic |
Cluster |
X,Y,Z
|
T statistic |
Cluster |
||||
| Positive peaks | |||||||||||
| Frontopolar cortex (10) | L | −20, 60, −6 | 5.77 | 384 | |||||||
| DLPFC (46, 9/46) | L | −50, 42, 26 | 4.68 | 2392 | |||||||
| R | 30, 36, 20 | 4.67 | 264 | ||||||||
| ACC (32 rostral) | L | −6, 30, 42 | 4.61* | 408 | |||||||
| VLPFC (47/12) | L | −52, 28, −8 | 4.47 | 928 | |||||||
| Posterior PFC (6, 8, 44) | L | −46, 10, 36 | 4.97 | 904 | −46, 12, 28 | 4.07 | 2200 | ||||
| PPC (7) | L | −34, −60, 36 | 3.54* | 352 | −34, −54, 38 | 4.95 | 2192 | ||||
| R | 28, −62, 40 | 3.69* | 152 | −18, −76, 42 | 4.75 | 1000 | |||||
| Prestriate cortex (19) | L | −14, −98, 6 | 4.29 | 1120 | −10, −78, 0 | 6.01 | >5000 | ||||
| −16, −52, −4 | 5.29 | >5000 | |||||||||
| R | 40, −78, −10 | 4.11 | 624 | 6, −66, 12 | 5.1 | >5000 | |||||
| 18, −72, 8 | 4.09 | 576 | 24, −68, −14 | 5.28 | 1112 | ||||||
| Negative peaks | |||||||||||
| Lateral PMC (6) |
R |
20, −4, 68 |
3.92*
|
32 |
−16, −28, 50 |
3.94*
|
120 |
||||
For abbreviations, see Table 1.
Table 4.
Matching after positive feedback minus control matching in both the matched control and PD groups
|
|
|
Control subjects |
PD patients |
||||||||
|---|---|---|---|---|---|---|---|---|---|---|---|
| Anatomical area |
|
X,Y,Z
|
T statistic |
Cluster |
X,Y,Z
|
T statistic |
Cluster |
||||
| Positive peaks | |||||||||||
| OFC (11, border 47/12) | L | −26, 32, −8 | 5.67 | 280 | |||||||
| Lateral PMC (6 rostral) | L | −54, 6, 28 | 3.55* | 112 | |||||||
| (6 caudal) | R | 10, −16, 74 | 5.7 | 128 | |||||||
| Negative peaks | |||||||||||
| PPC (40) |
R |
60, −38, 38 |
4.09*
|
224 |
48, −42, 38 |
3.53*
|
64 |
||||
For abbreviations, see Table 1.
Table 5.
Intergroup comparisons
|
|
|
Controls greater than patients |
Patients greater than controls |
||||||||
|---|---|---|---|---|---|---|---|---|---|---|---|
| Anatomical area |
|
X, Y, Z
|
T statistic |
Cluster |
X, Y, Z
|
T statistic |
Cluster |
||||
| Receiving negative feedback minus control feedback | |||||||||||
| VLPFC (47/12) | L | −40, 24, 6 | 3.52* | 48 | |||||||
| R | 30, 22, 4 | 3.28* | 8 | ||||||||
| PMC (6 caudal) | R | 32, 8, 30 | 3.84* | 192 | |||||||
| Prestriate cortex (19) | L | −16, −74, 42 | 3.98* | 112 | |||||||
| Matching after negative feedback minus control matching | |||||||||||
| DLPFC (46, 10) | R | 20, 42, 8 | 3.89* | 176 | |||||||
| 28, 42, 16 | 3.82* | 264 | |||||||||
| Posterior PFC (6, 8, 44) | L | −60, 8, 24 | 3.43* | 64 | |||||||
| Lateral PMC (6 rostral) | R | 44, 2, 42 | 3.86* | 88 | |||||||
| Lateral PMC (6 caudal) | L | −14, −16, 48 | 3.64* | 208 | |||||||
| Motor cortex (4) | R | 18, −26, 48 | 3.91* | 176 | |||||||
| Posterior CC (31) | L | 10, −28, 34 | 4.09* | 344 | |||||||
| PPC (40) | R | 26, −44, 30 | 3.85* | 328 | |||||||
| PPC (7) | R | 20, −56, 32 | 4.01* | 264 | |||||||
| Putamen | L | −22, −9, 2 | 2.2** | ||||||||
| R | 18, −8, 0 | 2.4** | |||||||||
| Receiving positive feedback minus control feedback | |||||||||||
| VLPFC (47/12) | L | −50, 28, −8 | 3.42* | 40 | |||||||
| Matching after positive feedback minus control matching | |||||||||||
| DLPFC (46) | R | 30, 36, 18 | 3.75* | 128 | |||||||
| Lateral PMC (6 rostral) |
L |
−54, 4, 24 |
3.9*
|
440 |
|
|
|
||||
p < 0.01 uncorrected. For abbreviations, see Table 1.
Receiving negative feedback
Control subjects
When the BOLD signal in the period during which the subjects received negative feedback was compared with the control feedback period (Table 1; Fig. 1), significant increases were observed bilaterally in the mid-dorsolateral PFC (areas 46 and 9/46), mid-ventrolateral PFC (area 47/12), premotor cortex (area 6), and the anterior cingulate cortex (ACC; area 32) in control subjects. There was also increased activity involving the left thalamus and caudate nucleus. Significant activations were also found bilaterally in the prestriate and posterior parietal cortex. In contrast, relative to the control feedback, there was a reduction in the BOLD signal in the frontopolar cortex, the posterior and motor cingulate region (area 24), the motor cortex, parietal cortex (area 40), and insula when subjects received negative feedback (Table 1).
PD patients
In the PD group, there were significant increases in BOLD signal in the left mid-dorsolateral PFC (areas 46 and 9/46) and in the posterior PFC at the most caudal part of the inferior frontal sulcus, namely at the junction of rostral area 6 with areas 8 and 44, during the period of receiving negative feedback compared with control feedback (Table 1; Fig. 1). Interestingly, no significant increased activity was found in the mid-ventrolateral PFC or basal ganglia (Fig. 1). Significant peaks of activation were also found in the cingulate cortex, premotor cortex, posterior parietal cortex, and prestriate cortex (Table 1). In addition, relative to the control condition, there was a reduction in BOLD signal in the motor cingulate region and in the motor, parietal, temporal, and insular cortex (Table 1).
Intergroup comparison
When receiving negative feedback was compared with control feedback, greater activation was found in the healthy control subjects compared with the PD patients in the left and right mid-ventrolateral PFC (area 47/12) and the right lateral premotor cortex (area 6) (see Table 5). In contrast, greater activation was found in the left prestriate cortex (area 19) in the Parkinson's population compared with the healthy controls (see Table 5).
Matching after negative feedback
Control subjects
When matching after negative feedback was compared with control matching in the control subjects (Table 2), the BOLD signal was greater in the left posterior PFC (at the junction of areas 8 and 9). The cluster containing the above mentioned peak also contained another peak located in the posterior PFC (intersection of areas 6, 8, and 44), which is close to the activation peak that was observed previously in young healthy subjects for the same cognitive comparison (Monchi et al., 2001). Greater activation was also found in the putamen bilaterally and in the prestriate and the posterior parietal cortex (Table 2), whereas a reduction in BOLD signal was observed in the right posterior cingulate cortex.
PD patients
In the PD group, there were significant BOLD signal increases in the right mid-dorsolateral PFC (areas 46 and 9/46), left ACC (area 32 rostral), and right mid-ventrolateral PFC (area 47/12), when the period of matching after negative feedback was compared with the control matching period. Greater activation was also found in the posterior parietal and the prestriate cortex.
Intergroup comparison
Greater activation was found in the healthy control subjects compared with the PD patients in the left posterior PFC at the intersection of areas 6, 8, and 44 when matching after negative feedback was compared with the control matching period (see Table 5). There was also increased activity in the putamen bilaterally in the controls compared with the PD group, but it only reached a significance level of p < 0.01 uncorrected (see Table 5).
Greater activation was found in the PD group compared with the healthy controls in the right dorsolateral PFC (areas 46 and 10), the lateral premotor cortex (left area 6 caudal and right area 6 rostral), the right motor cortex (area 4), the left posterior cingulate region, and the right posterior parietal cortex (areas 7 and 40) (see Table 5).
Receiving positive feedback
Control subjects
When receiving positive feedback was compared with control feedback (Table 3), there were significant increases in BOLD signal in the right mid-dorsolateral PFC (areas 46 and 9/46) and right posterior PFC (intersection of areas 6, 8, and 44) in the group of control subjects. Activation was also found in prestriate and posterior parietal cortex (Table 3). In contrast, a reduction in the BOLD signal was observed in the premotor cortex.
PD patients
In the PD group, there were significant BOLD signal increases in the left fronto-polar cortex (area 10), left mid-dorsolateral PFC (areas 46 and 9/46), left ACC (area 32 rostral), and right posterior PFC (intersection of areas 6, 8, and 44) when the period of matching after negative feedback was compared with the control matching period. Greater activity was also found in the left ventrolateral PFC (area 47/12) in a region more lateral than the mid-ventrolateral peaks reported above. There was also greater activity in the prestriate and posterior parietal cortex (Table 3). A reduction in the BOLD signal in the premotor cortex was also observed.
Intergroup comparison
There was no significant activation in the control subjects compared with the PD patients when receiving positive feedback was compared with control feedback. Increased activation was observed in the PD group compared with the control group in the left ventrolateral (area 47/12) PFC (see Table 5).
Matching after positive feedback
Control subjects
Comparing BOLD signal during matching after positive feedback to control matching yielded only two significant positive peaks in the control subjects, namely the left lateral premotor cortex (area 6 rostral) and the right lateral premotor cortex (area 6 caudal) (Table 4). There was also a reduction in BOLD signal in the posterior parietal cortex.
PD patients
The PD group showed increased activity in the left orbitofrontal cortex only (area 11, border of 47/12) during matching after positive feedback compared with control matching. There was a reduction in BOLD signal in posterior parietal cortex (Table 4).
Intergroup comparison
For this comparison, increased activity was observed in the left premotor cortex (area 6 rostral) in the control subjects compared with the PD patients (Table 5). Increased activation was observed in the PD patients compared with the controls in the right mid-dorsolateral PFC (area 46).
Receiving negative feedback relative to receiving positive feedback
The specific effect of set-shifting was also examined by subtracting activity during the period of receiving positive feedback from the period of receiving negative feedback in both groups of subjects. Greater BOLD signal was found bilaterally in the mid-ventrolateral PFC (area 47/12) and the prestriate cortex (area 19) in the control subjects during the reception of negative feedback. Greater activation was also found the left caudate and in the mediodorsal thalamus bilaterally, but it only reached a significance level of p < 0.01 uncorrected (Table 6). In contrast, no significant increase in activation was found in the PD group when comparing receiving negative feedback with receiving positive feedback, even at a significance level of p < 0.01 uncorrected (Table 6).
Table 6.
Receiving negative feedback (event 1) minus receiving positive feedback (event 3)
|
|
|
Young healthy subjects |
Matched control subjects |
|
||||
|---|---|---|---|---|---|---|---|---|
| Anatomical area |
|
X, Y, Z
|
T statistic |
X, Y, Z
|
T statistic |
PD patients |
||
| VLPPFC (47/12) | L | −34, 22, 0 | 5.65 | −32, 22, 4 | 3.13* | |||
| R | 32, 24, 4 | 4.98 | 34, 24, 4 | 3.71* | ||||
| Caudate | L | −8, 8, 4 | 3.44* | −7, 8, 2 | 2.26** | |||
| R | 4, 6, 4 | 3.30* | ||||||
| Thalamus | L | −10, −18, 12 | 3.60* | −6, −28, −2 | 2.75** | |||
|
|
R |
6, −14, 4 |
3.55*
|
6, −26, −4 |
2.86**
|
|
||
Discussion
The first functional neuroimaging studies of PD showed a reduction in movement-induced increases in cortical cerebral blood flow (Playford et al., 1992). Dopamine agonists reversed these hypoactivations (Jenkins et al., 1992). The proposed explanation was that excessive inhibitory outflow from basal ganglia to cortex was responsible for both bradykinesia and cortical hypoactivation, based on the model described by Albin et al. (1989). However, a similar explanation could not account for the frontal cognitive deficits in PD because PET studies had demonstrated normal or increased PFC activation in PD patients during the performance of cognitive tasks that measure PFC function (Owen et al., 1998; Dagher et al., 2001).
The pattern of cortical activations observed in the present study in the control subjects (mean age, 54 years) was similar to that we had observed previously in young healthy subjects (mean age, 24 years) (Monchi et al., 2001). Once again, activation was observed in the mid-dorsolateral PFC when receiving both positive and negative feedback, consistent with its role in the monitoring of events in working memory (Petrides, 1996). As reported previously, increased activity was observed in the mid-ventrolateral PFC specifically during the reception of negative feedback, which signals the need for a mental shift to a new response set (Fig. 1B). Similar activation patterns to the ones observed in our previous study with younger healthy subjects were also present in the premotor cortex, the ACC, and the posterior parietal cortex in the older control subjects of the present study. However, there was a slight difference in the subcortical activations. In the older control subjects of the present study, activation of the caudate nucleus and the thalamus was only found on the left side during the reception of negative feedback, whereas in the young healthy subjects these activations were bilateral (Monchi et al., 2001). As in the previous study, there was activation of the left putamen when matching after negative feedback.
In the PD group, as predicted, significantly less activity was observed relative to the current matched control group in the two prefrontal corticostriatal loops that were identified during two particular phases of WCST performance in our previous study (Monchi et al., 2001). In that study, which involved young healthy subjects, as well as in the matched control group of the present study, the mid-ventrolateral PFC and the caudate nucleus were coactivated, during the reception of negative feedback (i.e., during the set-shift). The specific coactivation between the caudate and the mid-ventrolateral PFC and no other PFC region was further confirmed in the present matched controls and young healthy subjects by subtracting receiving positive feedback from receiving negative feedback. That subtraction revealed significantly increased activations only in the mid-ventrolateral PFC, the caudate, and the thalamus (Table 6) (Monchi et al., 2001). As can be seen in Table 1 and Figure 1, unlike the matched control group, there was no significant activity in the mid-ventrolateral PFC during the reception of negative feedback relative to the control feedback period in the PD group, and the intergroup analysis showed significantly less activity in the mid-ventrolateral PFC bilaterally in the PD group compared with the control group (Table 5; Fig. 1). There was also no activation in the caudate nucleus or thalamus in the PD group (Tables 1 and 6). Similarly, in our previous study (Monchi et al., 2001), increased activity in the left posterior PFC was seen together with increased left putamen activity only when matching after negative feedback. In the present study, this pattern of activation in the left posterior PFC and putamen when matching after negative feedback was observed in the control group (replicating the previous result with younger healthy subjects) but was not seen in the PD group (Table 2; Fig. 2B,C). Furthermore, the intergroup analysis confirmed that there was significantly less activity in the left posterior PFC in the PD group compared with the matched control group when matching after negative feedback (Table 5; Fig. 2).
In sharp contrast to the results regarding the ventrolateral PFC-basal ganglia loop, dorsolateral PFC activation was present in the PD group and was either equal to or greater than that observed in the control group. Greater and spatially extensive activation was observed in the PD group compared with the control group in the left dorsolateral PFC when receiving negative feedback (Table 1; Fig. 1), in the right dorsolateral PFC when matching after negative feedback (Table 5), and in the left mid-dorsolateral PFC when receiving positive feedback (Table 3). It should be noted here that the dorsolateral PFC was not specifically coactivated with the striatum in our previous study (Monchi et al., 2001), nor in the present matched control group.
The absent cortical activations in the mid-ventrolateral PFC and posterior PFC in the PD group cannot be attributed to a general hypofunction of these areas. Both these PFC regions were underactive in the PD group compared with the matched control group only during those phases of the task in which these regions exhibited coactivation with the striatum in the controls. Note that these same PFC regions showed hyperactivation in the PD group compared with the controls at other times, such as when receiving positive feedback (Table 7). The reduced activation in these two PFC regions in PD only during those specific phases of WCST performance that recruit these PFC regions in tandem with the striatum may reflect nigrostriatal dopamine deficiency in the caudate and putamen, which is thought to augment the inhibitory output of the basal ganglia to the cerebral cortex via the thalamus (Albin et al., 1989). Indeed, PET studies using tracers sensitive to dopamine cell loss suggest that decreased dopaminergic function in the caudate nucleus correlates with impaired performance in PD on tasks sensitive to frontal dysfunction (Marie et al., 1999; Bruck et al., 2001).
Table 7.
Patterns of frontal and basal ganglia activation in the PD patients and matched control subjects
|
|
Receiving negative feedback |
Matching after negative feedback |
Receiving positive feedback |
Matching after positive feedback |
|---|---|---|---|---|
| DLPFC | PD>MC | PD | PD>MC | PD>MC |
| VLPFC | MC | PD | PD | |
| pPFC | PD | MC | PD>MC | |
| ACC | MC>PD | PD | PD | |
| Caudate | MC | |||
| Putamen |
|
MC |
|
|
MC, Presence of significant activation in the matched control group; PD, presence of significant activation in the PD group; PD>MC, activation in both groups but greater in the PD group than in the control group; MC>PD, activation in both groups but greater in the matched control group than in the PD group. If MC or PD is not present in a given row, then no significant activation was observed in the area for the corresponding group. For other abbreviations, see Table 1.
As shown in Table 7, more extensive activation was found in the PD group compared with the control group in the dorsolateral, ventrolateral, and posterior PFC and in the ACC during different periods of the WCST. These cortical increases in activity may reflect a phenomenon of compensation by areas not functionally affected by nigrostriatal dopamine deficit. Such compensatory mechanisms have previously been proposed in the literature (Samuel et al., 1997; Dagher et al., 2001; Rowe et al., 2002). In the context of the present study, increased activity in all the above mentioned areas during the reception of positive feedback in PD patients could reflect a compensatory mechanism linked to the fact that maintaining set is more difficult for patients than controls, as evidenced by the significantly larger number of set-loss errors made by the PD subjects than the controls.
Cools et al. (2002) and Mattay et al. (2002) suggested that a reduction of mesocortical dopamine in the PFC (originating from the ventral tegmental area) of PD patients may be responsible for the greater cortical activation observed in the dorsolateral PFC in these patients who are off l-dopa compared with those who are on l-dopa during a cognitive task because it has been shown that such intracortical dopamine may be important for focusing neural activity in the cortex (Swagushi, 2001). Furthermore, Mattay et al. (2002) proposed that the mesocortical dopaminergic system influences cognitive function via direct input to PFC, whereas nigrostriatal projections facilitate motor functions via the corticostriatal loops. The pattern of activations observed here in the ventrolateral and posterior PFC suggests an alternative hypothesis. We propose that when a region of the PFC is specifically solicited in conjunction with the striatum for the performance of a specific task, decreases of the nigrostriatal dopamine in unmedicated PD patients may be a critical factor for the loss in function. This would result in decreased activity in this PFC region in unmedicated PD patients compared with controls because the nigrostriatal dopamine depletion occurring in PD is thought to result in decreased cortical activity via increased inhibitory output of the basal ganglia to the thalamus, as mentioned above. In contrast, when a PFC region is not solicited with the striatum for a particular cognitive process, the cortical dopamine deficit plays a greater importance. This would result in increased activity in this PFC region in unmedicated PD patients compared with controls, because intracortical dopamine regulated by the mesocortical system is thought to help focus activity in the cortex.
In conclusion, this study shows that, in PD patients, both decreased and increased activation can occur in prefrontal areas during cognitive performance and that the pattern of activity observed in a specific area of the PFC depends on its specific relationship with the striatum for the task at hand. The decreased activation that was observed in the PD group in the two corticostriatal loops that were implicated during the performance of the WCST in our previous study (Monchi et al., 2001) may be at the origin of the set-shifting deficits observed in those patients.
Footnotes
This work was supported by Grant MOP-49480 from the Canadian Institutes for Health Research to A.D. and J.D. and by a fellowship from the Fondation de l'Institut Universitaire de Gériatrie de Montréal to O.M. We thank P. Ahad for help with the stimulus presentation software, A. L. Lafontaine and M. Panisset for help with patient recruitment, as well as M. Fereirra and B. Pike of the McConnell Brain Imaging Centre at the Montréal Neurological Institute.
Correspondence should be addressed to Dr. Oury Monchi, Centre de Recherche, Institut Universitaire de Gériatrie de Montréal, 4565, Chemin Queen Mary, Montréal, Québec, H3W 1W5, Canada. E-mail: oury@bic.mni.mcgill.ca.
Copyright © 2004 Society for Neuroscience 0270-6474/04/240702-09$15.00/0
References
- Albin RL, Young AB, Penney JB (1989) The functional anatomy of basal ganglia disorders. Trends Neurosci 12: 366-375. [DOI] [PubMed] [Google Scholar]
- Alexander GE, DeLong MR, Strick PL (1986) Parallel organization of functionally segregated circuits linking basal ganglia and cortex. Annu Rev Neurosci 9: 357-381. [DOI] [PubMed] [Google Scholar]
- Bullmore ET, Brammer MJ, Williams SCR, Rabe-Hesketh S, Janot N, David AS, Mellers JDC, Howard R, Sham P (1996) Statistical methods of estimation and inference for functional MR image analysis. Magn Reson Med 35: 261-277. [DOI] [PubMed] [Google Scholar]
- Bruck A, Portin R, Lindell A, Laihinen A, Bergman J, Haaparanta M, Solin O, Rinne JO (2001) Positron emission tomography shows that impaired frontal lobe functioning in Parkinson's disease is related to dopaminergic hypofunction in the caudate nucleus. Neurosci Lett 311: 81-84. [DOI] [PubMed] [Google Scholar]
- Collins DL, Neelin P, Peters TM, Evans AC (1994) Automatic 3D intersubject registration of MR volumetric data in standardized Talairach space. J Comput Assist Tomogr 18: 192-205. [PubMed] [Google Scholar]
- Cools R, Barker RA, Sahakian BJ, Robbins TW (2001) Mechanisms of cognitive set flexibility in Parkinson's disease. Brain 124: 2503-2512. [DOI] [PubMed] [Google Scholar]
- Cools R, Stefanova E, Barker RA, Robbins TW, Owen AM (2002) Dopaminergic modulation of high-level cognition in Parkinson's disease: the role of the prefrontal cortex revealed by PET. Brain 125: 584-594. [DOI] [PubMed] [Google Scholar]
- Dagher A, Owen AM, Boecker H, Brooks DJ (2001) The role of the striatum and hippocampus in planning: a PET activation study in Parkinson's disease. Brain 124: 1020-1032. [DOI] [PubMed] [Google Scholar]
- Defer GL, Widner H, Marie RM, Remy P, Levivier M (1999) Core assessment program for surgical interventional therapies in Parkinson's disease (CAPSIT-PD). Mov Disord 14: 572-584. [DOI] [PubMed] [Google Scholar]
- Dubois B, Malapani C, Verin M, Rogelet P, Deweer B, Pillon B (1994) Cognitive functions and the basal ganglia: the model of Parkinson disease. Rev Neurol (Paris) 150: 763-770. [PubMed] [Google Scholar]
- Glover GH (1999) Deconvolution of impulse response in event-related BOLD fMRI. NeuroImage 9: 416-429. [DOI] [PubMed] [Google Scholar]
- Gotham AM, Brown RG, Marsden CD (1988) `Frontal' cognitive function in patients with Parkinson's disease `on' and `off' levodopa. Brain 111: 299-321. [DOI] [PubMed] [Google Scholar]
- Friston KJ, Holmes AP, Worsley KJ, Poline JB, Frith CD, Frackowiak RSJ (1995) Statistical parametric maps in functional imaging: a general linear approach. Hum Brain Mapp 2: 189-210. [Google Scholar]
- Jenkins IH, Fernandez W, Playford ED, Lees AJ, Frackowiak RS, Passingham RE, Brooks DJ (1992) Impaired activation of the supplementary motor area in Parkinson's disease is reversed when akinesia is treated with apomorphine. Ann Neurol 32: 749-757. [DOI] [PubMed] [Google Scholar]
- Kish SJ, Shannak K, Hornykiewicz O (1988) Uneven pattern of dopamine loss in the striatum of patients with idiopathic Parkinson's disease. Pathophysiologic and clinical implications. N Engl J Med 318: 876-880. [DOI] [PubMed] [Google Scholar]
- Langston JW, Widner H, Goetz CG, Brooks D, Fahn S, Freeman T, Watts R (1992) Core assessment program for intracerebral transplantations (CAPIT). Mov Disord 7: 2-13. [DOI] [PubMed] [Google Scholar]
- Marie RM, Barre L, Dupuy B, Viader F, Defer G, Baron JC (1999) Relationships between striatal dopamine denervation and frontal executive tests in Parkinson's disease. Neurosci Lett 260: 77-80. [DOI] [PubMed] [Google Scholar]
- Mattay VS, Tessitore A, Callicott JH, Bertolino A, Goldberg TE, Chase TN, Hyde TM, Weinberger DR (2002) Dopaminergic modulation of cortical function in patients with Parkinson's disease. Ann Neurol 51: 156-164. [DOI] [PubMed] [Google Scholar]
- Milner B (1963) Effects of brain lesions on card sorting. Arch Neurol 9: 90-100. [Google Scholar]
- Monchi O, Taylor JG, Dagher A (2000) A neural model of working memory processes in normal subjects, Parkinson's disease and schizophrenia for fMRI design and predictions. Neural Netw 13: 953-973. [DOI] [PubMed] [Google Scholar]
- Monchi O, Petrides M, Petre V, Worsley K, Dagher A (2001) Wisconsin Card Sorting revisited: distinct neural circuits participating in different stages of the task identified by event-related functional magnetic resonance imaging. J Neurosci 21: 7733-7741. [DOI] [PMC free article] [PubMed] [Google Scholar]
- Nelson HE (1976) A modified card sorting test sensitive to frontal lobe defects. Cortex 12: 313-324. [DOI] [PubMed] [Google Scholar]
- Owen AM, James M, Leigh PN, Summers BA, Marsden CD, Quinn NP, Lange KW, Robbins TW (1992) Fronto-striatal cognitive deficits at different stages of Parkinson's disease. Brain 115: 1727-1751. [DOI] [PubMed] [Google Scholar]
- Owen AM, Doyon J, Dagher A, Sadikot A, Evans AC (1998) Abnormal basal ganglia outflow in Parkinson's disease identified with PET. Implications for higher cortical functions. Brain 121: 949-965. [DOI] [PubMed] [Google Scholar]
- Petrides M (1996) Specialized systems for the processing of mnemonic information within the primate frontal cortex. Philos Trans R Soc Lond B Biol Sci 351: 1455-1461; discussion 1461-1452. [DOI] [PubMed] [Google Scholar]
- Playford ED, Jenkins IH, Passingham RE, Nutt J, Frackowiak RS, Brooks DJ (1992) Impaired mesial frontal and putamen activation in Parkinson's disease: a positron emission tomography study. Ann Neurol 32: 151-161. [DOI] [PubMed] [Google Scholar]
- Rowe J, Stephan KE, Friston K, Frackowiak R, Lees A, Passingham R (2002) Attention to action in Parkinson's disease: impaired effective connectivity among frontal cortical regions. Brain 125: 276-289. [DOI] [PubMed] [Google Scholar]
- Sabatini U, Boulanouar K, Fabre N, Martin F, Carel C, Colonnese C, Bozzao L, Berry I, Montastruc JL, Chollet F, Rascol O (2000) Cortical motor reorganization in akinetic patients with Parkinson's disease: a functional MRI study. Brain 123: 394-403. [DOI] [PubMed] [Google Scholar]
- Samuel M, Ceballos-Baumann AO, Blin J, Uema T, Boecker H, Passingham RE, Brooks DJ (1997) Evidence for lateral premotor and parietal overactivity in Parkinson's disease during sequential and bimanual movements. A PET study. Brain 120: 963-976. [DOI] [PubMed] [Google Scholar]
- Swagushi T (2001) The role of D1-dopamine related receptors in working memory-guided movements mediated by frontal cortical areas. Parkinsonism Relat Disord 7: 9-19. [DOI] [PubMed] [Google Scholar]
- Talairach J, Tournoux P (1988) Co-planar stereotaxic atlas of the human brain. Stuttgart, Germany: Thieme.
- Taylor AE, Saint-Cyr JA, Lang AE (1986) Frontal lobe dysfunction in Parkinson's disease. The cortical focus of neostriatal outflow. Brain 109: 845-883. [DOI] [PubMed] [Google Scholar]
- Worsley KJ, Marrett S, Neelin P, Vandal AC, Friston KJ, Evans AC (1996) A unified statistical approach for determining significant signals in images of cerebral activation. Hum Brain Mapp 4: 58-73. [DOI] [PubMed] [Google Scholar]
- Worsley KJ, Liao CH, Aston J, Petre V, Duncan GH, Morales F, Evans AC (2002) A general statistical analysis for fMRI data. NeuroImage 15: 1-15. [DOI] [PubMed] [Google Scholar]