

Abstract
During early postnatal development, corticospinal (CS) system stimulation, electrical or transcranial magnetic, is minimally effective in producing muscle contraction, despite having axon terminals that excite spinal neurons. Later, after stimulation becomes more effective, the cortical motor representation develops, and movements the system controls in maturity are expressed. We determined whether development of temporal facilitation (response enhancement produced by the second of a pair of pyramidal tract stimuli, or a higher stimulus multiple of a train of stimuli) correlated with these changes. Facilitation of the monosynaptic CS response was larger in older kittens and adults than younger kittens. When facilitation was strong, strong motor responses were evoked by pyramidal stimulation with small currents and few pulses. With strong facilitation in older kittens, corticospinal axon varicosities colocalize synaptophysin like adults, suggesting a presynaptic mechanism. With effective facilitation, control signals from the cortex can be sufficiently effective to provoke muscle contraction for guiding movements.
Keywords: motor cortex, corticospinal system, spinal cord, development, postnatal cord, spinal, postnatal, cat
Introduction
In maturity, the corticospinal (CS) system exercises control over some of the most highly adaptive and skilled movements, especially those using the digits (Porter and Lemon, 1993). This control, however, is present only after a prolonged postnatal developmental period. CS projections grow into the gray matter during late prenatal and early postnatal life (Wise et al., 1977; Theriault and Tatton, 1989; Alisky et al., 1992; Galea and Darian-Smith, 1995; Chakrabarty and Martin, 2000; Li and Martin, 2001), and, surprisingly, their axon terminals are capable of activating spinal neurons soon thereafter (Meng and Martin, 2003). Despite early synapse formation with spinal neurons, behavioral and physiological findings indicate that the CS system is not engaged in limb control during early development in the same important way that it is in maturity. Motor behaviors that the system controls in adults, especially manipulation and reaching, are either not expressed during early development (Porter and Lemon, 1993; Galea and Darian-Smith, 1995) or have so few of the mature characteristics that they are unlikely to be the same behaviors later in development and in maturity (Konczak et al., 1995). Motor cortex stimulation is an exquisitely sensitive way to activate muscle in adult humans and animals (Porter and Lemon, 1993) but not in neonates (Bruce and Tatton, 1980; Koh and Eyre, 1988; Nezu et al., 1997; Olivier et al., 1997; Chakrabarty and Martin, 2000).
How does the CS system become capable of driving spinal motor circuits with sufficient strength to provoke muscle contraction for controlling limb movements? Being more subtle than simply a lack of synapses with spinal neurons, we turned to development of the capacity for effective temporal facilitation of descending CS system control signals (Porter and Lemon, 1993). Facilitation is enhancement of the response evoked by the second of a pair of stimuli or, when trains of stimuli are used, the response to a higher stimulus multiple. If facilitation is less effective at immature CS synapses, CS system activation could be ineffective in driving muscle contraction. Although development of multiple spinal circuits could contribute to increasing the effectiveness of corticospinal control at any stage of spinal maturation, less effective facilitation could prevent the CS system from expressing its motor control functions.
We examined development of CS facilitation in kittens and mature cats. We showed previously that pyramidal tract (PT) stimulation evoked a pair of surface potentials in the cervical cord at short latency, corresponding to the CS volley and postsynaptic responses, respectively (Meng and Martin, 2003). Recordings within the gray matter also revealed a pair of field potentials with similar timing as the surface potentials that were consistent with sequential activation of CS axons and excitation of their targets, which, in cats, are interneurons only (Baldissera et al., 1981). Intracellular recordings in adult cats have shown that the timing of disynaptic excitation of motoneurons primarily occurs after the time of the peak of the second surface and deep postsynaptic waves (Illert et al., 1976; Alstermark and Ohlson, 2000), suggesting that these potentials are monosynaptic. To study facilitation, we first compared postsynaptic field potentials evoked by single and paired PT stimuli, limiting our investigation to this putative monosynaptic component. Then, we examined the capacity of PT stimuli to evoke peripheral motor potentials at different postnatal ages. Third, we used confocal microscopy to determine age-dependent changes in CS presynaptic sites. We show that facilitation of the CS monosynaptic response and peripheral motor responses were larger in both older kittens and adults than in younger kittens. When facilitation was strong, CS axon varicosities colocalize synaptic vesicle protein, suggesting a presynaptic mechanism for the CS facilitation. Our findings show that, after development of effective facilitation of CS responses, control signals from the motor cortex can be sufficiently effective to provoke muscle contraction for guiding limb movements.
Materials and Methods
General methods. All cats used in this study [electrophysiology, 5 adults, 14 kittens; postnatal weeks 4 (PW4) to PW13; confocal microscopy, 2 adults, 7 kittens; PW4-PW12) were obtained from an Association for Assessment and Accreditation of Laboratory Animal Care accredited supplier. All experiments were conducted with the approval of the New York State Psychiatric Institute and the Institutional Animal Care and Use Committee of Columbia University. For compiling results, animals were placed in one of three age groups on the basis of CS developmental milestones: PW4 and PW5 are before topographic specificity is achieved in the cat; PW7-PW13 are kittens in which CS topographic specificity is present and adults (>4 months) (Li and Martin, 2000, 2001, 2002). We did not examine PW6 because it overlaps the two kitten groups.
Under general anesthesia (30 mg/kg, i.m., ketamine; 0.6-0.8 mg/kg, i.m., xylazine; maintained using ketamine infusion at 10-30 mg · kg-1 · hr-1, i.v.), the head was placed in a stereotaxic frame, and a cervical (C) laminectomy was made, as in our previous study (Meng and Martin, 2003). The C8 spinous process was clamped to stabilize the vertebral column. The pyramidal tract electrode (a pair of stainless steel electrodes separated by 2 mm, oriented in the sagittal plane) was placed in the caudal medulla between 0.5 and 0.75 mm lateral from the midline just rostral to the caudal edge of the occipital bone. In adults, this corresponded to anteroposterior 13.5. In all experiments, we determined the position of the electrode histologically. We showed previously that this ventral medullary placement evokes activity in the descending corticospinal fibers in the lateral spinal column (Meng and Martin, 2003). We exposed a several centimeter length of the musculocutaneous nerve in the proximal forearm for recording peripheral motor responses using bipolar electrodes.
Pyramidal tract stimulation, electrophysiological recordings, and analysis. Pyramidal tract stimulation was produced using a constant current stimulator (biphasic stimulus 20 μsec duration; model 2100; A-M Systems, Carlsborg, WA). In all animals, we determined the dorsoventral extent of effective medullary sites for evoking the spinal potentials. Short-latency surface potentials could be recorded over the lateral funiculus (Meng and Martin, 2003), beginning 1-1.5 mm above the floor of the skull and continuing for an additional 0.8-1.0 mm (depending on age). Marking lesions were made in all animals to verify final electrode placement used during stimulation. In all experiments, stimulation was adjusted to twice threshold for evoking spinal responses. Threshold current varied in relation to the animal's age (Meng and Martin, 2003), from ∼400 μA in PW4 animals to 100-150 μA in adults.
Spinal surface potentials were recorded above the dorsal root entry zone at C6 using a silver ball electrode. Depth recordings were made using a glass micropipette (10-20 μm tip, 4 m NaCl; 0.1-0.4 MΩ), using conventional amplification and filtration (filters cut signals <100 Hz and >10 kHz) and digitization. We chose extracellular recording approaches because it is difficult to maintain neonatal cat spinal preparations in vivo. These extracellular techniques are efficient substitutes for the more physiologically invasive single-cell recordings requiring paralysis and artificial ventilation. Moreover, they are effective in sampling the actions of ensembles of CS axon terminals and their postsynaptic targets (Meng and Martin, 2003).
Depth recordings were made at 10 sites distributed rostrocaudally within C6, whereas surface recordings were made over the dorsolateral funiculus at C6. We recorded at 500 μm depth intervals at each rostrocaudal penetration site. For all recordings, the output of the amplifier was digitized on-line, and responses to individual stimuli or a set of 10 stimuli (as an ensemble average) were saved on disk for subsequent analysis. The records all show positive up. Data were collected at a sampling rate of 20 kHz, in 20 msec epochs for spinal recordings, or 5 kHz, in 80 msec epochs for the peripheral nerve recordings.
For the spinal recordings, we examined responses to paired stimuli because such stimuli rarely evoked motor responses, thereby allowing us to stably record the potentials. The principal interval used (3.33 msec) was sufficiently long to resolve the potentials evoked by the first stimulus in most experiments; when not, we measured responses to a single stimulus. In all cases, potentials evoked by a single stimulus had the same amplitude and configuration as the first set of potentials to paired stimulation. In all experiments, we verified the constancy of the amplitude of the volleys evoked by the first and second stimuli. We measured (see next paragraph) volley amplitude from its peak to the negative minimum at the end of the falling phase of the volley. Constancy of volley amplitude shows that changes in surface and deep postsynaptic field potentials evoked by PT stimulation were not attributable to changes in effectiveness of CS axon stimulation. To obtain a measure of motor responses evoked by PT stimulation, we recorded from the musculocutaneous nerve in the proximal arm with bipolar electrodes. The limb was stabilized during recording.
We used the program Axograph (Axon Instruments, Foster City, CA) for the Apple Macintosh computer (Apple Computers, Cupertino, CA) to measure the latency and amplitude of spinal responses (on single trials). Specific measurements are described in Results. For presenting potentials (see Figs. 1, 4), we constructed ensemble averages synchronized on the stimulus artifact or a critical point on the evoked response (e.g., peak). For the nerve recording experiments, we first eliminated any baseline offset and then filtered (fast Fourier transform; 1 kHz high cutoff) the record to eliminate stimulus artifacts, followed by rectification and integration. Current parameter plots and contours were created using the program Transform (Research Systems, Boulder, CO). We determined the significance of age-related differences using paired and unpaired t tests, ANOVAs, and linear regressions using the program Statview (SAS, Cary, NC). A post hoc test (Bonferoni-Dunn) was used to determine significance between subgroups.
Figure 1.
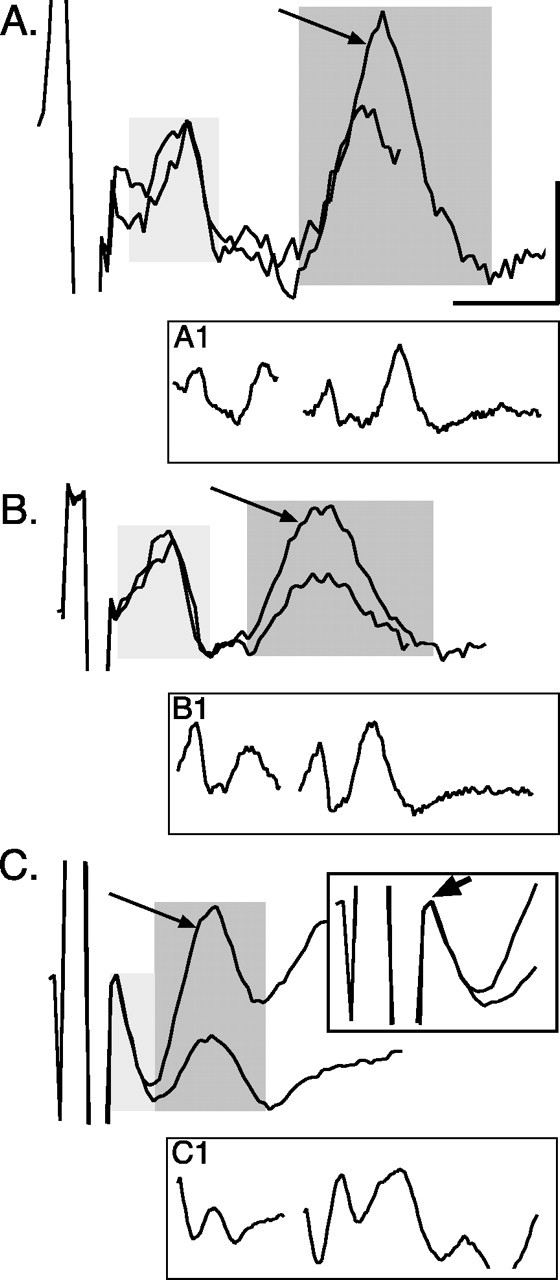
Facilitation of CS postsynaptic responses. Ensemble averages (n = 10 stimuli) of surface recordings (at C6) in response to a pair of PT stimuli (twice threshold) at PW4 (A), PW7 (B), and in an adult (C). Averages for the potentials evoked by the first stimulus were synchronized with the first stimulus artifact, and potentials evoked by the second stimulus were synchronized by the second artifact. Traces were aligned with the point of maximal value of the volley. The light gray box marks the CS volley, and the dark gray box marks postsynaptic response. Arrows point to the postsynaptic response evoked by the second stimulus, which was larger than to the first. A1, As in A, but a continuous trace with the stimulus artifacts eliminated for clarity. B1, As in B, but a continuous trace with the stimulus artifacts eliminated for clarity. C1, As in C, but a continuous trace with the stimulus artifacts eliminated for clarity. C, Inset. As in C, but expansion of the artifact and volley. The arrow in the inset points to the peak of the CS volley. Most of the early phase of the potential was obscured by the stimulus artifact. Calibration: A, 0.5 msec, 5.1 μV; B, 0.5 msec, 8 μV; C, 0.5 msec, 9.36 μV; A1, 1.35 msec, 16.5 μV; B1, 1.35 msec; 15 μV; C1, 1.35 msec, 22.9 μV; C, inset, 0.35 msec, 11.4 μV.
Figure 4.
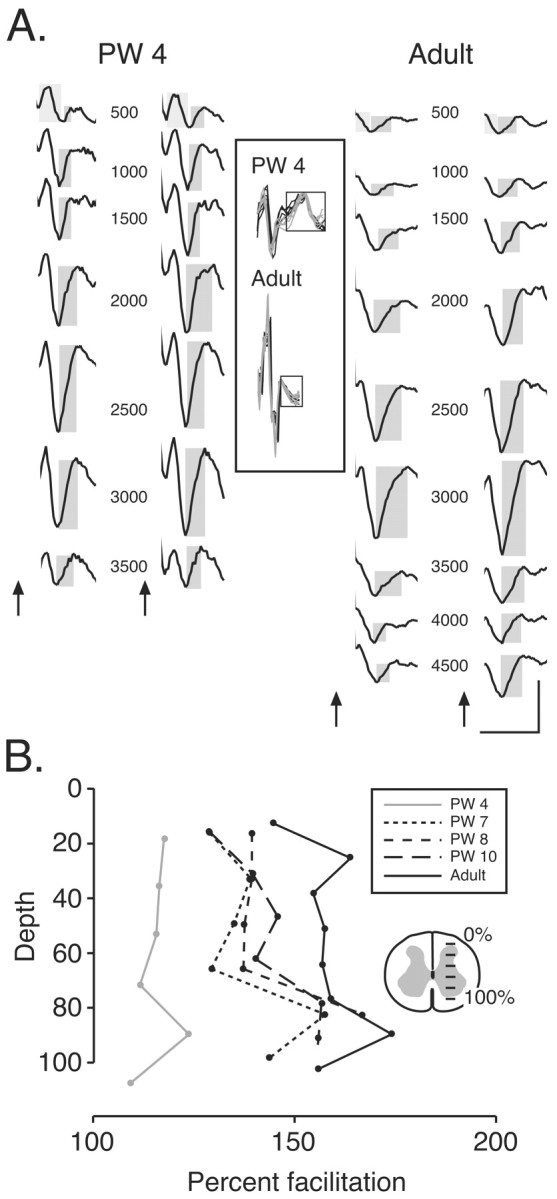
CS facilitation occurs over a wide dorsoventral extent of the spinal gray matter. A, Spinal surface and depth recordings in a PW4 animal (left) and adult (right). Ensemble averages (n = 10; across the 10 rostrocaudal penetration sites) are shown in relation to the spinal schematic section (in the bottom). The artifacts were eliminated for clarity. For each animal, the panel on the left shows responses to the first stimulus, and the panel on the right shows responses to the second stimulus. For the top trace (500 μm), the light gray boxes correspond to the presynaptic field potential, and the dark gray box correspond to the postsynaptic field potential. Arrows mark the onsets of each stimulus. The inset shows overlay plots of the surface volleys (boxed) recorded during stimulation. Black lines plot responses to the first stimulus, and gray lines plot responses to the second stimulus. B, Relationship between postsynaptic response amplitude and depth, expressed as the percentage of gray matter from the dorsal border. Calibration: PW4, 1 msec, 100 μV; adult, 1 msec, 750 μV.
At the end of each physiology experiment, a lesion was made through the caudal PT stimulating electrode. The animal was killed with an overdose of anesthesia and either perfused transcardially with saline, followed by 10% formal saline, or the brain and cervical spinal cord were removed in situ and placed in fixative. After a suitable postfixation time, transverse sections were cut through the caudal medulla and through the region of the spinal cord examined, in either the horizontal or transverse plane. Tissue was Nissl stained and examined for the PT electrode lesion site and track and spinal depth recording sites. Depths in the spinal cord were measured in relation to landmarks (i.e., gray matter borders) or dye spots after tissue was mounted onto slides but before staining.
CS axon tracing and immunocytochemistry. Animals were anesthetized as described above and mounted in a stereotaxic head holder (David Kopf Instruments, Tujunga, CA). Under aseptic conditions, a craniotomy was made over the lateral portion of the frontal lobe to expose the forelimb representation of motor cortex. We used the anterograde tracer biotinylated dextran amine (BDA) (5%; Molecular Probes, Eugene, OR), iontophoresed into the forelimb area of motor cortex (between 1.2 and 1.5 mm below the pial surface, depending on the animal's age). Up to three adjacent sites (separated by <1 mm) received tracer.
After appropriate survival periods [2 weeks for PW4 animals (at time the animals were killed); 3 weeks for PW7-PW13 animals; 4 weeks for adults (Li and Martin, 2001, 2002)], animals were deeply anesthetized (adults cats, 30 mg/kg, i.v., Nembutal; PW8 or less, as described previously) and perfused transcardially with warm saline (39°C; depending on body weight, 200-400 ml for 2 min). Heparin was injected (intravenously, 200-500 U) at the onset of the saline perfusion. This was followed by 4% paraformaldehyde in 0.1 m phosphate buffer (PB) (4°C; pH 7.3-7.4; 1000 ml/kg body weight), infused initially at the rate of 100-200 ml/min and then adjusted to a slower rate to produce a total perfusion time of 20-30 min. The brain and spinal cord were removed, postfixed in the same fixative at 4°C for 8 hr, and then transferred to 20% sucrose in PB overnight. Frozen sections (30 μm) through the C7-T1 spinal cord were cut and first processed for synaptophysin immunocytochemistry and then BDA histochemistry following the instructions of the manufacturer. The sections were incubated in the primary synaptophysin antibody (monoclonal; 1:1000 dilution; Chemicon, Temecula, CA) overnight at 4°C and then in the secondary antibody (1:25 dilution), conjugated to FITC, for 1 hr at room temperature. The same sections were then incubated in strepavidin conjugated to rhodamine (1:10 dilution; Biosource International, Camarillo, CA) at room temperature for 3 hr. Samples from animals of different ages were processed using identical reagent concentrations, incubation times, and temperature.
Confocal microscopy (40× water immersion; model LSM410; Zeiss, Oberkochen, Germany) was used to determine whether CS axon terminal varicosities contained synaptophysin immunostaining. Selection of candidate double-labeled CS axon terminals was based solely on the criterion that BDA-labeled varicosities were located in regions of tissue that strongly stained for synaptophysin using standard epifluorescence. Because of light scatter, we could not determine colocalization at this stage of the analysis. Therefore, selection of tissue for examination with the confocal microscope was not biased by the likelihood of double label. For confocal microscopy, we obtained a series of 1 μm optical sections through terminals selected using the criterion just described. We used the following protocol for analyzing the presence or absence of double label. First, varicosities were identified on the BDA-labeled projection image (i.e., full thickness), blind to synaptophysin label. A varicosity was defined as a site on a BDA-labeled axon that had a maximal diameter at least three times axonal width (Li and Martin, 2001, 2002). Second, the coordinates of all marked varicosities were transferred to individual optical slice files. Third, we determined the presence or absence of puncta of synaptophysin labeling within a 5.625-μm-diameter circle centered on the varicosity coordinate. A puncta of synaptophysin was defined as three or more contiguous pixels of red label above background. Puncta were typically present on adjoining optical slices.
Results
CS postsynaptic responses are strongly facilitated in older kittens and adults
PT stimulation in cats, between PW4 and adult, evokes a pair of surface and deep potentials in the cervical cord (Meng and Martin, 2003). The first surface potential (latency between 0.5 and 1.05 msec at C6, depending on age) corresponds to the CS volley because it is produced selectively by PT activation (i.e., not dorsal, ventral, or lateral), it is abolished by lesion of the dorsolateral funiculus, and its latency increases with conduction distance from C4 to C6 (Meng and Martin, 2003). The second surface potential corresponds to the postsynaptic field potential. It is also dependent on PT stimulation because it is not evoked by stimulation just dorsal or lateral to the PT and abolished after dorsolateral funiculus lesion, indicating dependence on the CS tract. However, the longer latency of the second potential is not attributable to slowly conducting unmyelinated CS axons (Joosten and Gribnau, 1988), because its latency from the cord dorsum potential does not increase with distance from the PT simulation site (Meng and Martin, 2003). This potential is consistent with being produced by currents associated with the activity of local CS axon terminations evoking postsynaptic responses on interneurons. We discuss the depth potentials later. In this study, we used the surface and depth postsynaptic potentials to probe the capacity of the CS system to facilitate spinal sensorimotor circuits at different postnatal ages. We compared the amplitudes of these potentials evoked by the first of a pair of PT stimuli (at twice threshold) with the amplitudes of potentials evoked by the second. We used an interstimulus interval of 3.33 msec, which is routinely used to evoke motor responses by cortical stimulation. We monitored the constancy of CS volley amplitude to verify that changes were not attributable to differences in axon activation.
Figure 1 shows ensemble averages of the pair of evoked CS responses recorded from the surface of C6 at PW4 (A), PW7(B), and in an adult (C). Responses evoked by the first and second PT stimuli are superimposed. The volley is marked by the light gray box; the postsynaptic response is marked by the darker box. A1-C1 show the surface recordings as a continuous traces, with the artifacts removed. At all ages, the two stimuli evoked volleys that had the same peak amplitude. Note that, in older kittens and adults, the end of the shock artifact obscured a portion of the first half of the volley (Fig. 1C, inset, which expands the stimulus artifact and the volley). Despite comparable activation of the CS projection by the two stimuli, the second PT stimulus consistently evoked larger postsynaptic responses. This facilitation of the postsynaptic response was smallest for the PW4 animal and largest in the adult.
For quantifying data, animals were placed into one of three age groups according to CS maturational criteria (see Materials and Methods). In 4- and 5-week-old animals, the onset of the postsynaptic response, relative to the peak of the surface volley, was 0.51 ± 0.03 msec, and the peak was 1.48 ± 0.04 msec (n = 4 animals). The times shorten in older kittens to 0.44 ± 0.02 msec for the onset and 1.21 ± 0.06 msec for the peak (n = 6 animals). In the adult, the onset was 0.38 ± 0.02 msec, and the peak was 0.92 ± 0.07 msec (n = 4 animals). In mature cats, PT stimulation evokes disynaptic excitation of motoneurons detected intracellularly between 1.2 and 2.0 msec after the CS surface volley (Illert et al., 1976; Alstermark and Ohlson, 2000). Although these latency values are based on slightly different measurements than ours and done only in the adult, they strongly suggest that the surface postsynaptic potential is occurring predominantly within the monosynaptic time range (i.e., before disynaptic excitation), especially in the older kittens and adults.
Figure 2 plots percentage facilitation for the postsynaptic surface potential (gray bars; measured at the peak). There was a significant difference between the change in amplitudes of the postsynaptic potentials across groups (F = 11.78; p = 0.0018). There were significant differences between the amount of facilitation of the postsynaptic response between each age group (<PW5 and PW7-PW13, p = 0.0086, t = -3.46; <PW5 and adults, p = 0.0024, t = -5.042; PW7-PW13 and adults, p = 0.08; t = -1.972). Regression analysis also showed that there was a significant age-dependent increase in the percentage of facilitation between weeks 4 and 13 (r = 0.762; n = 10; p < 0.01; y-intercepts of regression line at weeks 4 and 13 were 126 and 217%, respectively).
Figure 2.

Facilitation of the postsynaptic responses. Each gray bar in the graph plots mean ± SE percentage facilitation for the postsynaptic response for various age groups. Open bars plot mean ± SE percentage facilitation for the volley. Asterisks indicate significant differences. Each bar is the average of data from multiple animals (less than PW5 = 4; PW7-PW13 = 6; adult = 4).
In contrast to the postsynaptic surface potential, facilitation or decrement of the volley (i.e., amplitude measured from positive peak to negative minimum) did not occur (Fig. 2, open bars) (F = 0.463; p = 0.6410). Facilitation is not attributable to increased synchronization of CS axon activation to the second stimulus. This was determined by comparing volley fall times (i.e., interval between volley peak and negative minimum) to the two stimuli. We reasoned that, if the CS spikes evoked by the second PT stimulus were more synchronized, volley duration would be significantly shorter. This was not the case. Average volley fall time for PW4 animals (n = 4) was 0.55 ± 0.08 msec for the first stimulus and 0.53 ± 0.08 msec for the second; for 7- to 13-week-old animals (n = 6), the values were 0.42 ± 0.03 msec for either stimulus; and for adults (n = 4), the values were 0.40 ± 0.03 and 0.39 ± 0.04 msec. Paired t test showed no difference (t = 0.641; p = 0.533). CS facilitation in older kittens and adults were not attributable to age-related differences in critical timing parameters for facilitation. The interstimulus interval used (Fig. 3, gray bar, 3.33 msec) was maximally effective in adult cats and older kittens, with longer intervals showing less of an effect. In the younger kittens (PW4-PW5), only a minimal trend was apparent. At all ages, there was a drop in facilitation at shorter intervals. This could be attributable partly to a drop in the CS signal because the amplitude of the second volley also decreased at these short interstimulus intervals. These results show an age-dependent increase in facilitation of the primarily monosynaptic CS surface response.
Figure 3.

Effect of interstimulus interval on CS facilitation. The vertical gray bar marks the principal interstimulus interval used (3.33 msec). Each data point in C is the average of data from several animals (less than PW5 = 4; PW7-PW13 = 6; adult = 4).
We next determined whether there were age-related changes in the amount of facilitation of the local postsynaptic field potential in the spinal gray matter. This was important to determine because the CS tract in cats at various ages terminates on both sensory circuits in the dorsal horn and motor circuits in the intermediate zone and ventral horn (Li and Martin, 2000). We were particularly interested in determining whether facilitation that we recorded on the surface of the cord correlated with facilitation of motor circuits of the intermediate zone and ventral horn. We showed previously that PT stimulation evoked a pair of field potentials in the cervical cord at short latency (Meng and Martin, 2003). Figure 4A shows responses recorded from within the gray matter in a PW4 animal (left) and an adult (right). We recorded at 500 μm intervals, beginning at the dorsal surface of the dorsal horn and continuing to the base of the ventral horn. The first column for each animal shows the field potentials evoked by the first stimulus, and the second column shows potentials evoked by the second stimulus. The first and second field potentials (presynaptic and postsynaptic; see Discussion) in the top set of traces (at 500 μm) are marked by light and dark gray boxes, respectively. The inset shows superimposed CS surface volleys recorded concurrently in these two animals in response to the first (black) and second (gray) stimuli.
The first field potential occurs during the surface CS volley and thereby corresponds to the presynaptic field potential. This is a positive-negative wave, with the initial phase partially obscured by the shock artifact in older animals because of decreased CS tract conduction time (Meng and Martin, 2003). Synchronous spiking of CS preterminal and terminal axons and their high density in the gray matter (Li and Martin, 2000, 2001) produces a condition that favors strong summation of phasic extracellular currents (Westbrook, 2000). The positive-going phase, based on classical field potential analysis, corresponds to local outward currents (source) as spikes are conducted toward the pipette tip. The negative-going phase corresponds to the reduction in these currents (i.e., repolarization) and, if there is a sufficiently high density of active axons at the pipette tip, to local inward currents (sink) as action potentials are nearby.
We measured the timing of the different phases of the first and second (see below) potentials. These measurements were made from recordings at the depth where the amplitude of the presynaptic and postsynaptic field potentials was, on average, largest (3000 μm in the adult; 2000-3000 μm in the kittens). For all animals, the presynaptic field potential evoked by the first stimulus began at or slightly after the peak of the surface volley, 0.12 ± 0.05 msec. Its duration was 0.33 ± 0.02 msec. These values did not vary systematically with age. Values for the potential triggered by the second stimulus were not different from the first (time-to-peak, 12 ± 0.06; duration, 0.32 ± 0.03). This suggests that synchrony of CS tract activation by first and second PT stimuli was the same because responses evoked by the two stimuli had a similar timing.
The timing and waveform of this potential is similar to what has been reported for 1a afferent terminal action potentials (Munson and Sypert, 1979). However, unlike the focal 1a potentials, which were localized to very discrete regions near target neuron populations, the field potential we recorded was localized more broadly because pipette size-impedance was large. In kittens, the presynaptic field extended throughout the dorsal and ventral horns (Fig. 4A). This correlates with the broad dorsoventral extent of CS axon terminations in kittens (Theriault and Tatton, 1989; Alisky et al., 1992; Meng and Martin, 2003). In the adult, the dorsoventral extent of CS axon terminations was restricted to the deep dorsal horn and intermediate zone (Fig. 4A, middle recording sites), which is where CS terminals are densest in the adult (Li and Martin, 2000). The latency of the potential (peak positivity and negativity) did not change systematically with depth (i.e., increased distance from the dorsolateral funiculus), indicating the distant source of the potential and volume conduction.
The second depth potential, a negative-positive wave, began after the end of the surface volley and reached a maximal value between the middle to late portion of the rising phase of the postsynaptic surface potential, or just after the peak. This is termed the postsynaptic field potential. The onset of this potential, relative to the peak CS surface volley, occurred after 0.46 ± 0.04 msec, and the positive peak of this potential occurred after 0.98 ± 0.06 msec. The latency to peak was shortest at PW4 (0.82 msec) and longest in maturity (1.15 msec). Values for the latency and duration of the postsynaptic field potential evoked by the second stimulus were not different from the first (onset, 0.44 ± 0.05; time-to-peak, 0.99 ± 0.06).
The postsynaptic field potential reflects predominantly summation of extracellular synaptic currents because its occurrence is too late for CS axon spiking and postsynaptic responses have a long time course (relative to action potentials) that favors summation of extracellular currents. The duration of the postsynaptic potential, 0.52 ± 0.04 msec, is similar to the duration of extracellular fields of focal EPSPs in motoneurons produced by last-order interneurons (Hongo et al., 1989) and 1a terminals (Munson and Sypert, 1979), ∼0.5 msec. Synchronous spiking could also contribute to the late positivity, similar to hippocampal formation and amygdala (Bliss and Lomo, 1973; Rogan and LeDoux, 1995). As discussed previously, the shortest disynaptic latency (for excitation in motoneurons) in adult cats, relative to the cord dorsum potential, is 1.2 msec (Illert et al., 1976; Alstermark and Ohlson, 2000). This shows that the postsynaptic field occurs between the incoming CS signal and disynaptic excitation, suggesting that it is the monosynaptic CS response. The particular positive-going polarity of the potential reflects outward currents (source) for postsynaptic depolarization. This is because the large tip diameter and low impedance of the pipette favors recording outward currents at distant sites. The number of spinal interneurons at the pipette tip receiving direct CS axon contacts and the amount of associated inward synaptic currents would be small compared with the capacity of the pipette to sample summed synaptic currents over several hundred micrometers. Unlike focal synaptic potentials, in which negative responses are localized to very discrete gray matter regions (Watt et al., 1976; Munson and Sypert, 1979), the distribution of the postsynaptic field potential we recorded was localized but broad (Fig. 4A). As discussed above for the presynaptic field, differences in the dorsoventral extent of the postsynaptic field correlate with the distribution of CS axon terminals in kittens and adults (Meng and Martin, 2003). It should also be noted that CS synapses are not known to produce monosynaptic hyperpolarization, which would produce a short-latency positive potential when the tip of a small pipette is at the site of outward current.
We found that the amplitude of the postsynaptic field potential (Fig. 4A, within dark gray boxes, measured from negative minimum to positive maximum) to the second stimulus was consistently larger than the potential to the first at all depths for both animals but greater for the adult. In contrast, the CS volleys evoked by the two stimuli were comparable (Fig. 4A, inset). Figure 4B plots the percentage facilitation in relation to the recorded depth in a set of animals between PW4 and adult. Because the spinal cord increased in size as the animals grew, depth is expressed as a percentage of the extent of the gray matter. Each value in Figure 4B is the average of recordings at 10 different rostrocaudal sites within C6 at the particular depth. Minimal facilitation is present in the PW4 animal at all depths. Intermediate facilitation was present in the 7- to 10-week-old kittens, but, interestingly, there was a nearly adult-like facilitation in the ventral laminas. Facilitation was high at most depths in the adult but a bit greater ventrally. We measured the latency of the peak postsynaptic field (from the peak of the surface volley) in these animals but found no systematic differences from dorsal-to-ventral. This suggests that the postsynaptic field potential in the deeper laminas is still within the monosynaptic range but biased by a different population of CS synapses than potentials from more dorsal. The age-dependent differences in facilitation of the postsynaptic field potential parallel the changes we recorded from the surface (Fig. 2, gray bars).
CS facilitation promotes production of motor responses
Our findings indicate that CS postsynaptic responses are capable of greater facilitation as animals grow older, with the greatest change between PW5 and PW7. We next examined whether motor responses could be evoked by PT stimulation at different ages. These experiments aimed to determine whether the stimulus parameters needed to evoke a motor response, defined by current amplitude and the number of stimuli, changed during development. We reasoned that, if the capacity of CS postsynaptic responses to facilitate is muted in young animals, then long trains of PT stimuli would be required to reach threshold for evoking a motor response. In contrast, in older kittens and adults, when CS synapses show greater facilitation, motor responses should be evoked by shorter stimulus trains. Motor responses evoked by PT stimulation reflect the summed output of spinal motor circuits and not just neurons contacted by CS terminals. Nevertheless, an increased capacity to evoke motor responses by PT stimulation during development would correlate with facilitation of CS-evoked responses and suggest that CS system development contributes to this aspect of motor development. To monitor motor output, we recorded from the musculocutaneous nerve at the level of the proximal arm. Nerve recording is more sensitive than recording ventral root potentials or directly from muscle because it carries convergent signals from various levels of the cervical cord. We used trains of stimuli (up to 15 stimuli) and a wide range of current amplitudes.
Figure 5, A and B, shows ensemble averages of nerve recordings during different stimulation conditions at two ages. In the PW4 animal (Fig. 5A), high currents and multiple stimuli were needed to evoke a response. The lowest current for evoking a response at this age was 300 μA, in which six stimuli were needed. Fewer stimuli were needed at 600 μA. For the adult (B), four stimuli at the threshold current of 40 μA evoked a response and two stimuli at 300 μA. In older animals, incremental increases in stimulus number evoked larger increases in responses than in younger animals. Figure 5B (inset) shows that recordings before and after section of the dorsal roots from C4 to T1 were similar. We confirmed this in two other animals. There was a 9.6% reduction (average across the three animals) in integrated potential before and after dorsal root section. This indicates that the recorded potential did not reflect significant facilitation attributable to afferent discharges as a consequence of activation of peripheral mechanoreceptors produced by weak muscle contraction.
Figure 5.

Potentials recorded from the musculocutaneous nerve in response to PT stimulation. A, Recordings from a PW4 animal. Arrows correspond to the time of occurrence of each stimulus. Ensemble averages show the effects of multiple stimuli using the amount of current indicated. B, As in A, but for an adult. B, Inset, Section of the dorsal roots from C4 to T1 has no effect on the recorded nerve potential. Ensemble average was from an adult, in response to five stimuli at 200 μA. Calibration: A, 500 μV; B, 300 μV; B, inset, 10 msec, 50 μV.
Figure 6 presents data showing stimulus current-stimulus number relationships. A range of stimulus currents and train lengths were used for each animal to characterize the stimulation parameters for evoking peripheral nerve responses. We began with subthreshold parameters and continued until the recorded nerve response saturated, at which point, we stimulated using higher currents but fewer stimuli. This enabled us to explore more of the stimulus parameter space without incurring large muscle contractions. Plots in A show current-stimulus number relationships for four cats at different ages. Each colored square plots the averaged rectified and integrated musculocutaneous nerve potential (as a color scale, with red equal to 100%) evoked by the particular stimulus amplitude-stimulus number pair. Black squares correspond to stimulus parameters that were not tested systematically because they were either in the saturated range or produced strong muscle contraction. Responses in the black area were effectively maximal. Long stimulus trains and high currents were needed to evoke motor responses in the PW4 animal. Parameters for the PW7 and PW8 animals overlapped but were shifted to lower currents and fewer stimuli than those for the 4-week-old animal. The stimulus amplitude-stimulus number thresholds for the adult were shifted further compared with the kittens.
Figure 6.

Current amplitude-stimulus number plots for animals of different ages. A, Images plot the amount of rectified and integrated nerve activity that was evoked for a particular current amplitude and number of stimuli. The black portion of the plots are points at which no stimulus was given because this was in the region of the stimulus current-stimulus number space producing maximal responses. B, Contours (at 40% maximal) were fitted to the data values in the graphs in A, as well as for two additional animals. The thick lines covering part of each contour is the location of the threshold boundary (i.e., responses evoked by the lowest current amplitudes and fewest numbers of stimuli).
For comparing between animals, contours were fitted around data points of the current amplitude-number matrix (i.e., data not black squares) that were greater than or equal to 40% and superimposed (Fig. 6B). The side of each contour that faces lower currents and fewer stimuli (thick line) defines the threshold boundary for producing responses. The location of the side of the contour plot adjoining the saturated (black) zone depends on the extent of the stimulus amplitude-stimulus number space explored. Contours in older animals were narrow because saturation occurred after smaller increments in stimulus amplitude and number. Additional animals are included in the summary figure. Interestingly, the PW5 animal had unexpectedly low current amplitude thresholds for its age (Meng and Martin, 2003) but, nevertheless, needed large stimulus numbers to evoke responses. The contour plots (especially the threshold boundary) for the various ages are located in three minimally overlapping regions of the current amplitude-stimulus number space: from the top right (large current amplitudes and numbers) for week 4 and 5 animals to the bottom left (small amplitudes and numbers) for adults. Contours for 7- and 8-week-old kittens were intermediate between those of younger kittens (when the properties of CS terminals and synapses are poorly suited for facilitation) and adults (when stimulation parameters are optimized). Our findings indicate that CS tract stimulation becomes more effective in evoking motor responses as animals mature and, importantly, as CS facilitation increases (Fig. 2, gray bars).
There are fewer CS presynaptic sites at PW4 than PW7 and older
CS facilitation could be attributable to a combination of presynaptic and postsynaptic mechanisms. Our previoulsy anatomical findings (Li and Martin, 2001, 2002) indicate that the density of CS axon terminal varicosities is disproportionately low in young kittens. The improved capacity for facilitation in older kittens and adults cats could be attributable to achieving a critical density of presynaptic sites. To test this idea, we used laser confocal microscopy to determine whether individual CS axon varicosities, labeled with the anterograde tracer BDA, and immunostained for the synaptic vesicle-associated protein synaptophysin. BDA labeled varicosities (all of which were in the spinal gray matter, and most were in the intermediate zone) could be functional presynaptic sites if they also contain synaptophysin (Fletcher et al., 1991; Ahmari and Smith, 2002; Kim et al., 2003).
Figure 7 shows a typical example of CS presynaptic site labeling in an adult. The left and middle panels show confocal images of different regions of the same CS terminal in two optical sections within the 30 μm tissue section. A1 and A2 contain the merged images (BDA, green; synaptophysin, red; double label, yellow), B1 and B2 show synaptophysin labeling only, and C1 and C2 show BDA labeling. D is the BDA projection image for the entire series of optical sections, showing a more complete portion of the terminal. Arrows mark three CS axon varicosities, and each is clearly double labeled. Distinct puncta of aggregated red pixels are seen in the immunostained images (B1, B2), and corresponding CS varicosities are seen in the BDA-labeled images (C1, C2). Puncta size was similar to varicosity size. Other examples of double-labeled axon varicosities are present but not marked.
Figure 7.
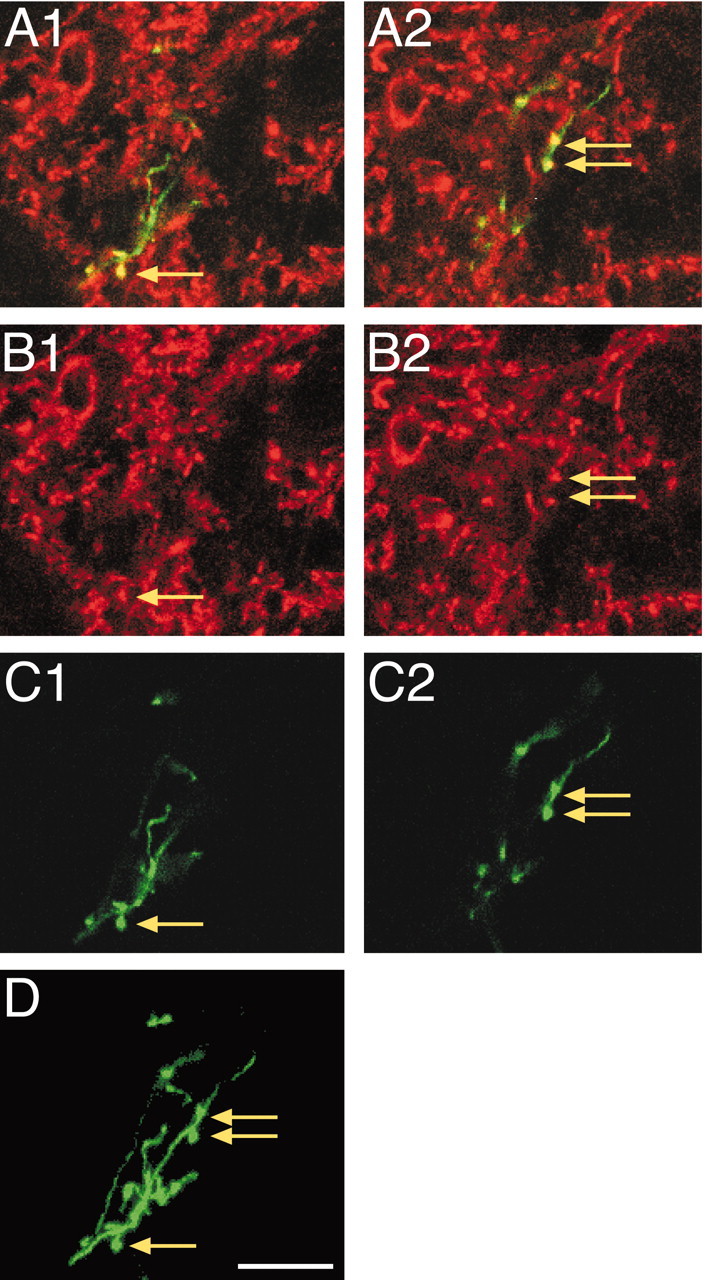
Synaptophysin labeling within labeled mature CS axon terminal varicosities. A, Merged images of BDA and synaptophysin label for two optical planes (A1, A2). B, Synaptophysin labeling only. C, BDA labeling only. D, The projection image for this axon terminal. Arrows mark the locations of varicosities, all of which are double labeled. Scale bar, 50 μm.
Figure 8 shows an example of an immature CS axon terminal in a PW4 animal. Arrows mark single- and double-labeled varicosities. The yellow arrow points to a synaptophysin-containing varicosity, and white arrows point to varicosities without synaptophysin. The relative absence of double-labeled CS varicosities is not attributable to generalized immaturity of the spinal neuropil because distinct puncta of synaptophysin are clearly present at this age. Terminals at week 4 (including the one shown in Fig. 8) typically had double-labeled non-varicose axon segments, which could be synaptophysin en route to developing presynaptic sites. These findings show, for the first time in vivo, that not all CS varicosities can be functional presynaptic sites. Varicosities without coincident synaptophysin label may be newly formed and not yet functional.
Figure 8.

Synaptophysin labeling within labeled immature CS axon terminal varicosities Similar to Figure 7, but for a typical CS terminal at PW4. Arrows mark the locations of varicosities (yellow, double labeled; white, BDA label only). Scale bar, 25 μm.
The mean percentage of double-labeled CS varicosities in PW4 animals was 29.6 ± 3.1% (n = 627 total number of labeled varicosities). In contrast, the percentage of double-labeled varicosities in the older kittens (PW7-PW12) was 76.8 ± 2.9% (n = 285 total number of varicosities) and in adults was 89.2 ± 2.3% (n = 168 total number of varicosities). The lack of 100% double label in adults could be attributable to either the presence of true single-labeled varicosities or incomplete antibody penetrance. The differences across the three age groups were significant (F = 40.756; p < 0.0001). Between groups, however, only differences in the PW4 and either of the two other groups were significant (p < 0.0001). These findings show that, by PW7, the percentage of synaptophysin-containing CS varicosities is not different from adults.
Discussion
The classical studies of Phillips, Lloyd, and their colleagues (Phillips and Porter, 1977) indicate the importance of temporal facilitation of CS synaptic activity for driving spinal motor circuits in maturity. Multiple PT or motor cortex stimuli were needed to evoke motoneuronal or ventral root responses. CS facilitation also is important in awake animals. Single-unit studies in monkeys performing motor tasks show that motor cortex neurons, including identified corticomotoneuronal cells, begin to modulate their spike trains up to several hundreds of milliseconds before movement onset (for review, see Porter and Lemon, 1993). This long lead time is thought to be required for facilitation of spinal motor circuits, possibly because the actions of individual CS synapses are weak. We therefore reasoned that, when facilitation is weak at immature CS synapses, descending CS control signals are ineffective in driving muscle contraction. The lack of strong facilitation would effectively filter CS signals from influencing muscle excitability. Thus, postnatal development of the capacity for facilitation of CS synaptic activity in spinal motor circuits could underlie development of effective transmission of control signals between the motor cortex and muscle. We took a novel approach to chart the systematic progression of the capacity of the CS system to evoke a motor response and found that, as the capacity for facilitation of spinal responses increased in older kittens and adults, so too did the capacity for evoking motor responses.
Several loci along the path from CS axon terminals to the motoneurons could contribute to facilitated motor responses. We recorded an age-dependent facilitation of the initial postsynaptic response. In older kittens and adults, this response is likely to be monosynaptic because it occurs primarily before the onset of disynaptic excitation on the basis of intracellular studies in the adult cat (Illert et al., 1976; Alstermark and Ohlson, 2000). In the youngest kittens, the postsynaptic surface potential could receive a disynaptic contribution because its time-to-peak is longer. However, facilitation of the postsynaptic depth potential, which is within the monosynaptic range, correlates with surface facilitation. Facilitation of the monosynaptic response could reflect an increased number of effective synapses as CS presynaptic sites mature. Consistent with this view, we found that the percentage of synaptophysin-containing CS axon varicosities was higher in older kittens and adults (when facilitation was strongest) than in younger kittens (when facilitation was weakest). (For discussion of the differential roles of elevated synaptophysin content and growth of CS axon varicosities, see next section.) Whereas development of facilitation of the monosynaptic CS response parallels that of motor facilitation, peripheral motor responses evoked by PT stimulation reflect the summed output of many spinal neurons and not just neurons directly contacted by CS terminals. Moreover, maturation of these neurons and their connections (Kalb and Hockfield, 1992; Inglis et al., 2000) could play a role in development of motor facilitation. Several key questions persist, including what are the relative contributions of facilitation in downstream targets to motor facilitation (such as at synapses between interneurons and between interneurons and motoneurons) and how does facilitation at other sites develop. Nevertheless, development of the capacity for facilitation of the monosynaptic CS response would enable the CS system to acquire a stronger role in transmitting control signals at any stage of spinal development.
CS terminal synaptophysin content and facilitation
In the youngest animals, CS varicosities without synaptophysin could be nascent presynaptic sites (Ahmari and Smith, 2002; Kim et al., 2003) that under the appropriate conditions convert to functional presynaptic sites. However, it is not know what these conditions are for the developing CS system. Hippocampal neurons in culture colocalize synaptic vesicle protein in axons and form puncta of synaptic vesicle protein in axon varicosities only after contact with postsynaptic neurons (Fletcher et al., 1991). Furthermore, as in cultured hippocampal neurons, we found that non-aggregated synaptophysin label was often present in CS preterminal axons in week 4 animals, suggesting that the axonal synaptophysin was being transported to developing presynaptic sites. This is consistent with the idea that CS varicosities without synaptophysin are a population of nascent presynaptic sites that have not contacted their target spinal neurons. Another study has shown that target cell contact is not sufficient for functional varicosity formation. Cultured Aplysia sensory neurons add synaptophysin to preexisting axon varicosities on motoneurons after 5-HT treatment, a condition that also promotes intermediate-term facilitation (Kim et al., 2003). Activity also plays a role in establishing active presynaptic sites. Presynaptic tetanus in cultured hippocampal neurons can rapidly induce structural changes that promote the formation of new active presynaptic terminals (Colicos et al., 2001). Activity plays a key role in shaping development of CS axon terminal topography (Martin et al., 1999), although it is not yet understood what role it plays in synapse formation.
A relatively stepwise increase in the percentage of synaptophysin-labeled CS varicosities by week 7 together with a CS terminal growth spurt, also beginning at approximately week 7 (Li and Martin, 2001), can help to explain development of CS facilitation. We propose that CS axon varicosities that do not colocalize synaptophysin are nascent synapses that increase their synaptophysin content later in development to become functional presynaptic sites. If each functional CS presynaptic site (i.e., double-labeled varicosity) were capable of a small increment in response amplitude to the second of a pair of stimuli, then it follows that, as CS terminals add additional presynaptic sites, greater facilitation would occur. Several forms of short-term plasticity are mediated by increased neurotransmitter release that is dependent on rapid elevation of Ca2+ at or near transmitter release sites (Fisher et al., 1997). By regulating the number of CS presynaptic sites after week 7, when the percentage of synaptophysin-labeled CS varicosities is high, such as through an activity- or use-dependent mechanism, the capacity for facilitation could be adjusted. Specifically, facilitation could occur after week 7, when synaptophysin content in CS varicosities is high, but only if there were sufficient numbers of presynaptic sites to produce adequate neurotransmitter release for a strong postsynaptic response. Indeed, the number of CS axon terminals and varicosities increases substantially during early postnatal life, especially after PW7-PW8 (Li and Martin, 2001, 2002). Although synaptophysin content is high at the onset of this growth spurt, there is a relatively low number of axon terminals and varicosities compared with older kittens and adults. It follows that stimulation in older kittens and adults would be expected to excite a greater number of effective (i.e., synaptophysin-containing) presynaptic sites and produce more facilitation.
The transition to corticospinal motor control functions
Between postnatal weeks 3 and 7 in the cat, CS axon terminals undergo extensive activity-dependent refinement (Martin et al., 1999). Transient ipsilateral and dorsoventral terminations are eliminated, and there is local branch growth as well as growth to particular target regions in the gray matter (Li and Martin, 2000). Near the beginning of this period, the only effective stimulation parameters for producing motor responses were high currents and many stimuli. By the end of this period, the mature topography of CS terminations is established and the percentage of synaptophysin-containing CS terminals is not significantly different from adults. With a higher percentage of synaptophysin-containing varicosities, together with a higher density of axon terminal branches and varicosities, descending CS control signals would now be expected to more easily produce muscle contraction. This is also the age when the cortical motor map begins to develop in cats (Bruce and Tatton, 1980; Chakrabarty and Martin, 2000). Developmental plasticity at the spinal level (both CS facilitation and CS presynaptic site formation) could underlie a large measure of the maturation of neural circuits for adaptive movement control. An adequate capacity to drive spinal motor circuits is likely to be one of the first steps toward development of motor representations in primary motor cortex. We showed that multijoint synergies begin to be encoded in motor cortex by 10 weeks in the cat (Chakrabarty and Martin, 2000), which is when facilitation is well developed. Single-unit and mapping experiments in mature motor cortex have revealed territories containing neurons that control multiple digits during manipulation (Schieber and Hibbard, 1993) and multiple forelimb joints during reaching (Georgopoulos et al., 1982). During postnatal development, the amount of facilitation could thus be a critical determinant of the degree and pattern of control the CS system is able to exert over limb movements.
These findings indicate that CS involvement in movement control would naturally increase during postnatal development. The high currents and frequent stimuli needed to produce motor responses in very young kittens could effectively prevent the CS system from evoking movements under behavioral conditions, when neural activity is much less synchronous than the activity change produced by PT stimulation and not maximal. The age at which the percentage of synaptophysin-containing varicosities is mature and the cortical motor map development unfolds is a transition from when CS signals are used for activity-dependent refinement (Martin et al., 1999), and possibly spinal modulatory functions, to beginning to control limb muscles during adaptive behaviors, which is one of the mature motor control roles of the system. This transition is well timed to follow the period of dynamic remodeling of CS terminals (Li and Martin, 2001, 2002). By limiting the ability of the CS system to drive muscle contraction until after connections are specified anatomically, the cortical motor system would be better able to predict the consequences of its actions.
Footnotes
This work was supported by National Institutes of Health Grant NS33835 and March of Dimes Birth Defects Foundation. We thank XiuLi Wu for histology and help during experiments, Michelle Choy for help with data analysis, and Dr. M. Osman and G. Asfaw for veterinary care.
Correspondence should be addressed to Dr. John H. Martin, Center for Neurobiology and Behavior, Columbia University, 1051 Riverside Drive, New York, NY 10032. E-mail: jm17@columbia.edu.
Copyright © 2004 Society for Neuroscience 0270-6474/04/240605-10$15.00/0
References
- Ahmari SE, Smith SJ (2002) Knowing a nascent synapse when you see it. Neuron 34: 333-336. [DOI] [PubMed] [Google Scholar]
- Alisky JM, Swink TD, Tolbert DL (1992) The postnatal spatial and temporal development of corticospinal projections in cats. Exp Brain Res 88: 265-276. [DOI] [PubMed] [Google Scholar]
- Alstermark B, Ohlson S (2000) Origin of corticospinal neurones evoking disynaptic excitation in forelimb motoneurones mediated via C3-C4 propriospinal neurones in the cat. Neurosci Res 37: 91-100. [DOI] [PubMed] [Google Scholar]
- Baldissera F, Hultborn H, Illert M (1981) Integration in spinal neuronal systems. In: Handbook of physiology, Sec I, The nervous system, Vol II, Motor Control (Brooks VB, ed), pp 509-596. Bethesda: American Physiological Society.
- Bliss TV, Lomo T (1973) Long-lasting potentiation of synaptic transmission in the dentate area of the anaesthetized rabbit following stimulation of the perforant path. J Physiol (Lond) 232: 331-356. [DOI] [PMC free article] [PubMed] [Google Scholar]
- Bruce IC, Tatton WG (1980) Sequential output-input maturation of kitten motor cortex. Exp Brain Res 39: 411-419. [DOI] [PubMed] [Google Scholar]
- Chakrabarty S, Martin JH (2000) Postnatal development of the motor representation in primary motor cortex. J Neurophysiol 84: 2582-2594. [DOI] [PubMed] [Google Scholar]
- Colicos MA, Collins BE, Sailor MJ, Goda Y (2001) Remodeling of synaptic actin induced by photoconductive stimulation. Cell 107: 605-616. [DOI] [PubMed] [Google Scholar]
- Fisher SA, Fischer TM, Carew TJ (1997) Multiple overlapping processes underlying short-term synaptic enhancement. Trends Neurosci 20: 170-177. [DOI] [PubMed] [Google Scholar]
- Fletcher TL, Cameron P, De Camilli P, Banker G (1991) The distribution of synapsin I and synaptophysin in hippocampal neurons developing in culture. J Neurosci 11: 1617-1626. [DOI] [PMC free article] [PubMed] [Google Scholar]
- Galea MP, Darian-Smith I (1995) Postnatal maturation of the direct corticospinal projections in the macaque monkey. Cereb Cortex 5: 518-540. [DOI] [PubMed] [Google Scholar]
- Georgopoulos AP, Kalaska JF, Caminiti R, Massey JT (1982) On the relations between the direction of two-dimensional arm movements and cell discharge in primate motor cortex. J Neurosci 2: 1527-1537. [DOI] [PMC free article] [PubMed] [Google Scholar]
- Hongo T, Kitazawa S, Ohki Y, Xi M-C (1989) Functional identification of last-order interneurones of skin reflex pathways in the cat forelimb segments. Brain Res 505: 167-170. [DOI] [PubMed] [Google Scholar]
- Illert M, Lundberg A, Tanaka R (1976) Integration in the descending motor pathways controlling the forelimb in the cat. I. Pyramidal effects on the motoneurons. Exp Brain Res 26: 509-519. [DOI] [PubMed] [Google Scholar]
- Inglis FM, Zuckerman KE, Kalb RG (2000) Experience-dependent development of spinal motor neurons. Neuron 26: 299-305. [DOI] [PubMed] [Google Scholar]
- Joosten EA, Gribnau AA (1988) Unmyelinated corticospinal axons in adult rat pyramidal tract. An electron microscopic tracer study. Brain Res 459: 173-177. [DOI] [PubMed] [Google Scholar]
- Kalb RG, Hockfield S (1992) Activity-dependent development of spinal cord motor neurons. Brain Res Rev 17: 283-289. [DOI] [PubMed] [Google Scholar]
- Kim J-H, Udo H, Youn TY, Chen M, Kandel ER, Bailey CH (2003) Presynaptic activation of silent synapses and growth of new synapses contribute to intermediate and long-term facilitation in Aplysia. Neuron 40: 1-20. [DOI] [PubMed] [Google Scholar]
- Koh TH, Eyre JA (1988) Maturation of corticospinal tracts assessed by electromagnetic stimulation of the motor cortex. Arch Dis Child 63: 1347-1352. [DOI] [PMC free article] [PubMed] [Google Scholar]
- Konczak J, Borutta M, Topka H, Dichgans J (1995) The development of goal-directed reaching in infants: hand trajectory formation and joint torque control. Exp Brain Res 106: 156-168. [DOI] [PubMed] [Google Scholar]
- Li Q, Martin JH (2000) Postnatal development of differential projections from the caudal and rostral motor cortex subregions. Exp Brain Res 134: 187-198. [DOI] [PubMed] [Google Scholar]
- Li Q, Martin JH (2001) Postnatal development of corticospinal axon terminal morphology in the cat. J Comp Neurol 435: 127-141. [DOI] [PubMed] [Google Scholar]
- Li Q, Martin JH (2002) Postnatal development of connectional specificity of corticospinal terminals in the cat. J Comp Neurol 447: 57-71. [DOI] [PubMed] [Google Scholar]
- Martin JH, Kably B, Hacking A (1999) Activity-dependent development of cortical axon terminations in the spinal cord and brain stem. Exp Brain Res 125: 184-199. [DOI] [PubMed] [Google Scholar]
- Meng Z, Martin JH (2003) Postnatal development of corticospinal synaptic actions. J Neurophysol 90: 683-692. [DOI] [PubMed] [Google Scholar]
- Munson JB, Sypert GW (1979) Properties of single central 1a affernt fibres projecting to motoneurones. J Physiol (Lond) 296: 315-327. [DOI] [PMC free article] [PubMed] [Google Scholar]
- Nezu A, Kimura S, Uehara S, Kobayashi T, Tanaka M, Saito K (1997) Magnetic stimulation of motor cortex in children: maturity of corticospinal pathway and problem of clinical application. Brain Dev 19: 176-180. [DOI] [PubMed] [Google Scholar]
- Olivier E, Edgley SA, Armand J, Lemon RN (1997) An electrophysiological study of the postnatal development of the corticospinal system in the macaque monkey. J Neurosci 17: 267-276. [DOI] [PMC free article] [PubMed] [Google Scholar]
- Phillips CG, Porter R (1977) Corticospinal neurones. London: Academic.
- Porter R, Lemon R (1993) Corticospinal function and voluntary movement. Oxford: Oxford Science.
- Rogan MT, LeDoux JE (1995) LTP is accompanied by commensurate enhancement of auditory-evoked responses in a fear conditioning circuit. Neuron 15: 127-136. [DOI] [PubMed] [Google Scholar]
- Schieber MH, Hibbard LS (1993) How somatotopic is the motor cortex hand area? Science 261: 489-492. [DOI] [PubMed] [Google Scholar]
- Theriault E, Tatton WG (1989) Postnatal redistribution of pericruciate motor cortical projections within the kitten spinal cord. Dev Brain Res 45: 219-237. [DOI] [PubMed] [Google Scholar]
- Watt DGD, Stauffer WK, Taylor A, Reinking RM, Stuart DG (1976) Analysis of muscle receptor connections by spike-triggered averaging. I. Spindle primary and tendon organ afferents. J Neurophysiol 39: 1375-1392. [DOI] [PubMed] [Google Scholar]
- Westbrook GL (2000) Seizures and epilepsy. In: Principles of neural science, Ed 3 (Kandel E, Schwartz J, Jessell T, eds). New York: McGraw-Hill.
- Wise SP, Hendry SHC, Jones EG (1977) Prenatal development of sensorimotor cortical projections in cats. Brain Res 138: 538-544. [DOI] [PubMed] [Google Scholar]