Abstract
The midbrain inferior colliculus (IC) is implicated in coding sound location, but evidence from behaving primates is scarce. Here we report single-unit responses to broadband sounds that were systematically varied within the two-dimensional (2D) frontal hemifield, as well as in sound level, while monkeys fixated a central visual target.
Results show that IC neurons are broadly tuned to both sound-source azimuth and level in a way that can be approximated by multiplicative, planar modulation of the firing rate of the cell. In addition, a fraction of neurons also responded to elevation. This tuning, however, was more varied: some neurons were sensitive to a specific elevation; others responded to elevation in a monotonic way. Multiple-linear regression parameters varied from cell to cell, but the only topography encountered was a dorsoventral tonotopy.
In a second experiment, we presented sounds from straight ahead while monkeys fixated visual targets at different positions. We found that auditory responses in a fraction of IC cells were weakly, but systematically, modulated by 2D eye position. This modulation was absent in the spontaneous firing rates, again suggesting a multiplicative interaction of acoustic and eye-position inputs. Tuning parameters to sound frequency, location, intensity, and eye position were uncorrelated. On the basis of simulations with a simple neural network model, we suggest that the population of IC cells could encode the head-centered 2D sound location and enable a direct transformation of this signal into the eye-centered topographic motor map of the superior colliculus. Both signals are required to generate rapid eye-head orienting movements toward sounds.
Keywords: inferior colliculus, superior colliculus, monkey, oculomotor, sound, localization
Introduction
To localize a sound, the auditory system uses implicit acoustic cues. Left-right localization (azimuth) depends on the binaural differences in sound arrival time [interaural time difference (ITD)] and sound level [interaural level difference (ILD)], whereas up-down and front-back localization (elevation) relies on spectral filtering by the pinnae [head-related transfer functions (HRTFs)] (Blauert, 1997). Initially, independent neural pathways in the brainstem process the different localization cues (for review, see Yin, 2002; Young and Davis, 2002). The midbrain inferior colliculus (IC) is a major convergence center for these pathways and could thus be an important node in the auditory pathway to encode two-dimensional (2D) sound locations (for review, see Casseday et al., 2002). Several lines of evidence support this hypothesis. In the barn owl IC, a topographic map represents 2D auditory space (Knudsen and Konishi, 1978). In mammals, IC neurons are tuned to binaural localization cues (Kuwada and Yin, 1983; Fuzessery et al., 1990; Irvine and Gago, 1990; Delgutte et al.; 1999; McAlpine et al., 2001) and elevation (Aitkin and Martin, 1990; Delgutte et al., 1999), although azimuth tuning width increases with sound level (Schlegel et al., 1988; Binns et al., 1992; Schnupp and King, 1997). Tracer studies have provided evidence on the connectivity between the IC and the superior colliculus (SC), a nucleus that mediates rapid 2D orienting of eyes, head, and pinnae to multisensory stimuli (Sparks, 1986; Stein and Meredith, 1993; Wallace et al., 1993). The IC projects to the SC, as shown in the owl (Knudsen and Knudsen, 1983), cat (Andersen et al., 1980; Harting and Van Lieshout, 2000), and ferret (King et al., 1998). Conversely, the SC also projects to subdivisions of the IC, such as the barn owl's external nucleus (Hyde and Knudsen, 2000), the mammalian pericentral nucleus (Itaya and Van Hoesen, 1982; Mascetti and Strozzi, 1988), and the nucleus of the brachium of IC (Doubell et al., 2000).
This reciprocal connectivity has interesting implications for the reference frames in which sounds might be encoded. The spatial tuning of auditory neurons in the mammalian SC varies with eye position (Jay and Sparks, 1984, 1987; Hartline et al., 1995; Peck et al., 1995), suggesting that the initial head-centered auditory input has been transformed into oculocentric coordinates. Recently, also IC neurons were reported to be modulated by eye position and sound location in the horizontal plane (Groh et al., 2001, 2003). These cells were proposed to form an intermediate stage in this coordinate transformation.
Nevertheless, direct evidence of spatial coding in the monkey IC remains scarce. For example, because sound level also modulates IC responses (Ryan and Miller, 1978), it remains unclear whether the reported azimuth tuning of IC neurons relates to binaural (ITD and ILD) mechanisms or to a monaural head-shadow cue. Note, however, that the latter is ambiguous with respect to azimuth. Moreover, tuning to sound elevation has been essentially left unattended.
To dissociate the various possibilities, the present study includes both sound-source azimuth and elevation, while varying sound level to quantify neural responses. We also tested sensitivity to 2D eye position. The results are summarized in a simple model on the potential role of the IC in auditory-evoked orienting.
Materials and Methods
Animal preparation and surgical procedures
Two adult male rhesus monkeys (Macaca mulatta; referred to as Gi and Br; 7-8 kg weight) participated in the experiments. Both monkeys were trained to follow and fixate small visual targets [light-emitting diodes (LEDs)] to obtain a small liquid reward. Records were kept of the monkeys' weight and health status, and supplemental fruit and water were provided when deemed necessary. All experiments were conducted in accordance with the guidelines for the use of laboratory animals provided by the Society for Neuroscience, and the European Communities Council Directive of November 24, 1986 (86/609/EEC) and were approved by the local ethics committee for the use of laboratory animals of the Nijmegen University.
After training was completed, the animals were prepared for chronic neurophysiological experiments in two separate operations. Surgical sessions were performed under sterile conditions; anesthesia was maintained by artificial respiration (0.5% isoflurane and N2O), and additional pentobarbital and ketamine were administered intravenously. In the first operation, a thin golden eye ring was implanted underneath the conjunctiva to allow for precise eye-movement recordings (see Setup). In the second operation, a stainless-steel recording chamber was placed over a trepanned hole in the skull (12 mm diameter). Four stainless-steel bolts, embedded in dental cement, allowed firm and painless fixation of the head during recording sessions (for details, see Frens and Van Opstal, 1998). The position and orientation of the recording chamber were such that the IC and SC on both the left and right side could be reached by microelectrodes. Special care was taken to prevent obstruction of the monkey's head and ears by the recording equipment and head mount when positioned in the experimental setup.
In each experiment, a glass-coated tungsten microelectrode (0.5-2.5 MΩ) was carefully positioned and lowered into the brain through a short stainless-steel guide tube by a hydraulic stepping motor (Trent Wells). The analog electrode signal was amplified (A-1; BAK Electronics, Germantown, MD), low-pass filtered (15 kHz cutoff), and monitored on an oscilloscope. To detect action potentials, the signal was fed through a level detector that fed into a four-bit counter. Each spike caused an increase in the DC output of the counter. This DC signal (16 different levels) was subsequently digitized (1 kHz sampling rate) and stored on hard disk for off-line analysis. In this way, the system could unambiguously detect up to 16 spikes/msec. A real-time principal component analyzer was used to visually verify whether triggered signals were obtained from single neurons (Epping and Eggermont, 1987).
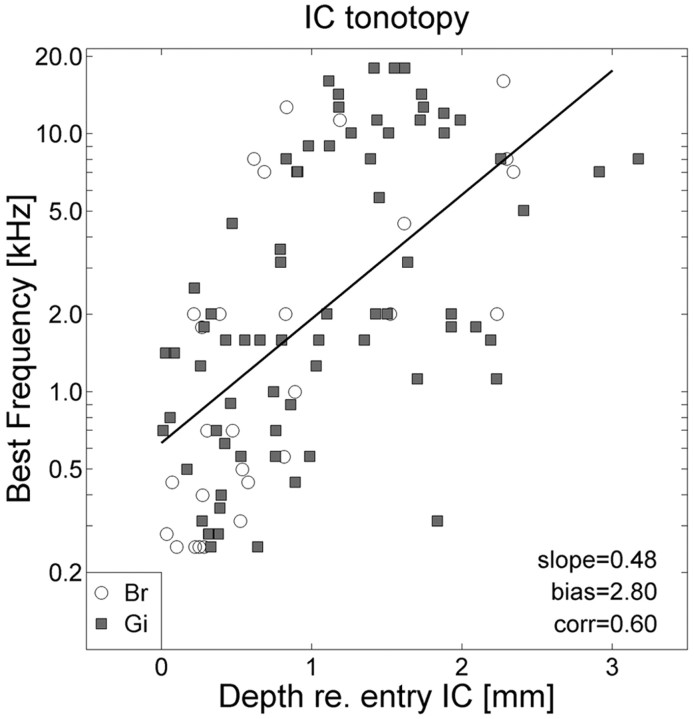
The first entry in the IC could be readily assessed by the sudden responsiveness of the local field potential to soft scratching on the door of the laboratory room. The following considerations confirm that our recordings were obtained from the IC. (1) Histology of both monkeys confirmed that the electrode tracks passed through the central nucleus of the IC. (2) The stereotaxic coordinates of the recording sites corresponded closely to the coordinates of the IC as given by the neuroanatomical atlas of Snider and Lee (1961). (3) Often, saccade-related neural activity that was indicative of the deep layers of the SC was encountered before entering the auditory nucleus. These SC recording sites corresponded to the well known topography of the oculomotor and overlying visual maps, and saccadic eye movements could be evoked by microstimulation (at thresholds below 50 μA) that corresponded well to the local optimal saccade vectors in the motor map (Robinson, 1972). (4) When lowering the electrode from dorsal to ventral locations, the best frequency (BF) for evoking auditory responses increased in an orderly manner (up to 20 kHz), over a depth range of ∼3 mm (for details, see Fig. 2). Such tonotopic ordering with depth has been reported earlier (Ryan and Miller, 1978). (5) Latencies of auditory responses were 10-20 msec, which is also in line with the study by Ryan and Miller (1978).
Figure 2.
The BF of IC neurons increases systematically with recording depth (measured with respect to first entry in the IC). White circles, Monkey Br; gray squares, monkey Gi. Solid line, Best-fit regression of log(BF) against depth (in millimeters) for the pooled data of both monkeys (n = 105). Slope, 0.48/mm; bias, 2.80, which corresponds to 630 Hz; correlation, r = 0.60.
Setup
The head-restrained monkey sat in a primate chair in a completely dark and sound-attenuated room (3 × 3 × 3 m3) in which the ambient background noise level was ∼30 dB sound pressure level (SPL) (A-weighted). Acoustic foam on the walls, floor, ceiling, and every large object present effectively absorbed reflections above 500 Hz. A broadband lightweight speaker [Philips AD-44725; flat characteristic within 5 dB between 0.2 and 20 kHz, after equalization by a Ultra-Curve equalizer (Behringer International GmbH, Willich, Germany)] produced the acoustic stimuli. The sound signals were generated digitally at a 50 kHz sampling rate (DA board, DT2821; National Instruments, Austin, TX) and tapered with sine-squared onset and offset ramps of 5 msec duration. The signal was amplified (model A-331; Luxman, Torrance, CA) and bandpass filtered between 200 Hz and 20 kHz (model 3343; Krohn-Hite, Brockton, MA) before being fed to the speaker. The sound intensity was measured at the position of the monkey's head with a calibrated sound amplifier and microphone (BK2610/BK4144; Brüel and Kjær, Norcross, GA).
The speaker was mounted on a two-link robot, which consisted of a base with two nested L-shaped arms that were driven by separate stepping engines (model VRDM5; Berger Lahr, Lahr, Germany), both controlled by a personal computer 80486 (for details, see Hofman and Van Opstal, 1998). This setup enabled rapid (within 2 sec) and accurate (within 0.5°) positioning of the speaker at any location on a virtual sphere around the monkey's head (90 cm radius).
Visual stimuli were presented by an array of 72 red LEDs that were mounted on a thin, acoustically transparent, spherical wire frame at polar coordinates R ∈ [0°, 2°, 5°, 9°, 14°, 20°, 27°] and φ ∈ [0°, 30°, 60°,..., 330°], in which the eccentricity R is the angle with the straight-ahead direction, and φ is the angle with the rightward orientation. The distance of the LEDs to the center of the monkey's head was 85 cm, i.e., just inside the virtual sphere of the auditory targets.
The 2D orientation of the eye in space was measured with the double-magnetic induction technique, which has been described in detail in previous papers from our group (Bour et al., 1984; Frens and Van Opstal, 1998). In short, two orthogonal pairs of coils, attached to the edges of the room, generated two oscillating magnetic fields (30 kHz horizontally and 40 kHz vertically) that were nearly homogeneous and orthogonal in the area of measurement. The magnetic fields induced oscillating currents in the implanted eye ring, which in turn induced secondary voltages in a sensitive pickup coil that was placed directly in front of the monkey's eye. The signal from the pickup coil was demodulated by two lock-in amplifiers (model 128A; Princeton Applied Research, Oak Ridge, TN), tuned to either field frequency, low-pass filtered (150 Hz cutoff), sampled at a rate of 500 Hz per channel (DAS16; Metrabyte), and finally stored on hard disk for additional analysis.
All target and response coordinates are expressed as azimuth (α) and elevation (ϵ) angles, determined by a double-pole coordinate system in which the origin coincides with the center of the head. In this reference frame, target azimuth, αT, is defined as the angle between the target and the midsagittal plane. Target elevation, ϵT, is the angle between the target and the horizontal plane through the ears with the head in a straight-ahead orientation (Knudsen and Konishi, 1979; Hofman and Van Opstal, 1998).
Experimental paradigms
Recording of frequency tuning curves. The frequency tuning curve of a neuron was determined by measuring the response to tone pips of 39 frequencies, varying from 250 to 20,159 Hz in ⅙-octave intervals. Each trial consisted of three identical tone pips of 200 msec duration, which were presented at three different intensities (40, 50, and 60 dB SPL) from the straight-ahead location, separated by a 500 msec interval. The tone pips were played in two different sequences, i.e., from low to high and from high to low intensity. Trials were presented in random order. In this study, the tuning curve of the neuron was determined by averaging, for each frequency, the activity across the six tone presentations. The BF of the neuron [log(BF)] was taken at the maximum of the frequency tuning curve. Its (excitatory) bandwidth was estimated between frequencies at which the mean firing rate exceeded the background plus twice its SD.
Recording of rate-level curves. For 68 neurons of monkey Br, the tuning to absolute sound level over a large intensity range in the free field was determined. To that end, the speaker was kept at the straight-ahead location, while broadband noise stimuli [Gaussian white noise (GWN); 500 msec] were presented at stimulus levels between 10 and 60 dB SPL, in 5 dB steps. Each level was repeated twice, and stimuli were presented in randomized order.
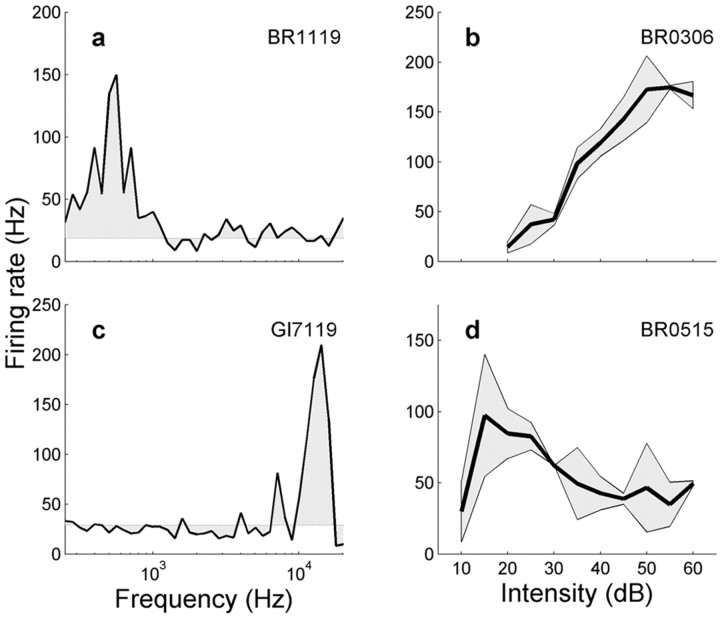
Figure 1 shows representative examples of two spectral tuning curves and two rate-level functions for four different IC neurons. Figure 1a shows a low-frequency neuron, whereas the neuron in Figure 1c preferred a much higher frequency. A monotonically increasing rate-level curve, such as obtained for the majority (70%) of cells, is shown in Figure 1b. However, some neurons were most sensitive to a particular intensity, like the example shown in Figure 1d.
Figure 1.
Acoustic tuning properties of four monkey IC neurons. Left, Representative band-limited frequency tuning curves for a low-frequency (0.2-1.2 kHz) (a) and a high-frequency (8-16 kHz) (c) neuron. Response curves were averaged over three intensities (40, 50, and 60 dB) and two presentation sequences (increasing-decreasing level). Right, Monotonic (b) and non-monotonic (d) intensity tuning curves of two IC neurons. The monotonic characteristic shown in b was typical for 70% of the neurons.
Figure 2 provides a summary of the results of the frequency tuning of the entire population of recorded neurons in both monkeys (monkey Br, n = 28; monkey Gi, n = 77). The data show that log(BF) increased systematically with recording depth (r = 0.60), which is in line with a dorsoventral tonotopy reported previously by Ryan and Miller (1978, monkey) and Poon et al. (1990, bat).
The excitatory bandwidth of the frequency tuning curve was typically band limited: it varied between 0.3 and 1.0 octaves for 39% of the neurons and ranged between 1.0 and 4.0 octaves for 44% (for examples, see Figs. 1, 4, 8). Broadband characteristics, which exceeded four octaves, were obtained for the remaining 17% (for an example, see Fig. 3). Bandwidth tended to increase along the mediolateral coordinate (r = +0.36; p < 0.05) but was related to neither the anteroposterior (AP) coordinate (r = -0.07; NS) nor recording depth (r = -0.10; NS).
Figure 4.
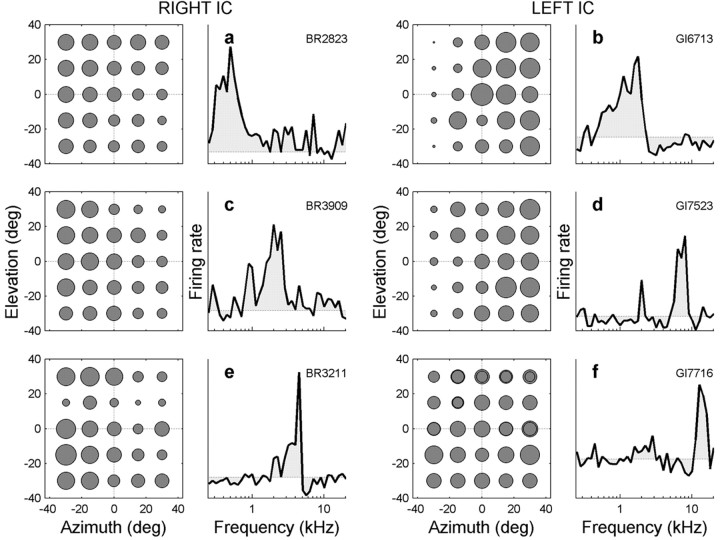
Six examples of neurons with low-frequency (a, b), middle-frequency (c), and high-frequency (d-f) spectral tuning curves that are sensitive to sound location with respect to head (ANOVA). Data are plotted in the same format as Figure 3f. The neurons in a and e are sensitive to both sound azimuth and elevation. The neuron in a appears to have a monotonic dependence on azimuth and elevation (i.e., 2D gain field; see also Fig. 5a-c), and the neuron in e has a non-monotonic sensitivity to elevation. The neuron in f has a monotonic sensitivity to elevation (p < 0.05) but not to azimuth (p > 0.05).
Figure 8.
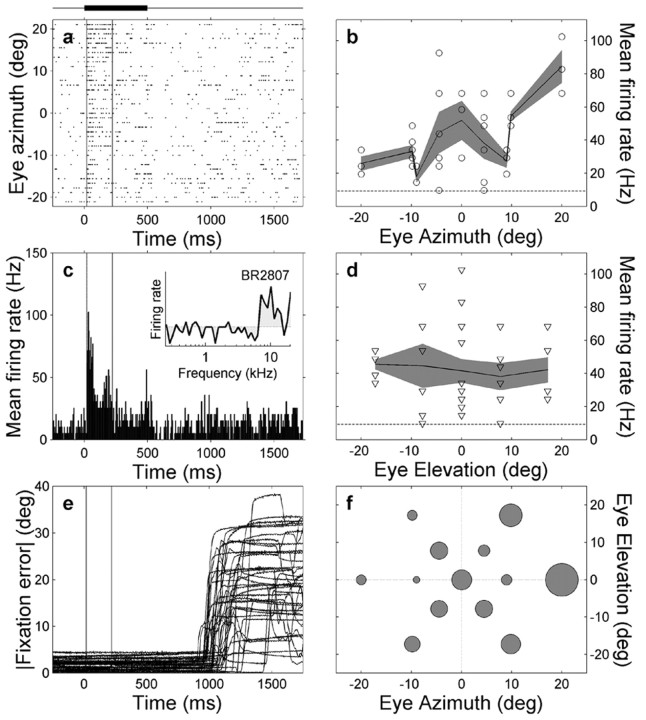
Recording of neuron br2807 that is sensitive to eye position. a, Spike rasters, sorted off-line as function of eye azimuth. Vertical lines denote onset and offset of the analysis window. Note the high excitation levels for rightward eye fixations (top) and the brief post-stimulus inhibition after time 500 msec. c, PSTH and spectral tuning curve (inset) of the neuron. b, The mean firing rate of this neuron, computed within the window, increases with eye azimuth but does not vary with eye elevation (d). Dashed lines in b and d indicate mean background activity. e, Absolute eye-fixation error was small during stimulus presentation. Approximately 1 sec after stimulus on set, the monkey was rewarded, after which it made a saccadic eye movement back to the center of the oculomotor range. f, Mean firing rate (proportional to radius of filled disk; averaged over three trials) as function of 2D eye position. Note the clear trend for rightward eye positions.
Figure 3.
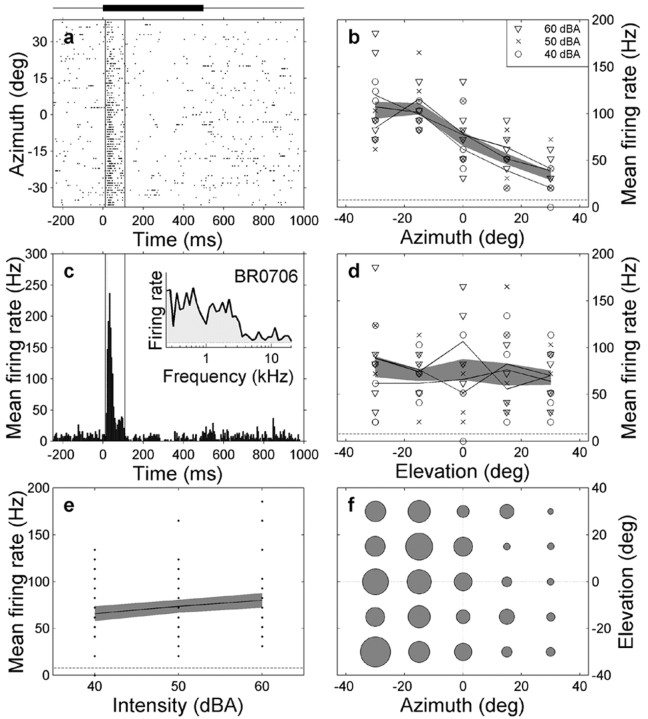
Illustration of response properties of IC neuron br0706 that is sensitive to sound azimuth but not to sound level. a, Spike raster is shown as function of time with respect to stimulus onset, in which each horizontal line corresponds to a single trial. Trials have been sorted off-line as function of azimuth. Thick line indicates stimulus presentation time (0-500 msec). Vertical lines denote the burst onset-offset time window within which spikes were counted (see Materials and Methods). Note systematic dependence of burst activity on sound azimuth. b, Mean firing rate (computed within the window) for three different sound levels (symbols) as function of sound-source azimuth. Note clear modulation of the activity of the cell with azimuth. Shaded band indicates mean ± 1 SD. Horizontal dashed line indicates mean spontaneous activity. c, PSTH indicates a clear onset peak (latency, 15 msec with respect to stimulus onset). Neuron is briefly inhibited after the onset peak. The neuron has a relatively broadband spectral tuning characteristic (up to ∼ 3 kHz; inset). d, Mean firing rate as function of sound elevation. Same format as in b. e, Mean firing rate as function of free-field sound level; data pooled across azimuths and elevations. f, Spatial tuning of the cell. Radius of filled circles is proportional to mean firing rate, averaged across sound levels within the particular azimuth-elevation bin.
Sensitivity to sound position. In a series of 75 trials, the auditory responses of single neurons in the IC were recorded as a function of sound location. Trials started with the presentation of a straight-ahead fixation light that was followed by the presentation of a 500 msec duration GWN (frozen noise) burst at an eccentric position. During target presentation, the monkey was required to maintain fixation on a central LED. In each trial, the broadband auditory target was presented at an intensity of 40, 50, or 60 dB SPL. The location of the auditory target was chosen from αT ∈ [-30°, -15°, 0°, 15°, 30°] and ϵT ∈ [-30°, -15°, 0°, 15°, 30°]. Each of the 25 locations and three sound levels was selected in pseudorandom order. Trials in which the monkey was not accurately fixating the visual target (error larger than 4°) before (500 msec) and during the presentation of the sound were aborted and repeated in the same experiment.
Sensitivity to eye position. The auditory response of an IC neuron as function of eye position was recorded in an additional series of 39 trials. This paradigm was similar to the “sound position sensitivity” paradigm, except that the positions of the visual and auditory targets were reversed. Now the GWN bursts (three different realizations of 500 msec frozen noise) were presented at the central position; the task of the monkey was to fixate an eccentric visual target (LED). The visual target was chosen out of 13 locations, from R ∈ [0°, 9°, 20°] and φ ∈ [0°, 60°, 120°, 180°, 240°, 300°]. The noise bursts were presented at a fixed intensity of 60 dB SPL. Each LED location and noise burst was presented in randomly interleaved order.
Data analysis
Calibration of eye position. All measured eye-position signals were calibrated on the basis of a series of eye fixations made to the 72 LEDs at the start of an experimental day (see above). The mapping of raw (sampled) eye-position signals onto the corresponding azimuth-elevation coordinates of the LEDs was achieved by training two three-layer neural networks for the horizontal and vertical eye-position components (for details, see Hofman and Van Opstal, 1998). The neural networks accounted for the static nonlinearity inherent in the double-magnetic induction method, small nonhomogeneities in the magnetic fields, and minor crosstalk between the signals of the horizontal and vertical magnetic fields.
The trained networks were used to map the raw eye-position signals onto actual 2D eye orientations, [αE, ϵE], in space. The absolute accuracy of the calibration was within 3% over the entire response range.
Response parameters. We computed the average firing rate of a neuron as function of time by binning the spike events in 5 msec time bins and averaging across trials. From the resulting peristimulus time histogram (PSTH), we determined the spontaneous firing rate from the grand average of activity in the 200 msec window preceding stimulus onset. The average response latency was approximated by the first time after stimulus onset that the PSTH exceeded the spontaneous activity by twice its SD. The cell response in each trial was quantified by the mean firing rate within a time window between response onset and offset. Response onset and offset were determined by the moment at which the spike density function of the cell first exceeded and then again fell below its spontaneous level plus twice the SD. Because of the variety of temporal response patterns observed in IC cells (onset-only responses, phasic-tonic responses, tonic responses, etc.), this procedure ensured an objective capture of the cell response for all response patterns (for examples, see Figs. 3, 8).
Statistics. The probability that neurons were sensitive to sound or eye position was first assessed with a two-way ANOVA. The azimuth and elevation components of sound or eye position were then taken as the independent variables and the cell response as the dependent variable. Given a large population of neurons, the expected number of neurons that will be erroneously classified as “sensitive” depends on the chosen significance level. To estimate this number of “false positives,” we adopted the following procedure. First, we bootstrapped the data by creating 100 data sets of neuronal responses for the 94 neurons from the original data by randomly scrambling the cell responses. In this way, the absence of any potential tuning in the scrambled data was ensured. On each scrambled data set of 94 neurons, the number of positive ANOVA scores was then determined. We computed from the 100 different sets the mean and variance of the number of false-positive ANOVA scores. Finally, we applied the t statistic to determine the significance of the difference between the mean of false positives and the experimentally observed number of positive scores (Press et al., 1992).
To further quantify a systematic trend in the sensitivity of IC neurons to 2D sound location and sound level, or to 2D eye position, we next performed a multiple linear regression analysis (see Results, Eqs. 1, 2). Best-fit parameters were obtained by minimizing the mean squared error between actual and predicted firing rates. The number of false positives and the significance levels of the fit parameters were calculated by bootstrapping the data.
Results
The spatial sensitivity experiments described in this paper involve single-unit recordings from 94 neurons. We collected data from both ICs in monkey Gi (57 recordings) and from the right IC in monkey Br (37 recordings). For 70 neurons, we performed the eye-position test (Gi, n = 35; Br, n = 35). For 48 of these neurons, both paradigms were run. A preliminary account of the spectral-temporal receptive field characteristics of the IC cells is described in recent conference proceedings (Versnel et al., 2002).
Sensitivity to 2D sound position
Figure 3 shows different features of a typical cell response in the right IC of monkey Br. The clustering of spikes (Fig. 3a) and the single peak in the PSTH (Fig. 3c) shortly after stimulus onset (15 msec latency; leftmost vertical line) shows that the cell responded with a phasic burst of action potentials to the auditory stimulus (horizontal bar). The broad spectral tuning curve of this neuron (Fig. 3c, inset) indicates that this cell was sensitive to frequencies up to ∼3 kHz.
The right column of Figure 3 shows that sound azimuth (Fig. 3b,f), but not sound elevation (Fig. 3d,f), systematically modulated the response of the cell. These qualitative observations were supported by a two-way ANOVA (azimuth sensitivity, p < 0.001; elevation, p > 0.1) (see Materials and Methods). Furthermore, the neuron was insensitive to variations in absolute sound level (Fig. 3e).
To further document these findings, Figure 4 presents the spatial and frequency tuning characteristics of six other IC neurons that were analyzed in this way. Neurons were selected on the basis of their frequency tuning curves: low BF (Fig. 4a,b), midrange BF (Fig. 4c), and high-frequency range (Fig. 4d-f). According to the two-way ANOVA, four of the neurons (Fig. 4a-d) were sensitive to azimuth (p < 0.05) but not to elevation (p > 0.05). The response strength of the neuron shown in Figure 4e, on the other hand, appears to be significantly related to sound azimuth (p < 0.05) but also displays a sharp decrease in activity for sounds at approximately +15° elevation (p < 0.05), regardless of azimuth. The position (∼5 kHz) and sharpness of the single peak in the frequency tuning curve suggests that this sensitivity to elevation could be related to the presence of an elevation-dependent spectral notch in the monkey's pinna filter (Spezio et al., 2000). The high-frequency neuron shown in Figure 4f was found to be sensitive to elevation only (p < 0.05).
The ANOVA results for all 94 neurons (summarized in Table 1) indicate that the vast majority (n = 73; 78%) was sensitive (p < 0.05) to sound position and, in particular, to sound-source azimuth (n = 68; 72%). The frequency tuning curves of the elevation-sensitive cells (n = 17; 18%) typically featured a best frequency above 2 kHz, along with bandwidths ranging from limited (<4 octaves) to broad (>4 octaves). Half of these neurons (n = 8) were sensitive to a particular elevation angle, like the example in Figure 4e. Furthermore, a minority of neurons (n = 6; 6%) showed an interaction between azimuth and elevation (i.e., they were particularly sensitive to one or more 2D sound positions). The number of cells that were spatially sensitive was much larger than the number of expected false positives (Table 1) (see Materials and Methods).
Table 1.
Number of neurons that were sensitive to sound azimuth (αT) and elevation (ϵT) when tested with a two-way ANOVA
|
|
ϵT |
∼ϵT |
Total |
|---|---|---|---|
| αT | 12 (0) | 56 (2) | 68 |
| ∼αT | 5 (2) | 21 (90) | 26 |
| Total |
17 |
77 |
94 |
Negative results are indicated by the ∼ sign. The computed expectation value is given in parentheses (see Materials and Methods).
Systematic sensitivity to 2D sound position and sound level
The ANOVA does not specify whether sensitivity to target azimuth is attributable to binaural difference cues, to absolute sound level (including the possibility of a monaural head-shadow effect), or to a combination of these factors. To dissociate these variables, we adopted a linear regression model with sound level, sound-source azimuth, and elevation as the independent variables. We based this simple model on the observations that, within the measurement range of azimuths (±30°) and intensities (40-60 dB SPL), (1) typical responses to sound-source azimuth were monotonic for contralateral azimuths (Figs. 3, 4) (Groh et al., 2003), (2) the activity of the majority of cells (∼70%) tested in the sound-level paradigm (see Materials and Methods) depended monotonically on absolute sound intensity (Fig. 1b), and (3) some neurons had a monotonic sensitivity to changes in sound-source elevation, too. Qualitative examples of such tuning are shown in Figure 4, a and f. The following equation was used to fit the neuronal responses:
 |
1 |
where R̄ is the mean firing rate of the cell within the selected time window as function of sound level in the free field (I0), sound-source azimuth (αT, taken positive for ipsilateral locations), and elevation (ϵT). Parameters a (in spikes per second per decibel), b, c (in spikes per second per degree) and bias, d (in spikes per second) were found by minimizing the mean squared error between data and fit.
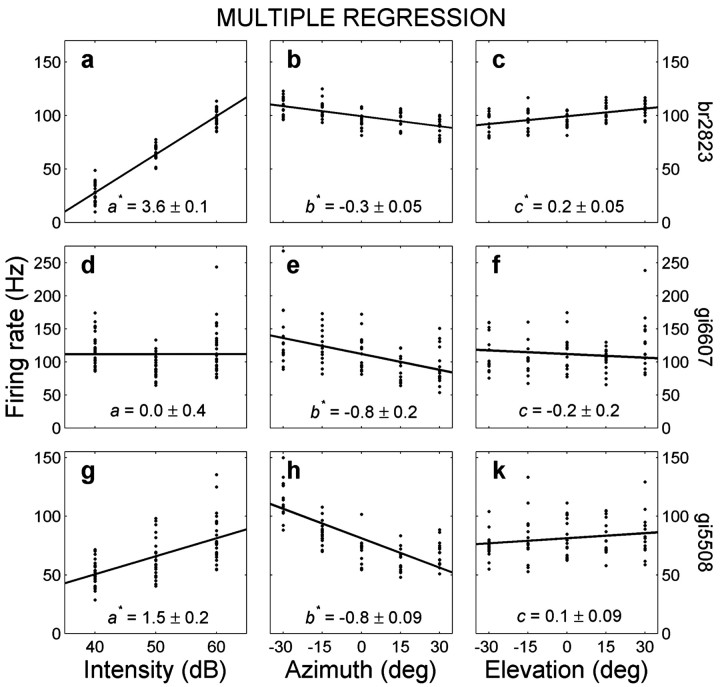
Figure 5 shows three typical examples of this analysis. The top row shows a cell for which the responses are particularly modulated by sound intensity and, to a lesser extent, by sound-source azimuth and elevation (Fig. 5a-c; same cell as in Fig. 4a). Note that the apparent strong azimuth dependence of this neuron, as suggested by Figure 4a, was mainly attributable to a much stronger sensitivity to sound level. The middle row shows a neuron that is only responsive to contralateral sound azimuth (Fig. 5d-f), and the bottom row depicts a cell that responded to both sound level and azimuth but not to elevation (Fig. 5g-k). The high correlation coefficients between data and model indicate that Equation 1 provided a reasonable description of the data.
Figure 5.
Result of the multiple linear regression analysis (Eq. 1) to dissociate the systematic sensitivity of a cell to perceived sound level (left column), sound-source azimuth (middle column), and sound elevation (right column) for three different neurons. The top neuron (br2823; a-c) is sensitive to all three parameters (see also Fig. 4a). The center neuron (gi6607; d-f) is sensitive to contralateral sound azimuth (b < 0) but not in a monotonic way to intensity or elevation. The bottom neuron (gi3918; g-k) is sensitive to both contralateral azimuth (b < 0) and sound intensity but not to elevation. Correlation coefficients between data and model are 0.96, 0.52, and 0.65, respectively. Numbers at bottom indicate mean ± SD. *p < 0.05 indicates a regression parameter that differs significantly from zero. Data for each variable are plotted against mean firing rate, after subtracting the weighted contributions from the other two variables.
A summary of the regression results for the entire population of 94 cells is given in Table 2. In line with the ANOVA (Table 1), the majority of neurons were found to be sensitive to sound position (p < 0.05; n = 71; 77%) and, in particular, to the azimuth coordinate (n = 67; 70%). For 19 of the neurons (20%), a significant monotonic response relationship with sound-source elevation was obtained. For 15 of these neurons, the firing rate was modulated in a monotonic way by both azimuth and elevation (i.e., both b, c ≠ 0) (for examples, see Figs. 4a, 5a-c). In the visuomotor literature, a similar type of 2D spatial sensitivity has been termed a “spatial gain field” (Zipser and Andersen, 1988) (see Discussion). We therefore denote the head-centered spatial tuning of these 15 IC neurons by 2D spatial gain fields. Because the groups of cells with a significant ANOVA score for elevation (n = 17) and a significant regression parameter for elevation do not fully overlap, the actual number of cells sensitive in one way or another to sound elevation was 27 of 94 (29%).
Table 2.
Number of neurons that were sensitive to sound intensity (I0), sound azimuth (αT), and elevation (ϵT) when tested with the multiple linear regression model of Equation 1
|
|
ϵT |
∼ϵT |
I0 |
∼I0 |
Total |
|---|---|---|---|---|---|
| αT | 15 (0) | 52 (5) | 45 (0) | 22 (5) | 67 |
| ∼αT | 4 (5) | 23 (86) | 17 (5) | 10 (88) | 27 |
| Total |
19 |
75 |
62 |
32 |
94 |
Same conventions as in Table 1.
The regression results show that most neurons were also sensitive to sound intensity (n = 62; 66%). Note that, from the results in Table 2, the responses of 17 (18%) of the cells varied with sound intensity but not with azimuth. Applying regression on all cell responses without sound level as a fit parameter resulted in an azimuth sensitivity for 77 cells (data not shown). Of the 17 intensity-only sensitive cells, 10 neurons would thus be falsely classified as azimuth sensitive, when in fact their sensitivity was likely caused by the head-shadow effect (i.e., monaural sound level).
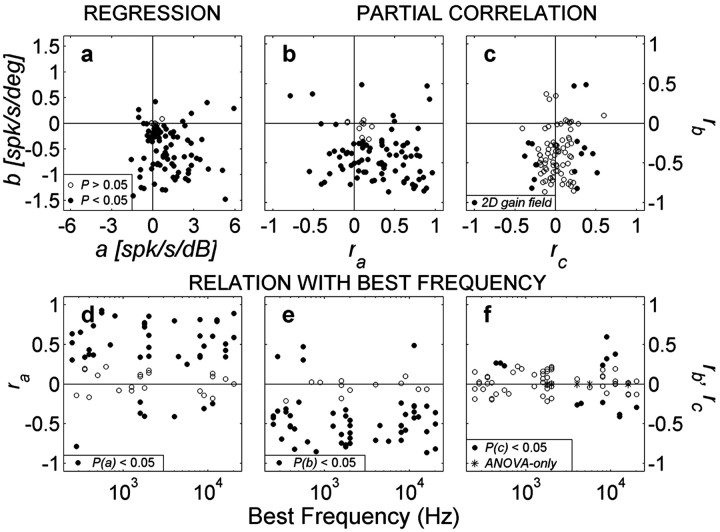
The positive values of the sound-level coefficient (a) in Equation 1 (Fig. 6a), together with its partial correlation coefficient, ra (Fig. 6b), indicate that most neurons (53 of 62) were excited most for the highest sound levels, regardless of the stimulus location. A small number of neurons were excited most for the lowest sound levels (a, ra< 0; n = 9 of 62), whereas the remaining 32 neurons did not yield significant regression coefficients for sound level. The latter is partly attributable to a non-monotonic sensitivity to sound level in some of these neurons (Fig. 1d; also apparent in Fig. 5d).
Figure 6.
a, Distribution of regression coefficients for perceived sound level and sound azimuth for all neurons (parameters a, b of Eq. 1; pooled for both monkeys). Filled circles indicate that either parameter a or b differed significantly from zero. b, Partial correlation coefficients rb versus ra. The majority of neurons are tuned to contralateral locations (rb < 0). Most neurons increase their activity with increasing sound level (ra > 0), although a significant group (n = 9) does the reverse. Note the wide range of intensity-azimuth coefficients covered by the population. c, Partial correlations for stimulus azimuth (rb) versus elevation (rc). Filled circles correspond to cells with 2D spatial gain fields (i.e., both b,c ≠ 0). d-f, Bottom panels show the distribution of the partial correlation parameters ra (left), rb (middle), and rc (right) as function of best frequency of each neuron for which a complete frequency tuning curve was obtained (n = 62). Filled circles correspond to significant parameter values. Note the absence of a trend.
The predominant negative values for the azimuth coefficient b and rb indicate that nearly all neurons (64 of 67) responded more vigorously for contralateral locations, regardless sound level. Only a few neurons (3 of 67) were best excited by ipsilateral azimuths (b > 0). The remaining population (27 of 94) was not significantly modulated by sound azimuth.
The relative strength of the parameters for sound azimuth and level varied widely from neuron to neuron, as indicated by the broad distribution of partial correlation coefficients, but were approximately equal in size across the population (Fig. 6b). Figure 6c shows the distribution of parameters b and c for cells with a significant 2D spatial gain field (filled symbols; n = 15). As documented in Figure 6d-f, none of the regression parameters depended in a systematic way on the BF of a cell. The majority of cells with elevation sensitivity had a high BF (Fig. 6f).
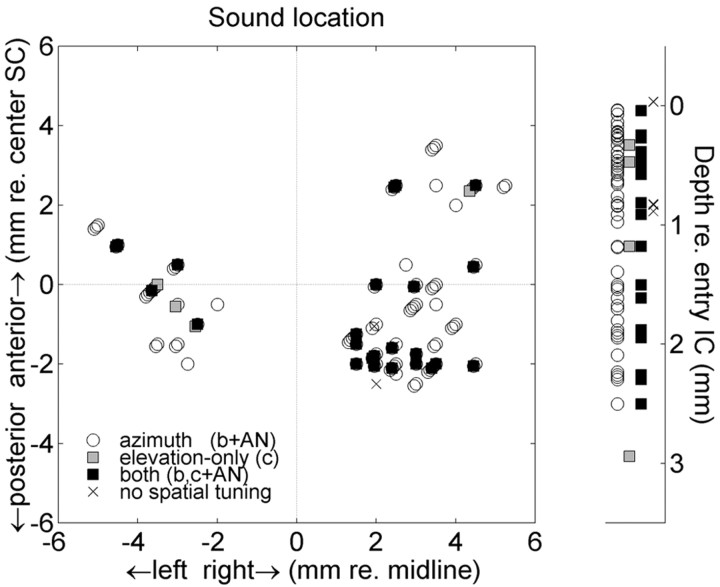
Figure 7 provides a summary of the locations within the IC and the encountered spatial response properties of the cells. Neurons with a significant spatial tuning (Eq. 1 and two-way ANOVA results pooled) were scattered across the IC recording sites, both in the dorsoventral (Fig. 7, right side) and in the mediolateral and anteroposterior stereotaxic coordinates. In this plot, AP = 0mm was aligned with the center of the overlying superior colliculus motor maps for both monkeys. At this SC site, microstimulation at 50 μA or less yielded horizontal saccadic eye movements into the contralateral hemifield with an amplitude of ∼10-15°. We obtained no obvious topography or clustering of cells with spatial sensitivity. Tuning parameters b and c of Eq. 1 did not correlate with either anteroposterior or mediolateral recording sites or with depth (p > 0.05; data not shown). However, cells without a significant spatial tuning (×) were predominantly encountered at dorsal (i.e., low BF) recording sites.
Figure 7.
Distribution of head-centered spatial tuning characteristics of IC cells across the recording sites along lateromedial and anteroposterior coordinates (left) and along the dorsoventral (right) coordinate. Results from multiple regression (spatial parameters b, c) and ANOVA (AN) are pooled. White circles, Azimuth sensitivity; gray squares, elevation-only neurons; black squares, cells with both azimuth and elevation tuning. To enable a comparison between both monkeys, anteroposterior coordinates are given relative to the center of the overlying motor SC. Depth is measured with respect to the first entry in the IC. Spatial sensitivity is found through out the recording sites. Cells without spatial tuning (× symbols) were encountered at dorsal recording sites only.
Sensitivity to 2D eye position
Figure 8 shows the different response features of an IC neuron of monkey Br when it fixated visual targets at different locations during the presentation of a broadband sound at the straight-ahead location. The small fixation errors (<4°) (Fig. 8e) confirm that the monkey performed well in the visual fixation task for all target locations.
The cell generated a clear burst of action potentials during the presentation of sound stimuli (Fig. 8a,c; for frequency tuning curve, see inset in c). Interestingly, eye azimuth significantly modulated the strength of the auditory response, both when tested with a two-way ANOVA (p < 0.05) and by multiple linear regression (see below). The eye-azimuth sensitivity is clearly visible in the sorted spike trains (Fig. 8a), as well as in the computed mean firing rates as function of eye azimuth (Fig. 8b).
It is important to note that the modulation of the activity of the cell only appeared during the presentation of the auditory stimulus, because the spontaneous firing rates neither before nor after the sound stimulus differed for the different eye positions.
The saccadic eye movements back toward the central fixation position at the end of the trial (Fig. 8e, at approximately time 1000 msec) did not modulate the spontaneous activity of the cell either (compare with Fig. 8a).
However, when testing all 70 neurons with a two-way ANOVA, the number of cells displaying a significant sensitivity to eye position (n = 8) resulted to be similar to the number of expected false positives (summarized in Table 3). Thus, on the basis of ANOVA, there was no indication for a signal about eye position in the population of IC cells.
Table 3.
Number of neurons that were sensitive to eye azimuth (αE) and elevation (ϵE) when tested with a two-way ANOVA
|
|
ϵE |
∼ϵE |
Total |
|---|---|---|---|
| αE | 0 (0) | 4 (3) | 4 |
| ∼αE | 4 (3) | 62 (65) | 66 |
| Total |
4 |
66 |
70 |
The number of sensitive neurons (n = 8) does not exceed chance. Same conventions as in Table 1.
To test for the possibility that the IC neurons were sensitive to eye position in a more systematic way, we next quantified the responses by multiple linear regression:
 |
2 |
with R̄ is the mean cell response as function of the horizontal (Eh) and vertical (Ev) eye-position components, i.e., straight ahead. According to this analysis (Table 4), a significant modulation of the auditory response with 2D eye position was found in 20 of 70 (29%) neurons, which significantly exceeds the expected number of false positives (n = 8) (Table 4).
Table 4.
Number of neurons that are sensitive to eye azimuth (αE) and elevation (ϵE) when tested with the multiple linear regression model of Equation 2
|
|
ϵE |
∼ϵE |
Total |
|---|---|---|---|
| αE | 3 (0) | 8 (4) | 11 |
| ∼αE | 6 (3) | 53 (64) | 59 |
| Total |
9 |
61 |
70 |
The number of significant regression coefficients is well above chance. Same conventions as in Table 1.
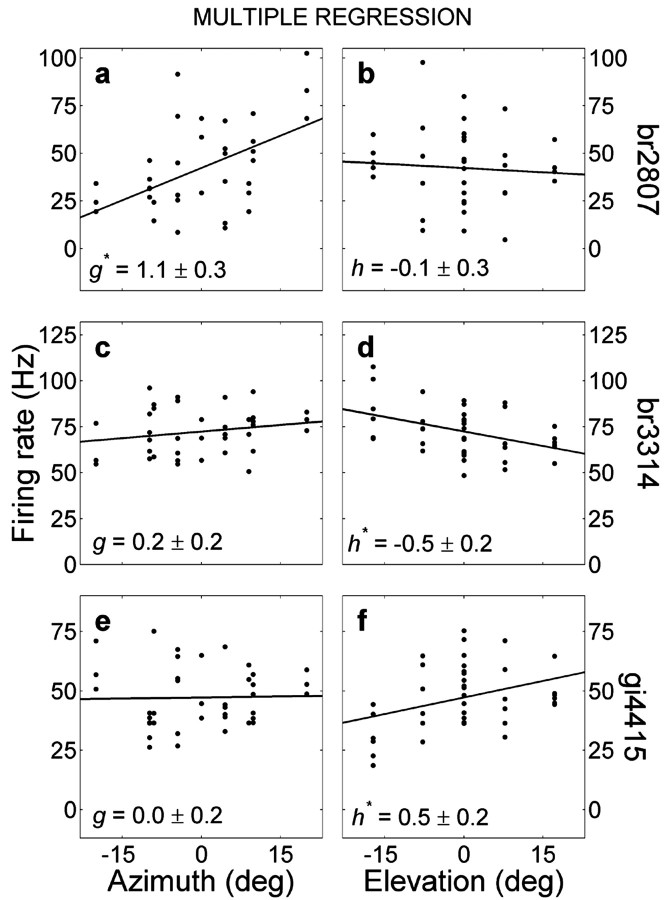
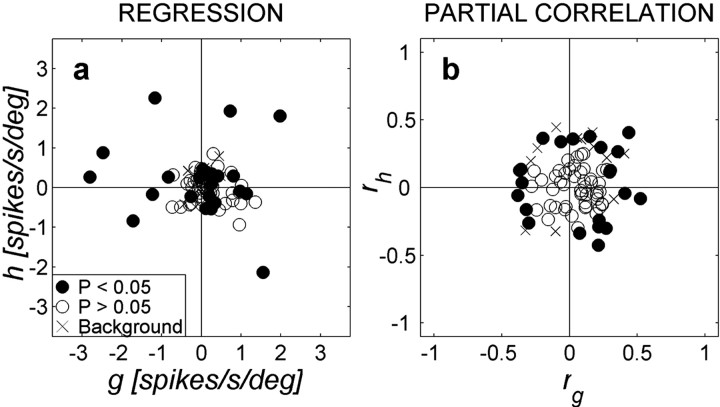
As illustrated by the three examples in Figure 9, the modulation by eye position was typically modest in size and noisy by nature. The distribution of regression parameters and partial correlation coefficients for the total cell population (Fig. 10, circles) shows that these values scatter around zero and that the axes of maximal modulation are not aligned with a preferred direction.
Figure 9.
Results of multiple linear regression (Eq. 2) on eye azimuth (left; parameter g) and eye elevation (right; parameter h) for three different neurons (neuron in a and b is the same as in Fig. 8). * denotes a significant parameter value.
Figure 10.
Distribution of eye-position regression coefficients, shown for all 70 neurons. Filled symbols denote significant values for g and h (Eq. 2). Note that the partial correlation coefficients (b) are typically smaller than those obtained for sound location and sound level (compare with Fig. 6b). The coefficients are also unbiased for the optimal directions of the fitted eye-position vectors. × symbols correspond to cells with significant values of fitting Eq. 2 to the background activity. None of these cells coincide with the ones displaying significant eye-position modulations.
To evaluate whether the activity of IC neurons was also modulated by eye position in the absence of auditory stimuli, we subjected the background activity of the cell to the same multiple regression analysis. We aligned the analysis window with the 250 msec preceding the sound, because, in this interval, the monkey already fixated the peripheral visual target. The results (Fig. 10, × symbols) did not differ significantly from chance, indicating that eye position does not drive IC neurons by itself. Indeed, none of the cells with a significant modulation of eye position during the presentation of the auditory stimulus (Fig. 10, filled circles) modulated their background activity, too.
Finally, performing linear regression on R̄ as function of the polar coordinates of eye position (eccentricity, R, and direction, φ), did not yield a significant number of tuned neurons (data not shown). This indicates that the weak eye-position modulation is better described in the azimuth-elevation coordinates of Equation 2.
Comparison of sound versus eye-position tuning
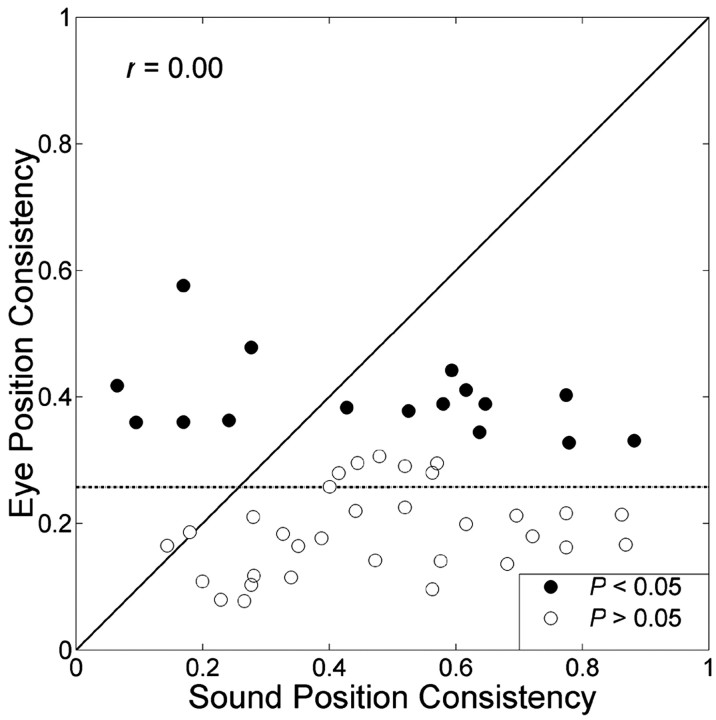
The extent to which an IC neuron is responsive to either sound position or eye position is indicative for the reference frame in which the target is represented (Groh et al., 2001). We assessed this responsiveness by evaluating, for each cell, its spatial consistency (i.e., the summed square of the respective partial correlation coefficients, rb2 + rc2 and rg2 + rh2). This consistency is a measure of how much spatial information a cell contains.
Figure 11 compares the spatial consistencies of sound versus eye position for the neurons that were tested in both paradigms (n = 48). On average, the consistency was higher for head-centered sound position than for eye position because most points lie below the identity line. Linear regression on these data (dashed line) indicates that the sensitivities to sound position and eye position were not related (p > 0.05). Furthermore, the responsiveness (g, h) to eye position was also independent of the sensitivity to sound level, recording site, and BF (data not shown).
Figure 11.
Absence of a correlation between the responsiveness of a neuron to eye position and head-centered sound location, as shown here for the response consistencies to either variable (r = 0.00; dotted line indicates regression line). Black circles, Neurons with a significant modulation of eye position. White circles, Neurons without significant modulation of eye position. Head-centered sound location has a more consistent effect on cell activity than eye position, because most data points lie below the diagonal.
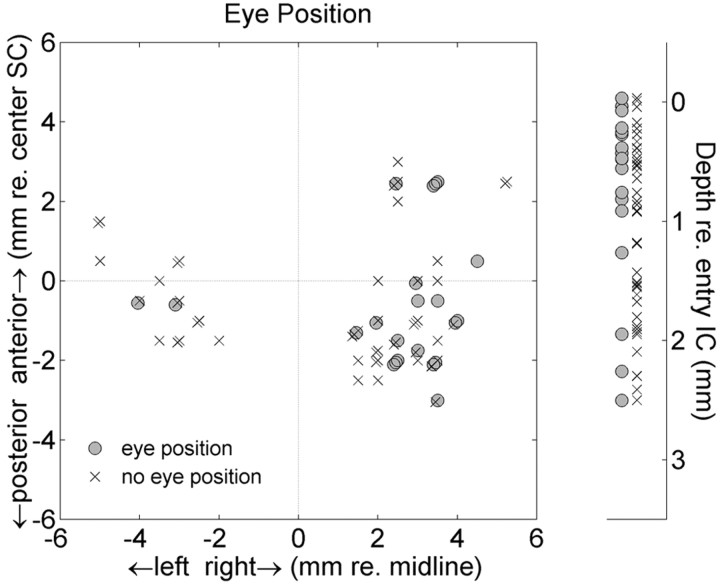
Figure 12 shows that the eye-position-sensitive cells were scattered throughout the recording sites within the IC. No obvious clustering was obtained in neither depth (i.e., consistent with the lack of correlation with BF) nor lateromedial or anteroposterior dimensions.
Figure 12.
Neurons with a significant modulation by eye position (gray circles) are widely distributed across the recording sites, without any obvious clustering. × symbols indicate cells without a significant eye-position modulation. Same format as Figure 7.
Discussion
General findings
This study shows that IC neurons are sensitive to absolute sound level, to sound-source azimuth and elevation, and, to a lesser extent, to the horizontal and vertical components of eye position. Cells differed in their responsiveness to these variables, but regression parameters were uncorrelated with each other. The tuning characteristics of the neurons to sound level, head-centered sound location, and eye position appeared to be distributed across the recording sites without any apparent clustering of parameter values (Figs. 7, 12). The tuning parameters were also uncorrelated with the BF of a cell (Fig. 6d-f).
Most neurons were tuned to a particular frequency band, and their BFs were systematically ordered, with an increase of BF from dorsal to ventral positions (Fig. 2). This tonotopic order, together with the short response latencies, indicates that most recordings were taken from the central nucleus (Ryan and Miller, 1978; Poon et al. 1990).
Sensitivity to 2D sound location
Within the 60° range of azimuths tested, none of the cells were tuned to a specific azimuth angle. This contrasts with reports from cat (Calford et al., 1986) and bat (Schlegel et al., 1988; Fuzessery et al., 1990). Instead, the firing rate of a cell typically increased in a monotonic way for contralateral azimuths (Figs. 3, 4, 5, 6). A similar finding was reported for the majority of neurons in cat IC (Delgutte et al., 1999). Recently, Groh et al. (2003) also described monotonic tuning for azimuths up to 90°.
Cells differed substantially in their sensitivity to azimuth position (Figs. 5, 6a), but, unlike in bats (Poon et al., 1990), we obtained no evidence for a spatial topography (Fig. 7). Levels used in this study (40-60 dB SPL) were well above threshold but remained well within the natural range for adequate sound-localization performance. We cannot exclude, however, that at near threshold intensities, spatial tuning might become narrower (Schlegel et al., 1988; Binns et al., 1992; Schnupp and King, 1997).
The relatively simple monotonic sensitivity to azimuth in the frontal hemifield contrasted with the more varied responsiveness of IC neurons to sound-source elevation. We observed two response characteristics. In 15 neurons, we obtained monotonic 2D spatial gain fields (Fig. 6c; Table 2). The elevation response characteristics of other neurons were non-monotonic. Such non-monotic tuning has also been described for cat IC (Delgutte et al., 1999). Note that a monotonic azimuth tuning and a non-monotonic elevation sensitivity could both be present in the same cell (Fig. 4e). These characteristics thus underscore the separate neural processes underlying the extraction of binaural-difference cues and the more intricate spectral-shape cues. Typically, neurons sensitive to elevation had a high BF (Figs. 4e,f,6f). This raises the interesting possibility that such cells responded to elevation-specific features in the HRTF.
The relative tuning strengths for target azimuth and absolute sound level were equally distributed across the population (Fig. 6b). Note that monotonic sensitivity to absolute sound level of band-limited IC cells would leave a neural representation of the HRTF-related spectral shape cues unaffected across the population. In this way, sensitivity to sound level might serve as a third mechanism by which the IC could encode elevation (see also below).
Similar findings for azimuth and elevation tuning have been reported for the primate auditory cortex (Recanzone et al., 2000). Our results extend these findings to monkey IC by including the role of sound intensity and eye position. Together, both studies suggest a progressive involvement of spatially sensitive neurons from IC to auditory cortex to the adjacent caudomedial field. Our findings thus add support to the hypothesis that this information stream may process auditory space in a serial manner (for review, see Recanzone, 2000).
Eye position
The response of a significant population of IC neurons was systematically modulated by 2D eye position (Figs. 8, 9, 10; Table 4). Compared with the effects of sound position, this sensitivity was relatively weak (Fig. 11). Best-fit planes define the optimal directions of 2D eye position-sensitivity vectors. These vectors were distributed homogeneously, without obvious clustering for either ipsilateral or contralateral eye positions or along cardinal (horizontal-vertical) directions (Fig. 10). These effects cannot be attributed to visual input because the visual stimulus was always on the fovea during sound stimulation.
Interestingly, eye position did not affect spontaneous activity of IC neurons, indicating that eye position modulates auditory-evoked activity in a multiplicative manner (“gain field”). Similar effects have been reported for visual, memory, and saccade-related activity in lateral intraparietal cortex (Andersen et al., 1990; Read and Siegel, 1997), in SC (Van Opstal et al., 1995), and for visual activity in primary visual cortex (Trotter and Celebrini, 1999). Such gain field modulations might express more general coding principles for neural populations that represent targets in multiple reference frames (Zipser and Andersen, 1988; Van Opstal and Hepp, 1995).
In contrast to a recent study by Groh et al. (2001), ANOVA did not yield a significant number of eye position-sensitive neurons, indicating the lack of tuning to particular eye positions (Table 3). We have no obvious explanation for the difference between the two studies. However, a direct comparison is difficult because Groh et al. (2001) did not document the frequency and intensity tuning characteristics of the neurons. Furthermore, sound level was kept fixed in that study, while spatial parameters were varied in azimuth only.
The apparent discrepancy in our data between ANOVA and regression results (Tables 3, 4; Figs. 9, 10) is explained by the fact that regression is more sensitive to a weak but consistent trend in noisy data than ANOVA.
Model
Unlike in the barn owl (Knudsen and Konishi, 1978), evidence for an explicit topographic map of auditory space has not been found in the mammalian IC. Instead, a spatial topography of sounds is found in the SC, which, however, expresses the target in eye-centered rather than head-centered coordinates (Jay and Sparks, 1984, 1987).
How this transformation (“sound-re.-eye” = “sound-re.-head” - “eye-in-head”) is implemented in the audio-motor system is still unresolved (“re.” indicates “with respect to”). Previous attempts to model this transformation typically assumed an intermediate stage in which a head-centered map of auditory space is created.
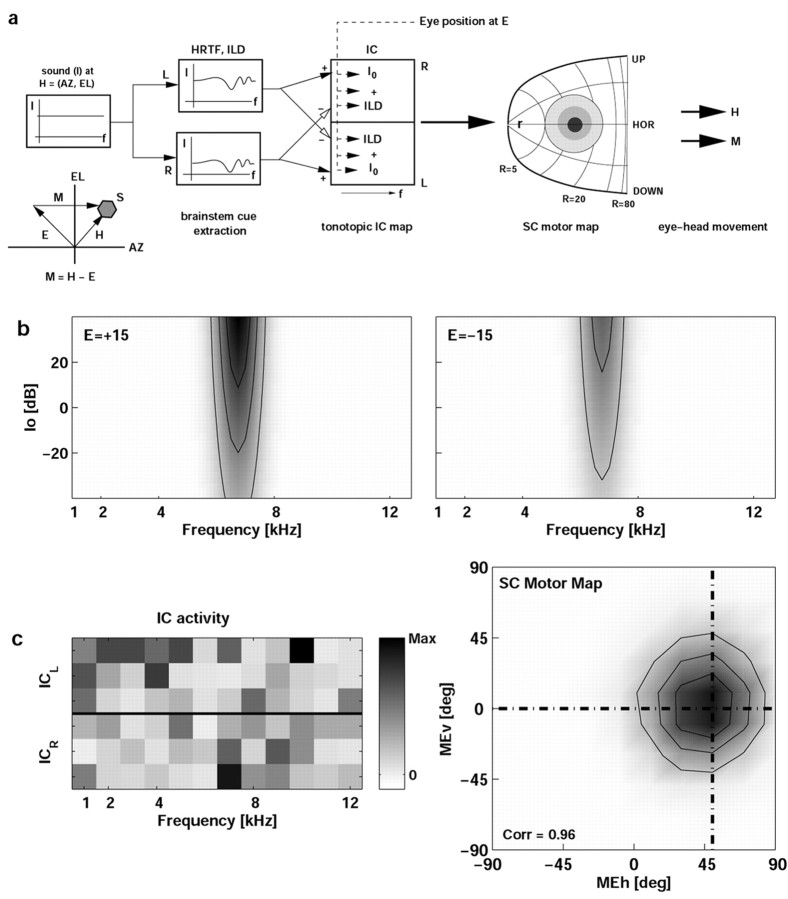
Here we hypothesize that the IC could encode sound location in both head- and eye-centered coordinates without such an intermediate stage. Both signals are needed for eye-head orienting to sounds (Goossens and Van Opstal, 1997). To verify that a tonotopic population of band-limited IC cells could represent sounds in eye- and head-centered coordinates, we trained the simple two-layer neural network model shown in Figure 13a.
Figure 13.
a, Model of how the IC could transform tonotopic signals into an eye-centered representation of sound location in the SC. The latter emerges as a Gaussian distribution of activity with in the complex-log motor map (Robinson, 1972; Sparks, 1986). The sound has a flat spectrum, presented at random 2D locations, H, at various intensities (I). Sounds are filtered by the HRTFs (here described by elevation-dependent functions) and yield azimuth-and intensity-related inputs at the IC cells through binaural excitatory and inhibitory projections. Each IC has 12 frequency channels and, in this simulation, three cells per channel. The input bandwidth of a neuron extends between two and five channels (randomly chosen). Eye position, E, also provides a weak, modulating input to all IC cells. By training the 7200 IC-SC synapses, the network learned, in ∼2.105 trials, to map all possible combinations of azimuth-elevation coordinates (range, ± 60°), eye positions (range, ± 30°), and sound intensities (range, ± 15 dB with respect to the mean) into a Gaussian population at the correct eye motor-error site within the SC motor map. b, Response field (frequency intensity) of an IC model neuron with a BF of 6 kHz, for two eye positions and H = (0 °,0 °), as determined by Eq. 3, where σ[x] = [1 + exp(-x)]-1. Consistency of the eye-position modulation is 0.15. c, Example of a trial after training was completed. A sound (-10 dB) was presented at H = (20°,20°), with the eyes looking at E = (-30°,20°). Eye motor error is M = (50°,0°) (see inset in a, and dotted lines in right panel of c. The left panel in c shows the activity of all 72 IC cells for this trial in gray scale. ICL, Left IC; ICR, right IC. Lack of a simple pattern is attributable to the randomized, fixed tuning parameters of the IC cells. In this example, correlation between desired and actual activity across all 100 cells in the SC map, r = 0.96.
In this scheme, a broadband sound (intensity I0) at head-centered location (AZ, EL) is presented. The sound is modified by elevation-dependent HRTFs and by the azimuth-related head shadow, yielding a frequency-dependent intensity distribution across the IC population, I0(f). All IC cells receive binaural inputs (fixed excitatory and inhibitory weights) and have Gaussian spectral tuning curves, T(f) (Fig. 1a,c). We computed the response of each IC neuron as follows:
 |
3 |
F0 is the peak firing rate of the cell (between 50 and 200 Hz), σ[x] is a sigmoid nonlinearity, and parameters [a, b, g, h] are tuning parameters to sound level, azimuth, and 2D eye position, respectively. These parameters were drawn from random distributions given by the data in Figures 6b and 10b. IC cells are thus sharply tuned to frequency, yet activity is systematically modulated within their frequency tuning curve. Note that Equation 3 does not include an explicit sensitivity to sound elevation. The network learned to extract elevation on the basis of spectral shape, preserved by the population through the fixed sensitivity of each neuron to sound level. The acoustic sensitivity of one cell is illustrated in Figure 13b. All IC cells project to the SC motor map. The response of each SC neuron was determined as follows:
 |
4 |
where Fpk is the peak firing rate (500 Hz; identical for all neurons), and wi,j is the synaptic weight of IC neuron j to SC neuron i.
The weights of the IC-SC projection were trained with the Widrow-Hoff δ rule to yield a topographic Gaussian representation of gaze motor error, M, in the SC motor map. The simulations show that the tonotopic-to-eye-centered transformation could be learned quite accurately (Fig. 13c, right). This result therefore supports the possibility that subtle, randomly distributed modulations of IC firing rates (c, left) could perform the required mapping, without the need of an explicit head-centered representation of auditory space.
This would be quite different from the barn owl's auditory system, an animal that does not make orienting eye movements and that can use relatively simple, monotonic acoustic cues to encode sound azimuth (ITD) and elevation (ILD) (Knudsen and Konishi, 1979).
Alternative interpretation
There is an interesting possibility that the weak modulation of IC responses with eye position might actually relate to an eye position-dependent coactivation of neck muscles (Vidal et al., 1982; Andre-Deshays et al., 1988). Such activation is thought to prepare the audiomotor system for a coordinated orienting response of the eyes and head, even when the latter is restrained. We have shown recently that static head position influences localization of tones in a frequency-specific manner (Goossens and Van Opstal, 1999). We hypothesized that a head-position signal interacts within the tonotopic auditory system to transform head-centered acoustic inputs into a body-centered reference frame (“sound-re.-body” = “sound-re.-head” + “head-re-.body”). This transformation leaves perceived sound location invariant to intervening eye-head movements. If true, IC cells might be modulated by (intended) changes in head posture rather than by eye position.
Footnotes
This research was supported by the University of Nijmegen (A.J.V.O.), the Nijmegen Institute for Cognition and Information (M.P.Z.), the Netherlands Organization for Scientific Research (Nederlandse Organisatie voor Wetenschappelijk Onderzoek-Aard en Levenswetenschappen) (H.V.), and Human Frontiers Science Program Grant RG 0174-1998/B (M.P.Z., H.V.). We thank G. van Lingen, H. Kleijnen, and T. Van Dreumel for technical assistance and F. Philipsen, A. Hanssen, F. van Munsteren, and T. Peters of the central animal facility (Central Dierenlaboratorium) for taking excellent care of our monkeys. We are grateful to Dr. F. van der Werf (Department of Medical Physics of the University of Amsterdam, Amsterdam, The Netherlands) for performing the histology.
Correspondence should be addressed to A. J. Van Opstal, Department of Medical Physics and Biophysics, University of Nijmegen, Geert Grooteplein 21, 6525 EZ Nijmegen, The Netherlands. E-mail: johnvo@mbfys.kun.nl.
Copyright © 2004 Society for Neuroscience 0270-6474/04/244145-12$15.00/0
References
- Aitkin L, Martin R (1990) Neurons in the inferior colliculus of cats sensitive to sound-source elevation. Hear Res 50: 97-105. [DOI] [PubMed] [Google Scholar]
- Andersen RA, Roth GL, Aitkin LM, Merzenich MM (1980) The efferent projections of the central nucleus and the pericentral nucleus of the inferior colliculus in the cat. J Comp Neurol 194: 649-662. [DOI] [PubMed] [Google Scholar]
- Andersen RA, Bracewell RM, Barash S, Gnadt JW, Fogassi L (1990) Eye position effects on visual, memory, and saccade-related activity in areas LIP and 7a of macaque. J Neurosci 10: 1176-1196. [DOI] [PMC free article] [PubMed] [Google Scholar]
- Andre-Deshays C, Berthoz A, Revel M (1988) Eye-head coupling in humans. I. Simultaneous recording of isolated motor units in dorsal neck muscles and horizontal eye movements. Exp Brain Res 69: 399-406. [DOI] [PubMed] [Google Scholar]
- Binns KE, Grant S, Withington DJ, Keating MJ (1992) A topographic representation of auditory space in the external nucleus of the inferior colliculus of the guinea-pig. Brain Res 589: 231-242. [DOI] [PubMed] [Google Scholar]
- Blauert J (1997) Spatial hearing. The psychophysics of human sound localization. Ed 2. Cambridge, MA: MIT.
- Bour LJ, van Gisbergen JA, Bruijns J, Ottes FP (1984) The double magnetic induction method for measuring eye movement—results in monkey and man. IEEE Trans Biomed Eng 31: 419-427. [DOI] [PubMed] [Google Scholar]
- Calford MB, Moore DR, Hutchings ME (1986) Central and peripheral contributions to coding of acoustic space by neurons in inferior colliculus of cat. J Neurophysiol 55: 587-603. [DOI] [PubMed] [Google Scholar]
- Casseday JH, Fremouw T, Covey E (2002): The inferior colliculus: a hub for the central auditory system. In: Integrative functions in the mammalian auditory pathway (Oertel D, Fay RR, Popper AN, eds), pp 238-318. Heidelberg: Springer.
- Delgutte B, Joris PX, Litovsky RY, Yin TC (1999) Receptive fields and binaural interactions for virtual-space stimuli in the cat inferior colliculus. J Neurophysiol 81: 2833-2851. [DOI] [PubMed] [Google Scholar]
- Doubell TP, Baron J, Skaliora I, King AJ (2000) Topographical projection from the superior colliculus to the nucleus of the brachium of the inferior colliculus in the ferret: convergence of visual and auditory information. Eur J Neurosci 12: 4290-4308. [PubMed] [Google Scholar]
- Epping WJ, Eggermont JJ (1987) Coherent neural activity in the auditory midbrain of the grassfrog. J Neurophysiol 57: 1464-1483. [DOI] [PubMed] [Google Scholar]
- Frens MA, Van Opstal AJ (1998) Visual-auditory interactions modulate saccade-related activity in monkey superior colliculus. Brain Res Bull 46: 211-224. [DOI] [PubMed] [Google Scholar]
- Fuzessery ZM, Westrup JJ, Pollak GD (1990) Determinants of horizontal sound localization sensitivity of binaurally excited neurons in an isofrequency region of the mustache bat inferior colliculus. J Neurophysiol 63: 1128-1147. [DOI] [PubMed] [Google Scholar]
- Goossens HHLM, Van Opstal AJ (1997) Human eye-head coordination in two dimensions under different sensorimotor conditions. Exp Brain Res 114: 542-560. [DOI] [PubMed] [Google Scholar]
- Goossens HHLM, Van Opstal AJ (1999) Influence of head position on the spatial representation of acoustic targets. J Neurophysiol 81: 2720-2736. [DOI] [PubMed] [Google Scholar]
- Groh JM, Trause AS, Underhill AM, Clark KR, Inati S (2001) Eye position influences auditory responses in primate inferior colliculus. Neuron 29: 509-518. [DOI] [PubMed] [Google Scholar]
- Groh JM, Kelly KA, Underhill AM (2003) A monotonic code for sound azimuth in primate inferior colliculus. J Cognit Neurosci 15: 1217-1234. [DOI] [PubMed] [Google Scholar]
- Harting KJ, Van Lieshout DP (2000) Projections from the rostral pole of the inferior colliculus to the cat superior colliculus. Brain Res 881: 244-247. [DOI] [PubMed] [Google Scholar]
- Hartline PH, Vimal RL, King AJ, Kurylo DD, Northmore DP (1995) Effects of eye position on auditory localization and neural representation of space in superior colliculus of cats. Exp Brain Res 104: 402-408. [DOI] [PubMed] [Google Scholar]
- Hofman PM, Van Opstal AJ (1998) Spectro-temporal factors in two-dimensional human sound localization. J Acoust Soc Am 103: 2634-2648. [DOI] [PubMed] [Google Scholar]
- Hyde PS, Knudsen EI (2000) Topographic projection from the optic tectum to the auditory space map in the inferior colliculus of the barn owl. J Comp Neurol 421: 146-160. [DOI] [PubMed] [Google Scholar]
- Irvine DR, Gago G (1990) Binaural interaction in high-frequency neurons in inferior colliculus of the cat: effects of variations in sound pressure level on sensitivity to interaural intensity differences. J Neurophysiol 63: 570-591. [DOI] [PubMed] [Google Scholar]
- Itaya SK, Van Hoesen GW (1982) Retinal innervation of the inferior colliculus in rat and monkey. Brain Res 233: 45-52. [DOI] [PubMed] [Google Scholar]
- Jay MF, Sparks DL (1984) Auditory receptive fields in primate superior colliculus shift with changes in eye position. Nature 309: 345-347. [DOI] [PubMed] [Google Scholar]
- Jay MF, Sparks DL (1987) Sensorimotor integration in the primate superior colliculus. II. Coordinates of auditory signals. J Neurophysiol 57: 35-55. [DOI] [PubMed] [Google Scholar]
- King AJ, Jiang ZD, Moore DR (1998) Auditory brainstem projections to the ferret superior colliculus: anatomical contribution to the neural coding of sound azimuth. J Comp Neurol 390: 342-365. [PubMed] [Google Scholar]
- Knudsen EI, Knudsen PF (1983) Space-mapped auditory projections from the inferior colliculus to the optic tectum in the barn owl (Tyto alba). J Comp Neurol 218: 187-196. [DOI] [PubMed] [Google Scholar]
- Knudsen EI, Konishi M (1978) A neural map of auditory space in the owl. Science 200: 795-797. [DOI] [PubMed] [Google Scholar]
- Knudsen EI, Konishi M (1979) Mechanisms of sound localization in the barn owl (Tyto alba). J Comp Physiol 133: 13-21. [Google Scholar]
- Kuwada S, Yin TC (1983) Binaural interaction in low-frequency neurons in inferior colliculus of the cat. I. Effects of long interaural delays, intensity, and repetition rate on interaural delay function. J Neurophysiol 50: 981-999. [DOI] [PubMed] [Google Scholar]
- Mascetti GG, Strozzi L (1988) Visual cells in the inferior colliculus of the cat. Brain Res 442: 387-390. [DOI] [PubMed] [Google Scholar]
- McAlpine D, Jiang D, Palmer AR (2001) A neural code for low-frequency sound localization in mammals. Nat Neurosci 4: 396-401. [DOI] [PubMed] [Google Scholar]
- Peck CK, Baro JA, Warder SM (1995) Effects of eye position on saccadic eye movements and on the neuronal responses to auditory and visual stimuli in cat superior colliculus. Exp Brain Res 103: 227-242. [DOI] [PubMed] [Google Scholar]
- Poon PW, Sun X, Kamada T, Jen PH (1990) Frequency and space representation in the inferior colliculus of the FM bat, Eptesicus fuscus Exp Brain Res 79: 83-91. [DOI] [PubMed] [Google Scholar]
- Press WH, Flannery BP, Teukolsky SA, Vettering WT (1992) Numerical recipes in C, Ed 2. Cambridge, UK: Cambridge UP.
- Read HL, Siegel RM (1997) Modulation of responses to optic flow in area 7a by retinotopic and oculomotor cues in monkey. Cereb Cortex 7: 647-671. [DOI] [PubMed] [Google Scholar]
- Recanzone GH (2000) Spatial processing in the auditory cortex of the macaque monkey. Proc Natl Acad Sci USA 97: 11829-11835. [DOI] [PMC free article] [PubMed] [Google Scholar]
- Recanzone GH, Guard DC, Phan ML, Su TK (2000) Correlation between the activity of single auditory cortical neurons and sound-localization behavior in the macaque monkey. J Neurophysiol 83: 2723-2739. [DOI] [PubMed] [Google Scholar]
- Robinson (1972) Eye movements evoked by collicular stimulation in the alert monkey. Vision Res 12: 1795-1808. [DOI] [PubMed] [Google Scholar]
- Ryan A, Miller J (1978) Single unit responses in the inferior colliculus of the awake and performing rhesus monkey. Exp Brain Res 32: 389-407. [DOI] [PubMed] [Google Scholar]
- Schlegel PA, Jen PH, Sing S (1988) Auditory spatial sensitivity of inferior colliculus neurons of echolocating bats. Brain Res 456: 127-138. [DOI] [PubMed] [Google Scholar]
- Schnupp JW, King AJ (1997) Coding for auditory space in the nucleus of the brachium of the inferior colliculus in the ferret. J Neurophysiol 78: 2717-2731. [DOI] [PubMed] [Google Scholar]
- Snider RS, Lee JC (1961) A stereotaxic atlas of the monkey brain (Macaca mulatta). Chicago: University of Chicago.
- Sparks DL (1986) Translation of sensory signals into commands for control of saccadic eye movements: role of primate superior colliculus. Physiol Rev 66: 118-171. [DOI] [PubMed] [Google Scholar]
- Spezio ML, Keller CH, Marrocco RT, Takahashi TT (2000) Head-related transfer functions of the rhesus monkey. Hearing Res 144: 73-88. [DOI] [PubMed] [Google Scholar]
- Stein BE, Meredith MA (1993) The merging of the senses. Cambridge, MA: MIT.
- Trotter Y, Celebrini S (1999) Gaze direction controls response gain in primary visual-cortex neurons. Nature 398: 239-242. [DOI] [PubMed] [Google Scholar]
- Van Opstal AJ, Hepp K (1995) A novel interpretation for the collicular role in saccade generation. Biol Cybern 73: 431-445. [Google Scholar]
- Van Opstal AJ, Hepp K, Suzuki Y, Henn V (1995) Influence of eye position on activity in monkey superior colliculus. J Neurophysiol 74: 1593-1610. [DOI] [PubMed] [Google Scholar]
- Versnel H, Zwiers MP, Van Opstal AJ (2002) Spectro-temporal response fields in the inferior colliculus of awake monkey. In: Proceedings of the Third European Congress on Acoustics, Sevilla [special issue]. J Revista de Acustica: 33.
- Vidal PP, Roucoux A, Berthoz A (1982) Horizontal position-related activity in neck muscles of the alert cat. Exp Brain Res 41: 358-363. [DOI] [PubMed] [Google Scholar]
- Wallace MT, Meredith MA, Stein BE (1993) Converging influences from visual, auditory, and somatosensory cortices onto output neurons of the superior colliculus. J Neurophysiol 69: 1797-1809. [DOI] [PubMed] [Google Scholar]
- Yin TC (2002) Neural mechanisms of encoding binaural localization cues in the auditory brainstem. In: Integrative functions in the mammalian auditory pathway (Oertel D, Fay RR, Popper AN, eds), pp 99-159. Heidelberg: Springer.
- Young ED, Davis KA (2002) Circuitry and function of the dorsal cochlear nucleus. In: Integrative functions in the mammalian auditory pathway (Oertel D, Fay RR, Popper AN, eds), pp 160-206. Heidelberg: Springer.
- Zipser D, Andersen RA (1988) A back-propagation programmed network that simulates response properties of a subset of posterior parietal neurons. Nature 331: 679-684. [DOI] [PubMed] [Google Scholar]


