

Abstract
The hypothesis that BMPs (bone morphogenetic proteins), which act early in gut morphogenesis, also regulate specification and differentiation in the developing enteric nervous system (ENS) was tested. Expression of BMP-2 and BMP-4, BMPR-IA (BMP receptor subunit), BMPR-IB, and BMPR-II, and the BMP antagonists, noggin, gremlin, chordin, and follistatin was found when neurons first appear in the primordial bowel at embryonic day 12 (E12). Agonists, receptors, and antagonists were detected in separated populations of neural crest- and noncrest-derived cells. When applied to immunopurified E12 ENS precursors, BMP-2 and BMP-4 induced nuclear translocation of phosphorylated Smad-1 (Sma and Mad-related protein). The number of neurons developing from these cells was increased by low concentrations and decreased by high concentrations of BMP-2 or BMP-4. BMPs induced the precocious appearance of TrkC-expressing neurons and their dependence on neurotrophin-3 for survival. BMP-4 interacted with glial cell line-derived neurotrophic factor (GDNF) to enhance neuronal development but limited GDNF-driven expansion of the precursor pool. BMPs also promoted development of smooth muscle from mesenchymal cells immunopurified at E12. To determine the physiological significance of these observations, the BMP antagonist noggin was overexpressed in the developing ENS of transgenic mice under the control of the neuron-specific enolase promoter. Neuronal numbers in both enteric plexuses and smooth muscle were increased throughout the postnatal small intestine. These increases were already apparent by E18. In contrast, TrkC-expressing neurons decreased in both plexuses of postnatal noggin-overexpressing animals, again an effect detectable at E18. BMP-2 and/or BMP-4 thus limit the size of the ENS but promote the development of specific subsets of enteric neurons, including those that express TrkC.
Keywords: neural crest, p75NTR, GDNF, Smad protein, enteric nervous system, autonomic nervous system, gut
Introduction
The enteric nervous system (ENS) is derived from precursors that emigrate to the bowel from the neural crest (Yntema and Hammond, 1954, 1955; Le Douarin and Teillet, 1973, 1974; Pomeranz et al., 1991, 1993; Serbedzija et al., 1991; Burns and Le Douarin, 1998, 2001; Hearn and Newgreen, 2000). The crest-derived cells that colonize the gut are multipotent (Rothman et al., 1990, 1993; Sextier-Sainte-Claire Deville et al., 1994; Lo and Anderson, 1995); thus, the molecules they encounter within the gut, as well as precursor lineages, determine the unique properties of the ENS (Blaugrund et al., 1996). For example, ENS development distal to the esophagus (Schuchardt et al., 1994; Moore et al., 1996; Pichel et al., 1996; Sánchez et al., 1996; Enomoto et al., 1998) requires that glial cell line-derived neurotrophic factor (GDNF) (Suvanto et al., 1996; Taraviras and Pachnis, 1999) bind to its coreceptor GFRα1 (GDNF family receptor α1) to activate Ret on crest-derived cells (Jing et al., 1996; Treanor et al., 1996; Trupp et al., 1996; Pachnis et al., 1998; Taraviras et al., 1999). GDNF stimulates the proliferation of crest-derived cells immunoselected from the rat gut at embryonic day 12 (E12) but not at E14, although it continues to promote neuronal differentiation (Chalazonitis et al., 1998b). Neurotrophin-3 (NT-3) also enhances the development of enteric neurons in vitro (Chalazonitis et al., 1994) and is required in vivo for the survival of the subset of enteric neurons that expresses TrkC (Chalazonitis et al., 2001); however, NT-3 responsiveness does not begin until E14 (Chalazonitis et al., 1998b). NT-3-dependent enteric neurons are important because they include the submucosal intrinsic primary afferent neurons (Chalazonitis et al., 2001) that enable the ENS to mediate peristaltic and secretory reflexes (Cooke, 2000; Pan and Gershon, 2000). Both the requirements of enteric crest-derived cells for growth factors and their responsiveness to such factors are thus developmentally regulated.
BMPs (bone morphogenetic proteins) influence many developmental processes, including cell proliferation, apoptosis, and the determination of the fates of non-neuronal cells (Hogan, 1996; von Bubnoff and Cho, 2001; ten Dijke et al., 2002), crest cells (Liem et al., 1995; Shah et al., 1996; Varley and Maxwell, 1996; LaBonne and Bronner-Fraser, 1998; Marchant et al., 1998; Sela-Donenfeld and Kalcheim, 1999), and neurons (Mehler et al., 1997). BMP-4 is expressed in the mesenchyme of the primordial gut in response to Shh (sonic hedgehog) secreted by the endoderm (Roberts et al., 1995, 1998). Shh/BMP-4 signaling affects the acquisition of both anteroposterior (Roberts, 2000) and radial (Sukegawa et al., 2000) axes of the bowel and the development of enteric mesenchyme (Roberts, 2000; Sukegawa et al., 2000). BMP-2 and BMP-4 also affect the development of enteric neurons in vitro (Pisano et al., 2000; Sukegawa et al., 2000).
The current study was performed to test the hypothesis that BMP signaling plays a role in cell fate specification and differentiation in the developing ENS. BMP signaling promoted differentiation of neurons and the specification of the subset that expresses TrkC. Paradoxically, by promoting differentiation of postmitotic neurons from proliferating progenitor cells, BMP signaling reduced the total number of neurons. Effects of BMP signaling, therefore, are to limit the ultimate size of the ENS while simultaneously promoting the development of specific subsets of enteric neurons, such as that which is characterized by expression of TrkC.
Parts of this work have been published previously in abstract form (Chalazonitis et al., 1999, 2003a,b).
Materials and Methods
Animals. Pregnant female rats (Sprague Dawley; Charles River Laboratories, Waltham MA) were killed by CO2 narcosis, followed by thoracotomy. Mice (CD-1; Charles River Laboratories) were killed by CO2 inhalation. The Animal Care and Use Committee of Columbia University approved these procedures. The day at which a vaginal plug was found was designated as day 0 of gestation. The fetal rat bowel was dissected aseptically at E12 from 30-32 fetuses per experiment and at E14 from 20-25 fetuses per experiment. Brain and gut were removed from mature rats and mice.
Transgenic mice. The promoter for neuron-specific enolase (NSE) was used to direct noggin overexpression in the NSE-noggin mice to neurons (Forss-Petter et al., 1990) and enteroendocrine cells, both of which normally express NSE in the bowel (Schmechel et al., 1980; Bishop et al., 1985; Tam and Lister, 1986; Scheuermann et al., 1989; Hearn et al., 1999). The coding sequence of noggin was followed by those encoding an internal ribosome entry site (IRES) and enhanced green fluorescent protein (EGFP) as part of a bicistronic transcript, so that the single NSE promoter would direct expression of the EGFP reporter as well as noggin to facilitate detection of transgene expression (Chalazonitis et al., 2003a,b; Guha, 2003; Guha et al., 2004). The postnatal small intestine was examined in 11 heterozygous and four homozygous NSE-noggin mice, as well as in seven of their wild-type littermates [ages postnatal day 26 (P26) to P34]. The fetal small intestine was examined in four heterozygous and four wild-type littermates at E18.
Immunoselection. Crest-derived cells were immunoselected from the fetal rat gut with antibodies to the common neurotrophin receptor, p75NTR, at E12 and E14 as described previously (Chalazonitis et al., 1994, 1998a,b, 2001). Briefly, the bowel was dissociated with collagenase to yield a single-cell suspension, and the suspended cells were exposed, sequentially, to antibodies to p75NTR and then to secondary antibodies coupled to magnetic beads; the antibody-decorated crest-derived cells were finally selected with a magnetic field. This procedure separates enteric crest-derived cells, which are retained on a column by the magnetic field, from the noncrest-derived cells, which pass through. Polyclonal antibodies to p75NTR (donated by Dr. Moses Chao, Skirball Institute, New York University, New York, NY) or monoclonal antibodies (donated by Dr. Robert Rush, Flinders University, Adelaide, Australia) were used for immunoselection. Both antibodies react with rat p75NTR (Chandler et al., 1984; Huber and Chao, 1995). The goat anti-rabbit and anti-mouse secondary antibodies coupled to magnetic beads, and the columns used for immunoselection were purchased from Miltenyi Biotec (Auburn, CA).
Tissue culture. Both crest- and noncrest-derived cells were studied. The cells of each type were plated at a density of 1.2 × 10⁵ cells/ml onto 12-mm-diameter glass coverslips (number 1001; RESY, Darmstadt, Germany) or 400 mm2 Nunc (Roskilde, Denmark) chambers that were coated with poly-d-lysine, rat tail collagen, and laminin, as described previously (Chalazonitis et al., 1998b). All cultures were maintained in a defined medium [basic Brazeau medium (BBM)] (Ziller et al., 1983). At the time of plating, the medium was supplemented with 20% horse serum (JRH Biosciences, Lenexa, KS) to promote adherence of cells to the substrate. After 18 hr, this medium was changed to serum-free BBM. When cultures were maintained for longer than 4 d, they were fed with fresh medium on the fourth day. In all experiments, the factors to be studied, which included BMP-2 and BMP-4 (Genetics Institute, Cambridge, MA; and Wyeth, Cambridge, MA), GDNF (rat recombinant; R & D Systems, Minneapolis, MN), and NT-3 (human recombinant; Regeneron Pharmaceuticals, Tarrytown, NY), were added to the medium at the time of plating and were present throughout the subsequent culture period. Control cultures were supplemented with the vehicle in which the growth factors were suspended (0.5% bovine serum albumin in BBM).
Reverse transcription and the PCR. Total RNA was extracted from cells or tissues by homogenization with Trizol (1 ml/100 mg of tissue; Invitrogen, Gaithersburg, MD). Chloroform (10% of the total volume) was added, and the sample was covered and shaken vigorously, placed on ice for 10 min, and then centrifuged for 15 min (13,000 × g). The aqueous phase was removed, and RNA was precipitated with isopropanol (60% of the Trizol volume). The RNA pellet was washed by resuspension in 70% ethanol. The suspension was centrifuged for 5 min (10,000 × g), dried briefly, and dissolved in diethylpyrocarbonate-treated water. The extracted RNA (2.0 μg) was then used as a template for random hexamer-primed first-strand cDNA synthesis catalyzed by Moloney murine leukemia virus reverse transcriptase (Invitrogen, Gaithersburg, MD). The resulting cDNA was used for PCR amplification. Reverse transcription (RT)-PCR analyses were performed to detect transcripts encoding β-actin, p75NTR, smooth muscle actin (SMA), heart- and neural crest derivatives-expressed protein 1 (Hand-1), BMP-2, BMP-4, BMP-7, BMPR-IA (BMP receptor subunit), BMPR-IB, BMPR-II, and the BMP antagonists follistatin, chordin, noggin, and gremlin. The GenBank accession numbers, the sequences of the primers used for PCR, the conditions of amplification, and the expected sizes of the products are shown in supplemental Tables 1 and 2 (available at www.jneurosci.org). For semiquantitative RT-PCR, β-actin was used as a control.
Competitive PCR was used to quantify transcripts encoding BMP-2 and BMP-4 in the gut of fetal rats as a function of age. Competitive PCR was used to circumvent the problems associated with the exponential nature of PCR amplification (Siebert and Larrick, 1992). The competitors (internal standards) used for the reaction were deletion constructs that could be amplified with the same primer pairs as the targets. The technique is based on the construction of mutant deleted DNA fragments by amplification with the original 3′ primer in combination with a recombinant 5′ primer to produce the shortened template. The sequence of the 5′ primer used to obtain the competitive internal standard for competitive PCR analysis of cDNA encoding BMP-2 was 5′-AGAAGCCATCGAGGAACTTTAAATAGTAGTTTCCAGCA-3′, and that for BMP-4 was 5′-TAGCAAGAGCGCCGTCATTCCTTCGTTTCTTCTTT AACC-3′. These produced the deletion mutant templates, 293 bp for BMP-2 and 221 bp for BMP-4, that could be amplified with the sense and antisense primers corresponding to BMP-2 and BMP-4 shown in supplemental Tables 1 and 2 (available at www.jneurosci.org). The smaller competitors were readily distinguishable from the natural PCR products (414 and 397 bp, respectively) by electrophoresis through a 1.5% agarose gel. The standards were gel purified, cloned in a pGEM vector (Promega, Madison, WI), and sequenced. The plasmids were then linearized and transcribed (Roche Diagnostics, Indianapolis, IN). Transcripts were extracted two times with phenol-chloroform and precipitated with 3 mm sodium acetate, pH 5.2, and ethanol at -80°C. At each developmental age, 3 μg of total RNA were reverse transcribed with increasing amounts of the BMP-2 or BMP-4 competitive internal standard RNA. PCR products were resolved by agarose gel electrophoresis with ethidium bromide, and fluorescence intensities were quantified by using the Kodak Digital Science program 1D (Eastman Kodak, Rochester, NY). The ratio of the intensity of the fluorescence of the target cDNA to that of the competitor was determined (n = 6 at each fetal age examined). These ratios were plotted as a semilogarithmic function of the amount of added internal standard. The resulting linear plot intersected the x-axis when the amount of target mRNA was equal to that of the internal standard. Four series of experiments were performed for the quantification of BMP-4 as a function of age and three series for that of BMP-2.
Western analysis. The small intestine was removed from NSE-noggin transgenic mice and their wild-type mice littermates at P11. The gut and samples of adult mouse brain (positive control) were sonicated at 4°Cin a lysis buffer (10 mm Tris, pH 7.4, 1% Triton X-100, 0.5% Nonidet P-40, 150 mm NaCl, 20 mm NaF, 0.2 mm sodium orthovanadate, 1 mm EDTA, 1 mm EGTA, 0.2 mm phenylmethylsulfonyl fluoride, and an additional mixture of phosphatase and protease inhibitors) (Xu et al., 2001). The resulting lysate was cleared by centrifugation, and proteins (30 μg) present in the supernatant were denatured with SDS (2% in Laemmli sample buffer) (Laemmli, 1970) and separated by 12% PAGE (Nu-PAGE gel; Invitrogen, Carlsbad, CA) in the presence of SDS. Separated proteins were electrophoretically transferred from the gel to a 0.2 μm nitrocellulose membrane and blocked using 5% nonfat dry milk for 1 hr. To detect noggin immunoreactivity, blots were exposed overnight at 4°C to a mixture of two batches of rat monoclonal antibodies to human noggin (0.5 μg/ml RP57-16 and 0.3 μg/ml RP57-21; Regeneron Pharmaceuticals). Bound antibodies were located by exposure to sheep antibodies to rat IgG coupled to horseradish peroxidase (HRP) diluted 1:2000 (Amersham Biosciences, Arlington Heights, IL). Blots were then stripped of immune complexes and reprobed overnight at 4°C with rabbit antibodies to rat ERK1 (extracellular signal-regulated kinase) (1:8000; Santa Cruz Bio-technology, Santa Cruz, CA), and bound antibodies were located with goat antibodies to rabbit IgG (1:5000; Pierce, Rockford, IL). Blots were finally visualized by using chemiluminescence (Super ECL; Pierce).
Immunocytochemistry in culture. Immunoreactivity was used to detect markers that enabled cultured cells to be identified. Procedures used for the immunocytochemical detection of antigens in cultured cells were similar to those described in detail previously (Chalazonitis et al., 1994, 1997, 1998a, 2001). Briefly, cultures were fixed for 1 hr with 4% formaldehyde (freshly prepared from paraformaldehyde) in 0.1 mm PBS. Fixed cultures were permeabilized by incubation with 0.1 mm PBS containing 0.1% Triton X-100 (Sigma, St. Louis, MO). The primary antibodies, listed in supplemental Tables 1 and 2 (available at www.jneurosci.org), were applied overnight at room temperature as described previously. Sites of binding of polyclonal primary antibodies were located with affinity-purified goat anti-rabbit secondary antibodies that were coupled to Alexa 488, Alexa 594 (Molecular Probes, Eugene, OR), or biotin (Kirkegaard and Perry, Gaithersburg, MD). Sites of binding of monoclonal primary antibodies were located with affinity-purified goat anti-mouse secondary antibodies that were coupled to Alexa 488 (Molecular Probes). Biotinylated secondary antibodies were visualized with either streptavidin coupled to Alexa 594 (Molecular Probes) or a preformed avidin and biotinylated horseradish peroxidase macromolecular complex (ABC Elite kit; Vector Laboratories, Burlingame, CA). Peroxidase activity was visualized with H2O2 and 3,3′-diaminobenzidine (DAB) (Vectastain 4100; Vector Laboratories) with nickel intensification. Unless otherwise stated (supplemental Tables 1, 2, available at www.jneurosci.org), the primary antibodies were omitted for control sections, which were thus exposed only to secondary antibodies before visualization of immunoreactivity.
Apoptotic TrkC-immunoreactive cells were identified by using the terminal deoxynucleotidyl transferase (TdT)-mediated biotinylated UTP nick end labeling (TUNEL) method, which was applied after the immunocytochemical demonstration of TrkC (Chalazonitis et al., 2001). A commercial kit (TACS; TdT in situ apoptosis detection kit; R & D Systems) was used for TUNEL staining according to the directions of the manufacturer.
Cuprolinic blue staining and immunocytochemistry in tissues. Methods are similar to those described previously (Chalazonitis et al., 2001). Briefly, fetal mouse gut (E18) and bowel from 4-week-old mice were fixed with 4% formaldehyde (from paraformaldehyde), pH 7.4, and dissected to obtain laminar preparations of the gut wall. In the mature mice, the submucosa, containing the submucosal plexus, and the muscularis externa with adherent myenteric plexus were examined individually in separated layers, whereas in the fetal animals, in which the submucosal plexus was just beginning to form, the submucosa was left attached to the muscularis externa. Both fetal and adult preparations were analyzed in whole mounts. Neurons were counted in fetal gut that was immunostained with the neuronal marker PGP9.5 (protein gene product; a neuronal form of ubiquitin hydrolase) (supplemental Tables 1, 2, available at www.jneurosci.org). To count the total number of neurons in postnatal bowel, the laminar preparations were stained for 1 hr at 37°C with cuprolinic blue, which is neuron selective and reveals the entire neuronal population (0.5% in 0.05 mm sodium acetate buffer, pH 5.6, containing 1.0 m MgCl2) (Heinicke et al., 1987; Holst and Powley, 1995; Karaosmanoglu et al., 1996). Nerve cell bodies were counted in 10 contiguous nonoverlapping rectangular fields covering 1.254 mm2. The mean density of neurons per square millimeter of tissue was then calculated from 10-62 such measurements (100-620 rectangular fields) in each layer of tissue. To count the total number of smooth muscle cells in each layer of fetal gut, individual cells were outlined by immunostaining their basal laminas in sections of bowel (cut with a cryostat microtome) with antibodies to laminin (supplemental Tables 1, 2, available at www.jneurosci.org). The total area of the muscularis externa was measured by computer-assisted morphometry (NIH ImageJ public domain software). For immunocytochemistry, endogenous peroxidase activity was suppressed with H2O2 (0.3%; 10 min) in PBS, washed, and blocked for 30 min with 4% goat serum in PBS containing 0.3% Triton X-100. Primary antibodies to TrkC (supplemental Tables 1, 2, available at www.jneurosci.org) were then applied overnight at room temperature. Sites of antibody binding were detected with biotinylated goat anti-rabbit antibodies (1:1000 for 2 hr) and streptavidin conjugated to HRP (1:500 for 2 hr; Kirkegaard and Perry). Peroxidase activity was visualized with H2O2 and DAB with or without nickel intensification. The mean density of TrkC-expressing neurons per square millimeter of tissue was calculated from 12-51 measurements (120-510 rectangular fields) in each layer of postnatal bowel. The density of TrkC-expressing neurons in the whole wall of the fetal gut (E18) was calculated from 14-18 measurements (140-180 rectangular fields).
Statistical analyses. The total number of cells in each culture and cells specifically identified with reagents (supplemental Tables 1, 2, available at www.jneurosci.org) were counted as described previously (Chalazonitis et al., 1994, 1997, 1998a,b, 2001). Counts of the total number of cells in cultures treated with experimental reagents were normalized as a percentage of cells found in replicate cultures that had only been treated with vehicle. The number and proportion of identified cells in each culture were also determined and normalized to the number and proportion of the same type of cell developing in replicate cultures that had only been treated with vehicle. The total number of cuprolinic blue-stained neurons and neurons immunostained with antibodies to PGP9.5 or TrkC were counted in both enteric plexuses in the duodenum, jejunum, and ileum of wild-type and transgenic mice that overexpress noggin under the control of the NSE promoter. The proportion of total neurons that express TrkC was expressed by dividing the number of TrkC-immunoreactive neurons per square millimeter by the mean number of cuprolinic blue-stained neurons per square millimeter. To estimate numbers of smooth muscle cells, formaldehyde-fixed bowel was embedded in Epoxy resin (Epon 812), cross-sectioned at 1 μm, and stained with toluidine blue. The number of longitudinal muscle cells in a 45 μm arc was counted in each section. The number of cells comprising the thickness of the circular muscle layer was also determined. Means ± SE were calculated and analyzed by ANOVA (Tukey or Bonferroni-Dunn post hoc comparisons were made when appropriate).
Results
Transcripts encoding BMP-2 and BMP-4 but not BMP-7 were detected in the E12 and E14 rat gut
RT-PCR was used to investigate expression of BMP-2, BMP-4, and BMP-7 in the rat bowel at E12 and E14. BMP-4 was investigated because its expression has been reported in the developing enteric mesoderm (in response to endodermal secretion of sonic hedgehog) (Roberts et al., 1995, 1998; Sukegawa et al., 2000). BMP-2 and BMP-7 were examined because they affect neural crest development (Liem et al., 1995; Pisano et al., 2000) and interact with the same BMP receptors as BMP-4 (ten Dijke et al., 1994; Rosenzweig et al., 1995; Yamashita et al., 1996). E12 and E14 were selected for study because the gut contains an abundance of uncommitted crest-derived precursors at E12 (Baetge et al., 1990a; Chalazonitis et al., 1998b), and substantial numbers of cells committed to the neuronal lineage at E14 (Chalazonitis et al., 1998b, 2001). Transcripts encoding BMP-2 and BMP-4 were found in the fetal gut at E12 and E14, as well as in the brain at E12, which was examined as a positive control (Fig. 1A). In contrast, transcripts encoding BMP-7 were not found in the fetal bowel at either E12 or E14 (Fig. 1A); nevertheless, transcripts encoding BMP-7 were readily detected in the E12 brain (Fig. 1A). Both BMP-2 and BMP-4 are thus present in the bowel during the critical period between E12 and E14.
Figure 1.

RNA transcripts encoding BMP-2 and BMP-4 but not BMP-7 can be detected in both crest-derived (CD) and noncrest-derived (non-CD) cells of the fetal rat gut by RT-PCR. A, BMP expression in the whole bowel and brain (examined as a positive control) at E12 and E14. PCR products were not detected when incubation of extracted RNA with reverse transcriptase (RT) was omitted (-). Note that RNA transcripts encoding BMP-7 were not observed in the bowel at either E12 or E14, although these transcripts were readily detected in the brain. It is thus likely that there is significant expression of BMP-2 and BMP-4 in the E12 and E14 bowel but not BMP-7. B, C, Crest- and noncrest-derived cells in the E14 bowel were separated by positive and negative immunoselection with antibodies to p75NTR. The neural crest marker p75NTR was expressed only in the positively selected crest-derived population, and the mesenchymal marker Hand-1 was expressed only by the negatively selected noncrest-derived population. Immunoselection thus effectively separates crest- and noncrest-derived cells. C, BMP-2 and BMP-4 are expressed both by crest- and noncrest-derived populations of cells.
Competitive RT-PCR was used to quantify enteric transcripts encoding BMP-2 and BMP-4 as a function of developmental age (data not illustrated). mRNAs encoding the BMPs were measured in the fetal (E12-E19), perinatal (P0 and P2), and adult gut. Values were normalized to micrograms of total RNA at each age. mRNA encoding BMP-2 exceeded that encoding BMP-4 throughout development by 7- to 42-fold. The expression of transcripts encoding BMP-2 was highest at E12-E14 and then declined to birth and was low in the adult bowel. In contrast, the amount of mRNA encoding BMP-4 was low at E12-E14 and increased approximately twofold between E14 and E19-P2. The amount of mRNA encoding BMP-4 detected in the adult bowel was comparable with that at E12 and E14. These observations indicate that, although BMP-2 and BMP-4 activate the same subtypes of BMP receptor, their developmental regulation is different.
Both crest-derived and noncrest-derived cells express mRNA encoding BMP-2 and BMP-4 in the fetal gut
Crest- and noncrest-derived cells were isolated from the fetal bowel and analyzed separately to determine which of these populations account for BMP-2 and BMP-4 expression in the whole fetal gut. Antibodies to p75NTR, which is selectively expressed in the developing bowel by the crest-derived ENS precursors (Baetge et al., 1990a), were used for immunoselection (Chalazonitis et al., 1998a,b). Crest-derived cells are positively selected, whereas the noncrest-derived cells, which do not react with the antibodies, are negatively selected. The effectiveness of the immunoselection was assessed by analyzing the expression of p75NTR in the positively and negatively selected populations isolated at E14. The expression of Hand-1, a basic helix-loop-helix protein that in the gut is expressed only by cells in the smooth muscle lineage (Hollenberg et al., 1995) (P. Cserjesi, personal communication) was evaluated as a mesodermal marker. Enteric smooth cells are all of mesodermal origin. Transcripts encoding p75NTR were detected in the positively selected crest-derived but not in the negatively selected noncrest-derived cells (Fig. 1B). In contrast, mRNA encoding Hand-1 was found only in the negatively selected noncrest-derived cells and not in the positively selected population (Fig. 1B). Positive and negative immunoselection thus separate crest- from noncrest-derived cells of the bowel wall without significant cross-contamination. Transcripts encoding BMP-2 and BMP-4 were each detected in both populations of cells (Fig. 1C). These data suggest that BMP-2 and BMP-4 are secreted by both cells of crest and noncrest origin. The BMPs thus are potentially paracrine or autocrine regulators of ENS development.
Crest- and noncrest-derived cells in the fetal gut express transcripts encoding BMPR-IA, BMPR-IB, and BMPR-II
RT-PCR was used to determine whether the subtypes of BMPRIA, BMPR-IB, and BMPR-II that respond to BMP-2 and BMP-4 (Mehler et al., 1997; Cho and Blitz, 1998) are expressed in fetal rat gut at E12 and E14. Transcripts encoding BMPR-IA, BMPR-IB, and BMPR-II were found in the whole bowel at both ages (Fig. 2A), as well as in brain, which was investigated as a positive control. Crest- and noncrest-derived cells were separated from the E14 fetal bowel and analyzed individually to determine which population accounts for the expression of BMPRs found in the whole fetal gut. The presence or absence of transcripts encoding p75NTR and SMA were studied to evaluate cross-contamination in the separated populations of cells. The positively selected cells expressed p75NTR but not SMA, whereas the negatively selected cells expressed SMA but not p75NTR (Fig. 2B). Thus, significant cross-contamination did not occur. Transcripts encoding BMPRIA, BMPR-IB, and BMPR-II were each found to be expressed in both the crest-derived and noncrest-derived populations of enteric cells (Fig. 2C). These transcripts were also expressed in the brains of E19 and P3 rats (Fig. 2C). These observations suggest that BMPR complexes, which are activated by those BMPs that are expressed in the developing bowel, are likely to be present in both crest- and noncrest-derived cells. Both populations may therefore contain cells that are BMP-2 and BMP-4 responsive.
Figure 2.

Transcripts encoding BMPRs are present in crest- and noncrest-derived cells of the fetal bowel. RT-PCR was used to detect transcripts encoding BMPR-IA, BMPR-IB, and BMPR-II in RNA extracted from the whole gut and in immunoselected populations of crest-derived (CD) and non crest-derived (non-CD)cells. A, Whole gut. Transcripts encoding BMPR-IA, BMPR-IB, and BMPR-II were detected at E12 and E14. Immunoselection was performed at E14 with antibodies top 75NTR. B, Transcripts encoding p75NTR were detected in the positively selected crest-derived but not in the negatively selected noncrest-derived cell population. In contrast, transcripts encoding the mesodermal marker SMA were detected in the negatively selected noncrest-derived but not in the positively selected crest-derived cell population. Analyses were performed with (+) or without (-) RT to assess potential DNA contamination of samples. No PCR products were found in the absence of RT (-). C, Transcripts encoding BMPR-II, BMPR-IA, and BMPR-IB were detected in both crest-derived and noncrest-derived cells. BMPR-II and BMPR-IB were also demonstrated in the developing rat brain. No PCR products were found in the absence of RT (-). Expression of transcripts encoding β-actin was examined in the crest-derived and noncrest-derived cells illustrated in B and C to semiquantitatively normalize RNA from the two populations.
BMP antagonists are expressed in fetal and adult gut
Antagonists such as follistatin, chordin, noggin, and gremlin, which sequester BMPs extracellularly, are potential regulators of signaling by the enteric BMPs (Sasai and De Robertis, 1997; Cho and Blitz, 1998; Merino et al., 1999). RT-PCR was therefore used to investigate the expression of BMP antagonists in the developing and mature gut. The brain was similarly investigated as a positive control. Transcripts encoding gremlin and noggin were each found in the whole fetal bowel at E12 and both persisted to adult life, although the expression of noggin appeared to be downregulated in the adult (Fig. 3A). Expression of noggin was investigated in positively and negatively immunoselected populations of crest- and noncrest-derived cells. Transcripts encoding noggin were found to be present in both (Fig. 3B). Transcripts encoding chordin and follistatin were also detected in the E12 and E14 gut (Fig. 3C). A variety of BMP antagonists thus are likely to coexist in the gut with BMP-2 and BMP-4 during ENS development.
Figure 3.
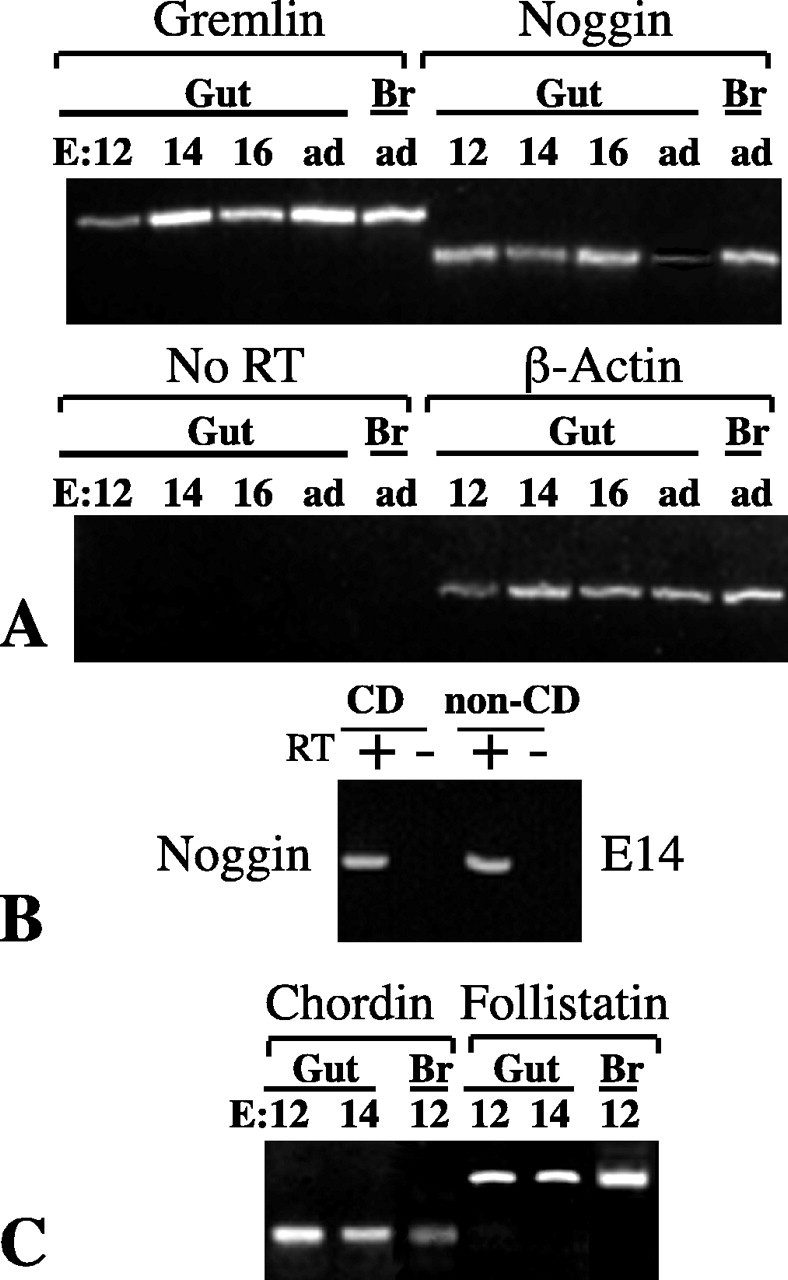
Transcripts encoding molecules that can antagonize the effects of BMP-2 and BMP-4 are present in the fetal bowel. RT-PCR was used to detect transcripts encoding gremlin, noggin, chordin, and follistatin in RNA extracted from the whole gut (Gut) and from separated populations of crest-derived (CD) and noncrest-derived (non-CD) cells. A, Transcripts encoding gremlin and noggin were observed to be present in the whole fetal bowel as early as E12. They were also detected in the brain (Br), which was investigated as a positive control. No PCR products were obtained when reverse transcriptase was omitted (NoRT). B, Transcripts encoding noggin were detected in both the crest-derived and noncrest-derived populations of cells. C, Transcripts encoding chordin and follist at in were detected in the whole fetal bowel as early as E12. Expression of β-actin(A, C) was investigated to semiquantitatively normalize RNA. ad, Adult.
BMP-4 induces the phosphorylation and nuclear translocation of Smad-1 in both crest- and noncrest-derived cells
Signal transduction after the activation of BMP receptors is associated with the phosphorylation and nuclear translocation of receptor-activated Smad proteins (Cho and Blitz, 1998; ten Dijke et al., 2002). The ability of BMP-2 or BMP-4 to induce the phosphorylation and nuclear translocation of Smad-1, which is phosphorylated by activated type I BMPRs, was therefore investigated immunocytochemically to determine whether the BMP receptors expressed in the bowel are functional and to identify BMP-responsive cells in the fetal gut. Experiments were performed with crest-derived and noncrest-derived cells from the E12 bowel isolated, respectively, by positive and negative immunoselection. The isolated populations were maintained in culture for 6 d in the presence of GDNF (10 ng/ml) to prevent the potential loss of Ret-dependent crest-derived cells. The maintenance medium (BBM) was then replaced for 6 hr with a similar medium that lacked GDNF, insulin, basic fibroblast growth factor, and epidermal growth factor to minimize possible interference with Smad translocation evoked by ongoing activity in the ERK pathway (Kretzschmar et al., 1997). The cultured cells were then exposed for 1 hr to vehicle, BMP-2, or BMP-4 (10 ng/ml) or BMP-4 in the presence of noggin (100 ng/ml). After fixation, activated Smad-1 was located in the isolated cells by using antibodies specific for phosphorylated Smad-1 (Smad-1P).
In cultures of crest-derived cells exposed to BMP-4, Smad-1P immunoreactivity was found to be concentrated in the nuclei of process-bearing cells (Fig. 4A,L). No nuclear Smad-1 immunoreactivity was seen in the flat, non-neuronal cells of the cultures (Fig. 4A). In contrast, very little Smad-1P immunoreactivity could be seen in cultures of crest-derived cells exposed only to vehicle, and the little that was observed was diffusely cytoplasmic (Fig. 4B,L). The intense concentration of Smad-1P immunoreactivity in the nuclei of process-bearing cells induced by BMP-4 was antagonized by adding noggin to the cultures of crest-derived cells simultaneously with BMP-4 (Fig. 4C,L). Isolated noncrest-derived cells were also BMP responsive in vitro. In cultures of these cells, exposed to BMP-2 or BMP-4, Smad-1P immunoreactivity was concentrated in the nuclei of large cells identified as belonging to the smooth muscle lineage by their coexpression of SMA immunoreactivity (Fig. 4 D-G,M). In contrast, little Smad-1P immunoreactivity was observed in cultures of noncrest-derived cells exposed only to vehicle, although some Smad-1P immunoreactivity was found in small cytoplasmic vesicles of SMA-immunoreactive cells (Fig. 4H-K,M). These data support the idea that precursor cells of both crest and non-neural crest origin respond to BMP-2 and BMP-4. The BMP-2 and BMP-4-responsive noncrest-derived cells are developing as smooth muscle.
Figure 4.

Phosphorylation and nuclear translocation of Smad-1 occurs when either isolated crest- or noncrest-derived cells are exposed to BMP-2 or BMP-4. Crest- and noncrest-derived cells were isolated from the fetal bowel at E12 by positive and negative immunoselection with antibodies to p75NTR. A, Isolated crest-derived cells exposed to BMP-4. Smad-1P immunoreactivity is strikingly evident in the nuclei of subsets of process-bearing cells (arrows). B, Isolated crest-derived cells exposed to vehicle. No Smad-1P immunoreactivity is discernible in the nuclei of process-bearing cells (arrows). C, Isolated crest-derived cells exposed to BMP-4 and noggin. The addition of noggin has inhibited the effect of BMP-4 (compare with A; see also L). D-G, Isolated noncrest-derived cells exposed to BMP-2. Cells developing in a smooth muscle lineage are marked by the immunocytochemical demonstration of SMA. D, Smad-1P immunoreactivity. E, SMA immunoreactivity. F, Merged image (Smad-1P/SMA immunoreactivities). G, Bisbenzamide (DNA). Smad-1P immunoreactivity is strikingly evident in the nuclei of subsets of SMA-immunoreactive cells (arrows). H-K, Isolated noncrest-derived cells exposed to vehicle. H, Smad-1P immunoreactivity. I, SMA immunoreactivity. J, Merged image (Smad-1P/SMA immunoreactivities). K, Bisbenzamide (DNA). No immunoreactivity is discernible in the nuclei of SMA-immunoreactive cells (arrows).
BMP-2 and BMP-4 promote in vitro development of neurons from crest-derived precursors isolated at E12
To determine whether BMP-2 and BMP-4 affect the in vitro development of neurons, crest-derived cells were immunoselected from the E12 fetal rat gut. This age was selected because enteric crest-derived cells proliferate at this time in response to GDNF and the cells are not yet responsive to late-acting growth factors such as NT-3 (Chalazonitis et al., 1998b); moreover, crest-derived cells isolated from the fetal bowel at E12 were found to respond to BMP-2 and BMP-4. Precursors were initially exposed to a BMP for 6 d, after which the immunocytochemical demonstration of PGP9.5 (Wilkinson et al., 1989) was used to mark cells committed to a neuronal lineage.
Neuronal development
At low concentrations, both BMP-2 and BMP-4 (0.1-1.0 ng/ml) increased the number of neurons per culture (Fig. 5A). In this concentration range, the effect of BMP-2 was significantly greater than that of BMP-4, and the effects of both were significantly greater than that of their vehicle (control). At high concentrations (50-100 ng/ml), however, neither BMP increased the number of neurons (Fig. 5A). Whereas the number developing in the presence of the high concentrations of BMP-2 did not differ significantly from that found in cultures exposed only to vehicle, significantly fewer neurons were found in cultures exposed to high concentrations of BMP-4.
Figure 5.

BMP-2 and BMP-4 promote neuronal development-survival in a concentration-dependent manner. Crest-derived cells were isolated from the E12 gut with antibodies to p75NTR and cultured for 6 d in the presence of vehicle (control), low (0.1-1.0 ng/ml), or high (50-100 ng/ml) concentrations of BMP-2 or BMP-4. A, Number of neurons per culture expressed as a percentage of vehicle (5.4 ± 0.6 × 10³; 13 cultures). At low concentrations, both BMP-2 and BMP-4 enhance the development of neurons. The effect of BMP-2 is significantly greater than that of BMP-4. At high concentrations, BMP-2 no longer promotes neuronal development and BMP-4 significantly inhibits the development of neurons. B, Total numbers of cells per culture expressed as a percentage of vehicle (103.5 ± 5.4 × 10³; 13 cultures); this measure includes non-neuronal cells. At low concentrations, the number of cells per culture is reduced by BMP-4 but not by BMP-2. At high concentrations, both BMP-2 and BMP-4 significantly decrease the total number of cells per culture; however, neither reduces cell numbers more than low concentrations of BMP-4. C, Neurons as a proportion of total cells per culture. The proportion of cells developing-surviving as neurons is increased by high and low concentrations of BMP-2 and low concentrations of BMP-4. D, Time dependence. The increase in the number of neurons per culture in response to BMP-4, expressed as a percentage of the number after 2 d of incubation in the presence of vehicle (1.0 ± 0.2 × 10³; 5 cultures). Note that, although BMP-4 promotes the development-survival of neurons at 2 d, the number of neurons in cultures exposed to high concentrations of BMP-4 declines significantly by 4 d in vitro (p < 0.01) and is, by 6 d, less than that seen in cultures exposed only to vehicle. The response to low concentrations of BMP-4 also declines significantly by 4 d in vitro (p < 0.05). ns, Not significant.
Total cells
Both BMPs reduced the total number of cells in cultures of crest-derived cells. BMP-4 was more potent than BMP-2 (Fig. 5B). A significant reduction in total cell numbers occurred even in cultures exposed to low concentrations of BMP-4, and no additional reduction was achieved by exposing cells to high concentrations of this BMP. In contrast, a reduction in cell numbers was only seen when cultures were exposed to high concentrations of BMP-2.
Neurons as a proportion of total cells
Because BMPs affected both the number of neurons (Fig. 5A) and the total number of cells per culture (Fig. 5B), neuronal numbers were normalized as a proportion of the total cells in each culture (Fig. 5C). This normalization revealed that the ability of BMP-2 to promote the development-survival of neurons was greater at higher than at lower concentrations, whereas the opposite was true of BMP-4. In fact, the proportion of surviving cells that were neurons was not significantly different in cultures exposed to high concentrations of BMP-4 than in cultures exposed only to vehicle. These data suggest that E12 enteric crest-derived precursors respond to BMP-2 and BMP-4 in both their development as neurons and their proliferation or survival. The two factors differ in the concentrations at which they exert their maximal effects.
BMP-4 effects on neuronal numbers is time dependent
The in vitro effects of BMPs are often transient (Pisano et al., 2000; Gomes and Kessler, 2001); therefore, because of the apparent failure of high concentrations of BMP-4 to promote neuronal development (after 6 d), the time-action relationship of the BMP-4 response was examined. The proportion of neurons developing in vitro was determined after 2, 4, and 6 d of exposure in vitro to low or high concentrations of BMP-4 (Fig. 5D). Both concentrations of BMP-4 increased the number of neurons after 2 d of exposure; however, this increase disappeared after 4 d, and high concentrations of BMP-4 caused a loss of neurons after 6 d. It is likely that the decline in neurons after a prolonged exposure to a high concentration of a BMP is attributable to the induction of apoptosis. The proportion of E12 crest-derived cells that were apoptotic (assessed by DNA fragmentation after bisbenzamide staining) in cultures exposed for 6 d to high concentrations of BMP-2 (9.3 ± 1.0%) was significantly higher (p < 0.01) than in cultures of cells exposed for the same time to vehicle (5.5 ± 0.7%). Crest-derived cells isolated at E14 continue to be susceptible to the proapoptotic effects of BMPs. The proportion of apoptotic cells (assessed by the TUNEL method) in cultures of E14 crest-derived cells, similarly exposed to high concentrations of BMP-2 (32.0 ± 2.8%) or BMP-4 (34.5 ± 7%), were each significantly higher (p < 0.001) than in cultures exposed to vehicle (14.7 ± 1.6%). These data suggest that both low and high concentrations of BMP-4 promote the development-survival of neurons; however, because the increase in neuronal numbers is only evident for a relatively short period of time, promotion of neuronal development can escape observation if cultures are examined too long after the initial exposure of precursors to a BMP.
Because the effects of the BMPs on neuronal development are exquisitely concentration dependent, local BMP concentrations in the gut wall must be tightly regulated. The necessity of maintaining a physiologically correct BMP concentration in the microenvironment of primordial enteric ganglia could explain the expression in the fetal bowel of the BMP antagonists, which sequester and thus restrict the diffusion of extracellular BMPs.
A concentration-dependent interaction of BMPs with GDNF regulates enteric neuronal development
GDNF is expressed in the developing bowel even before it is colonized by cells from the neural crest (Suvanto et al., 1996) and is essential for the development of enteric neurons below the level of the esophagus (Schuchardt et al., 1994; Moore et al., 1996; Pichel et al., 1996; Sánchez et al., 1996; Taraviras and Pachnis, 1999). All crest-derived neuronal precursors in the murine bowel express Ret at E12-E14 (Young et al., 1999, 2003). At E12, moreover, GDNF stimulates proliferation of enteric crest-derived cells (Chalazonitis et al., 1998b; Heuckeroth et al., 1998). All of the crest-derived cells that are immunoselected from the E12 bowel have been exposed previously to GDNF; however, because GDNF is produced by the enteric mesenchyme, the isolation of crest-derived cells would withdraw them from GDNF, unless GDNF were to be added to the culture medium. To obtain a more physiological in vitro approximation of the conditions under which BMP-2 or BMP-4 act in situ, therefore, the effects of the BMPs on the development of enteric neurons were reinvestigated in the presence of GDNF (10 ng/ml). Like Ret, BMPRs are expressed by immunoselected crest-derived cells (Fig. 2C), and BMPs activate Smad-1P in most isolated crest-derived cells (Fig. 4A,L); therefore, the effects of BMPs and GDNF on these cells would be expected to be interactive. The immunocytochemical demonstration of PGP9.5 was again used as a marker of cells committed to a neuronal lineage. DNA fragmentation and pyknosis were also examined in bisbenzamide-stained preparations to evaluate dead or dying cells. The effects of GDNF were examined after 2-6 d in vitro, in preparations exposed only to GDNF (control) and in those exposed to GDNF in combination with BMP-2 or BMP-4. Low (0.1-1.0 ng/ml) and high (50-100 ng/ml) concentrations of the BMPs were investigated separately.
As expected (Chalazonitis et al., 1998b; Hearn et al., 1998), exposure of E12 enteric crest-derived cells to GDNF for 6 d increased the development-survival of neurons (Fig. 6A). The combination of GDNF with low concentrations of BMP-4 for 6 d further enhanced neuronal development-survival (Fig. 6A). The effects of combining GDNF with low or high concentrations of BMP-2 or a high concentration of BMP-4, however, were not significantly different from those exerted by GDNF alone (Fig. 6A). In the absence of GDNF, the ability of BMP-2 and particularly BMP-4 to promote the development-survival of neurons decreases at high concentrations (Fig. 5A). This loss of efficacy is time dependent and is not seen after short exposures (Fig. 5D). GDNF partially protected against the decrease in neuronal development-survival associated with exposure for 6 d to high concentrations of the BMPs (Fig. 6A) (compare also Figs. 5D, 6B); moreover, when GDNF was combined with high concentrations of BMP-4, significantly more neurons developed after 2 d than after 6 d of exposure (Fig. 6B).
Figure 6.
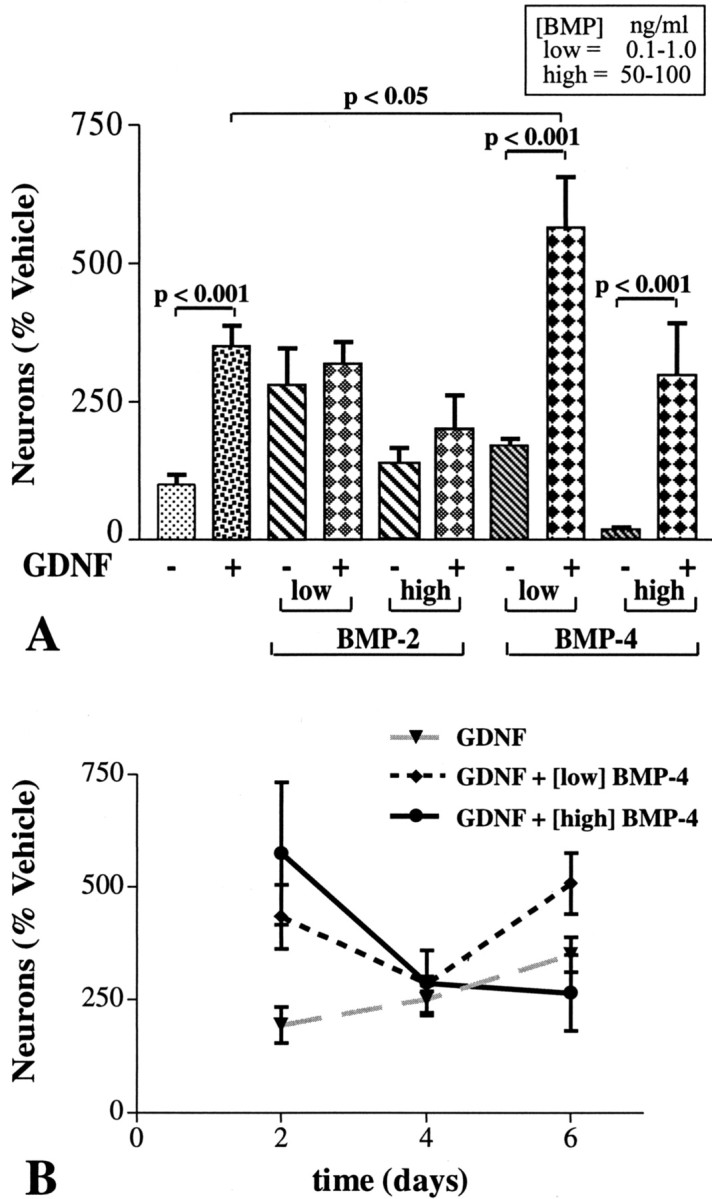
BMP-4 and GDNF interact. A, Number of neurons per culture at 6 d expressed as a percentage of vehicle (9.9 ± 1.9 × 10³; 12 cultures). Exposure to GDNF (10 ng/ml) promotes neuronal development in vitro. This effect is enhanced when GDNF is combined with low concentrations of BMP-4 but not by either low or high concentrations of BMP-2 or a high concentration of BMP-4. When combined with high concentrations of BMP-2 or BMP-4, GDNF partially protects against the high BMP-associated decrease in neuronal development. B, Time-action relationship of the effects of low and high concentrations of BMP-4 in the presence of GDNF. Data from five cultures at each condition are normalized to the number of neurons per culture exposed only to GDNF for 2 d (4.6 ± 0.8 × 10³). Note that, at 2 d, the response to the combination of GDNF with high concentration of BMP-4 is greater than that to GDNF alone. The enhanced response to the combination of factors diminishes as a function of time in culture.
At low concentrations, BMP-2 was more effective than BMP-4 in promoting neuronal development-survival (Figs. 5A, 6A); nevertheless, when combined with GDNF, only BMP-4 promoted development-survival more than GDNF alone (Fig. 6A). Cell death was thus investigated to determine whether it could account for the differing effects of the two BMPs. The combination of GDNF with a low concentration of BMP-2 induced a great deal of cell death [to 13.7 ± 2.8%; p < 0.01 vs vehicle (6.4 ± 0.8%); p < 0.02 vs a low concentration of BMP-2 alone (5.3 ± 0.6%) or GDNF alone (5.2 ± 0.9%)]. No such increase in the proportion of dead or dying cells was seen when GDNF was combined with BMP-4. In fact, the proportion of dead-dying cells in cultures exposed to the combination of GDNF with a low concentration of BMP-4 (3.4 ± 0.6%) was less than that found in cultures exposed only to low concentrations of BMP-4 (9.2 ± 0.7%; p < 0.001) or to vehicle (6.4 ± 0.8%; p < 0.02). It is thus possible that the combination of GDNF and BMP-2 does not increase the development and/or survival of neurons beyond the level attained by exposure to GDNF alone because the combination of factors provides excessive stimulation that activates transduction pathways leading, in many cells, to death rather than differentiation (Liu and Greene, 2001).
BMP-2 and BMP-4 induce enteric neurons to aggregate in vitro
High concentrations (20-50 ng/ml) of both BMP-2 and BMP-4 were found to induce neurons developing in vitro from E12 immunoselected precursors to aggregate into clusters that mimicked the appearance of small ganglia (Fig. 7). This aggregation did not occur in the absence of BMPs (Fig. 7A), was evident in their presence after as short a time as 2 d (Fig. 7B), and was maximal after 4 d of incubation (Fig. 7C). Neuronal aggregates persisted after 6 d (Fig. 7D); however, at this time, in the presence of BMP-4, few surviving neurons remained (see above). The small ganglion-like clusters of neurons were more abundant when GDNF was combined with BMP-2 or BMP-4 and persisted through 6 d of growth in vitro (Fig. 7E,F). It is possible that the BMP-2- and BMP-4-induced and the GDNF-induced aggregation (Chalazonitis et al., 1998b) of developing neurons is concomitant with the expression of polysialylated neural cell adhesion molecules by enteric neurons (Faure et al., 2003).
Figure 7.

BMP-2 and BMP-4 promote the aggregation of enteric neurons that develop in vitro. Crest-derived cells immunoselected from the E12 bowel with antibodies to p75NTR were cultured in serum-free media supplemented with vehicle, BMP-4 (50 ng/ml), BMP-2 (50 ng/ml), or these BMPs in combination with GDNF (10 ng/ml). Neurons were demonstrated immunocytochemically with antibodies to PGP9.5. A, Vehicle (6 d in vitro). B, BMP-4 (2 d in vitro). C, BMP-4(4dinvitro).D, BMP-4(6dinvitro).E, BMP-4 plus GDNF(6dinvitro).F, BMP-2 plus GDNF (6 d in vitro). Scale bar: A-E, 50 μm; F, 50 μm.
BMP-2 and BMP-4 promote the expression of TrkC and acquisition of dependence on NT-3
Because of the observations described above, experiments were performed to determine whether BMP-2 and BMP-4 promote the specification of particular sublineages of enteric neurons. The issue is particularly important in the development of the ENS in which the phenotypic diversity of component neurons exceeds that seen anywhere else in the PNS (Gershon, 1998; Newgreen and Young, 2002a,b). One sublineage of enteric neurons is defined by its expression of TrkC and dependence on NT-3 (Chalazonitis et al., 1994, 1998b, 2001). Crest-derived cells isolated from the fetal rat bowel at E12 do not respond to NT-3; however, they do so at E14 when transcripts encoding TrkC can also be demonstrated (Chalazonitis et al., 1994, 1998b, 2001). Studies were thus performed to determine whether in vitro exposure to BMP-2 or BMP-4 accelerates the timing of TrkC expression and the acquisition of responsiveness to NT-3. Crest-derived precursors were isolated with antibodies to p75NTR from the fetal rat bowel at E12 and E14 and cultured for 4-5 d in the presence of vehicle (control), BMP-2 (20 ng/ml), or BMP-4 (20 ng/ml). Cultures were also maintained with or without NT-3 (40 ng/ml) because of the known dependence of TrkC-expressing neurons on NT-3 for survival (Chalazonitis et al., 2001). Expression of MAP1b (microtubule-associated protein 1b; also called MAP5) was used as a marker for maturing neurons (Tucker and Matus, 1988).
E12
In cultures exposed only to vehicle, the proportion of TrkC-expressing neurons developing from precursors immunoselected from the bowel at E12 was quite low and was not significantly changed by exposure to NT-3 (Figs. 8A, 9A-C). In contrast, both BMP-2 and BMP-4 significantly increased the proportion of TrkC-expressing neurons in these cultures (Figs. 8A, 9D-F). When NT-3 was combined with BMP-2 or BMP-4, the proportion of TrkC-expressing neurons in cultures did not differ significantly from that seen in the presence only of the respective BMP (Fig. 8A).
Figure 8.

BMP-2 and BMP-4 promote the expression of TrkC and the acquisition of dependence on NT-3 for survival. A, TrkC-immunoreactive neurons expressed as a percentage of total cells per culture exposed only to vehicle (121.9 ± 34.7 × 10³; 3 cultures). Crest-derived cells were immunoselected from the bowel at E12 and maintained invitrofor 4-5 d. TrkC expression was determined immunocytochemically. BMP-2 and BMP-4 (20 ng/ml) increase the proportion of TrkC-expressing neurons in the cultures, but NT-3 (40 ng/ml) does not. B, Crest-derived cells were immunoselected from the bowel as in A, but at E14, and maintained similarly. Data were normalized to the total number of cells per culture exposed only to vehicle (287.9 ± 32.5 × 10³; 13 cultures). NT-3 increases the proportion of TrkC-expressing neurons; this increase is significantly greater when NT-3 is combined with BMP-2 or BMP-4. Note that the BMP-2- or BMP-4-associated increases in TrkC expression are greater at E12 (A) than at E14. C, Withdrawal of NT-3. Crest-derived cells were obtained at E14 (as in B) and cultured for an initial period of 4 d. They were then maintained for an additional 18 hr with or without NT-3. Data were normalized to the total number of TrkC-immunoreactive neurons in the cultures in each of the indicated conditions. (The total of TrkC-immunoreactive neurons per culture in these experiments ranged from 5.9 × 10³ to 28.0 × 10³.) When NT-3, rather than vehicle, was present throughout incubation, TrkC-expressing neurons were significantly protected from apoptosis (†); moreover, the proportion of TrkC-expressing neurons exhibiting apoptosis was significantly greater when NT-3 was withdrawn (-) during the follow-up period (*). The inclusion of NT-3 with BMP-2 or BMP-4 decreased the proportion of TrkC-expressing neurons exhibiting apoptosis but enhanced the magnitude of apoptosis that accompanied the 18 hr withdrawal of NT-3 (*). D, Rescue from apoptosis by NT-3. Crest-derived cells were obtained at E14 (as in C) and cultured for an initial period of 2 d. They were then maintained for an additional 2 d with or without NT-3. Data were normalized to the total number of TrkC-immunoreactive neurons in the cultures in each of the indicated conditions. The total of TrkC-immunoreactive neurons per culture ranged from 2.9 × 10³ to 14.5 ± 1.2 × 10³. The presence of BMP-2 or BMP-4 during the initial period of incubation increased the proportion of TrkC-expressing neurons undergoing apoptos is during a subsequent period of incubation in the absence of NT-3. This increase was prevented when NT-3 was present during the follow-up period of incubation (*). ns, Not significant.
Figure 9.

BMP-2 and BMP-4 promote the in vitro development of TrkC-immunoreactive neurons. Crest-derived cells were immunoselected from the gut at E12 or E14 and cultured as described in Figure 8, A and B. TrkC immunoreactivity (Alexa 594 fluorescence) is illustrated in A, D, G, and J. The immunoreactivity of the neuronal marker MAP1b (Alexa 488 fluorescence) is illustratedinB, E, H, andK. The merged images are shown inC, F, I, and L. A-C, Crest-derived cells were immunoselected at E12 and cultured in the presence of NT-3. There is little TrkC immunoreactivity. D-F, Cells were immunoselected at E12, but they were cultured in the presence of BMP-2 plus NT-3. TrkC-immunoreactive aggregates of cells are now abundant. Partial colocalization of TrkC immunoreactivity and MAP1b occurs. G-I, Crest-derived cells were immunoselected at E14 and cultured in the presence of NT-3. TrkC immunoreactivity is now abundant (compare with A). J-L, Crest-derived cells were immunoselected at E14 and cultured in the presence of BMP-4 plus NT-3. TrkC immunoreactivity is still more abundant than in cultures supplemented only with NT-3, and the aggregates of TrkC-immunoreactive cells are more tightly clustered into miniganglia. Colocalization of TrkC immunoreactivity with that of MAP1b is nearly complete. Scale bars, 50 μm.
E14
When crest-derived cells were immunoselected from the gut at E14 instead of E12, exposure to NT-3 now led to a significant increase in the proportion of TrkC-expressing neurons (Fig. 8B, 9G-I). Exposure of E14 crest-derived cells to BMP-4 increased the proportion of TrkC-expressing neurons (Fig. 8B); however, the BMP-2-induced increase in TrkC-expressing neurons failed to reach statistical significance. When NT-3 was combined with BMP-2 or BMP-4, the proportion of TrkC-expressing neurons was significantly increased over that developing in the presence of NT-3 alone; moreover, the response of the crest-derived cells to the combination of NT-3 with BMP-2 was also greater than that to BMP-2 alone (Figs. 8B, 9J-L). In general, the capacity of crest-derived cells to give rise to TrkC-expressing neurons in response to exposure to BMP-2 or BMP-4 was lower at E14 (Fig. 8B) than at E12 (Fig. 8A) (p < 0.001). The precocious appearance of TrkC-expressing neurons evoked by BMP-2 or BMP-4 is consistent with the hypothesis that BMP-2 and BMP-4 shift the development of enteric crest-derived cells toward a TrkC-expressing sublineage. The observations that TrkC and MAP1b expression are only partially coincident in cultures exposed to BMPs at E12 but almost complete at E14 suggest that, in the presence of BMPs, cells in the lineage that ultimately is recognized by MAP1b express TrkC when they are still immature and not yet MAP1b immunoreactive.
NT-3 dependence
The idea that BMP-2 and BMP-4 shift the development of enteric crest-derived cells toward a TrkC-expressing sublineage predicts that BMP-2 and BMP-4 would, in the absence of NT-3, promote apoptosis in TrkC-expressing neurons. The TUNEL method was used to quantify apoptosis to test this hypothesis (in the NT-3-responsive crest-derived cells immunoselected at E14). Cells were cultured for 4 d with or without BMP-2 or BMP-4, in the presence or absence of NT-3, and the effects of subsequent NT-3 withdrawal (for 18 hr) were analyzed (Fig. 8C). The ability of NT-3 to rescue TrkC-expressing neurons from apoptosis was also examined (Fig. 8D). Cells were cultured for 2 d with or without BMP-2 or -4 and with or without NT-3 and then maintained without BMPs, but with or without NT-3, for an additional 2 d.
The occurrence of apoptosis in TrkC-expressing neurons cultured in the presence of NT-3 was significantly less than that found in vehicle-treated cultures (p < 0.02) (Fig. 8C); however, the withdrawal of NT-3 from the cells that had been exposed previously to it substantially increased apoptosis in TrkC-expressing neurons (p < 0.001). The proportion of TrkC-expressing neurons undergoing apoptosis was lower in cells maintained in the presence of BMP-2 or BMP-4 in combination with NT-3 than in cultures of cells exposed singly to vehicle, NT-3, or BMP-2 or BMP-4 (p < 0.001) (Fig. 8C). Again, when NT-3 was withdrawn from cultures initially maintained with BMP-2 or BMP-4 plus NT-3, apoptosis increased dramatically (p < 0.001). The increase in apoptosis was much more severe when NT-3 was withdrawn from cells maintained in the presence of BMP-2 or BMP-4 plus NT-3 (an increase of 277 and 285%, respectively) than from cells maintained only in the presence of NT-3 (an increase of 85%). This observation suggests that provision of NT-3 should rescue neurons that have been cultured with BMP-2 or BMP-4 from the apoptosis induced by NT-3 withdrawal. That suggestion was confirmed (Fig. 8D). When crest-derived cells, which were cultured for 2 d with BMP-2 or BMP-4 or with BMP-2 plus NT-3, were subsequently cultured for 2 d with or without NT-3, apoptosis was greater in the cultures that lacked NT-3 during the follow-up period (p < 0.001). These data support the conclusion that, by promoting the development of TrkC-expressing neurons, BMP-2 and BMP-4 also make their survival NT-3 dependent.
BMP-2 and BMP-4 time dependently promote development of smooth muscle from noncrest-derived cells
Because BMPRs were found in noncrest-derived as well as in crest-derived cells and BMP-2- and BMP-4-induced nuclear translocation of phosphorylated Smad-1 in both, we tested the ability of BMP-2 and BMP-4 to influence the development of smooth muscle, which in the gut is entirely of mesodermal origin. BMP-4 has also been reported to enhance smooth muscle development in the gut of early avian embryos (Roberts et al., 1995, 1998, 2000; Sukegawa et al., 2000). Noncrest-derived cells were isolated from E12 and E14 bowel by negative immunoselection with antibodies to p75NTR. The cells were then cultured as above for 6 d in the presence of vehicle, BMP-2, or BMP-4 (20 ng/ml). SMA immunoreactivity was used as a smooth muscle marker, and the total number of cells in each culture was determined by counting nuclei stained with bisbenzamide. In cultures of cells isolated at E12, BMP-2 increased the proportion of SMA-immunoreactive cells to 86.5 ± 3.7 (n = 7) from 59.5 ± 3.8% in cultures exposed to vehicle (p < 0.001). Similar results were obtained in two experiments with BMP-4 in which the proportion of SMA-immunoreactive cells was increased to 64 and 94%. The proportion of SMA-immunoreactive cells in vehicle-exposed cultures of cells isolated at E14, 37.7 ± 7.5%, was significantly lower than at E12 (p < 0.03); moreover, the BMP-4-induced increase (to 54.9 ± 6.4%; three cultures) in the proportion of SMA-immunoreactive cells in cultures of the E14 noncrest-derived cells did not achieve statistical significance. These data suggest that BMP-2 and BMP-4 promote the development of smooth muscle from noncrest-derived cells. This effect is age dependent. It is possible that precursor cells that are not induced to develop as smooth muscle between E12 and E14 develop along another lineage, conceivably by default, and lose their ability to develop as smooth muscle and/or they may respond differently to BMP-2 or BMP-4.
Enteric neuronal hyperplasia occurs in mice that overexpress noggin
In vitro data described above are consistent with the ideas that BMP-2 and/or BMP-4 affect the development of enteric neurons at E12-E14 and that they specifically enhance development of enteric neurons that express TrkC. To determine whether BMP-2 and BMP-4 physiologically regulate development of enteric neurons and their expression of TrkC, we quantified the total number of neurons and that of the TrkC-expressing subset in the intestines of transgenic mice that overexpress the BMP antagonist noggin (Guha et al., 2004). Noggin overexpression was directed to neurons by using the NSE promoter to drive expression of a bicistronic noggin-IRES-EGFP transgene. NSE is expressed by mature neurons but not by their uncommitted crest-derived precursors (Schmechel et al., 1980; Baetge et al., 1990b). The overexpression of noggin in the bowel of NSE-noggin mice would thus not be expected to occur until neurons begin to appear in the gut. Because new neurons continue to be added to the ENS from E12 through the first month of postnatal life (Pham et al., 1991), the overexpression of noggin by early-developing neurons would be expected to interfere with BMP-mediated effects on the development of the large number of enteric neurons that are generated after the start of neurogenesis.
Initial experiments were performed to verify that noggin was indeed overexpressed in the ENS of the transgenic mice. Expression of EGFP was detectable by RTPCR in the bowel of the NSE-noggin but not wild-type mice (Fig. 10A). Expression of mRNA encoding noggin, analyzed semiquantitatively, also appeared to be greater in transgenic than in wild-type animals (Fig. 10A). Enhanced noggin expression in the transgenic mice was confirmed by Western analyses (Fig. 10B). EGFP fluorescence was observed in subsets of neurons in both the submucosal and myenteric plexuses of NSE-noggin mice (Fig. 10C), confirming that the transgene was expressed in enteric neurons. EGFP was also found in enteroendocrine cells at the bases of intestinal crypts (data not illustrated). In contrast, only autofluorescence was observed in neurons or epithelial cells in wild-type mice.
Figure 10.

Noggin is overexpressed in the ENS of transgenic NSE-noggin mice. A, RT-PCR. Transcripts encoding noggin and IRES-GFP were analyzed at P11 in the intestines of three transgenic mice (Tg) and three of their wild-type (Wt) littermates. More mRNA encoding noggin is detected in the bowel of the transgenic mice than in the wild-type animals. Expression of IRES-GFP is detectable in the gut of the transgenic animals but not in the bowel of their wild-type littermates. B, Western analysis. Noggin immunoreactivity was demonstrated in the brain (Br) of a wild-type mouse (examined as a positive control) and in the intestines of transgenic and wild-type animals. More noggin immunoreactivity is present in the gut (Gut) of transgenic than wild-type mice. C, GFP fluorescence in myenteric neurons of a homozygous transgenic mouse at P29. No fluorescence can be seen in enteric neurons in similar preparations of the bowel of wild-type littermates. Enteric neurons thus express the NSE-noggin transgene. Scale bar, 50 μm.
The total number of neurons in the myenteric and submucosal plexuses was estimated in the mature bowel by counting neurons stained selectively with cuprolinic blue (Heinicke et al., 1987; Karaosmanoglu et al., 1996) in flat laminar preparations of submucosa and longitudinal muscle with attached myenteric plexus. The neuronal density was quantified separately for duodenum, jejunum, and ileum in seven wild-type and 15 NSE-noggin mice (11 heterozygotes and four homozygotes). The number of neurons was significantly greater in NSE-noggin than in wild-type animals in both plexuses and in all three regions of the small intestine (Fig. 11) (p < 0.001). In the myenteric plexus, this increase was significantly greater in the homozygous than in the heterozygous NSE-noggin mice (p < 0.001). The increase in the number of neurons in the submucosal plexus, however, appeared to saturate with respect to gene dose in the duodenum and the ileum. Only in the jejunum was the number of submucosal neurons in the homozygous greater than in the heterozygous NSE-noggin animals (Fig. 11) (p < 0.05).
Figure 11.

The overexpression of noggin under the control of the NSE promoter in transgenic mice is associated with significant increases(atp <0.001 in both plexuses) in the number of neurons per square millimeter in the duodenum, jejunum, and ileum. Neuronal perikarya were stained with cuprolinic blue and counted. The quantitative data for the myenteric and submucosal plexuses for wild-type (WT), heterozygous (het), and homozygous (hom) NSE-noggin mice are shown in the graphs at the top of the figure, and representative fields from the proximal ileum of wild-type and homozygous NSE-noggin mice (NSE-Nog) are illustrated in the corresponding panels below the graphs. In myenteric plexus, the increase compared with WT is significantly greater hom > het (at p < 0.001). In submucosal plexus, the increase compared with WT saturates hom = het. Scale bars, 100 μm. ns, Not significant.
The observation that the in situ antagonism of BMP-2 and BMP-4 by noggin overexpression in the gut of transgenic mice increases the ultimate number of neurons developing in both enteric plexuses supports the idea that BMP-2 and BMP-4 physiologically regulate the development of enteric neurons. BMPs, however, act during both fetal development and postnatal life. The numbers of enteric neurons were therefore quantified at E18 in wild-type and NSE-noggin mice to determine whether the effect of the expression of the transgene is apparent close to the time when noggin overexpression begins or whether it is a time-linked cumulative phenomenon. Because of the small size of the gut at E18, the small intestine was not divided into regions but examined as a unit. The submucosal plexus is still forming at E18; therefore, the total number of neurons in the bowel wall (encompassing both plexuses) was determined. Neurons were identified by using the immunoreactivity of PGP9.5 as a marker (Wilkinson et al., 1989), because cuprolinic blue is not reliable as a neuronal marker in fetal tissue. Neuronal density was compared in three heterozygous NSE-noggin and three wild-type control mice. The number of neurons per square millimeter in the wild-type mice (1162 ± 49) was significantly less than that of the NSE-noggin animals (1389 ± 37) (p < 0.002). The ability of the transgenic expression of noggin, therefore, to increase the numbers of enteric neurons is already apparent before birth and is maintained into maturity.
The proportion of enteric neurons that express TrkC decreases in mice that overexpress noggin
The effect of noggin overexpression on the development of enteric neurons that express TrkC was investigated to determine whether the outcome of BMP-2 and BMP-4 regulation of the development of a particular subset of enteric neurons can be different from that of the set as a whole. Because BMP-2 and BMP-4 were found to promote development of TrkC-expressing neurons in vitro, their in situ antagonism might be expected to decrease the number and especially the proportion of TrkC-expressing neurons in the ENS of transgenic NSE-noggin mice, despite the increase in the total number of enteric neurons.
TrkC was demonstrated immunocytochemically in whole mounts of postnatal gut containing the submucosal and myenteric plexuses, and the numbers of TrkC-expressing neurons were quantified as described above. The density of TrkC-expressing neurons was quantified separately for duodenum, jejunum, and ileum in six wild-type and 11 NSE-noggin mice (seven heterozygotes and four homozygotes). Both the absolute density of TrkC-expressing neurons (data not shown) and the proportion of total neurons that express TrkC were found to be significantly lower in NSE-noggin than in wild-type mice (Fig. 12). The NSE-noggin-associated reduction in number and proportion of TrkC-expressing neurons was observed in both the submucosal and myenteric plexuses in all three regions of the small intestine (p < 0.001). The effect of noggin overexpression on the proportion of TrkC-expressing neurons was maximal in heterozygous NSE-noggin mice, and no additional reduction was detected in the homozygous animals.
Figure 12.
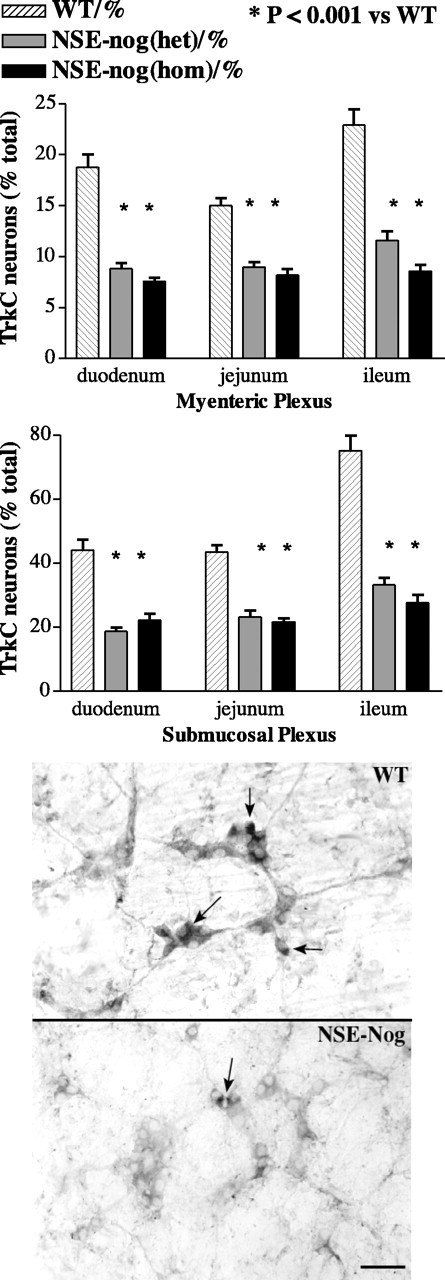
The overexpression of noggin under the control of the NSE promoter in transgenic mice is associated with significant decreases in the density and proportion of total neurons in the duodenum, jejunum, and ileum that express TrkC. Neuronal perikarya were immunostained with antibodies to TrkC and counted. The proportions of myenteric and submucosal neurons that express TrkC in wild-type (WT), heterozygous (het), and homozygous (hom) NSE-noggin mice (NSE-nog) are shown in the graphs at the top of the figure, and representative fields from the submucosal plexus in the proximal ileum of wild-type and homozygous NSE-noggin mice are illustrated in the corresponding panels below the graphs. Significance of decrease in TrkC neurons density and proportion of het and hom compared with WT occurs at p < 0.001 in both plexuses in all three regions of the intestine. The decrease is similar in het = hom except in the myenteric plexus of ileum in which hom > het. Arrows indicate the locations of TrkC-immunoreactive neurons. Scale bar, 50 μm.
Although the numbers and proportion of TrkC-expressing neurons were affected by noggin overexpression in all three regions of the postnatal small intestine, these neurons were not uniformly distributed in the gut of wild-type mice. More TrkC-expressing neurons were found in the ileum in both the submucosal and myenteric plexuses of wild-type mice than in the duodenum and jejunum (Fig. 12) (p < 0.001), and the proportion of submucosal neurons that express TrkC was observed to be approximately twofold to threefold that of the myenteric plexus in each region of the small intestine (p < 0.001). The effects of noggin overexpression obscured the regional difference in the proportion of TrkC-expressing neurons in each plexus; however, the pattern, in which the proportion of TrkC-expressing neurons was greater in the submucosal than in the myenteric plexus, persisted in the transgenic animals (p < 0.001).
The number of TrkC-expressing neurons was quantified in the small intestines of E18 wild-type and NSE-noggin (heterozygous) mice to determine whether the effects of the expression of the transgene on TrkC expression are apparent during fetal life as they are on the density of enteric neurons. TrkC immunoreactivity was compared in three heterozygous NSE-noggin and three wild-type control mice. The number of TrkC-expressing neurons per square millimeter in the wild-type mice (283 ± 14) was significantly greater than that of the NSE-noggin animals (164 ± 12) (p < 0.0001). The ability of the transgenic expression of noggin, therefore, to decrease the numbers of TrkC-expressing enteric neurons is already apparent before birth and, like that of the increase in the density of total neurons, is maintained into maturity. Whereas the size of the total population of ENS neurons thus rises as a result of BMP-2 and BMP-4 antagonism in the developing bowel, that of the subset defined by TrkC expression decreases. These data are compatible with the ideas that a physiological role of BMP-2 and BMP-4 is to promote the terminal differentiation of specific subsets of enteric neurons, such as those that express TrkC, at the expense of still-proliferating neuronal progenitors.
The size of the muscularis externa increases in mice that overexpress noggin
Because BMP-2 and BMP-4 affected the development of smooth muscle in vitro, the numbers of smooth muscle cells were quantified in both layers of the muscularis externa in the ileum of postnatal (1 month) and fetal (E18) NSE-noggin (homozygous and heterozygous) and wild-type mice. Both the circular and longitudinal muscle layers in postnatal mice were found to contain significantly more smooth muscle cells in postnatal homozygous and heterozygous NSE-noggin mice than in wild-type animals (Table 1). The effect of the expression of the transgene was maximal in heterozygous mice, and no difference was detected between homozygous and heterozygous mice in numbers of smooth muscle cells in either the circular or longitudinal muscle layers. The increased cellularity of the circular, but not the longitudinal muscle, was apparent as early as E18 (Table 1). The longitudinal muscle is just beginning to form at this age; therefore, the change in its cellularity has not yet become evident. The total area of the muscularis externa at E18 in heterozygous NSE-noggin mice (1.08 × 10⁵ ± 0.02 μm2; n = 10), however, is already significantly greater than that of wild-type animals (0.95 × 10⁵ ± 0.02 μm2; n = 10) (p < 0.0001).
Table 1.
Effects of transgenic noggin overexpression on the numbers of smooth muscle cells of the muscularis externa postnatal mice (1 month)
|
|
Circular muscle layera |
Longitudinal muscle layerb |
||||||||
|---|---|---|---|---|---|---|---|---|---|---|
|
|
Mean |
nc
|
p versus WT |
Mean |
nc
|
p versus WT |
||||
| Mouse | ||||||||||
| Wild type | 4.9 ± 0.2 | 36 | 16.2 ± 0.5 | 36 | ||||||
| Heterozygous NSE-noggin | 6.0 ± 0.1 | 25 | <0.0001 | 20.2 ± 0.8 | 25 | <0.0001 | ||||
| Homozygous NSE-noggin | 5.8 ± 0.2 | 25 | <0.0001 | 22.1 ± 0.7 | 25 | <0.0001 | ||||
| Fetal mice (E18) | ||||||||||
| Wild type | 4.1 ± 0.1 | 50 | 3.2 ± 0.1 | 50d | ||||||
| Heterozygous NSE-noggin |
4.6 ± 0.1 |
50 |
<0.0001 |
3.1 ± 0.1 |
50d
|
NS |
||||
WT, Wild type; NS, not significant.
Number of cells comprising the thickness of the layer. Counted along a line perpendicular to the long axis of the muscle cells.
Number of cross-sectioned profiles of cells found within a circumferential arc of 45 μm.
Number of pooled measurements from three wild-type, two heterozygous, and two homozygous mice.
Quantified as done for circular muscle.
Discussion
The hypothesis was tested that BMP signaling is not limited to mediating early events in gut organogenesis but also regulates the development of the ENS from crest-derived émigrés (Roberts et al., 1995, 1998; Roberts, 2000; Sukegawa et al., 2000). The colonization of the fetal murine bowel by cells from the vagal neural crest begins at E9-E9.5, although differentiated neurons cannot be detected until E12, when they appear in the foregut and then spread distally, reaching the terminal colon by E14-E15 (Rothman and Gershon, 1982; Rothman et al., 1984; Young et al., 1998, 1999, 2003). The rat gut is colonized similarly, but events transpire ∼1 d later (Baetge et al., 1990a). Transcripts encoding BMP-2 and BMP-4 but not BMP-7 were detected in the bowel at E12-E14, coinciding with the appearance of neurons. Both BMP-2 and BMP-4 (BMP-2 > BMP-4) continued to be expressed throughout development, and both were far more highly expressed in the fetal than the adult gut. The effects of BMP-4 on enteric neural crest-derived stem cells have also been reported to decrease as a function of age (Kruger et al., 2002). The enteric expression of the BMPs was accompanied by the simultaneous expression of their cognate receptors, BMPR-IA, BMPR-IB, and BMPR-II, and their antagonists, noggin, gremlin, chordin, and follistatin. Agonists, receptors, and antagonists all appeared to be expressed by both crest- and noncrest-derived cells. BMPs and their antagonists may thus be autocrine or paracrine signaling molecules in the gut. Because BMP signaling depends on precise regulation of local concentrations of ligands and antagonists (Cho and Blitz, 1998; Gurdon and Bourillot, 2001; von Bubnoff and Cho, 2001; Sela-Donenfeld and Kalcheim, 2002), the identification in the gut of all of the elements of the signaling pathway during neuron formation, suggests, but does not prove, that BMPs play roles in ENS development.
To define the effects of BMP-2 and BMP-4 on ENS precursors, these cells were immunoselected from the rat gut with antibodies to p75NTR at E12 and E14. BMP-2 or BMP-4 induced the nuclear translocation of phosphorylated Smad-1, indicating that ENS precursors are BMP responsive. Treatment of immunoselected E12 cells with low concentrations of BMP-2 or BMP-4 increased the numbers and proportions of neurons, suggesting that BMPs at low concentrations enhance the differentiation of neurons from enteric crest-derived cells. This observation is consistent with previous studies that have demonstrated neurogenic effects of BMPs on neural crest and CNS precursor cells (Mabie et al., 1999; Bixby et al., 2002; Mizuseki et al., 2003). At high concentrations, the abilities of both BMP-2 and BMP-4 to increase the generation of neurons was lost, although in the case of BMP-2, the proportion of neurons still increased because the total number of cells was reduced more than the number of neurons. BMP-4 was even more effective than BMP-2 in reducing the total numbers of crest-derived cells because of the induction of apoptosis. The concentration-related abilities of BMP-2 and BMP-4 to promote neuronal differentiation and reduce the size of the total population of crest-derived cells are consistent with the idea that, by inducing neuronal precursors to differentiate into postmitotic neurons, BMPs limit precursor proliferation in the gut and thus regulate the ultimate size of the ENS. These conclusions are consistent with previous observations that BMP signaling promotes exit from cell cycle and apoptosis of enteric precursors and other neural crest derivatives (Song et al., 1998; Pisano et al., 2000; Gomes and Kessler, 2001), as well as CNS progenitor cells (Furuta et al., 1997; Mabie et al., 1999).
The interaction of BMP-4 with GDNF supports the idea that BMPs limit the ultimate size of the ENS. When combined, as they probably are in vivo, a low concentration of BMP-4 and GDNF enhanced the development of neurons; however, when GDNF was combined with a high concentration of BMP-4, this effect was lost. GDNF stimulates the proliferation of neuronal precursors between E12 and E14 (Chalazonitis et al., 1998b). By inhibiting this proliferative effect, a high concentration of BMP-4 may thus restrict or regulate the extent of the GDNF-driven increase in neurons.
To determine the physiological significance of the in vitro observations, the effects of inhibiting BMP function in the gut were examined in animals that overexpress the BMP antagonist noggin under the control of the NSE promoter (Guha et al., 2004). The NSE promoter was selected to direct noggin overexpression in the gut to the developing ENS and to delay its occurrence until neurons begin to differentiate. This delay was intended to prevent transgenic noggin from interfering with early effects of the BMPs on the development of the radial axis, regionalization, or mesenchyme of the primordial bowel (Roberts et al., 1995, 1998; Roberts, 2000; Sukegawa et al., 2000). Because NSE is not expressed until after neurons have been specified (Schmechel et al., 1980), the transgenic overexpression of noggin under NSE control does not affect the colonization of the gut by crest-derived cells, their migration, or their initial differentiation into neurons.
The NSE promoter was effective in directing the overexpression of noggin to the developing bowel. Increased expression of transcripts encoding noggin, enhanced expression of noggin protein, and expression of the transgene in enteric neurons were all demonstrated in the gut of transgenic animals. The total number of neurons was increased in these animals by >50% in the myenteric plexus in all regions of the bowel and by 30-50% in the submucosal plexus. The increase in the size of the ENS was apparent by E18. The hyperplasia of the enteric nervous system in the NSE-noggin transgenic animals supports the conclusion that BMP signaling limits the size of the ENS.
BMP-2 and BMP-4 each increased the numbers of neurons that expressed TrkC and were NT-3 dependent. BMP signaling induced the precocious appearance of the TrkC-expressing lineage in cultures of immunoselected E12 precursors and increased the numbers of TrkC-expressing cells in both E12 and E14 cultures. BMP signaling also increased the dependence of this population of cells on NT-3 for survival. These observations correlate well with the decrease in the number and proportion of TrkC-expressing neurons observed in both plexuses of the noggin-overexpressing animals. These decreases were already apparent in the E18 fetal bowel. The decrease in this specific subpopulation in the ENS of transgenic mice is particularly striking because the total number of enteric neurons increased in the same animals. These observations are consistent with previous observations that BMP signaling promotes TrkC expression in dorsal root and sympathetic ganglia (Zhang et al., 1998) and that it induces dependence of these cells on NT-3 for survival (Song et al., 1998; Gomes and Kessler, 2001). BMP signaling thus not only regulates neuron numbers in the developing ENS but also contributes to the specification of neuronal sublineages, such as that which expresses TrkC, and is NT-3 dependent.
Additional effects of BMPs included inducing developing enteric neurons to aggregate in vitro into ganglion-like clusters. Early crest-derived cells enter the bowel in diffuse cords that gradually assemble into ganglia (Epstein et al., 1991). Conceivably, BMP-2 and BMP-4 facilitate this aggregation in situ. Consistent with this suggestion, BMP-2 and BMP-4 increase the expression of polysialylated neural cell adhesion molecules by enteric crest-derived cells (Faure et al., 2003). The effects of BMPs, moreover, were not limited to crest-derived cells. Noncrest-derived mesenchymal cells also expressed BMP receptors and exhibited BMP-induced nuclear translocation of Smad-1. At E12 but not E14, BMPs promoted smooth muscle differentiation. When BMP signaling was inhibited in vivo by the transgenic overexpression of noggin, however, smooth muscle cell numbers were increased in both layers of the muscularis externa. These observations are consistent with previous data that suggest that BMP-4 promotes smooth muscle differentiation early in enteric development (Roberts et al., 1995, 1998) but later inhibits it (Sukegawa et al., 2000). The early effect of BMP-4 fits well with the current in vitro observations and the later effect with the observations in NSE-noggin transgenic mice in which BMP antagonism is delayed until neurons start to differentiate. The increase in smooth muscle cell numbers, evident in NSE-noggin mice by E18, is likely to be attributable to antagonism of the late action of BMPs to restrict smooth muscle generation (Sukegawa et al., 2000). Both the developing ENS and the enteric mesenchyme, therefore, continue to be potential targets of the BMPs beyond the early period of organogenesis. The persistence of the BMP effect could account for the association of mutations in SIP1, a gene that encodes Smad interacting protein-1, with the development of congenital aganglionosis (Hirschsprung's disease) in human subjects (Wakamatsu et al., 2001). These mutations may interfere with BMP signaling in developing enteric nerve and muscle.
Footnotes
This work was supported by National Institutes of Health Grants DK58056(A.C.), NS15547(M.D.G.), and NS20013 and NS 20778 (J.A.K.). We thank Dr. Zhiheng Xu (Department of Pathology, Columbia University, New York, NY) for help with Western blots and Valerie Boone (Department of Anatomy and Cell Biology, Columbia University, New York, NY) for help with tissue culture. Critical reagents were supplied by Drs. M. Chao (Skirball Institute, New York University, New York, NY), A. Economides (Regeneron Pharmaceuticals, Tarrytown, NY), B. Hempstead (Cornell University, New York, NY), D. Kaplan (University of Toronto, Toronto, Canada), P. ten-Dijke (The Netherlands Cancer Institute, Amsterdam, The Netherlands), and P. Tsoulfas (University of Miami, Miami, FL). This paper is dedicated to the memory of the late Directeur de Recherche au Centre National de la Recherche Scientifique, Nicolas Chalazonitis.
Correspondence should be addressed to Dr. Alcmène Chalazonitis, Department of Anatomy and Cell Biology, Columbia University, 630 West 168th Street, New York, NY 10032. E-mail: ac83@columbia.edu.
Copyright © 2004 Society for Neuroscience 0270-6474/04/244266-17$15.00/0
F.D. and U.G. contributed equally to this work.
References
- Baetge G, Pintar JE, Gershon MD (1990a) Transiently catecholaminergic (TC) cells in the bowel of fetal rats and mice: precursors of noncatecholaminergic enteric neurons. Dev Biol 141: 353-380. [DOI] [PubMed] [Google Scholar]
- Baetge G, Schneider KA, Gershon MD (1990b) Development and persistence of catecholaminergic neurons in cultured explants of fetal murine vagus nerves and bowel. Development 110: 689-701. [DOI] [PubMed] [Google Scholar]
- Belliveau DJ, Krivko I, Kohn J, Lachance C, Pozniak C, Rusakov D, Kaplan D, Miller FD (1997) NGF and neurotrophin-3 both activate TrkA on sympathetic neurons but differentially regulate survival and neuritogenesis. J Cell Biol 136: 375-388. [DOI] [PMC free article] [PubMed] [Google Scholar]
- Bishop AE, Carlei F, Lee V, Trojanowski J, Marangos PJ, Dahl D, Polak JM (1985) Combined immunostaining of neurofilaments, neuron specific enolase, GFAP, and S-100. A possible method for assessing the morphological and functional status of the enteric nervous system. Histochemistry 82: 93-97. [DOI] [PubMed] [Google Scholar]
- Bixby S, Kruger GM, Mosher JT, Joseph NM, Morrison SJ (2002) Cell-intrinsic differences between stem cells from different regions of the peripheral nervous system regulate the generation of neural diversity. Neuron 35: 643-656. [DOI] [PubMed] [Google Scholar]
- Blaugrund E, Pham TD, Tennyson VM, Lo L, Sommer L, Anderson DJ, Gershon MD (1996) Distinct subpopulations of enteric neuronal progenitors defined by time of development, sympathoadrenal lineage markers, and Mash-1-dependence. Development 122: 309-320. [DOI] [PubMed] [Google Scholar]
- Burns AJ, Le Douarin NM (1998) The sacral crest contributes neurons and glia to the post-umbilical gut: spatiotemporal analysis of the development of the enteric nervous system. Development 125: 4335-4347. [DOI] [PubMed] [Google Scholar]
- Burns AJ, Le Douarin NM (2001) Enteric nervous system development: analysis of the selective developmental potentialities of vagal and sacral neural crest cells using quail-chick chimeras. Anat Rec 262: 16-28. [DOI] [PubMed] [Google Scholar]
- Chalazonitis A, Rothman TP, Chen J, Lamballe F, Barbacid M, Gershon MD (1994) Neurotrophin-3 induces neural crest-derived cells from fetal rat gut to develop in vitro as neurons or glia. J Neurosci 14: 6571-6584. [DOI] [PMC free article] [PubMed] [Google Scholar]
- Chalazonitis A, Tennyson VM, Kibbey MC, Rothman TP, Gershon MD (1997) The α-1 subunit of laminin-1 promotes the development of neurons by interacting with LBP110 expressed by neural crest-derived cells immunoselected from the fetal mouse gut. J Neurobiol 33: 118-138. [DOI] [PubMed] [Google Scholar]
- Chalazonitis A, Rothman TP, Chen J, Vinson EN, MacLennan AJ, Gershon MD (1998a) Promotion of the development of enteric neurons and glia by neuropoietic cytokines: interactions with neurotrophin-3. Dev Biol 198: 343-365. [PubMed] [Google Scholar]
- Chalazonitis A, Rothman TP, Chen J-X, Gershon MD (1998b) Age-dependent differences in the effects of GDNF and NT-3 on the development of neurons and glia from neural crest-derived precursors immunoselected from the fetal rat gut: expression of GFRα-1 in vitro and in vivo. Dev Biol 204: 385-406. [DOI] [PubMed] [Google Scholar]
- Chalazonitis A, Chen J, Rothman TP, Gershon MD (1999) Role(s) of bone morphogenetic proteins in the development of enteric neurons in the fetal rat: interaction with NT-3. Soc Neurosci Abstr 25: 1785. [Google Scholar]
- Chalazonitis A, Pham TD, Rothman TP, DiStefano PS, Bothwell M, Blair-Flynn J, Tessarollo L, Gershon MD (2001) Neurotrophin-3 is required for the survival/differentiation of subsets of developing enteric neurons. J Neurosci 21: 5620-5636. [DOI] [PMC free article] [PubMed] [Google Scholar]
- Chalazonitis A, Guha U, Pham TD, D'Autréaux F, Roman D, Rothman TP, Kessler JA, Gershon MD (2003a) BMPs-2 and-4 regulate neurogenesis and specification of TrkC-expressing/NT-3-dependent neurons in the enteric nervous system (ENS). Soc Neurosci Abstr 29: 351.1. [Google Scholar]
- Chalazonitis A, D'Autréaux F, Guha U, Pham TD, Faure CF, Chen JJ, Rothman TP, Kessler JA, Gershon MD (2003b) Regulation of enteric neuronal development and specification of NT-3 dependence by bone morphogenetic proteins (BMPs)-2 and -4. Neurogastroenterol Motil 15: 196-197. [Google Scholar]
- Chandler CE, Parsons LM, Hosang M, Shooter EM (1984) A monoclonal antibody modulates the interaction of nerve growth factor with PC12 cells. J Biol Chem 259: 6882-6889. [PubMed] [Google Scholar]
- Cho KW, Blitz IL (1998) BMPs, Smads and metalloproteases: extracellular and intracellular modes of negative regulation. Curr Opin Genet Dev 8: 443-449. [DOI] [PubMed] [Google Scholar]
- Cooke HJ (2000) Neurotransmitters in neuronal reflexes regulating intestinal secretion. Ann NY Acad Sci 915: 77-80. [DOI] [PubMed] [Google Scholar]
- Donovan MJ, Hahn R, Tessarollo L, Hempstead BL (1996) Identification of an essential non-neuronal function of neurotrophin-3 mammalian cardiac development. Nat Genet 14: 210-213. [DOI] [PubMed] [Google Scholar]
- Enomoto H, Araki T, Jackman A, Heuckeroth R, Snider WD, Johnson EM, Milbrandt J (1998) GFRα1-deficient mice have deficits in the enteric nervous system and kidneys. Neuron 21: 317-324. [DOI] [PubMed] [Google Scholar]
- Epstein M, Poulsen KT, Thiboldeaux R (1991) Formation of ganglia in the gut of the chick embryo. J Comp Neurol 307: 189-199. [DOI] [PubMed] [Google Scholar]
- Faure C, Rhéaume C, Chalazonitis A, Gershon MD (2003) Expression of polysialylated neural cell adhesion molecule (PSA-NCAM) in the developing and mature rat enteric nervous system (ENS): relationship to neuronal differentiation and plasticity. Neurogastroenterol Motil 15: 197. [Google Scholar]
- Forss-Petter S, Danielson PE, Catsicas S, Battenberg E, Price J, Nerenberg M, Sutcliffe JG (1990) Transgenic mice expressing beta-galactosidase in mature neurons under neuron-specific enolase promoter control. Neuron 5: 187-197. [DOI] [PubMed] [Google Scholar]
- Furuta Y, Piston DW, Hogan BL (1997) Bone morphogenetic proteins (BMPs) as regulators of dorsal forebrain development. Development 124: 2203-2212. [DOI] [PubMed] [Google Scholar]
- Gershon MD (1998) Genes, lineages, and tissue interactions in the development of the enteric nervous system. Am J Physiol 275: G869-G873. [DOI] [PubMed] [Google Scholar]
- Gomes WA, Kessler JA (2001) Msx-2 and p21 mediate the pro-apoptotic but not the anti-proliferative effects of BMP4 on cultured sympathetic neuroblasts. Dev Biol 237: 212-221. [DOI] [PubMed] [Google Scholar]
- Guha U (2003) Multiple roles of BMP signaling in mouse development. PhD thesis, Albert Einstein College of Medicine.
- Guha U, Gomes WA, Samanta J, Gupta M, Rice FL, Kessler JA (2004) Target-derived BMP signaling limits sensory neuron number and the extent of peripheral innervation in vivo. Development 131: 1175-1186. [DOI] [PubMed] [Google Scholar]
- Gurdon JB, Bourillot PY (2001) Morphogen gradient interpretation. Nature 413: 797-803. [DOI] [PubMed] [Google Scholar]
- Hearn C, Newgreen D (2000) Lumbo-sacral neural crest contributes to the avian enteric nervous system independently of vagal neural crest. Dev Dyn 218: 525-530. [DOI] [PubMed] [Google Scholar]
- Hearn CJ, Murphy M, Newgreen D (1998) GDNF and ET-3 differentially modulate the numbers of avian enteric neural crest cells and enteric neurons in vitro. Dev Biol 197: 93-105. [DOI] [PubMed] [Google Scholar]
- Hearn CJ, Young HM, Ciampoli D, Lomax AE, Newgreen D (1999) Catenary cultures of embryonic gastrointestinal tract support organ morphogenesis, motility, neural crest cell migration, and cell differentiation. Dev Dyn 214: 239-247. [DOI] [PubMed] [Google Scholar]
- Heinicke EA, Kiernan JA, Wijsman J (1987) Specific, selective, and complete staining of neurons of the myenteric plexus, using Cuprolinic blue. J Neurosci Methods 21: 45-54. [DOI] [PubMed] [Google Scholar]
- Heuckeroth RO, Lampe PA, Johnson EM, Milbrandt J (1998) Neurturin and GDNF promote proliferation and survival of enteric neuron and glial progenitors in vitro. Dev Biol 200: 116-129. [DOI] [PubMed] [Google Scholar]
- Hogan BLM (1996) Bone morphogenetic proteins: multifunctional regulators of vertebrate development. Gen Dev 10: 1580-1594. [DOI] [PubMed] [Google Scholar]
- Hollenberg SM, Sternglanz R, Cheng PF, Weintraub H (1995) Identification of a new family of tissue-specific basic helix-loop-helix proteins with a two-hybrid system. Mol Cell Biol 15: 3813-3822. [DOI] [PMC free article] [PubMed] [Google Scholar]
- Holst MC, Powley TL (1995) Cuprolinic blue (quinolinic phthalocyanine) counterstaining of enteric neurons for peroxidase immunocytochemistry. J Neurosci Methods 62: 121-127. [DOI] [PubMed] [Google Scholar]
- Huber LJ, Chao MV (1995) Mesenchymal and neuronal cell expression of the p75 neurotrophin gene occur by different mechanisms. Dev Biol 167: 237-238. [DOI] [PubMed] [Google Scholar]
- Jing S, Wen D, Yu Y, Holst PL, Luo Y, Fang M, Tamir R, Antonio L, Hu Z, Cupples R, Louis J-C, Hu S, Altrock BW, Fox GM (1996) GDNF-induced activation of the Ret protein tyrosine kinase is mediated by GDNFR-α, a novel receptor for GDNF. Cell 85: 1113-1124. [DOI] [PubMed] [Google Scholar]
- Karaosmanoglu T, Aygun B, Wade PR, Gershon MD (1996) Regional differences in the number of neurons in the myenteric plexus of the guinea pig small intestine and colon: an evaluation of markers used to count neurons. Anat Rec 244: 470-480. [DOI] [PubMed] [Google Scholar]
- Kretzschmar M, Doody J, Massagué J (1997) Opposing BMP and EGF signaling pathways converge on the TGF-β family mediator Smad1. Nature 389: 618-622. [DOI] [PubMed] [Google Scholar]
- Kruger GM, Mosher JT, Bixby S, Joseph N, Iwashita T, Morrison SJ (2002) Neural crest stem cells persist in the adult gut but undergo changes in self-renewal, neuronal subtype potential, and factor responsiveness. Neuron 35: 657-669. [DOI] [PMC free article] [PubMed] [Google Scholar]
- LaBonne C, Bronner-Fraser M (1998) Neural crest induction in Xenopus: evidence for a two-signal model. Development 125: 2403-2414. [DOI] [PubMed] [Google Scholar]
- Laemmli UK (1970) Cleavage of structural protein during assembly of bacteriophage T4. Nature 227: 680-685. [DOI] [PubMed] [Google Scholar]
- Le Douarin NM, Teillet MA (1973) The migration of neural crest cells to the wall of the digestive tract in avian embryo. J Embryol Exp Morphol 30: 31-48. [PubMed] [Google Scholar]
- Le Douarin NM, Teillet MA (1974) Experimental analysis of the migration and differentiation of neuroblasts of the autonomic nervous system and of neurectodermal mesenchymal derivatives, using a biological cell marking technique. Dev Biol 41: 162-184. [DOI] [PubMed] [Google Scholar]
- Liem KF, Tremmi G, Roelink H, Jessell TM (1995) Dorsal differentiation of neural plate cells induced by BMP-mediated signals from epidermal ectoderm. Cell 82: 969-979. [DOI] [PubMed] [Google Scholar]
- Liu DX, Greene LA (2001) Neuronal apoptosis at the G1/S cell cycle checkpoint. Cell Tissue Res 305: 217-228. [DOI] [PubMed] [Google Scholar]
- Lo L, Anderson DJ (1995) Postmigratory neural crest cells expressing c-RET display restricted developmental and proliferative capacities. Neuron 15: 527-539. [DOI] [PubMed] [Google Scholar]
- Mabie PC, Mehler MF, Kessler JA (1999) Multiple roles of bone morphogenetic protein signaling in the regulation of cortical cell number and phenotype. J Neurosci 19: 7077-7088. [DOI] [PMC free article] [PubMed] [Google Scholar]
- Marchant L, Linker C, Ruiz P, Guerrero N, Mayor R (1998) The inductive properties of mesoderm suggest that the neural crest cells are specified by a BMP gradient. Dev Biol 198: 319-329. [PubMed] [Google Scholar]
- Mehler MF, Mabie PC, Zhang D, Kessler JA (1997) Bone morphogenetic proteins in the nervous system. Trends Neurosci 20: 309-317. [DOI] [PubMed] [Google Scholar]
- Merino R, Rodriguez-Leon J, Macias D, Ganan Y, Economides AN, Hurle JM (1999) The BMP antagonist Gremlin regulates outgrowth, chondrogenesis and programmed cell death in the developing limb. Development 126: 5515-5522. [DOI] [PubMed] [Google Scholar]
- Mizuseki K, Sakamoto T, Watanabe K, Muguruma K, Ikeya M, Nishiyama A, Arakawa A, Suemori H, Nakatsuji N, Kawasaki H, Murakami F, Sasai Y (2003) Generation of neural crest-derived peripheral neurons and floor plate cells from mouse and primate embryonic stem cells. Proc Natl Acad Sci USA 100: 5828-5833. [DOI] [PMC free article] [PubMed] [Google Scholar]
- Moore MW, Klein RD, Fariñas I, Sauer H, Armanini M, Phillips HLFR, Ryan AM, Carver-Moore K, Rosenthal A (1996) Renal and neuronal abnormalities in mice lacking GDNF. Nature 382: 76-79. [DOI] [PubMed] [Google Scholar]
- Newgreen D, Young HM (2002a) Enteric nervous system: development and developmental disturbances-part 1. Pediatr Dev Pathol 5: 224-247. [DOI] [PubMed] [Google Scholar]
- Newgreen D, Young HM (2002b) Enteric nervous system: development and developmental disturbances-part 2. Pediatr Dev Pathol 5: 329-349. [DOI] [PubMed] [Google Scholar]
- Pachnis V, Durbec P, Taraviras S, Grigoriou M, Natarajan D (1998) III. Role Of the RET signal transduction pathway in development of the mammalian enteric nervous system. Am J Physiol 275: G183-G186. [DOI] [PubMed] [Google Scholar]
- Pan H, Gershon MD (2000) Activation of intrinsic afferent pathways in submucosal ganglia of the guinea pig small intestine. J Neurosci 20: 3295-3309. [DOI] [PMC free article] [PubMed] [Google Scholar]
- Pham TD, Gershon MD, Rothman TP (1991) Time of origin of neurons in the murine enteric nervous system. J Comp Neurol 314: 789-798. [DOI] [PubMed] [Google Scholar]
- Pichel JG, Shen L, Sheng HZ, Granholm A-C, Drago J, Grinberg A, Lee EJ, Huang SB, Saarma M, Hoffer BJ, Sariola H, Westphal H (1996) Defects in enteric innervation and kidney development in mice lacking GDNF. Nature 382: 73-76. [DOI] [PubMed] [Google Scholar]
- Pisano JM, Colon-Hastings F, Birren SJ (2000) Postmigratory enteric and sympathetic neural precursors share common, developmentally regulated, responses to BMP2. Dev Biol 227: 1-11. [DOI] [PubMed] [Google Scholar]
- Pomeranz HD, Rothman TP, Gershon MD (1991) Colonization of the post-umbilical bowel by cells derived from the sacral neural crest: direct tracing of cell migration using an intercalating probe and a replication-deficient retrovirus. Development 111: 647-655. [DOI] [PubMed] [Google Scholar]
- Pomeranz HD, Rothman TP, Chalazonitis A, Tennyson VM, Gershon MD (1993) Neural crest-derived cells isolated from the gut by immunoselection develop neuronal and glial phenotypes when cultured on laminin. Dev Biol 156: 341-361. [DOI] [PubMed] [Google Scholar]
- Roberts DJ (2000) Molecular mechanisms of development of the gastrointestinal tract. Dev Dyn 219: 109-120. [DOI] [PubMed] [Google Scholar]
- Roberts DJ, Johnson RL, Burke AC, Nelson CE, Morgan BA, Tabin C (1995) Sonic hedgehog is an endodermal signal inducing Bmp-4 and Hox genes during induction and regionalization of the chick hindgut. Development 121: 3163-3174. [DOI] [PubMed] [Google Scholar]
- Roberts DJ, Smith DM, Goff DJ, Tabin CJ (1998) Epithelial-mesenchymal signaling during the regionalization of the chick gut. Development 125: 2791-2801. [DOI] [PubMed] [Google Scholar]
- Rosenzweig BL, Imamura T, Okadome T, Cox GN, Yamashita H, ten Dijke P, C-HH, Miyazono K (1995) Cloning and characterization of a human type II receptor for bone morphogenetic proteins. Proc Natl Acad Sci USA 92: 7632-7636. [DOI] [PMC free article] [PubMed] [Google Scholar]
- Rothman TP, Gershon MD (1982) Phenotypic expression in the developing murine enteric nervous system. J Neurosci 2: 381-393. [DOI] [PMC free article] [PubMed] [Google Scholar]
- Rothman TP, Nilaver G, Gershon MD (1984) Colonization of the developing murine enteric nervous system and subsequent phenotypic expression by the precursors of peptidergic neurons. J Comp Neurol 225: 13-23. [DOI] [PubMed] [Google Scholar]
- Rothman TP, Le Douarin NM, Fontaine-Pérus JC, Gershon MD (1990) Developmental potential of neural crest-derived cells migrating from segments of developing quail bowel back-grafted into younger chick host embryos. Development 109: 411-423. [DOI] [PubMed] [Google Scholar]
- Rothman TP, Le Douarin NM, Fontaine-Pérus JC, Gershon MD (1993) Colonization of the bowel by neural crest-derived cells re-migrating from foregut backtransplanted to vagal or sacral regions of host embryos. Dev Dyn 196: 217-233. [DOI] [PubMed] [Google Scholar]
- Sánchez M, Silos-Santiago I, Frisén J, He B, Lira S, Barbacid M (1996) Renal agenesis and the absence of enteric neurons in mice lacking GDNF. Nature 382: 70-73. [DOI] [PubMed] [Google Scholar]
- Sasai Y, De Robertis EM (1997) Ectodermal patterning in vertebrate embryos. Dev Biol 182: 5-20. [DOI] [PubMed] [Google Scholar]
- Scheuermann DW, Stach W, Timmermans JP, Adriaensen D, De Groodt-Lasseel MHA (1989) Neuron-specific enolase and S-100 protein immunohistochemistry for defining the structure and topographical relationship of the different enteric nerve plexuses in the small intestine of the pig. Cell Tissue Res 256: 65-75. [DOI] [PubMed] [Google Scholar]
- Schmechel DE, Brightman MW, Marangos PJ (1980) Neurons switch from non-neuronal enolase to neuron-specific enolase during differentiation. Brain Res 190: 195-214. [DOI] [PubMed] [Google Scholar]
- Schuchardt A, D'Agati V, Larsson-Blomberg L, Costantini F, Pachnis V (1994) Defects in the kidney and enteric nervous system of mice lacking the tyrosine kinase receptor Ret. Nature 367: 380-383. [DOI] [PubMed] [Google Scholar]
- Sela-Donenfeld D, Kalcheim C (1999) Regulation of the onset of neural crest migration by coordinated activity of BMP4 and Noggin in the dorsal neural tube. Development 126: 4749-4762. [DOI] [PubMed] [Google Scholar]
- Sela-Donenfeld D, Kalcheim C (2002) Localized BMP4-noggin interactions generate the dynamic patterning of noggin expression in somites. Dev Biol 246: 311-328. [DOI] [PubMed] [Google Scholar]
- Serbedzija GN, Burgan S, Fraser SE, Bronner-Fraser M (1991) Vital dye labeling demonstrates a sacral neural crest contribution to the enteric nervous system of chick and mouse embryos. Development 111: 857-866. [DOI] [PubMed] [Google Scholar]
- Sextier-Sainte-Claire Deville F, Ziller C, Le Douarin NM (1994) Developmental potentials of enteric neural crest-derived cells in clonal and mass cultures. Dev Biol 163: 141-151. [DOI] [PubMed] [Google Scholar]
- Shah NM, Groves AK, Anderson DJ (1996) Alternative neural crest cell fates are instructively promoted by TGFβ superfamily members. Cell 85: 331-343. [DOI] [PubMed] [Google Scholar]
- Siebert PD, Larrick JW (1992) Competitive PCR. Nature 359: 557-558. [DOI] [PubMed] [Google Scholar]
- Skalli O, Ropraz P, Trzeciak A, Benzonana G, Gillessen D, Gabbiani G (1986) A monoclonal antibody against alpha-smooth muscle actin: a new probe for smooth muscle differentiation. J Cell Biol 103: 2787-2796. [DOI] [PMC free article] [PubMed] [Google Scholar]
- Song Q, Mehler M, Kessler JA (1998) Bone morphogenetic proteins induce apoptosis and growth factor dependence of cultured sympathoadrenal progenitor cells. Dev Biol 196: 119-127. [DOI] [PubMed] [Google Scholar]
- Sukegawa A, Narita T, Kameda T, Saitoh K, Nohno T, Iba H, Yasugi S, Fukuda K (2000) The concentric structure of the developing gut is regulated by Sonic hedgehog derived from endodermal epithelium. Development 127: 1971-1980. [DOI] [PubMed] [Google Scholar]
- Suvanto P, Hiltunen JO, Arumäe U, Moshnyakov M, Sariola H, Sainio K, Saama M (1996) localization of glial cell line-derived neurotrophic factor (GDNF) mRNA in embryonic rat by in situ hybridization. Eur J Neurosci 8: 816-822. [DOI] [PubMed] [Google Scholar]
- Tam PKH, Lister J (1986) Development profile of neuron-specific enolase in human gut and its implications in Hirschsprung's disease. Gastroenterology 90: 1901-1906. [DOI] [PubMed] [Google Scholar]
- Taraviras S, Pachnis V (1999) Development of the mammalian enteric nervous system. Curr Opin Genet Dev 9: 321-327. [DOI] [PubMed] [Google Scholar]
- Taraviras S, Marcos-Gutierrez CV, Durbec P, Jani H, Grigoriou M, Sukumaran M, Wang LC, Hynes M, Raisman G, Pachnis V (1999) Signalling by the RET receptor tyrosine kinase and its role in the development of the mammalian enteric nervous system. Development 126: 2785-2797. [DOI] [PubMed] [Google Scholar]
- ten Dijke P, Yamashita H, Sampath TK, Reddi AH, Estevez M, Riddle DL, Ichijo H, Heldin C-H, Miyazono K (1994) Identification of type I receptors for osteogenic protein-1 and bone morphogenetic protein-4. J Biol Chem 269: 16985-16988. [PubMed] [Google Scholar]
- ten Dijke P, Goumans MJ, Itoh F, Itoh S (2002) Regulation of cell proliferation by Smad proteins. J Cell Physiol 191: 1-16. [DOI] [PubMed] [Google Scholar]
- Treanor JJS, Goodman L, de Sauvage F, Stone DM, Poulsen KT, Beck CD, Gray C, Armanini MP, Pollock RA, Hefti F, Pillips HS, Goddard A, Moore MW, Buj-Bello A, Davies AM, Asai N, Takahashi M, Vandlen R, Henderson CE, Rosenthal A (1996) Characterization of a multicomponent receptor for GDNF. Nature 382: 80-83. [DOI] [PubMed] [Google Scholar]
- Trupp M, Arenas E, Fainzilber M, Nilsson A-S, Sieber B-A, Grigoriou M, Kilkenny C, Salazar-Grueso E, Pachnis V, Arumäe U, Sariola H, Saarma M, Ibáñez CF (1996) Functional receptor for GDNF encoded by the c-ret proto-oncogene. Nature 381: 785-789. [DOI] [PubMed] [Google Scholar]
- Tsoulfas P, Stephens RM, Kaplan DR, Parada LF (1996) TrkC isoforms with inserts in the kinase domain show impaired signaling responses. J Biol Chem 271: 5691-5697. [DOI] [PubMed] [Google Scholar]
- Tucker RP, Matus AI (1988) Microtubule-associated proteins characteristic of embryonic brain are found in the adult mammalian retina. Dev Biol 130: 423-434. [DOI] [PubMed] [Google Scholar]
- Varley JE, Maxwell GD (1996) BMP-2 and BMP-4 but not BMP-6, increase the number of adrenergic cells which develop in quail trunk neural crest cultures. Exp Neurol 140: 84-94. [DOI] [PubMed] [Google Scholar]
- von Bubnoff A, Cho KW (2001) Intracellular BMP signaling regulation in vertebrates: pathway or network? Dev Biol 239: 1-14. [DOI] [PubMed] [Google Scholar]
- Wakamatsu N, Yamada Y, Yamada K, Ono T, Nomura N, Taniguchi H, Kitoh H, Mutoh N, Yamanaka T, Mushiake K, Kato K, Sonta S, Nagaya M (2001) Mutations in SIP1, encoding Smad interacting protein-1, cause a form of Hirschsprung disease. Nat Genet 27: 369-370. [DOI] [PubMed] [Google Scholar]
- Wilkinson LD, Lee K, Deshpande S, Duerksen-Hughes P, Boss JM, Pohl J (1989) The neuron-specific protein PGP 9.5 is a ubiquitin carboxyl-terminal hydrolase. Science 246: 670-673. [DOI] [PubMed] [Google Scholar]
- Xu Z, Maroney AC, Dobrzanski P, Kukekov NV, Greene LA (2001) The MLK family mediates c-Jun N-terminal kinase activation in neuronal apoptosis. Mol Cell Biol 21: 4713-4724. [DOI] [PMC free article] [PubMed] [Google Scholar]
- Yamashita H, Ten Dijke P, Heldin C-H, Miyazono K (1996) Bone morphogenetic protein receptors. Bone 19: 569-574. [DOI] [PubMed] [Google Scholar]
- Yntema CL, Hammond WS (1954) The origin of intrinsic ganglia of trunk viscera from vagal neural crest in the chick embryo. J Comp Neurol 101: 515-542. [DOI] [PubMed] [Google Scholar]
- Yntema CL, Hammond WS (1955) Experiments on the origin and development of the sacral autonomic nerves in the chick embryo. J Exp Zool 129: 375-414. [Google Scholar]
- Young H, Hearn CJ, Ciampoli D, Southwell BR, Brunet JF, Newgreen DF (1998) A single rostrocaudal colonization of the rodent intestine by enteric neuron precursors is revealed by the expression of Phox2B, Ret, and p75 and by explants grown under the kidney capsule or in organ culture. Dev Biol 202: 67-84. [DOI] [PubMed] [Google Scholar]
- Young HM, Ciampoli D, Hsuan J, Canty AJ (1999) Expression of Ret-, p75(NTR)-, Phox2a-, Phox2b-, and tyrosine hydroxylase-immunoreactivity by undifferentiated neural crest-derived cells and different classes of enteric neurons in the embryonic mouse gut. Dev Dyn 216: 137-152. [DOI] [PubMed] [Google Scholar]
- Young HM, Bergner AJ, Muller T (2003) Acquisition of neuronal and glial markers by neural crest-derived cells in the mouse intestine. J Comp Neurol 456: 1-11. [DOI] [PubMed] [Google Scholar]
- Zhang D, Mehler M, Song Q, Kessler JA (1998) Development of bone morphogenetic protein receptors in the nervous system and possible roles in regulating trkC expression. J Neurosci 18: 3314-3326. [DOI] [PMC free article] [PubMed] [Google Scholar]
- Ziller C, Dupin E, Brazeau P, Paulin D, Le Douarin NM (1983) Early segregation of a neuronal precursor cell line in the neural crest as revealed by culture in a chemically defined medium. Cell 32: 627-638. [DOI] [PubMed] [Google Scholar]