

Abstract
It is widely believed that the inflammatory events mediated by microglial activation contribute to several neurodegenerative processes. Alzheimer's disease, for example, is characterized by an accumulation of β-amyloid protein (Aβ) in neuritic plaques that are infiltrated by reactive microglia and astrocytes. Although Aβ and its fragment 25-35 exert a direct toxic effect on neurons, they also activate microglia. Microglial activation is accompanied by morphological changes, cell proliferation, and release of various cytokines and growth factors. A number of scientific reports suggest that the increased proliferation of microglial cells is dependent on ionic membrane currents and in particular on chloride conductances. An unusual chloride ion channel known to be associated with macrophage activation is the chloride intracellular channel-1 (CLIC1). Here we show that Aβ stimulation of neonatal rat microglia specifically leads to the increase in CLIC1 protein and to the functional expression of CLIC1 chloride conductance, both barely detectable on the plasma membrane of quiescent cells. CLIC1 protein expression in microglia increases after 24 hr of incubation with Aβ, simultaneously with the production of reactive nitrogen intermediates and of tumor necrosis factor-α (TNF-α). We demonstrate that reducing CLIC1 chloride conductance by a specific blocker [IAA-94 (R(+)-[(6,7-dichloro-2-cyclopentyl-2,3-dihydro-2-methyl-1-oxo-1H-inden-5yl)-oxy] acetic acid)] prevents neuronal apoptosis in neurons cocultured with Aβ-treated microglia. Furthermore, we show that small interfering RNAs used to knock down CLIC1 expression prevent TNF-α release induced by Aβ stimulation. These results provide a direct link between Aβ-induced microglial activation and CLIC1 functional expression.
Keywords: Alzheimer, microglia, neurotoxicity, CLIC1, chloride channel, β-amyloid
Introduction
Chloride intracellular channel-1 (CLIC1) was originally cloned from a human myelomonocytic cell line (U937) (Valenzuela et al., 1997). It is localized to both the nucleoplasm and cytosol and exhibits both nuclear and plasma membrane chloride channel activity. In particular, we demonstrated previously that, in Chinese hamster ovary CHO cells, CLIC1 channel activity is found on the plasma membrane of cells in the act of dividing or that have just divided (Tonini et al., 2000; Valenzuela et al., 2000). Additionally, it has been reported that CLIC1 expression is related to macrophage activation in U937 cells in which CLIC1 mRNA is upregulated by various activation stimuli, including phorbol-12-myristate-13 acetate (PMA). This regulation was also found to be associated with the maturational state of the cell because the response to PMA is enhanced by a previous exposure to retinoic acid. This linkage of CLIC1 expression with macrophage activation has prompted us to examine both the expression and role of CLIC1 in microglial cells (the brain macrophages).
It has been reported that the inflammatory events mediated by microglial activation contribute to several neurodegenerative processes, including Alzheimer's disease (AD) (McGeer et al., 1993, 1994; McGeer and McGeer, 1997, 1998; Kalaria, 1999). The AD brain is characterized by selective neuronal loss, neurofibrillary tangles, and abundant extracellular deposits of insoluble β-amyloid protein (Aβ) (Glenner and Wong, 1984). In particular, the senile plaques of AD are sites of inflammatory processes, as evidenced by the presence of reactive microglia and astrocytes associated with the plaques (Itagaki et al., 1989). It is possible that activation of microglial cells leads to the production of various cytokines and neurotoxins, which may ultimately cause neuronal injury and death (Barger and Harmon, 1997; Egensperger et al.,1998; Styren et al., 1998; Benveniste et al., 2001; Combs et al., 2001).
In vitro treatment with Aβ or Aβ fragments results in proliferation of microglia and release of inflammatory cytokines and reactive nitrogen intermediates (Araujo and Cotman, 1992; Meda et al., 1995; Casal et al., 2002). The biologically active region of Aβ is restricted to amino acids 25-35 at the C terminus (Yankner et al., 1990), and an Aβ25-35 amyloid peptide is sufficient to stimulate intracellular signaling cascades in microglial cells. This occurs by initiating mechanisms common to the 1-40 and 1-42 Aβ peptides.
In the present study, we provide evidences that microglial cells express CLIC1 protein. Activation of microglia by Aβ peptides results in an overall increase in CLIC1 protein with resultant increase in CLIC1 ion channel activity. A specific CLIC1 blocker [IAA-94 (R(+)-[(6,7-dichloro-2-cyclopentyl-2,3-dihydro-2-methyl-1-oxo-1H-inden-5yl)-oxy] acetic acid)] acts broadly to inhibit the production of proinflammatory and neurotoxic products elaborated by Aβ-stimulated microglial cells and functions as a neuroprotective agent in neuronal-microglial cocultures. However, when CLIC1 expression is knocked down by small interfering RNAs (siRNAs), the Aβ-induced production of tumor necrosis factor-α (TNF-α) in microglia is completely prevented.
Materials and Methods
Cell cultures. The CLIC1-transfected CHO cells (Cl4) (Tonini et al., 2000) and the murine microglial cell line BV-2 were grown in DMEM (Invitrogen, Milan, Italy) supplemented with 10% fetal calf serum (FCS) (Sigma, Milan, Italy) in 5% CO2. Primary microglial cell cultures were derived from postnatal day 3-4 rat cortex as described previously (Bezzi et al., 1998). Free-floating microglia were collected from shaken astrocytes flasks and seeded onto standard flasks or 24-well plates, with four paraffin drops on the bottom (see below), and maintained in DMEM supplemented with 10% FCS in 5% CO2. The purity of microglial cultures was assessed by a positive staining for Griffonia Simplicifolia isolectin B4 (Vector Laboratories Burlingame, CA), a selective marker of both resting and activated microglia. Cortical neurons were cultured from postnatal day 0-1 rat cortex. Meninges-free cortices were isolated and digested in HIBERNATE-A media (BrainBits, Springfield, IL) supplemented with B27 (Invitrogen) and 0.5 mm glutamine (Sigma) for 20 min at 30°C. Cortices were transferred to Neurobasal-A/B27 (NBA/B27) medium (Invitrogen), triturated, and plated onto poly-l-lysine (0.01 mg/ml)-coated tissue culture wells. Neurons were grown in NBA/B27 for 5 d in vitro before the experiment. The use of NBA/B27 provided highly purified cultures of neurons to decrease the contamination of glial cells in the cultures (Brewer et al., 1993). Mixed neuronal-microglial cell cultures were prepared by adding 5 × 10⁴ microglial cells to cortical neuronal cultures.
In a separate set of experiments, primary hippocampal neurons were prepared from embryonic day 18 rat brain (Goslin and Banker, 1990). After dissection, the hippocampi were treated with 2.5% trypsin and dissociated with a flame-polished Pasteur pipette. The cells were plated onto poly-l-lysine-treated glass coverslips in Minimum Essential Medium (Invitrogen), containing 10% FCS. After 2 hr, the medium was substituted with NBA/B27. After 8 hr from seeding, 5 μm arabinosylcytosine was added. Neuronal cell cultures contained <1% of astrocytes, as shown by glial fibrillary acidic protein staining (data not shown). For neuronal-microglial cocultures, after 1 d in vitro, coverslips were transferred to the 24-well plates containing the microglial cells, facing down, on top of the paraffin drops, which maintained the coverslips distant from the microglial monolayer. In this way, neurons were conditioned by the microglia, sharing the same medium, but were not in direct contact with the microglial cells.
Cell stimulation. BV-2 and primary microglial cells were treated with Aβ1-42, Aβ25-35, and Aβ35-25 (reverse) peptides (Bachem, Bubendorf, Switzerland), basic FGF (bFGF) (Sigma), Escherichia coli lipopolysaccharide (LPS) (serotype 0127:B8; Sigma), R(+)-[(6,7-dichloro-2-cyclopentyl-2,3-dihydro-2-methyl-1-oxo-1H-inden-5yl)-oxy] acetic acid (IAA-94) (Biomol, Plymouth Meeting, PA), and niflumic acid (Sigma).
Aβ25-35 and Aβ35-25 (reverse) peptides were dissolved in sterile, distilled water at a concentration of 1 mm and incubated for 72 hr at 37°C to allow aggregation. The reverse peptide was used as a control. Aβ1-42 was dissolved in sterile water to 1 mm and incubated at 37°C for 7 d.
For coculturing experiments, Aβ25-35 or the reverse peptide were added to the 24-well plates containing the microglial cultures. Six hours later, coverslips with the seeded neurons were transferred to the wells containing the microglial cells, facing down, on top of the paraffin drops. As reported previously, this procedure permits sedimentation of Aβ aggregates to the bottom of the well and minimizes the interaction of Aβ with neurons (Malchiodi-Albedi et al., 2001).
Western blot. SDS-PAGE and Western blotting were performed by standard techniques. Briefly, cells were lysed on ice in 50 mm Tris-HCl, pH 7.0, 0.5% NP-40, 2 mm AEBSF [4-(2-aminomethyl)benzenesulfonylfluoride hydrochloride], 2 μm aprotinin, 40 μm leupeptin, 70 μm bestatin, 30 μm pepstatin A, and 30 μm E-64 [trans-epoxysuccinyl-l-leucylamido-(4-guanidino)-butane]. Samples were clarified by centrifugation at 1000 × g for 5 min. Equivalent amounts of proteins (30 μg) were subjected to SDS-PAGE by using 12% polyacrylamide gels, and proteins were electroblotted to nitrocellulose. The membranes were blocked with 3% bovine serum albumin (BSA) in PBS for 1 hr and then incubated overnight at 4°C with anti-NCC27 (1:8000) (Valenzuela et al., 1997) or with anti-β-tubulin (1:7000; ICN Pharmaceuticals, Milan, Italy) in PBS containing 0.1% Tween 20 and 3% BSA. After extensive washing, a peroxidase-conjugated anti-rabbit (or anti-mouse) antibody diluted in PBS containing 0.1% Tween 20 was added for 1 hr. Antibody binding was detected by chemiluminescence kit (ECL Blotting System; Amersham Biosciences, Milan, Italy).
Cell surface protein biotinylation. Cl4 and BV-2 cells were plated (1 × 10⁶ cells per well) onto poly-l-lysine-coated 60 mm Petri dishes 12 hr before stimulation. Cells were stimulated with 30 μm Aβ25-35 or 100 ng/ml bFGF. After 48 hr from stimulation, medium was removed and the cells were washed three times with cold PBS, pH 7.3, containing 1 mm MgCl2 and 0.1 mm CaCl2, (PBS/Ca2+/Mg2+). Cell surface biotinylation was performed as described previously (Apparsundaram et al., 1998). Cells were incubated for 30 min at 4°C in PBS/Ca2+/Mg2+ containing 1.5 mg/ml EZ-Link Sulfo-NHS-Biotin (Pierce, Rockford, IL). Unless stated otherwise, all of the remaining steps were performed at 4°C. The biotinylation reagent was removed, and the cells were washed twice with PBS/Ca2+/Mg2+ containing 100 mm glycine, followed by quenching for 30 min with the same reagent and one additional wash with 0.5 mm PMSF in PBS. Cells in each plate were gently shaken in 400 μl of lysis buffer [PBS, 1% Triton X-100, and protease inhibitor mixture (Sigma)] for 1 hr. Cell lysates were centrifuged (20,000 × g for 30 min), and the protein concentration of each lysate was determined. Twenty micrograms of each sample were removed (total lysate), and 350 μg were incubated with monomeric avidin beads (Pierce). Before use, monomeric avidin was washed in lysis buffer. The avidin beads were mixed with cell lysate by rotation for 1 hr at room temperature (RT). Unbound proteins were separated by centrifugation (15,000 × g for 3 min at RT), and 20 μg for each sample were taken (intracellular fraction). The beads were washed three times with lysis buffer and eluted with Laemmli loading buffer (surface fraction). Samples were subjected to electrophoresis by using 15% SDS-polyacrylamide gels, and Western blot was performed.
Patch-clamp recordings. The patch electrodes were pulled from hard borosilicate glass on a Brown-Flaming P-87 puller (Sutter Instruments, Novato, CA). The pipettes were coated with Sylgard (Dow Corning) and fire polished to an external tip diameter of 1-1.5 μm. These electrodes had resistances of 7-10 MΩ. We applied standard cell-attached patch-clamp techniques to obtain seals of 20-50 GΩ in the single-channel recordings. Analytical grade reagents were purchased from Sigma. The bath solution contained the following (in mm): 140 NaCl, 5 KCl, 1 MgCl2, 2.5 CaCl2, 10 HEPES, and 10 glucose, pH 7.3. The pipette solution contained the following (in mm): 127.5 N-methyl-glucamine-Cl, 5 KCl, 2.5 CaCl2, 1 MgCl2, 10 HEPES, 10 glucose, 10 tetraethylammonium-Cl, 5 4-aminopyridine, and 0.03 margatoxin, pH 7.3. In the experiments to determine the Cl dependence of CLIC1 currents, the chloride anion were replaced as a counter ion of N-methyl-glucamine by methansulfonate to obtained a final Cl concentration of 60 or 30 mm. We calculated the junction potential (JP) using pClamp routine (Axon Instruments, Foster City, CA). For 149.5, 60, and 30 mm chloride concentration solutions, the JPs were -5, -0.7, and +0.6, respectively. Experimental points were not corrected for these JPs. For outside-out experiments, the patch electrode contained the following (in mm): 10 NaCl, 130 K-Asp, 2 MgCl2, 1.3 CaCl2, 10 HEPES, and 10 EGTA, pH 7.3.
Single-channel currents were recorded with an Axon Instruments 200B patch-clamp amplifier and digitized by Clampex 8 routine (pClamp 8; Axon Instruments). Single-channel currents were filtered at 1 kHz, sampled at 10 kHz, and analyzed by Fetchan routine (pClamp 6; Axon Instruments). Opening and closing transitions were detected using a 50% threshold criterion. Kinetic parameters have to be regarded as “apparent” because of the effects of unresolved shuttings and openings. Total channel open probability (NPo) was calculated as the total open time during a recording divided by the whole-record duration. Open time distributions were fitted with single-exponential function using the least-squares method.
Growth curves. BV-2 cells and primary microglial cells were plated (5000 cells/cm2) onto 35 mm Petri dishes 12 hr before stimulation. Stimulation was performed by using 30 μm Aβ25-35 or 100 ng/ml bFGF. IAA-94 at 30 μm was added together with Aβ or bFGF. After 24 and 48 hr of treatment, cells were detached with trypsin and counted.
Viability assay. Viable cells were determined by uptake and hydrolysis of fluorescein diacetate (Brewer et al., 1993). Briefly, mixed cultures of cortical neuronal cells and primary microglia were rinsed twice with HBSS (Invitrogen) and treated with fluorescein diacetate (15 μg/ml; Sigma) and propidium iodide (4.6 μg/ml; Sigma). With blue excitation, live cells fluoresce green, and dead cell fluoresce red. For statistical analysis, at least 12 consecutive 0.313 mm2 (20×) fields were counted for each sample. The experiment was repeated four times with similar results, but data were not combined for statistical analysis because of variations of plating efficiency.
Terminal deoxynucleotidyl transferase-mediated biotinylated UTP nick end labeling assay. Neurons cocultivated with microglia were fixed in 3% paraformaldehyde in PBS and 0.2 m in sucrose and were treated with the terminal deoxynucleotidyl transferase-mediated biotinylated UTP nick end labeling (TUNEL) technique, using the DeadEnd kit (Promega, Madison, WI). TUNEL-positive cells were counted at a Nikon (Tokyo, Japan) Optiphot microscope. Eight microscopic fields were chosen randomly by two separate observers for a total of at least 300 cells for each coverslip. Two coverslips were scored for each condition. The percentage of apoptotic cells was calculated as the number of TUNEL-positive cells divided by the total cell number. The values obtained for each coverslip by the two observers were averaged to produce a single mean value for each experiment. The experiment was repeated three times, using three different neuronal and microglial cell culture preparations.
Tumor necrosis factor-α and nitrite release. The release of TNF-α into culture supernatants was determined by standard ELISA techniques according to the instructions of the manufacturer (R & D Systems, Minneapolis, MN).
Nitrite (NO2-) was determined by using the Griess reagent (1 mm sulfanilamide, 1 mm naphthylenediamine dihydrochloride, and 100 mm HCl) in culture supernatants. Absorbance was measured at 540 nm, and NO2- concentration was determined using sodium nitrite as a standard.
RNA interference. The psiUb-clic1A and psiUb-clic1B RNA interference (RNAi) constructs were designed as described by M. Denti (unpublished observation). Briefly, 21-nucleotide-long inverted repeats, separated by a nine nucleotide linker, were inserted downstream of the U1 promoter by cloning two pairs of annealed oligonucleotides in the BglII and XhoI sites of vector psiUx (Denti, unpublished observation). The transcribed RNAs thus comprised 24 bp hairpin RNAs, together with a terminal stem-bulge structure. The 3′ terminus is produced by a conserved box element inserted downstream of the antisense strand. The sense strand of the short hairpins was homologous to 21 nucleotide regions in the target CLIC1 mRNA and contained at least four nucleotide mismatches with all other murine genes, as determined by BLAST (basic local alignment search tool) searches. The sense strand of psiUb-clic1A construct was designed to be homologous to a region located in the fifth exon of CLIC1 mRNA (nucleotides 862-882 in sequence BC004658). The psiUb-clic1B construct was designed to target exon 6 of CLIC1 mRNA (nucleotides 1068-1088 of sequence BC004658). psiUb-clic1C and psiUb-clic1D target region 712-732 and region 926-946 of CLIC1 mRNA (sequence BC004658), respectively.
BV-2 calls at 90% confluence were transfected with 4 μg of plasmid in 35 mm plates using Lipofectamine 2000 (Invitrogen) according to the instructions of the manufacturer.
After 48 hr from transfection, with the control vector (psiUx), psiUb-clic1A, psiUb-clic1B, psiUb-clic1C, or psiUb-clic1D, BV-2 cells were treated for 24 hr with 30 μm Aβ25-35, and the release of TNF-α in the medium was measured by standard ELISA.
Results
Aβ treatment increases CLIC1 protein expression in microglial cells
In freshly dissociated neonatal rat microglial cells, as well as in the microglial cell line BV-2, immunoblot analysis of whole-cell lysates demonstrated a 27 kDa protein corresponding to CLIC1 (Fig. 1a). Because previous results demonstrated CLIC1 mRNA to be upregulated during PMA-induced macrophage activation, we tested its expression in microglial cells activated by different stimuli, including Aβ1-42, Aβ25-35, LPS, and bFGF. In previous experiments, we determined the lowest concentrations of Aβ peptides required in our experimental conditions for microglial activation, as revealed by increased TNF-α release. They correspond to 20 μm Aβ1-42 and 30 μm Aβ25-35.
Figure 1.

Induction of CLIC1 in microglial cells treated with Aβ. Western blot analysis of CLIC1 expression in the following: a, rat primary microglia, BV-2 cells, and CLIC1-transfected CHO-K1 cells (Cl4) used as a positive control; b, BV-2 cells treated for 48 hr with 20 μm Aβ1-42; c, rat primary microglia treated for 48 hr with 30 μm Aβ25-35, 100 ng/ml bFGF, 1 μg/ml LPS (RP, recombinant protein); d, BV-2 cells treated for 48 hr with 1 μg/ml LPS, 100 ng/ml bFGF, and 30 μm Aβ25-35; and e, rat primary microglia treated for 24 and 48 hr with 30 μm Aβ25-35. β-Tubulin expression is used as a reference. f, Surface biotinylation of CLIC1 was performed in untreated BV-2 cells and in BV-2 cells treated for 48 hr with Aβ25-35 (30 μm) or bFGF (100 ng/ml). Immunoblot shows CLIC1 immunoreactivity in total cell lysate (T), cell surface (S), and intracellular (I) fractions.
As determined by densitometric analysis, both Aβ1-42 and Aβ25-35 treatments resulted in an increased expression of CLIC1 by approximately twofold in BV-2 cells after 48 hr (Fig. 1b,d). In contrast, LPS was unable to modify CLIC1 expression, consistent with previous data obtained in U937 cells (Valenzuela et al.,1997). Also, bFGF was unable to modify the expression of CLIC1 on primary rat microglia (Fig. 1c), as well as in BV-2 cells (Fig. 1d). In rat primary microglial cells, the increased expression of CLIC1 protein was observed at 24 and 48 hr of treatment with Aβ25-35, and it corresponded to an increment of twofold and threefold, respectively (Fig. 1e). The substantial agreement in the results obtained using Aβ1-42 or Aβ25-35 allowed us to use, from now on, the short peptide in following experiments.
Activating microglial cells increases CLIC1 protein localized to the plasma membrane
To determine whether increased amounts of CLIC1 protein were expressed on the plasma membrane in association with microglial activation, we used cell surface biotinylation. Both BV-2 cells stimulated for 48 hr with Aβ and bFGF and untreated control cells were incubated with membrane-impermeable activated biotin. This caused the biotin labeling only of proteins present on the cell surface. The biotinylated proteins were then isolated with monomeric avidin beads and subjected to electrophoresis and Western blotting. CLIC1 was present on the cell surface of BV-2 cells in virtually all of the preparations, but higher levels were detected in Aβ25-35-treated samples (Fig. 1f). This result indicates that Aβ-induced microglial activation, together with an overall increase in CLIC1 protein expression, is also associated with a higher level of CLIC1 on the plasma membrane.
Microglial cell plasma membranes display ionic conductances characteristic of CLIC1
CLIC1 single-channel currents from rat microglial cells and from the BV-2 cell line were systematically recorded using the cell-attached patch-clamp technique. Figure 2a shows sample current recordings in these two cell types at different membrane potentials. The mean open time (τo = 4.2 ± 0.12 and 4.5 ± 0.3 msec) and open probability (Po = 0.24 ± 0.6 and 0.27 ± 0.4) at -5mV of membrane potential for microglial primary cultures and microglial cell line (BV-2) matched the kinetic parameters measured in CLIC1-transfected CHO cells (Tonini et al., 2000; Valenzuela et al., 2000). The values of single-channel conductances were 7.14 ± 0.03 and 6.39 ± 0.018 pS, and the current reversal potential was -81 and -85 mV for rat microglia and for BV-2 cells, respectively. There is a complete agreement in the conductance values calculated from the current-voltage (I-V) plot (c) and previous CLIC1 conductance measurements that we undertook in CLIC1-transfected CHO cells (Tonini et al., 2000; Valenzuela et al., 2000). In Figure 2b, we show single-channel current recordings obtained from BV-2 cells in cell-attached configuration using 60 and 30 mm Cl solution in the patch pipette. The current-voltage relationship on the bottom shows that the conductances in these cases are 6.27 ± 0.032 and 6.05 ± 0.054 pS, and the mean open times are 4.3 ± 0.23 and 4.7 ± 0.41 msec, respectively. The extrapolated reversal potentials are -58 and -38 mV at 60 and 30 mm Cl according to a chloride dependence of the channel current. For comparison, we report in the same plot four single-channel current values obtained in BV-2 cells in the same condition as in Figure 2a. In this case, with 149.5 Cl in the pipette solution, the reversal potential was -83 mV.
Figure 2.
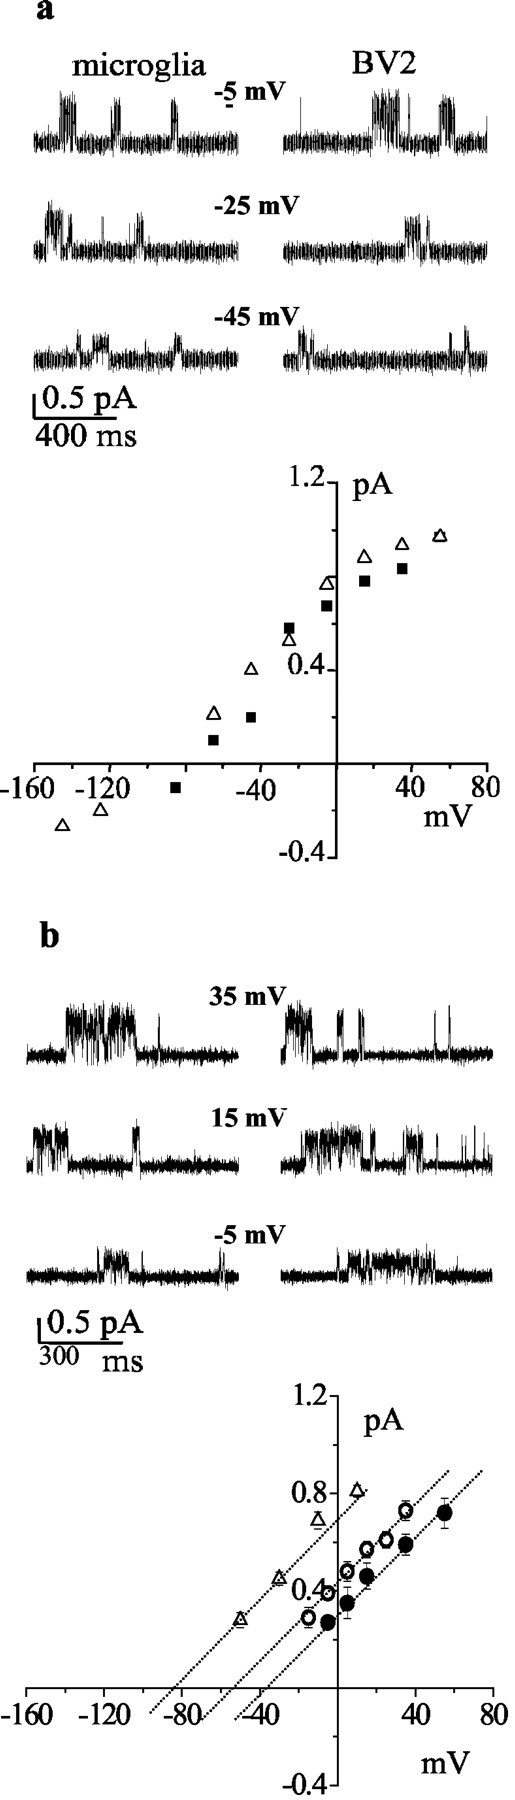
Comparison of CLIC1 single-channel properties in primary rat microglia and in the BV-2 cell line. a, Single-channel current traces recorded at different membrane potentials from primary microglia (top left) and BV-2 cells (top right). The I-V relationship derived from 5000 msec of data at each potential from microglia (▪) and BV-2 cells (▵) is shown on the bottom. In b, we show current recordings from BV-2 cells using 60 (top left) and 30 (top right) mm chloride in the cell-attached pipette. The three dotted lines are (from left to right) the linear fit of single-channel current amplitudes obtained from 2000 msec of data at different membrane voltages using 149.5 (▵), 60 (○), and 30 (•) mm chloride in the cell-attached pipette. Error bars have been omitted when smaller than symbols.
Microglial activation by Aβ25-35increases the open probability for CLIC1 conductance on the plasma membrane
Aβ25-35 stimulation of microglial cells led to a significant increase in both single-channel open probability (NPo) and mean open duration (τo) without changes in the channel conductance value. Figure 3a presents data from cell-attached experiments on BV-2 cells before and after 24 hr activation with Aβ25-35. At a membrane potential of +20 mV, NPo changed from 0.22 ± 0.08 to 0.48 ± 0.11 (n = 6; p < 0.05), and the mean open time increased from 4.9 ± 0.87 to 12.7 ± 2.76 msec (n = 6; p < 0.05), with a distribution made of a single-exponential component (Fig. 3b). Figure 3c depicts the action of 10 μm IAA-94, a specific CLIC1 blocker, acting on both control and Aβ25-35-stimulated cells. The experiment was performed in outside-out mode (Valenzuela et al., 2000) at 0 mV membrane potential. Single-channel properties are closely related to the already described biophysical characteristics of CLIC1 chloride permeability (Tonini et al., 2000; Valenzuela et al., 2000). At this concentration, IAA-94 is a highly specific blocker of CLIC1 chloride current, according to previous studies using CHO-transfected cells (Valenzuela et al., 2000) and artificial membrane systems (Tulk et al., 2000, 2002; Warton et al., 2002). From these experiments, we obtained data to plot an I-V relationship (Fig. 3d) from which we calculated single-channel conductances of 8.63 ± 0.015 pS and a current reversal potential of -63 mV, corresponding to a chloride permeability in these experimental conditions. In Figure 3e, we show the histograms, with the statistics over a large number of experiments, of the probability to observe CLIC1 channel activity in cell-attached configuration. In the case of Aβ stimulation, the probability to find at least one single channel was much greater than in any other experimental condition. It follows that the increased channel open probability associated with Aβ stimulation is probably attributable to both an increased number of functional channels on the plasma membrane and the prolongation of channel mean open time. This supports data described above that demonstrate increased CLIC1 protein on the plasma membrane in association with cell activation.
Figure 3.

Aβ stimulation alters CLIC1 single-channel activity in BV-2 cells. a, Sample traces recorded in untreated BV-2 cells (left) and in cells stimulated with 30 μm Aβ for 24 hr (right) at +20 mV membrane potential. b, CLIC1 channels showed a lengthening of the mean open time (τo) after Aβ treatment (right) compared with untreated cells (left). Histograms were best fitted by the single-exponential decay functions (line). Controls, meanτo = 4.3 msec, 273 openings; Aβ-stimulated, meanτo = 10.4 msec, 537 openings. C, Outside-out single-channel block by 10 μm IAA-94 on both control and stimulated BV-2 cells. d, Current-voltage relationship of CLIC1 single-channel outside-out experiment from which we calculated a conductance of 8.63 ± 0.015 pS and a current reversal potential of -63 mV. e, Aβ25-35 at 30 μm, but not 1 μg/ml LPS or 100 ng/ml bFGF treatment, increases the probability to record CLIC1 single-channel events on the cell membrane of BV-2 cells after 24 hr of stimulation. CTRL, Controls.
We experienced a serious problem performing whole-cell experiments to further support this evidence. CLIC1 is extremely sensitive to cytoplasmic washout, perhaps because it may move out of, as well as onto, membranes. This was also true in CLIC1-transfected CHO cells used in our previous studies (Tonini et al., 2000; Valenzuela et al., 2000). We also tried to use the perforated-patch technique, but the majority of the current records appeared unstable.
Blockade of CLIC1 inhibits microglial cell proliferation
Aβ25-35 is known to modify microglial morphology, proliferation, and ability to produce potentially neurotoxic molecules. Additionally, a number of scientific reports suggest that the proliferation of microglia is dependent on the activity of ionic membrane currents, in particular on chloride conductances (Schlichter et al., 1996; Eder, 1998). To investigate the possible role of CLIC1 in the process of Aβ-mediated microglial proliferation, we used IAA-94 to test the influence of CLIC1 chloride conductance on the proliferation of microglial cells. IAA-94, used at concentrations <50 μm, behaves as a specific CLIC1 chloride channel blocker. Figure 4 shows the effect of IAA-94 on cellular growth rate measured in the presence of Aβ25-35 (a, d) and bFGF (b, e) in BV-2 cells (a-c) and primary microglia (d, e). Both Aβ25-35 and bFGF induced a mitogenic response in microglial cells, and IAA-94 inhibited Aβ-induced microglial proliferation, although it did not seem to interfere with the proliferation of either bFGF-treated or control microglial cells.
Figure 4.

Effect of chloride channel blockers on the proliferation of microglia. BV-2 cells were treated with 30 μm Aβ25-35 (a) or 100 ng/ml bFGF (b) alone or in combination with the CLIC1 channel blocker IAA-94 (30 μm). Cells treated with IAA94 alone are shown in c. In d, rat primary microglia was stimulated with 30 μm Aβ25-35 alone and together with 30 μm IAA-94. The same experiment but using bFGF 100 ng/ml is shown in e.Cell count was performed after 24 and 48 hr of treatment. The experiments were repeated four times with similar results.
Blockade of CLIC1 inhibits neuronal toxicity induced by Aβ25-35-activated microglial cells
As mentioned previously, Aβ25-35-dependent activation of microglia results in acquisition of a reactive phenotype with the production and secretion of proinflammatory products. Activated microglia is believed to influence the course of AD by accelerating the rate of neuronal death. On the basis of these observations, we investigated whether IAA-94 could be a neuroprotective agent. Neuronal survival was tested in the presence of Aβ25-35-stimulated primary rat microglia in two different cellular models: mixed neuronal-microglial cultures, in which microglial cells were seeded among cortical neurons, and neuronal-microglial cocultures, in which hippocampal neurons were cocultivated with microglial cells but were not in direct contact with them. Figure 5a shows cortical neuronal cell viability determined by uptake and hydrolysis of fluorescein diacetate after 24 hr of Aβ25-35 incubation. Negligible signs of damage were observed in primary neurons alone or in mixed neuronal-microglial cultures. In contrast, the Aβ25-35-activated microglia exerted a marked neurotoxic effect that was inhibited by simultaneous incubation with the CLIC1 chloride channel blocker IAA-94 (18 ± 2.3% of surviving rescue). IAA-94, tested separately on nonstimulated mixed cultures, had no effects on neuronal survival.
Figure 5.
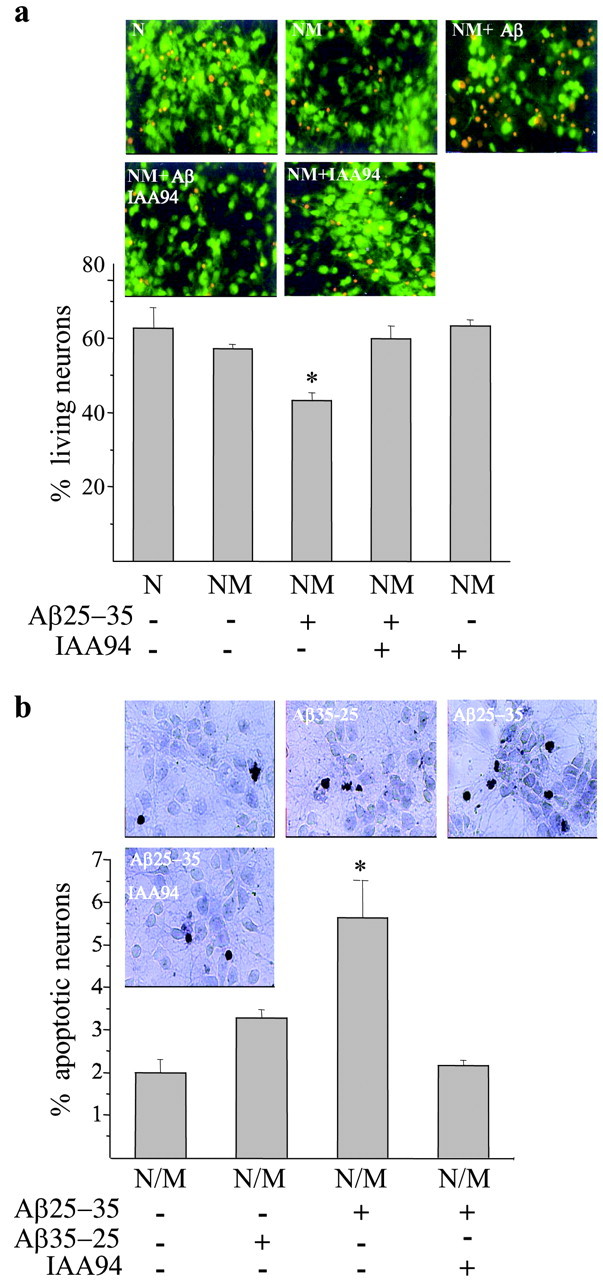
CLIC1 blockade protects neurons from microglia-mediated Aβ-induced neurotoxicity. a, Viability of cortical neurons determined by uptake and hydrolysis of fluorescein diacetate after 24 hr of incubation with 30 μm Aβ. The first two columns are data obtained from cortical neurons (N) and neurons plus microglial cells (NM). The combination of microglia and Aβ treatment exerted the highest neurotoxic effect (middle column), which was reversed by the simultaneous incubation with the CLIC1 chloride channel blocker IAA-94 (30 μm). IAA-94, tested separately on nonstimulated mixed cultures, had no effects on neuronal survival. Histograms represent the means ± SEM obtained from 12 different fields counted for each sample; *p < 0.001 versus untreated mixed cultures and cultures treated with Aβ in combination with IAA-94; ANOVA with Bonferroni-corrected t test. b, The percentage of apoptotic neurons is shown in cocultures of hippocampal neurons and microglia (N/M) treated for 24 hr with 30 μm Aβ or the correspondent reverse peptide alone or in combination with 30 μm IAA-94. The percentage of apoptotic cells was calculated as the number of TUNEL-positive cells divided by the total cell number. Histograms represent the means ± SEM; n = 3 experiments; *p < 0.05 versus controls (untreated cocultures or cultures treated with the reverse peptide Aβ35-25) and Aβ plus IAA-94; Mann-Whitney U test.
To confirm that the Aβ-induced neurotoxicity was attributable to the microglial production of diffusible neurotoxic molecules, we used cocultures, in which neuronal cells were not in direct contact with the microglial cells (Fig. 5b). Neuronal apoptosis was measured by TUNEL after 24 hr. Neurons conditioned by Aβ-treated microglia showed a clear increase in the number of TUNEL-labeled neuronal nuclei compared with control and reverse Aβ35-25-stimulated cultures. As observed previously with the mixed neuronal-microglial cultures, IAA-94 was able to prevent the neurotoxicity generated by activated microglia (Fig. 5b). Control neuronal cultures transferred onto plates containing Aβ but not the microglial monolayer did not show any increase in the number of apoptotic nuclei with respect to untreated cells (data not shown). However, our Western blot analysis of CLIC1 expression in purified hippocampal primary neurons shows only an almost undetectable band corresponding to CLIC1 molecular weight. Together, these results indicate that, in our experimental conditions, IAA-94 possibly acts by blocking microglial activation but not affecting directly neuronal survival.
Blockade of CLIC1 inhibits Aβ25-35-activated microglial cell production of TNF-α and nitrite
To address the question of how IAA-94 might protect neurons from Aβ-mediated neurotoxicity, we measured the production of TNF-α (Fig. 6a) and NO2- (Fig. 6b), which are known to mediate neuronal toxicity (Araujo and Cotman, 1992; Meda et al., 1995; Casal et al., 2002). The results show that both TNF-α and NO2- release were upregulated by Aβ25-35. Furthermore, CLIC1 chloride channel blockers were able to prevent their release from microglial cells. This inhibition was observed not only for IAA-94 (30 μm) but also for niflumic acid (100 μm), another CLIC1 blocker (data not shown).
Figure 6.

IAA-94 reverses the Aβ25-35 induction of both TNF-α and nitric oxide release. Cocultures of hippocampal neurons and microglia were treated for 24 hr with 30 μm Aβ25-35 alone or in combination with 30 μm IAA-94. Conditioned media were collected and analyzed for TNF-α by ELISA (a) and for nitrite levels using the Griess reaction (b). *p < 0.001 versus controls (CTRL) (untreated or IAA-94-treated cocultures) and Aβ plus IAA-94; ANOVA with Bonferroni-corrected t test. Data shown are means ± SEM.
RNA interference for CLIC1 reduces the production of TNF-α in Aβ25-35-activated BV-2 cells
To demonstrate a functional role of CLIC1 and its involvement in Aβ-induced microglial activation, we knocked down CLIC1 expression by a DNA vector-based RNA interference technique in which siRNAs are processed from short hairpin RNAs (shRNAs) (McManus and Sharp, 2002) (Dykxhoorn et al., 2003). In particular, we used a recently developed RNAi vector in which shRNAs are transcribed under the control of the polymerase II U1 promoter (M. A. Denti, A. Rosa, O. Sthandier, F. G. De Angelis, and I. Bozzoni, unpublished observation). As a functional assay of microglial activation, we measured the production of TNF-α after Aβ stimulation (Giri et al., 2003; Meda et al., 1995). The psiUb-CLIC1 constructs encode siRNAs that target the regions of CLIC1 mRNA indicated in Materials and Methods. The 21-nucleotide-long target sequences were chosen because they have no significant homology with other known murine genes, including the other members of the CLIC family. BV-2 cells were transfected with the control vector (psiUx) or with psiUb-clic1 constructs. At 48 hr after transfection, cells were stimulated with Aβ for 24 hr. All of the constructs reduce TNF-α release after Aβ treatment. Figure 7b shows the effects of the two more efficient constructs, which were able to completely prevent TNF-α release induced by Aβ treatment.
Figure 7.
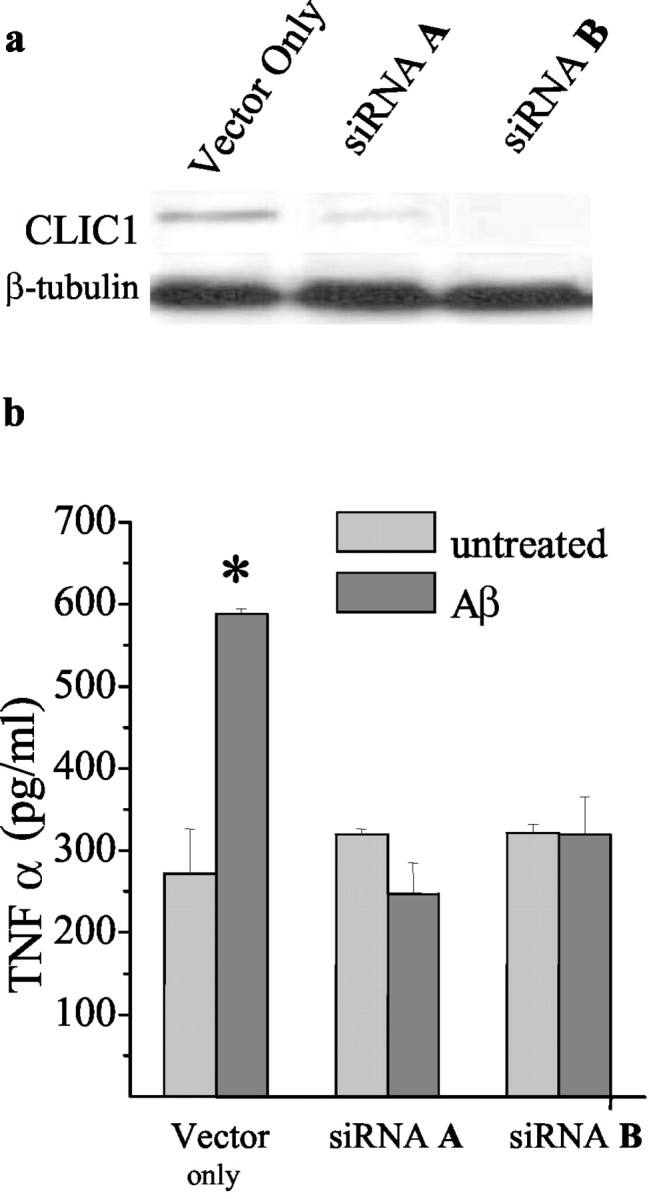
siRNAs inhibit TNF-α release in Aβ25-35-stimulated BV-2 cells. BV-2 cells were transiently transfected with psiUb-clic1 A or psiUb-clic1 B generating siRNA A or siRNA B. Western blot analysis of CLIC1 expresssion after 48 hr of transfection with vector only or with siRNA A or siRNA B is shown in a. After 48 hr of transfection, BV-2 cells were stimulated with 30 μm Aβ25-35 for 24 hr, the supernatants were collected, and TNF-α levels were measured by ELISA (b).
Discussion
Alzheimer's disease is a severe debilitating disorder for which no satisfactory therapy is available. It is characterized by the presence of a prominent inflammatory response, and targeting this inflammatory response offers one potentially useful therapeutic strategy. Therapy of inflammatory processes generally, but especially those involving the CNS, are difficult, and new therapeutic targets are required. As a group, ion channels have been particularly useful therapeutic targets, especially for the development of drugs acting on the cardiovascular system. We believe that the CLIC1 ion channel may be such a potential target, and this paper provides substantial evidence to validate this concept.
CLIC1 was originally cloned on the basis of increased mRNA expression with macrophage activation. However, in this paper, we provide the first evidence for increase in CLIC1 protein associated with a disease-specific activation modality. Furthermore, not only is increased protein expressed (Fig. 1), but, in association with Aβ activation, CLIC1 has a higher probability of being present in the plasma membrane (Fig. 1f), in which it needs to be located to function as an ion channel. This is further confirmed by the presence of substantially increased plasma membrane CLIC1-related ion channel activity accompanying cell activation (Fig. 3). In addition, this increase in CLIC1 protein expression is specific to the Aβ peptide and is not associated with LPS of bFGF treatment, consistent with data indicating that CLIC1 is not an LPS-responsive gene (Valenzuela et al., 1997).
How CLIC1 is involved in the activation process of microglial cells, at present, is not clear. However, it is known that stimulation of microglia with Aβ fibrils results in the activation of several kinases and the mobilization of intracellular calcium (Kalaria, 1999; Bamberger and Landreth, 2001). It is possible that the overall increase of CLIC1 protein attributable to Aβ stimulation promotes movement of CLIC1 onto the plasma membrane. In addition, changes in CLIC1 channel kinetics observed after Aβ treatment may be attributable to phosphorylation of some of the several putative target sites on CLIC1 (Valenzuela et al., 1997) and/or calcium mobilization. Both of these mechanisms could contribute to a marked increase of functional expression of CLIC1 chloride conductance.
The consequence of activation of microglial cells by Aβ peptide is the release of diffusible toxic substances that result in neuronal death. It is likely that at least two contributing molecules are TNF-α and nitric oxide, both of which are released as part of this activation process. Importantly, inhibition of CLIC1 conductance by the selective CLIC1 ion channel blocker IAA-94 (Figs. 5, 6) virtually completely abrogates both the release of TNF-α and nitrite production, as well as the consequent neurotoxicity. These results were reinforced using the RNA interference procedure, in which specific small RNAs for CLIC1 mRNA were able to completely inhibit TNF-α release after Aβ stimulation (Fig. 7). Both of these experimental procedures strongly support the involvement of CLIC1 protein during Aβ microglial activation.
In conclusion, it appears that the inhibition of Aβ-induced microglial activation could be reached by a reduction of CLIC1 function. How blocking a chloride channel inhibits the activation process is unknown. One speculative possibility is that calcium mobilization requires an influx of chloride ions to act as counterions. Limiting chloride entry into the cell may limit calcium mobilization and hence cell activation. Whatever the mechanism, it appears highly likely that blocking CLIC1 limits microglial activation and release of neurotoxic substances. Although an element of nonspecificity is always possible with pharmacological blockers, the sum total of information provided argues strongly that CLIC1 is involved in the Aβ-induced microglial cell activation and that blocking this ion channel serves to diminish it. We suggest that CLIC1 should be considered as a therapeutic target for Alzheimer's disease and, indeed, other inflammatory diseases.
Footnotes
This work was supported by a grant from Ministero dell'Istruzione, dell'Università, e della Ricerca (M.M.), by the Italian Ministry of Health, Department of Social Service Grant RF99.38 (G.M.L.), by Fondo per gli Investimenti della Ricerca di Base Grants RBNE01KXC9 and RBNE015MPB, by an intramural grant from Università Roma 1 “La Sapienza” (M.M.), and by the Alzheimer Project, Italian Ministry of Health (F.M.-A.). We thank Stefania Catino for excellent technical support and Renata Zippel for critical reading of this manuscript. We are also indebted to Prof. Irene Bozzoni for active support.
Correspondence should be addressed to Michele Mazzanti, Università La Sapienza, Biologia Cellulare e dello Sviluppo, Piazzale Aldo Moro 5, 00185 Rome, Italy. E-mail: michele.mazzanti@uniroma1.it.
Copyright © 2004 Society for Neuroscience 0270-6474/04/245322-09$15.00/0
G.N., C.F., and R.T. contributed equally to this work.
References
- Apparsundaram S, Schroeter S, Giovanetti E, Blakely RD (1998) Acute regulation of norepinephrine transport. II. PKC-modulated surface expression of human norepinephrine transporter proteins. J Pharmacol Exp Ther 287: 744-751. [PubMed] [Google Scholar]
- Araujo DM, Cotman CW (1992) Beta-amyloid stimulates glial cells in vitro to produce growth factors that accumulate in senile plaques in Alzheimer's disease. Brain Res 569: 141-145. [DOI] [PubMed] [Google Scholar]
- Bamberger ME, Landreth GE (2001) Microglial interaction with beta-amyloid: implications for the pathogenesis of Alzheimer's disease. Microsc Res Tech 54: 59-70. [DOI] [PubMed] [Google Scholar]
- Barger SW, Harmon AD (1997) Microglial activation by Alzheimer amyloid precursor protein and modulation by apolipoprotein E. Nature 388: 878-881. [DOI] [PubMed] [Google Scholar]
- Benveniste EN, Nguyen VT, O'Keefe GM (2001) Immunological aspects of microglia: relevance to Alzheimer's disease. Neurochem Int 39: 381-391. [DOI] [PubMed] [Google Scholar]
- Bezzi P, Carmignoto G, Pasti L, Vesce S, Rossi D, Rizzini BL, Pozzan T, Volterra A (1998) Prostaglandins stimulate calcium-dependent glutamate release in astrocytes. Nature 391: 281-285. [DOI] [PubMed] [Google Scholar]
- Brewer GJ, Torricelli JR, Evege EK, Price PJ (1993) Optimized survival of hippocampal neurons in B27-supplemented Neurobasal, a new serum-free medium combination. J Neurosci Res 35: 567-576. [DOI] [PubMed] [Google Scholar]
- Casal C, Serratosa J, Tusell JM (2002) Relationship between beta-AP peptide aggregation and microglial activation. Brain Res 928: 76-84. [DOI] [PubMed] [Google Scholar]
- Combs CK, Karlo JC, Kao SC, Landreth GE (2001) β-Amyloid stimulation of microglia and monocytes results in TNFα-dependent expression of inducible nitric oxide synthase and neuronal apoptosis. J Neurosci 21: 1179-1188. [DOI] [PMC free article] [PubMed] [Google Scholar]
- Dykxhoorn DM, Novina CD, Sharp PA (2003) Killing the messenger: short RNAs that silence gene expression. Nat Rev Mol Cell Biol 4: 457-467. [DOI] [PubMed] [Google Scholar]
- Eder C (1998) Ion channels in microglia (brain macrophages). Am J Physiol 275: C327-C342. [DOI] [PubMed] [Google Scholar]
- Egensperger R, Kosel S, von Eitzen U, Graeber MB (1998) Microglial activation in Alzheimer disease: association with APOE genotype. Brain Pathol 8: 439-447. [DOI] [PMC free article] [PubMed] [Google Scholar]
- Giri RK, Selvaraj SK, Kalra VK (2003) Amyloid peptide-induced cytokine and chemokine expression in THP-1 monocytes is blocked by small inhibitory RNA duplexes for early growth response-1 messenger RNA. J Immunol 170: 5281-5294. [DOI] [PubMed] [Google Scholar]
- Glenner GG, Wong CW (1984) Alzheimer's disease: initial report of the purification and characterization of a novel cerebrovascular amyloid protein. Biochem Biophys Res Commun 120: 885-890. [DOI] [PubMed] [Google Scholar]
- Goslin K, Banker G (1990) Rapid changes in the distribution of GAP-43 correlate with the expression of neuronal polarity during normal development and under experimental conditions. J Cell Biol 110: 1319-1331. [DOI] [PMC free article] [PubMed] [Google Scholar]
- Itagaki S, McGeer PL, Akiyama H, Zhu S, Selkoe D (1989) Relationship of microglia and astrocytes to amyloid deposits of Alzheimer disease. J Neuroimmunol 24: 173-182. [DOI] [PubMed] [Google Scholar]
- Kalaria RN (1999) Microglia and Alzheimer's disease. Curr Opin Hematol 6: 15-24. [DOI] [PubMed] [Google Scholar]
- Malchiodi-Albedi F, Domenici MR, Paradisi S, Bernardo A, Ajmone-Cat MA, Minghetti L (2001) Astrocytes contribute to neuronal impairment in beta A toxicity increasing apoptosis in rat hippocampal neurons. Glia 34: 68-72. [DOI] [PubMed] [Google Scholar]
- McGeer EG, McGeer PL (1997) The role of the immune system in neurodegenerative disorders. Mov Disord 12: 855-858. [DOI] [PubMed] [Google Scholar]
- McGeer EG, McGeer PL (1998) The importance of inflammatory mechanisms in Alzheimer disease. Exp Gerontol 33: 371-378. [DOI] [PubMed] [Google Scholar]
- McGeer PL, Kawamata T, Walker DG, Akiyama H, Tooyama I, McGeer EG (1993) Microglia in degenerative neurological disease [review]. Glia 7: 84-92. [DOI] [PubMed] [Google Scholar]
- McGeer PL, Walker DG, Akiyama H, Yasuhara O, McGeer EG (1994) Involvement of microglia in Alzheimer's disease. Neuropathol Appl Neurobiol 20: 191-192. [PubMed] [Google Scholar]
- McManus MT, Sharp PA (2002) Gene silencing in mammals by small interfering RNAs. Nat Rev Genet 3: 737-747. [DOI] [PubMed] [Google Scholar]
- Meda L, Cassatella MA, Szendrei GI, Otvos LJ, Baron P, Villalba M, Ferrari D, Rossi F (1995) Activation of microglial cells by beta-amyloid protein and interferon-gamma. Nature 374: 647-650. [DOI] [PubMed] [Google Scholar]
- Schlichter LC, Sakellaropoulos G, Ballyk B, Pennefather PS, Phipps DJ (1996) Properties of K+ and Cl- channels and their involvement in proliferation of rat microglial cells. Glia 17: 225-366. [DOI] [PubMed] [Google Scholar]
- Styren SD, Kamboh MI, DeKosky ST (1998) Expression of differential immune factors in temporal cortex and cerebellum: the role of alpha-1-antichymotrypsin, apolipoprotein E, and reactive glia in the progression of Alzheimer's disease. J Comp Neurol 396: 511-520. [PubMed] [Google Scholar]
- Tonini R, Ferroni A, Valenzuela SM, Warton K, Campbell TJ, Breit SN, Mazzanti M (2000) Functional characterization of the NCC27 nuclear protein in stable transfected cho-k1 cells. FASEB J 14: 1171-1178. [DOI] [PubMed] [Google Scholar]
- Tulk BM, Schlesinger PH, Kapadia SA, Edwards JC (2000) CLIC-1 functions as a chloride channel when expressed and purified from bacteria. J Biol Chem 275: 26986-26993. [DOI] [PubMed] [Google Scholar]
- Tulk BM, Kapadia S, Edwards JC (2002) CLIC1 inserts from the aqueous phase into phospholipid membranes, where it functions as an anion channel. Am J Physiol Cell Physiol 282: C1103-C1112. [DOI] [PubMed] [Google Scholar]
- Valenzuela S, Martin D, Por S, Robbins J, Bootcov M, Schofield P, Campbell T, Breit S (1997) Molecular cloning and expression of a chloride ion channel of cell nuclei. J Biol Chem 272: 12575-12582. [DOI] [PubMed] [Google Scholar]
- Valenzuela SM, Mazzanti M, Tonini R, Qiu MR, Warton K, Musgrove EA, Campbell TJ, Breit SN (2000) The nuclear chloride ion channel NCC27 is involved in regulation of the cell cycle. J Physiol (Lond) 529: 541-552. [DOI] [PMC free article] [PubMed] [Google Scholar]
- Warton K, Tonini R, Fairlie WD, Matthews JM, Valenzuela SM, Qiu MR, Wu WM, Pankhurst S, Bauskin AR, Harrop SJ, Campbell TJ, Curmi PMG, Breit SN, Mazzanti M (2002) Recombinant CLIC1 (NCC27) assembles in lipid bilayers via a pH-dependent two-state process to form chloride ion channels with identical characteristics to those observed in Chinese hamster ovary cells expressing CLIC1. J Biol Chem 277: 26003-26011. [DOI] [PubMed] [Google Scholar]
- Yankner BA, Duffy LK, Kirschner DA (1990) Neurotrophic and neurotoxic effects of amyloid beta protein: reversal by tachykinin neuropeptides. Science 250: 279-282. [DOI] [PubMed] [Google Scholar]