

Abstract
Despite the marked influence on neuronal physiology of the low-voltage activated T-type Ca2+ currents, little is known about the intracellular pathways and neurotransmitters involved in their regulations. Here, we report that in thalamocortical neurons a phosphorylation mechanism induces an increase both in the current amplitude (1.5 ± 0.27-fold in the ventrobasal nucleus) and its inactivation kinetics. Dialysis of the neuron with an ATP-free solution suppresses the T-current potentiation, whereas it becomes irreversible in the presence of ATPγS. Phosphorylation occurs when the channels are inactivated and is slowly removed when they recover from inactivation and remain in closed states (time constants of the induction and removal of the potentiation: 579 ± 143 msec and 4.9 ± 1.1 sec, respectively, at 25°C). The resulting apparent voltage sensitivity of this regulation follows the voltage dependence of the current steady-state inactivation. Thus, the current is paradoxically inhibited when the preceding hyperpolarization is lengthened, and maximal currents are generated after transient hyperpolarizations with a duration (0.7-1.5 sec) that is defined by the balance between the kinetics of the dephosphorylation and deinactivation. In addition, the phosphorylation will facilitate the generation of T current at resting membrane potential. This potentiation, which is specific to sensory thalamocortical neurons, would markedly influence the electroresponsiveness of these neurons and represent the first evidence of a regulation of native Cav3.1 channels.
Keywords: facilitation, phosphorylation, potentiation, thalamus, current, T-type, calcium
Introduction
The low voltage-activated (T-type) Ca2+ current is essential in shaping the firing patterns of different neuronal types under physiological and pathological conditions (Huguenard, 1996; Perez-Reyes, 2003). Because of its peculiar voltage dependence of activation and transient nature, the T-type Ca2+ current generates a transient depolarization (called the low-threshold Ca2+ potential) at potentials close to neuronal resting membrane potentials. Because T channels are totally inactivated at potentials more than or equal to -60 mV, removal of inactivation (which is both voltage and time dependent) is required before a T current is evoked (Llinas and Yarom, 1981; Deschenes et al., 1984; Greene et al., 1986; Llinas and Muhlethaler, 1988). The amplitude of the T current (and of the low-threshold Ca2+ potential), therefore, increases progressively with the increasing size and duration of a preceding hyperpolarization and is classically believed to reach a plateau after a 1-2 sec hyperpolarization (Huguenard, 1996; Perez-Reyes, 2003).
The physiological role of the T-type current has been studied extensively in the thalamus, both in the relay nuclei and in the nucleus reticularis, the main source of inhibitory inputs to thalamocortical neurons (Jahnsen and Llinas, 1984; Crunelli et al., 1987; Crunelli et al., 1989; Suzuki and Rogawski, 1989; Huguenard and Prince, 1992; Tsakiridou et al., 1995). In both types of nuclei, low-threshold Ca2+ potentials underlie the occurrence of rhythmic activities associated with different stages of sleep (Steriade et al., 1993), and in thalamocortical neurons, might be involved in the transmission of novel information during wakefulness (Ramcharan et al., 2000; Fanselow et al., 2001; Swadlow and Gusev, 2001; Weyand et al., 2001).
Despite this marked influence of T-type Ca2+ currents on neuronal physiology, little is known about their regulation in situ by intracellular pathways and neurotransmitters. After the cloning of the three T-channel isotypes (Cav3.1, -2, and -3 or α1G, -H, and -I) (Cribbs et al., 1998; Perez-Reyes et al., 1998; Lee et al., 1999), a few types of regulations of Cav3.2 and -3.3 channel activities have been characterized in heterologous expression systems (Fearon et al., 2000; Zhang et al., 2000; Chemin et al., 2001; Todorovic et al., 2001; Wolfe et al., 2002, 2003; Welsby et al., 2003), but none for Cav3.1 channels.
Here, we describe a phosphorylation mechanism of the T current that induces an increase in both current amplitude and inactivation kinetics. This phosphorylation occurs when the channels are inactivated and is slowly removed when they recover from inactivation and remain in closed states. As a consequence, the T current is paradoxically inhibited when the preceding hyperpolarization is lengthened, and a maximal current is generated after transient hyperpolarizations with a duration (0.7-1.5 sec) that is determined by the balance between the kinetics of the dephosphorylation and deinactivation. In addition, because activation of fewer channels is required to evoke large currents when phosphorylation occurs, this potentiation facilitates the generation of T current at depolarized potentials by reducing the number of channels that have to recover from inactivation. This novel regulation is not present in every thalamic relay nuclei but is a major feature of T-type Ca2+ channels in sensory thalamocortical neurons.
Materials and Methods
Slices. The brain was excised from 8- to 12-d-old Wistar rats. A block of tissue containing the thalamus was removed and placed in a cold (<4°C), oxygenated (95% O2/5% CO2) solution of artificial CSF containing (in mm): 125 NaCl, 2.5 KCl, 2 CaCl2, 1 MgCl2, 1.25 NaH2PO4, 26 NaHCO3, and 25 glucose. To study the ventrobasal and reticularis nuclei, the block of tissue was glued, ventral surface uppermost, to the stage of a vibroslicer (Leica VT1000S), and 220-μm-thick horizontal sections containing the ventrobasal nucleus and the nucleus reticularis were prepared by using the internal capsule and the medial lemniscus as landmarks. For the study of the other thalamic nuclei, the block of brain tissue was glued anterior surface uppermost, and 220-μm-thick coronal slices were obtained using the hippocampus and the ventricles as landmarks. Slices were kept at 32°C in the oxygenated solution for at least 1 hr before being transferred to the experimental setup, where they were perfused at a rate of 1-2 ml/min. Experiments were conducted at room temperature, except when mentioned otherwise.
Whole-cell recordings. Membrane currents were recorded in the whole-cell configuration of the patch-clamp technique using an Axopatch 200B amplifier (Axon Instruments, Foster City, CA). Thalamic neurons were visualized under Nomarski optics (Zeiss Axioskop; 60× lens). Recording pipettes were pulled from borosilicate glass (WPI; TW150F) and coated with wax. Except when specified (see below), electrodes were filled with the following solution (in mm): 110 CsCl, 1 CaCl2, 5 MgCl2, 10 BAPTA, 10 HEPES, 4 Na-ATP, 15 phosphocreatine, and 50 U/ml creatine phosphokinase, pH 7.3; osmolarity 305 mOsm. In every thalamic nuclei studied, some experiments were performed with biocytin (up to 5 mg/ml) containing internal solution to assess the position and morphology of the recorded neurons (see Immunohistochemistry). Values of access resistance ranged from 4-6 MΩ at the beginning of the recording to 4-10 MΩ at the end. At least 70% of the cell capacitance and series resistances were compensated. Voltage protocols and acquisition were controlled by Axograph 4.8, and the holding potential was set to -60 mV. Membrane currents were filtered by a four-pole Bessel filter set at a corner frequency of 5 kHz, digitalized on-line at 10 kHz, and later analyzed using IgorPro 4.0 homemade routines. Leak currents were subtracted off-line using templates constructed from the current induced by a 10 mV hyperpolarizing step applied from -100 mV at the end of each episode.
The extracellular recording medium contained (in mm): 125 NaCl, 2.5 KCl, 2 CaCl2, 1 MgCl2, 1.25 NaH2PO4, 26 NaHCO3, and 25 glucose, pH 7.3. To isolate Ca2+ currents and suppress any GABAergic synaptic currents, the following were also added: 10 mm TEA, 1 mm 4-aminopyridine, 0.5 μm tetrodotoxin (Tocris), 2 mm CsCl, and 1 μm SR95531 (Tocris). For experiments in which extracellular K+ channel blockers were omitted, 10 mm TEA-Cl was added to the internal solution, and the CsCl concentration was decreased accordingly.
Drugs. In experiments performed with ATP-free solution, Na-ATP, phosphocreatine, and creatine phosphokinase were omitted from the internal solution. When ATP analogs were used, these compounds were replaced by either 4 mm adenosine 5′-(β,γ-imido)triphosphate (AMPPNP) (lithium salt) or ATPγS (lithium salt).
4-Amino-5-(4-chlorophenyl)-7-(t-butyl)pyrazolo[3,4-d]pyrimidine (PP2) (Calbiochem, La Jolla, CA), tyrphostin α-cyano-(3,4-dihydroxy) thiocinnamide (AG213) (Calbiochem), staurosporine (Calbiochem), genistein (Calbiochem), and K-252a (Calbiochem) were first dissolved in DMSO and further diluted (minimal dilution 1:1000) to the final concentration in the extracellular solution. The stock solution of (1R,3R,4S)-1-aminocyclopentane-1,3,4-tricarboxylic acid (ACPT II) (Tocris) was first prepared in alkaline solution (21 mm; pH 10). (2S)-3-[[(1S)-1-(3,4-dichlorophenyl)ethyl]amino-2-hydroxypropyl](phenylmethyl)phosphinic acid (CGP55845) (Tocris) and atropine were dissolved in H2O and further diluted to the final concentration in the extracellular solution. GTPγS (lithium salt), GDPβS (lithium salt), okadaic acid, and N-(2-aminoethyl)-5-isoquinolinesulfonamide (H9) (Calbiochem) were diluted in the internal solution. All chemicals were obtained from Sigma (St. Louis, MO) unless stated otherwise.
Immunohistochemistry. Slices were fixed overnight in 4% paraformaldehyde and then washed with 0.1% PBS. Biocytin-filled neurons were revealed using the avidin-biotin-peroxidase complex (ABC) method (ABC elite kit; Vector Laboratories, Burlingame, CA). After blocking endogenous peroxidase with 0.3% H2O2 in 0.4% Triton X-100 and PBS, slices were incubated in ABC for 2 hr. Incubated slices were washed in PBS before immersion in a solution containing 0.05% of 3,3′-diaminobenzidine tetrahydrochloride in 0.1 m Tris buffer and 0.02% H2O2. After several washes in PBS, slices were mounted on gelatin-coated slides, counterstained with Safranine, and dehydrated through alcohol to xylene for light microscopic examination. The position of labeled neurons within the thalamus was confirmed using the atlas of Paxinos and Watson (1986).
Quantitative data in the text and figures are given as mean ± SD.
Results
Paradoxical voltage-dependent regulation of the T-type current in ventrobasal neurons
Recovery from inactivation of the T-type channels induced at the -60 mV holding potential was studied in thalamocortical neurons of the ventrobasal (VB) nuclei. The proportion of the channel population recovering from inactivation during -100 mV hyperpolarizing prepulses of various durations was estimated from the current amplitude evoked at -50 mV (Fig. 1A). Surprisingly, in the thalamocortical neurons recorded in the VB, the amplitude of the current as a function of the prepulse duration showed a maximum for 0.7-1.5 sec hyperpolarizations, whereas longer prepulses resulted in smaller currents (Fig. 1A). This suggests that holding VB neurons at potentials at which low-voltage-activated Ca2+ channels are closed and get out from inactivation either induced an inhibition or removed a potentiation of the T current. Reduction in current amplitude on long hyperpolarization was observed in every one of the 105 VB neurons recorded. To quantify this effect, we systematically compared the current amplitudes evoked at -50 mV after 10 sec (IT10 sec) and 1 sec (IT1 sec) hyperpolarizing steps to -100 mV (Figs. 1B,2). The currents recorded after the 1 sec hyperpolarization were 1.51 ± 0.27-fold (range: 1.2-2.4; n = 105) larger than that measured after the 10 sec prepulse. To check that the reduction in current amplitude observed after prolonged hyperpolarization was not caused by a change in the electronic compactness of the cell, we compared the capacitive transients evoked at different times during the hyperpolarizing prepulse. As illustrated in Figure 1, B and C, for the six tested cells, the capacitive transients were identical regardless of the duration of the preceding hyperpolarization. This indicates that the decrease in the T current amplitude is not caused by the electrical disconnection of a dendritic compartment from the soma during the prolonged hyperpolarization at -100 mV. In addition, such disconnection, if present, must be induced by the activation of a shunt conductance during the prolonged hyper-polarization. Therefore, in 30 cells that displayed highly stable leak current [and a marked difference in the T current amplitude (IT1 sec to IT10 sec ratio: 1.55 ± 0.23)], we compared the mean amplitudes of the holding currents estimated during the last 300 msec of the 10 and 1 sec hyperpolarizing prepulses, respectively. These mean amplitudes differed by less than ±5 pA (absolute value: 2.1 ± 1.5 pA). We therefore conclude that the difference in T-current amplitudes according to the prepulse duration was not caused by changes in the voltage clamp.
Figure 1.
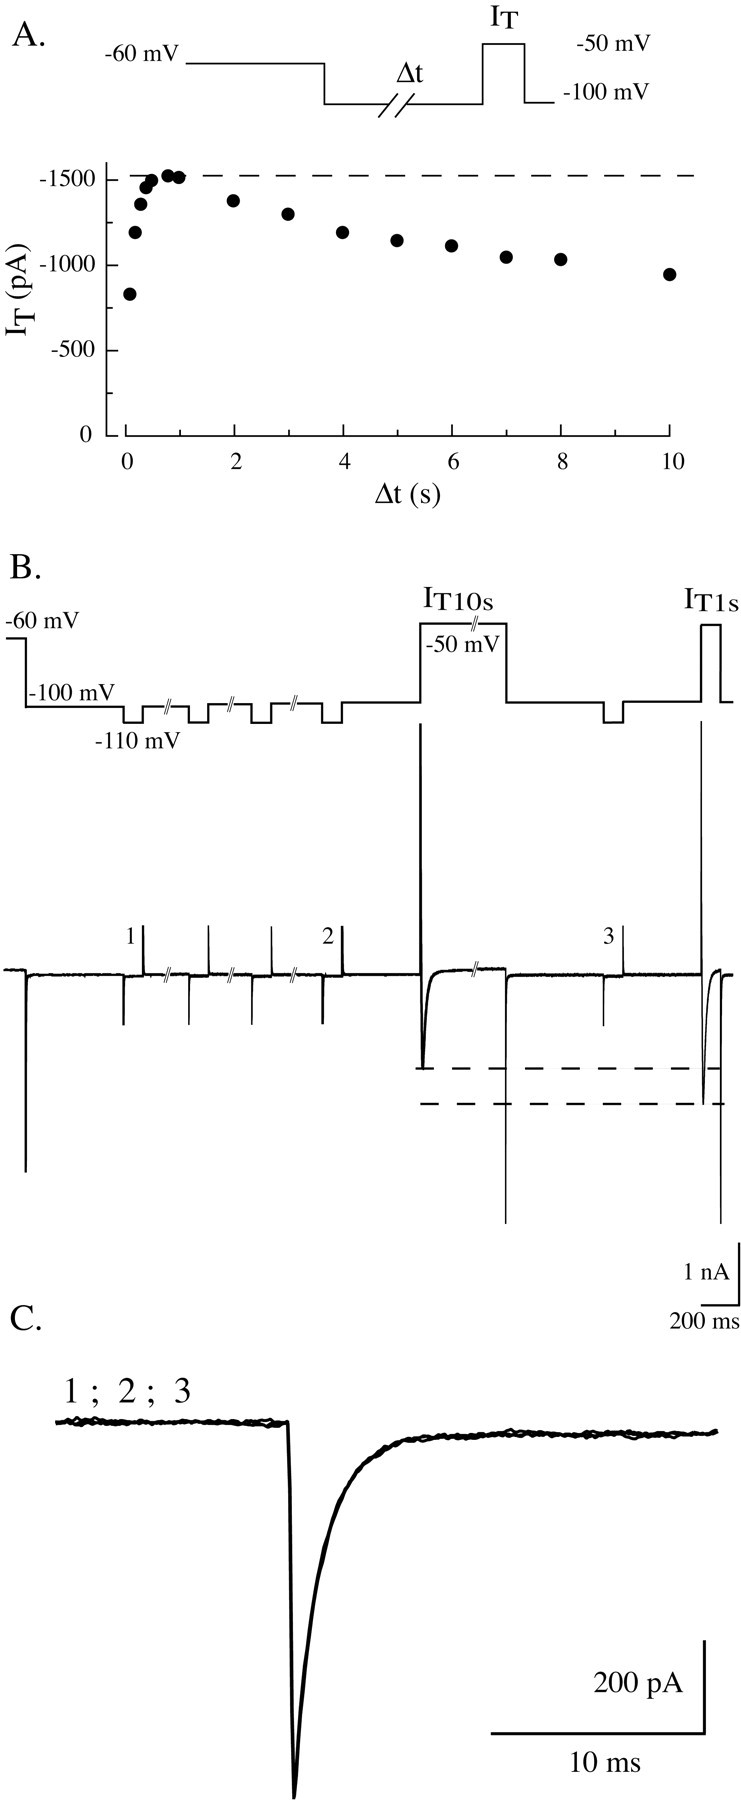
Anomalous decrease of the amplitude of the T-type current after long hyperpolarizations. A, The graph shows the amplitude of the T current (IT) evoked at -50 mV in a VB neuron as a function of the duration (Δt) of the preceding hyperpolarization to -100 mV (see diagram of protocol). Note the biphasic shape of the curve, with an increase in current amplitude resulting from a progressive recovery from inactivation of the channel population occurring during the first second combined with a slow decrease in current amplitude when the hyperpolarizing prepulse is lengthened. The maximal current is obtained with a 1 sec hyperpolarization. B, Examples of T currents recorded without serial resistance and capacitive compensation or leak current subtraction to test the passive properties of the cell. Note that the VB neuron displays a clear difference in the amplitudes of T currents evoked at -50 mV after either a 10 sec (IT10 sec) or 1 sec (IT1 sec) hyperpolarizing prepulse to -100 mV. The two hyperpolarizations are separated by a 10 sec depolarization to -50 mV (see diagram of the protocol). The passive properties of the cell were monitored during the hyperpolarizing prepulses with 100 msec steps to -110 mV. Capacitive transients evoked during steps 1, 2, and 3 are superimposed in C. Note the stability of both the capacitive transients and the leak currents (-133, -130, and -134 pA, respectively).
Figure 2.
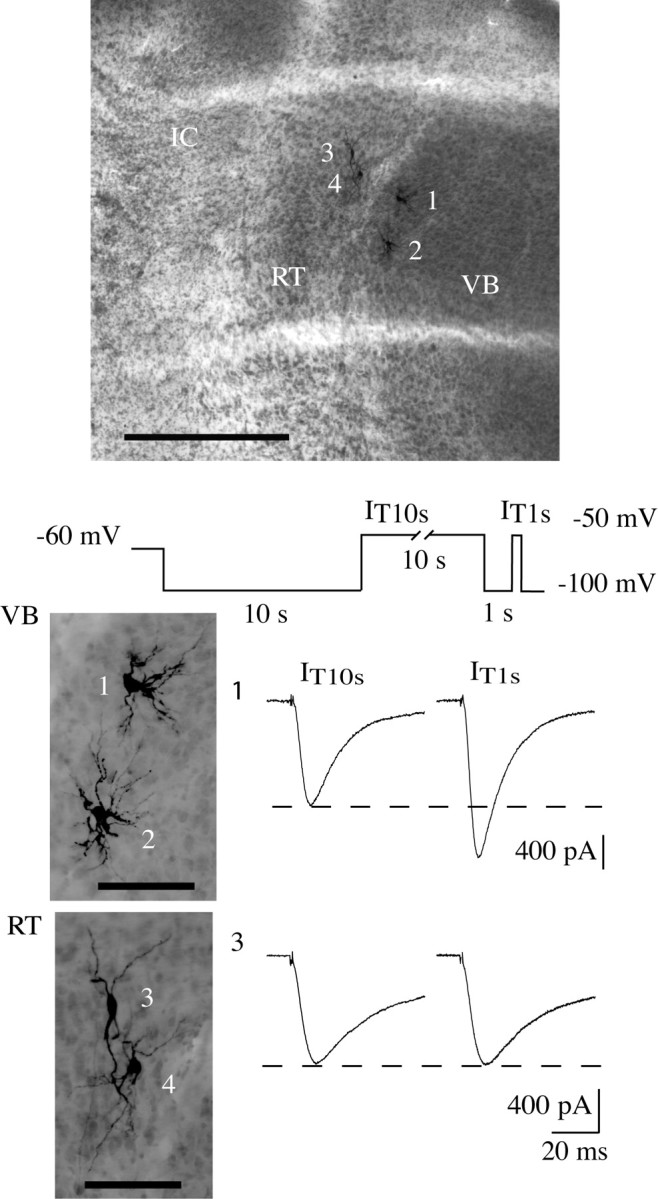
Voltage-dependent T-type current modulation is present in every ventrobasal neuron but is absent in cells of the reticular nucleus. A typical horizontal thalamic slice (top picture) is presented, where four neurons were recorded and filled with biocytin. Cells 1 and 2 are thalamocortical neurons from the VB nucleus, whereas cells 3 and 4 are from the RT nucleus (transversal white lines were caused by the net used to immobilize the slices during recording). ic, Internal commissure. Scale bar, 500 μm. Note the typical morphology of the two cell populations illustrated in the enlarged pictures (bottom). Scale bar, 100 μm. Current traces recorded in VB neuron 1 and RT neuron 3 at -50 mV preceded either by a 10 sec (IT10 sec; left traces) or a 1 sec (IT1 sec; right traces) prepulse at -100 mV are presented. Note that a 10 sec step depolarization to a potential (-50 mV) at which T channels inactivate separate the two hyperpolarizations (see diagram of the protocol). The current evoked after the short hyperpolarization (IT1 sec) is much larger than that evoked after the long hyperpolarization (IT10 sec) in the VB neuron (same data were obtained with adjacent neuron 2). The two currents recorded in the RT neuron, however, have a similar amplitude (same observations were made on adjacent neuron 4).
The T-type current regulation is not present in all thalamic nuclei
To test whether this modulation of T-channel activity was a general property of low-voltage-activated Ca2+ channels in thalamic neurons, either the full-time dependence of recovery from inactivation was studied or the amplitudes of IT1 sec and IT10 sec were compared in neurons of different thalamic nuclei. We first investigated neurons from the reticular (RT) nucleus, which is adjacent to the VB (Fig. 2). T currents recorded in these neurons display the slow kinetics of the Cav3.3 isotype that is specifically expressed in this nucleus (Talley et al., 1999), as described previously (Huguenard and Prince, 1992; Tsakiridou et al., 1995). No difference was observed between the T current recorded after the short and long hyperpolarization in every cell tested (n = 5) (Fig. 2), demonstrating the absence of this T-current regulation in neurons of the RT nucleus. We then studied thalamocortical neurons from different nuclei that have been shown to preferentially express the same Cav3.1 channel isotype (Talley et al., 1999) as VB neurons. As in the somatosensory thalamocortical neurons of the VB nuclei, the anomalous decrease in current amplitude after prolonged hyperpolarizing prepulses was also observed in every neuron recorded from the dorsal lateral geniculate nucleus (LGN) that relays visual sensory information (IT1 sec to IT10 sec ratio: 1.36 ± 0.11; n = 5) (Fig. 3A) and from the medial geniculate body (MGB) relaying the auditory sensory information (IT1 sec to IT10 sec ratio: 1.59 ± 0.14; n = 6; data not shown).
Figure 3.
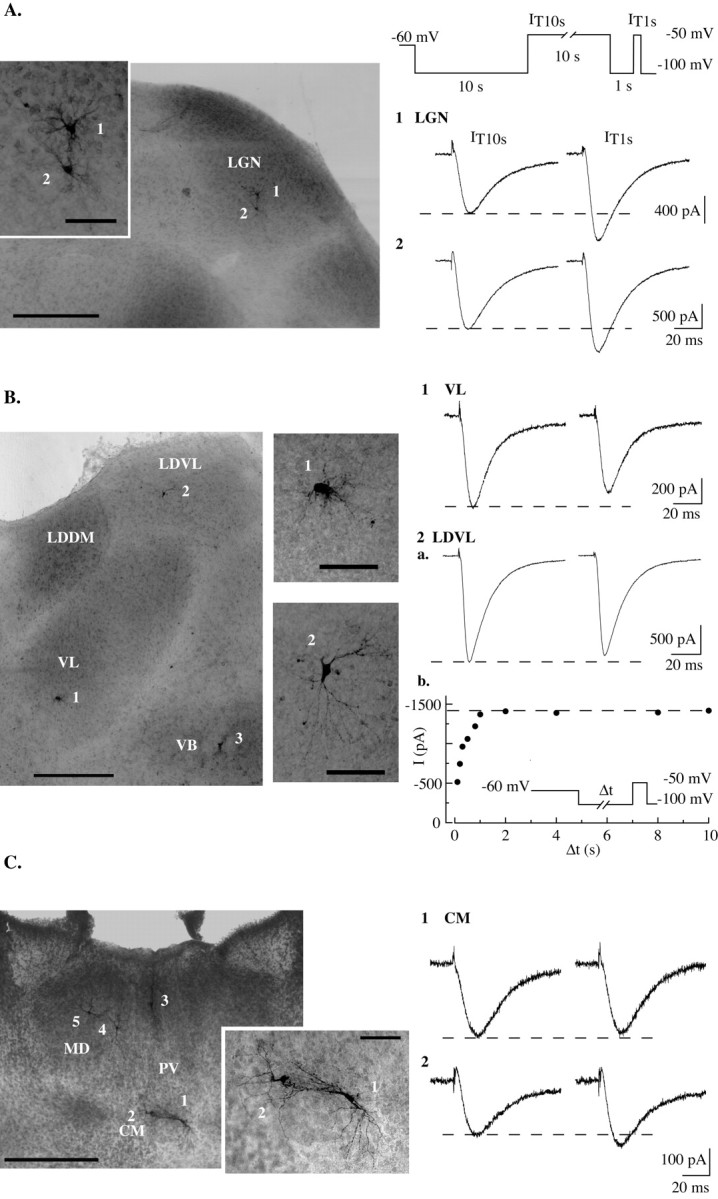
Voltage-dependent T-type current modulation is a major feature of neurons in sensory thalamic nuclei. Pictures show transversal slices displaying biocytin-filled neurons from different thalamic nuclei with T currents that were studied using the protocols described in Figure 2 (see diagrams of the protocols and Fig. 2 legend). Corresponding current traces are shown on the right. In A, T currents recorded in two adjacent sensory thalamocortical neurons from the dorsal LGN are presented. In both cases the current amplitude obtained after a 1 sec hyperpolarization (IT1 sec) is larger than the one evoked after a 10 sec hyperpolarizing prepulse (IT10 sec). B, Neurons from the VL nucleus, the LDVL nucleus, and the VB nucleus were studied in thesameslice. Note that in both VL and LDVL neurons, IT1 sec is slightly smaller than IT10 sec (1 and 2a) because of an incomplete recovery from inactivation during the 1 sec prepulse and the absence of the T-current regulation described in A. This regulation was present, however, in the VB neuron (cell 3) recorded in the same slice (data not shown). The plot in 2b illustrates the recovery from inactivation measured in the LDVL neuron (see protocol in inset and Fig. 1 A legend), which confirms that the T-current amplitude is stable when increasing the hyperpolarization duration >1 sec in this cell type. Neurons from the intralaminar and median nuclei are presented in C. Two neurons were recorded in the centromedian nucleus (CM) (cells 1 and 2), one in the paraventricular nucleus (PV) (cell 3), and two in the mediodorsal nucleus (MD) (cells 4 and 5). In each nucleus, the T currents displayed characteristics similar to those illustrated for the two adjacent CM neurons: IT1 sec amplitude was either equal (cell 1) or slightly larger (cell 2) than IT10 sec. VLG, Ventral lateral geniculate nucleus; LDDM, laterodorsal dorsomedian nucleus. Scale bars: low-power pictures, 500 μm; enlarged pictures, 100 μm.
To test whether the voltage-dependent regulation of the current amplitude is restricted to neurons of sensory relay nuclei, we then investigated T-channel activity in neurons of two nonsensory thalamic nuclei: the ventrolateral (VL) nucleus (Fig. 3B), which relays inputs from the cerebellum and globus pallidus, and the laterodorsal (LDVL) nucleus (Fig. 3B), which relays inputs from the hippocampus and visually related areas. No difference in current amplitude after short and long hyperpolarizing prepulses could be observed in VL (IT1 sec to IT10 sec ratio: 1.05 ± 0.07; n = 10) (Fig. 3B1) and LDVL (IT1 sec to IT10 sec ratio: 0.96 ± 0.05; n = 17) (Fig. 3B2) neurons. Because the similarity in current amplitudes might have been caused by a slower deinactivation kinetics of the T channels expressed in these neurons, currents were evoked after hyperpolarizing prepulses varying from 100 msec to 10 sec. Contrary to what had been observed in VB neurons, however, when full recovery from inactivation was achieved after a 1 sec prepulse in LDVL neurons, the current showed a maximum and did not decrease in amplitude after longer prepulses (Fig. 3B2b), confirming the lack of T-current modulation.
Because of the heterogeneity of the midline and intralaminar nuclei, which are generally referred to as nonspecific thalamic nuclei, we did not perform a systematic study in this area but looked at T-current regulation in seven neurons of the paraventricular and centromedian nuclei. In three neurons, the duration of the hyperpolarizing prepulse did not condition the T-current amplitude, but in the four remaining neurons, although not significant, IT1 sec values were slightly larger than IT10 sec values (1.15 ± 0.05-fold increase), with both situations being observed in adjacent cells of the same nucleus (Fig. 3C). Interestingly, with the exception of one paraventricular neuron, T currents were surprisingly smaller in these two nuclei (368 ± 212 pA; n = 6) than in VL, LDVL, LGN, MGB, and VB neurons (900 ± 478 pA, n = 10; 2561 ± 860 pA, n = 17; 959 ± 620 pA, n = 6; 1063 ± 468, n = 6; and 1793 ± 701 pA, n = 105, respectively). Finally, either a small current amplitude difference or no difference was observed in neurons from mediodorsal nuclei (n = 3) (data not shown). Thus, the present voltage-dependent regulation of the T current is a major feature of the low-threshold calcium channel activity in sensory thalamocortical neurons, but is absent in non-sensory thalamocortical neurons.
Further characterization of this T-current modulation was performed in VB neurons, except when specified otherwise.
Voltage dependence of the T-type current regulation
In six VB neurons, the voltage dependence of the T-current modulation was estimated by measuring the effect of 10 sec prepulses to various potentials on the amplitude of the currents evoked at -50 mV (Fig. 4A). As illustrated, the current amplitude increased progressively following the increase in prepulse potential (Fig. 4A). Comparison between the amplitude of the current obtained after 10 sec hyperpolarizing prepulses at different potentials and after 1 sec hyperpolarization at -100 mV indicates that the voltage dependence of the T-current regulation lies between -90 and -65 mV (Fig. 4B). Adjustment of the data with a modified Boltzmann function (Fig. 4 legend) estimates a potential of half-effect of -79 ± 3 mV and a slope factor of 3.6 ± 0.5 (n = 6); therefore, the range of potentials in which the T-current modulation occurs is similar to that of the physiological membrane potential of thalamocortical neurons (Steriade et al., 1997) and overlaps with the voltage dependence of the steady-state inactivation (Fig. 6C) (voltage of half-inactivation estimated with 10 sec inactivating prepulses: -81 ± 3 mV; slope factor: 4.2 ± 0.5; n = 12). This finding suggests that the apparent voltage dependence of the modulation is linked to changes in channel conformation according to the membrane potential and that the modification in current amplitude is induced by a regulatory mechanism that differently affects closed and inactivated channels. Two opposite hypotheses can be proposed concerning this mechanism. First, the activity of the T channels could be potentiated when channels are inactivated. Such potentiation, which is slowly removed when the channels close, would result in a maximal current observed after the short hyperpolarization necessary for the channels to recover from inactivation. Second, as a mirrored mechanism, the activity of the T channels could be inhibited when the channels are closed, and this inhibition would be removed after inactivation.
Figure 4.

Voltage sensitivity of the T-type current modulation. The protocol depicted in A was designed to successively compare currents evoked at -50 mV that were conditioned by a 10 sec prepulseat -50 mV (IT2) with the one (IT1) obtained after a 10 sec prepulse of increasing potentials (ΔV) from -100 to -40 mV. Each step depolarization to -50 mV was preceded by a 1 sec hyperpolarization to -100 mV to allow recovery from inactivation. Example of traces obtained with different prepulse potentials are superimposed in A. Note the stability of IT2 but the progressive increase in IT1 amplitude with the increasing prepulse potential and the crisscrossing of the current waveforms caused by the acceleration in the inactivation kinetics. The voltage dependence of the increase in current amplitude was quantified in B by plotting the amplitude ratio IT2/IT1 as a function of the prepulse potential ΔV. Data were fit by a modified Boltzmann equation: a/[1 + exp(-(V -V1/2)/k)]+ b, with V1/2 =-78.4 mV, k = 3.3, a = 0.4, and b = 0.6. Note that the T-current modulation occurs in the voltage range from -90 to -60 mV, which overlaps the voltage range of the steady-state inactivation (Fig. 6).
Figure 6.
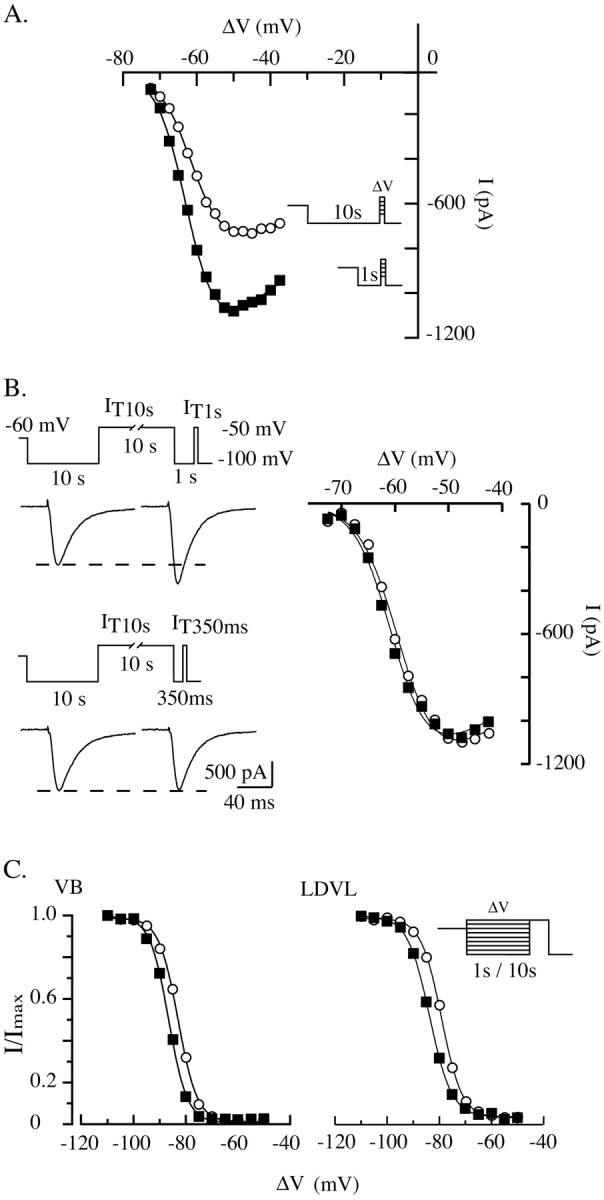
Activation and inactivation voltage dependencies of T-type channels in thalamocortical neurons. A, I-V curves were constructed in the same sensory thalamocortical neurons by successive step depolarizations from -72.5 to -37.5 mV (2.5 mV increments) preceded by either a 10 sec (○) or a 1 sec (▪) hyperpolarizing prepulse to -100 mV (see protocol in inset). The cell was maintained at -60 mV between protocols. Despite the strong increase in current amplitude when 1 sec prepulses are used, the apparent voltage dependence of the channel activation estimated by the two protocols is similar. B, In a neuron displaying a clear decrease in current amplitude after prolonged hyperpolarization (see traces of the currents recorded after 10 and 1 sec hyperpolarizations in the left top graph), prepulse duration was reduced to 350 msec to limit the recovery from inactivation. Note that because of the incomplete recovery from inactivation, the T current evoked at -50 mV after the 350 msec prepulse displays the same amplitude as the current evoked after the prolonged 10 sec prepulse, although the channel activity is facilitated (left bottom graph). Note also that the I-V curves constructed by step depolarizations preceded by 10 sec (○) and 350 msec (•) prepulses are identical, which confirms the absence of effect of the hyperpolarizing prepulse duration on the voltage dependence of the channel activation. C, Inactivation of T channels was induced in a sensory (VB; left graph) and a nonsensory (LDVL; right graph) thalamocortical neuron using either a 10 sec (○) or 1 sec (▪) prepulse of increasing potential (from -110 to -50 mV with 5 mV increments). The resulting channel availability was estimated from the normalized current amplitude measured at -50 mV, and cells were maintained at a holding potential of -60 mV (see protocol in inset). In both the sensory and nonsensory thalamocortical neuron, the apparent voltage dependence of the inactivation was shifted toward more hyperpolarized potentials when 1 sec prepulses were used (see Results for comments). Data were fitted by a Boltzmann equation: 1/[1 + exp(-(V-V1/2)/k)], with V1/2 =-83 mV, k = 3.7 (left graph, ○), -87 mV, 3.6 (left graph, ▪); -79 mV, 3.9 (right graph, ○); -84 mV, 4.2 (right graph, ▪).
Change in inactivation kinetics
The crisscrossing of the T-current waveforms recorded after prepulses of increasing voltages (Fig. 4A) suggests that an increase of the channel inactivation kinetics also occurs during the long depolarizing period that inactivates the channels. Consequently, currents evoked after the short hyperpolarization necessary to recover from inactivation have larger amplitude but reinactivate faster than currents recorded after prolonged hyperpolarization. This acceleration in inactivation kinetics would actually counteract the increase in current amplitude. Normalization and super-imposition of IT10 sec and IT1 sec confirmed that the modification in inactivation kinetics was present in every VB, MGB, and LGN neuron tested (Fig. 5Aa) but was absent in nonsensory neurons from the LDVL and VL nuclei that lack the voltage-dependent modulation of the current amplitude (Fig. 5Ab). Because an increase in current amplitude might induce an apparent modification in its kinetics attributable to imperfect voltage clamp of the cells, currents obtained at -50 mV after 10 sec hyperpolarization were compared with those obtained after the cell was hyperpolarized for only 100 msec. In the latter case, the current is much smaller because a large part of the channel population is still inactivated, but the fewer available channels should nevertheless generate currents with similar kinetics than IT1 sec. As presented in Figure 5B for one of the seven cells tested in this condition, although smaller in amplitude, the current observed clearly presents a faster inactivation kinetics than that generated after a long hyperpolarization. Therefore, one can conclude that both current amplitude and inactivation kinetics depend on the duration of the preceding period that induces channel closure or inactivation. It is interesting to note that in some neurons not only the inactivation but also the activation kinetics were accelerated (data not shown); however, although special care was taken to ensure good electrical cell access and space-clamp qualities (see above), the probable dendritic location of some of the channels (Destexhe et al., 1996; Williams and Stuart, 2000) and the morphology of the neurons preclude any comparison of the fast activation kinetics in situ.
Figure 5.
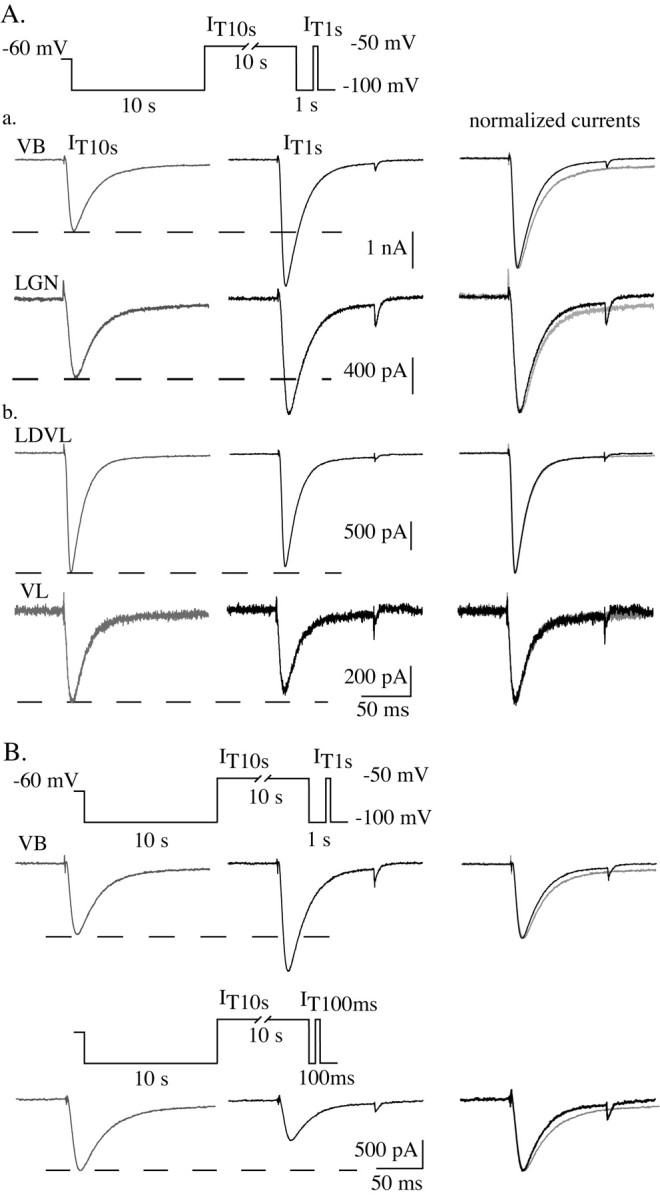
Depolarization-induced increase in inactivation kinetics of T-type channels in sensory thalamocortical neurons. Traces in A illustrate currents recorded using the standard protocol IT1 sec (left gray traces) versus IT10 sec (middle black traces; see Fig. 2 legend and diagram in A) in two sensory thalamocortical neurons (a) from the VB and LGN nuclei, respectively, and two nonsensory thalamocortical neurons (b) from the LDVL and VL nuclei. In each case, current waveforms were normalized and superimposed (right traces). Both the potentiation and acceleration in the inactivation rate of the currents induced by the depolarization are present only in sensory thalamocortical neurons. Top traces in B show currents recorded in a VB neuron using the same protocol as in A. In the same cell, the protocol was modified by reducing the 1 sec hyperpolarizing period to 100 msec. As a consequence, only a small population of the T channels has recovered from inactivation before the step to -50 mV, resulting in a drastic decrease in current amplitude (bottom traces). As demonstrated by the comparison of the superimposed normalized waveforms (right, top and bottom traces), the inactivation kinetics of the evoked T currents is faster after short than long hyper polarizations, in both cases regardless of the current amplitude.
The T-current regulation is not induced by a change in the voltage dependence of channel activation and inactivation
In a few cases of T-channel regulation reported so far in the literature, the modulation of the current amplitude was associated with a shift in the voltage dependence of activation and inactivation (for review, see Perez-Reyes, 2003). Therefore, we studied whether the strong modification in current amplitude reported here could be an indirect consequence of a change in the voltage dependence of the channel activity. The I-V relationships constructed by successive step depolarizations at increasing voltages preceded by either a 10 or 1 sec hyperpolarizing prepulse were compared in five cells. As expected, the I-V curves displayed a clear difference in current amplitude, with larger currents evoked after short hyperpolarizations, resulting from the present regulation; however, no significant shift in the voltage dependence of the channel activation was observed (Fig. 6A), and maximal currents were obtained with step depolarizations around -50 mV in both conditions. To better compare the I-V relationships obtained in both conditions, the duration of the short hyperpolarizing prepulse was decreased so that only part of the channel population could recover from inactivation, generating at -50 mV a maximal current of similar amplitude to the one observed after prolonged hyperpolarization. As illustrated in Figure 6B, this protocol confirms that the voltage dependence of the channel activation is not affected by the duration of the preceding hyperpolarizing period.
We then investigated whether maintaining the cells at a hyperpolarized potential could modify the voltage sensitivity of the channel inactivation. Such modification, in fact, might account for the difference in current amplitude measured in the two conditions if a portion of the channel population enters into an inactivated state during long hyperpolarizations at -100 mV but not during short hyperpolarizations. Although the voltage of half-inactivation estimated by maintaining each neuron for either 10 or 1 sec at increasing potentials was different (-82.7 ± 1.4 and -87.0 ± 1.4 mV, respectively; n = 7) (Fig. 6C), this 4.3 mV shift has no consequence on the regulation described here. Such difference arises because steady-state activity is reached only after 10 sec steps. Indeed, at some voltages the 1 sec prepulse is not long enough to allow a complete recovery from inactivation induced by the -60 mV holding potential preceding the protocol. In line with this explanation, a similar shift was observed in the nonsensory thalamocortical neurons of the LDVL nucleus that do not display the present modulation (Fig. 6C). Therefore, because no inactivation is induced while maintaining the membrane potential at -100 mV for whatever duration, and because the shift toward more hyperpolarized potentials observed with the 1 sec protocol would minimize IT1 sec, we conclude that the regulation of the T-current amplitude observed in sensory thalamocortical neurons cannot be explained by a change in the voltage dependence of the channel activity.
Kinetics of the T-type current regulation
The experiments described so far suggest that a novel mechanism differently regulates the T current according to the channel state. The current amplitude will be larger and the inactivation kinetics faster if the channels have been inactivated previously rather than closed. We therefore further characterized the kinetics of this phenomenon by studying the relationships between the depolarizing-hyperpolarizing prepulse duration and the change in current amplitude. Because these kinetics should be crucial in estimating the physiological impact of the T-channel regulation on sensory thalamocortical neuron activity, the experiments were performed at two bath temperatures, 25° and 32°C. Similar to what had been observed at 25°C, a 1.33 ± 0.13-fold (n = 16) increase in amplitude for currents recorded after 1 sec compared with 10 sec hyperpolarization was estimated at 32°C. It is worth noting that because of the acceleration in regulation and channel kinetics observed after the rise in temperature (Coulter et al., 1989), the amplitude of the current at 32°C is not maximal after a 1 sec hyperpolarization, and consequently the ratio between IT1 sec and IT10 sec underestimates the prepulse effect on the current amplitude at this temperature and cannot be compared directly with the value measured at 25°C. The relationship between the current amplitude and the duration of a preceding inactivating period has an exponential shape (Fig. 7). As expected, the 7°C increase in temperature accelerates the onset kinetics of the potentiation of the current amplitude with time constants of 579 ± 143 msec (n = 11) and 384 ± 143 msec (n = 6) at 25° and 32°C, respectively (Fig. 7A). Similarly, the current amplitude exponentially decreases according to the hyperpolarizing prepulse duration but with a 10-fold slower kinetics than the onset of the current potentiation and with an apparent higher sensitivity to temperature (time constants: 4.9 ± 1.1 sec, n = 12, and 2.6 ± 0.8 sec, n = 6, at 25° and 32°C, respectively) (Fig. 7B).
Figure 7.

Kinetics of the T-type current amplitude regulation as a function of the prepulse duration. A, Currents evoked at -50 mV (IT1) after a 10 sec hyperpolarizing prepulse to -100 mV were successively compared with those (IT2) obtained after a depolarizing prepulse to -50 mV of increasing duration (Δt; range, 100 msec to 10 sec). In the latter case, a 1 sec hyperpolarization to -100 mV was applied before step depolarization to -50 mV to remove channel inactivation (see protocol in inset). The amplitude ratio IT2/IT1 is presented for two typical neurons recorded either at 25° (left graph) or 32°C (right graph). In both cases, the current is slowly potentiated by depolarizing prepulses of increasing duration, yielding a maximal current for depolarizations >2 sec. Note the fastest kinetics observed at 32°C. Data were fit by a monoexponential function with a time constant of 535 msec (left graph) and 348 msec (right graph). B, Currents evoked at -50 mV (IT2) after a hyperpolarizing prepulse to -100 mV of increasing duration (Δt; range, 1-30 sec) were successively compared with those (IT1) obtained after a 10 sec depolarizing prepulse to -50 mV (see protocol in inset). Plots of the amplitude ratio IT2/IT1 as a function of the hyperpolarization duration are presented for two typical neurons recorded either at 25° (left graph) and 32°C (right graph). The minimal current amplitude is reached with hyperpolarizations >20 sec at 25°C. Note also the slow decrease in current amplitude observed in both cases and the marked acceleration of the kinetics with increasing temperature (time constant of the monoexponential fit: 5.6 and 2.6 sec at 25° and 32°C, respectively).
Phosphorylation is necessary to induce the voltage-dependent potentiation of the T-type current
We then investigated the mechanism responsible for the voltage-dependent modulation of the low-voltage-activated Ca2+ current. In our standard recording conditions, the extracellular block of K+ channels induces neuronal depolarization and thus enhances neurotransmitter release. Thus, we first investigated the possible involvement of metabotropic receptors in the voltage-dependent T-current modulation. A series of experiments were performed with antagonists of the neurotransmitters known to be present in our preparation. No modification in the ratio of IT10 sec to IT1 sec was observed after perfusion of the slices with the broad spectrum antagonist of glutamate metabotropic receptors ACPT II (400 μm), the GABA-B receptor antagonist CGP55845 (500 nm), or the muscarinic acetylcholinergic receptor antagonist atropine (10 μm) (data not shown). In addition, by using intracellular solution designed to block K+ channels (see Materials and Methods), we confirmed that the perfusion of extracellular K+ channels blockers, and its accompanying increase in neurotransmitter release, did not affect the occurrence and degree of T-current potentiation (data not shown). Finally, the involvement of a G-protein-dependent transduction mechanism was studied using GTP analogs. Comparisons between IT10 sec and IT1 sec were performed while the cells were dialyzed with a solution containing either GTPγS (100 μm) or GDPβS (2 mm). As illustrated in Figure 8A, during dialysis with GTPγS, the activity of the T channels and the prepulse effect remained stable for ∼1 hr of recordings. Similar results were obtained with GDPβS (data not shown). Therefore, G-protein-coupled receptors are unlikely to be involved in the mechanism of the present channel activity modulation.
Figure 8.

T-type current regulation is G-protein and Ca2+ independent. Comparisons between current amplitudes obtained at -50 mV conditioned by a 10 sec prepulse to either -100 or -50 mV were obtained using the standard protocol IT1 sec versus IT10 sec (Fig. 2 legend and diagram in A). The graphs in A show the time evolution of IT10 sec (right top graph, ○) and IT1 sec (right top graph. ▪) amplitudes and the amplitude ratio IT1 sec/IT10 sec (bottom right graph) in a neuron dialyzed with 100 μm GTPγS. Traces in the left panel are examples of IT10 sec (left traces) and IT1 sec (right traces) currents recorded at two different times (indicated by a and b in the right top graph) during the experiment. Note the stability of the current amplitudes. B shows the results of a similar experiment performed in a neuron transiently perfused with an extracellular solution in which Ca2+ was replaced by Ba2+. Note the parallel and reversible decrease in amplitude of IT10 sec (top plot, ○) and IT1 sec (top plot, ▪) during perfusion with the Ba2+ solution but the stability of IT1 sec/IT10 sec (bottom plot, ▴) during the experiment.
We then investigated the involvement of Ca2+-dependent mechanisms by replacing Ca2+ with Ba2+ in the extracellular solution. The T currents showed a marked and reversible decrease in amplitude after perfusion of the neuron with the Ba2+-containing solution, as expected from the shift in voltage dependence of the channel activation induced by the cationic exchange and the reduced permeability to Ba2+ of the Cav3.1 channels (Serrano et al., 2000); however, the ratios between IT1 sec and IT10 sec amplitudes were similar in both conditions (Fig. 8B).
The involvement of a phosphorylation step in the control of the T-current amplitude was next investigated by removing ATP from the intracellular solution. When neurons were dialyzed with an ATP-free solution, the T current presented a clear rundown, with both a decrease in current amplitude and a shift in the inactivation voltage dependence toward more hyperpolarized potentials (Fig. 9Aa,Ab). Such modifications of channel activity are typical of the Cav3.1 isotype and also observed in recombinant channels expressed in human embryonic kidney 293 cells (our unpublished data). Because the voltage dependence of the steady-state inactivation became more hyperpolarized during dialysis, stronger progressive hyperpolarizations were used to fully remove channel inactivation and induce closed states. Interestingly, the difference in amplitude between currents evoked after short or long hyperpolarizations quickly disappeared after dialysis with ATP-free solution, suggesting the loss of a necessary phosphorylation step (Fig. 9A). As illustrated by the representative examples, although both IT10 sec and IT1 sec amplitudes decreased during dialysis, currents obtained after short hyperpolarizations clearly display a stronger reduction in amplitude (mean decrease per minute = 0.9 ± 0.8% for IT10 sec and 1.5 ± 0.7% for IT1 sec; n = 7; paired Student's t test; p ≤ 0.01). Similar results were obtained when the nonhydrolyzable ATP analog, AMP-PNP, known to inhibit ATP-dependent enzymes, was used in place of ATP in the internal solution (n = 6) (Fig. 9Ba,Bb). Therefore, we conclude that a phosphorylation mechanism takes place at depolarized potentials, when channels are inactivated. Such phosphorylation induces a potentiation of the channel activity, resulting in a larger current evoked after the short hyperpolarization necessary to deinactivate the channel population.
Figure 9.
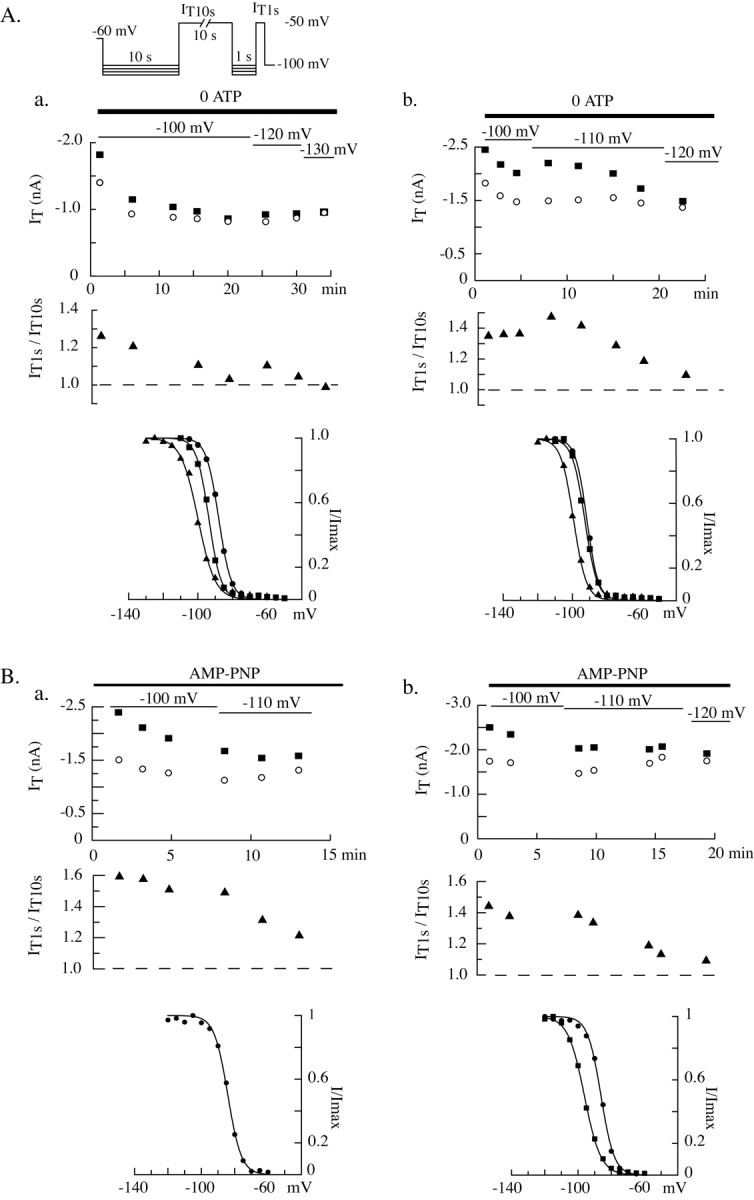
ATP is required for the T-type current regulation. Using the same protocol as in Figure 8, the phosphorylation requirements were investigated. IT10 sec (left graph, open circle) and IT1 sec (left graph, filled square) and the ratio IT1 sec/IT10 sec (left graph, ▴) were measured during dialysis of the intracellular medium with either an ATP-free solution (Aa, Ab) or a solution containing 4 mm AMP-PNP (Ba, Bb). To avoid possible artifacts induced by a shift in the voltage dependence of the steady-state inactivation after dialysis with these solutions, more negative voltages were progressively used during the hyperpolarizing prepulses (values indicated in the top graphs). Bottom graphs present the inactivation-voltage relationships measured with 1 sec prepulses (see protocol details in Fig. 6) at different times during the experiment (cell Aa: circles 3 min, squares 20 min, triangles 33 min; cell Ab: circles 6 min, squares 13 min, triangles 23 min; cell Ba: circles 13 min; cell Bb: circles 5 min, squares 17 min). Note the rundown of the current amplitude and the shift in inactivation toward more hyperpolarized potential. The progressively stronger decrease in IT1 sec than in IT10 sec amplitude results in a superimposition of the two current amplitudes toward the end of the experiment and is indicative of the loss of the T-current regulation.
This conclusion was corroborated by the effect of the ATP analog, ATPγS. ATPγS is regarded as a relatively good substrate for protein kinases as opposed to ATPases, yielding thiophosphorylated proteins that are resistant to phosphatases. When neurons were dialyzed with this compound, the difference between IT10 sec and IT1 sec disappeared (n = 11) (Fig. 10a,b); however, in contrast to what occurred in the ATP-free solution, the suppression of the voltage-dependent T regulation is attributable to a progressive increase in the current amplitude obtained after long hyperpolarizations (IT10 sec). In some cases, a slight increase in IT1 sec amplitude could also be observed, a finding that agrees with a cumulative phosphorylation occurring when the whole channel population is incompletely phosphorylated at each protocol (Fig. 10b). These results suggest that a phosphorylation mechanism potentiates the T current when channels are inactivated, and the potentiation is suppressed by a dephosphorylation mechanism when the channels remain in a closed state. In the case of ATPγS, the progressive thiophosphorylation of the proteins, which becomes resistant to protein phosphatase, induces an irreversible potentiation of the current.
Figure 10.

The T-type current potentiation depends on protein phosphorylation occurring when channels are inactivated. Protocols are similar to those in Figure 9. Graphs illustrate typical data obtained in two neurons (a, b) during dialysis with an intracellular solution containing 4 mm ATPγS. Note the progressive increase in current amplitude that is markedly stronger for IT10 sec than IT1 sec, and the identity of the two current amplitudes (see Results for comments). The last inactivation protocols (right graphs) were performed 51 and 55 min after patch rupture in neurons a and b, respectively. The shift of the inactivation curve toward hyperpolarized potentials is smaller and occurs later than when recording with an ATP-free solution.
In an attempt to further characterize the phosphorylation-dephosphorylation pathways involved in the T-current potentiation, the effects of classical kinase and phosphatase antagonists on the current amplitude were studied. Neither perfusion nor dialysis of VB neurons with the broad spectrum protein kinase antagonists staurosporine (200 nm) and H-9 (250 μm), the tyrosine kinase antagonists genistein (100 μm), K252A (200 nm), AG213 (90 μm), and PP2 (10 μm), or the phosphatase inhibitors okadaic acid (25 μm) and sodium orthovanadate (1 mm) affected the difference between IT1 sec and IT10 sec. This difference was also unaffected by dialysis of the neurons with intracellular solution containing an alkaline phosphatase (up to 100 U/ml).
Discussion
Our data show that a nonclassical enzymatic mechanism phosphorylates T-type Ca2+ channels according to the channel conformation. This phosphorylation occurs when the channels are inactivated and induces a potentiation of the T current and an acceleration of its inactivation kinetics. The potentiation is suppressed progressively when the channels move out of the inactivated state and enter a closed state. Consequently, two mechanisms with opposing effects on the current amplitude occur after hyperpolarization: channel deinactivation and dephosphorylation. Because the dephosphorylation is much slower than the recovery from inactivation, there exists an optimal duration for a transient hyperpolarization to enable the generation of a maximal T current. This novel regulation is not present in every relay nuclei of the thalamus and is a major feature of low-voltage-activated Ca2+ channels in sensory thalamocortical neurons. In these neurons, therefore, because only a small number of channels have to recover from inactivation to generate a large “potentiated” current, the occurrence of a T current from relatively depolarized potential (around -60 mV) will be greatly facilitated.
T-type current specificity of the regulation
The voltage-dependent potentiation of the current described here is caused by an enhanced T-type Ca2+ channel activity and not the recruitment of a different class of channels. Indeed, the voltage sensitivity of the activation of the recorded currents is independent of the presence of the current potentiation, suggesting that the same channels are activated in both cases. In addition, when Ca2+ ions are replaced by Ba2+ as charge carrier, the ratio between the amplitudes of the currents evoked after short or prolonged hyperpolarizations remains constant. Because the amplitude of both currents is much reduced, any contaminating conductance recruited after the short hyperpolarization should present the same divalent cation sensitivity as the T channels. Finally, the identity of the voltage dependence of the inactivation and potentiation of the current strongly suggests that the regulatory mechanism depends on the state of the T channels.
Facilitation of high-voltage-activated Ca2+ channels
Facilitation of Ca2+ currents by strong depolarizations has been studied extensively for the high-voltage-activated channels. First described in adrenal chromaffin cells (Fenwick et al., 1982), it was then reported in a number of preparations (for review, see Dolphin, 1996). Different mechanisms are involved according to the type of channel and cell studied. Strong depolarizations can relieve a block by G-proteins of the activity of non-L channels (Bean, 1989; Hille, 1994; Zamponi and Snutch, 1998), and facilitation has been reported to result from protein kinase-mediated phosphorylation (Artalejo et al., 1992) or modification of gating mode (Pietrobon and Hess, 1990) for L channels. In isolated VB neurons, a voltage-dependent potentiation of the L current has been described (Kammermeier and Jones, 1998) that is not caused by an increase in the amplitude of the current evoked after depolarization but by a dramatic slowing of channel closing after repolarization. This facilitation requires depolarizations stronger than 0 mV, develops rather slowly, and lasts only for a few milliseconds. Therefore, this L-current facilitation differs markedly from the potentiation of the T current that we describe here in the same neuronal type.
Mechanism of T-type current potentiation
In contrast to these studies on high-voltage-activated Ca2+ channels, facilitation of the low-voltage-activated T-type current has been reported in only four non-neuronal preparations. In cultured rat bone marrow cells, a nearly twofold increase in T-current amplitude can be induced by depolarizing prepulses (Publicover et al., 1995). The kinetics of this regulation is similar to that in thalamocortical neurons reported here, but the potentiation requires a strong depolarizing prepulse (more than -30 mV) and is not modified by the omission of ATP. In isolated bullfrog atrial cells, strong depolarizations (>0 mV) relieve a Gi-protein-mediated inhibition of T-channel activity (Alvarez et al., 1996, 2000), inducing a short-duration facilitation. Similarly, depolarizations larger than -30 mV can relieve a tonic current inhibition mediated by tyrosine kinases in mouse spermatogenic cells (Arnoult et al., 1998). This enhanced current amplitude can be observed for seconds, and only short prepulses are necessary (>5 msec; maximal effect: 100 msec). So far, facilitation of the T current by voltage prepulses that are within the voltage range of physiological resting membrane potentials has been reported only in isolated myocytes from guinea pig coronary artery (Ganitkevich and Isenberg, 1991). These authors described a potentiation of the T current that is accompanied by an increase in its inactivation kinetics, similar to our results. Using 10 sec prepulses, this facilitation followed the voltage dependence of the steady-state inactivation of the Ca2+ channels. In contrast with our observation, however, no clear time lag seemed to exist between channel inactivation and the induction of the potentiation. Prepulses as short as 20 msec were sufficient to induce an increase in current amplitude, and saturating effects were obtained with 100 msec depolarizations. In addition, facilitation of the T current in myocytes was resistant to the omission of ATP. Therefore, Ganitkevich and Isenberg (1991) suggested that, when recovering from inactivation, the channels enter a closed state displaying an especially short first latency to opening.
Our results suggest that a different mechanism is in operation during neuronal T-current potentiation. Indeed, although the potentiation of the channel activity seems clearly linked to their previous inactivation, the on and off kinetics of the current facilitation display 10-fold slower time constants than the channel inactivation and its recovery. These kinetics, together with the requirement of ATP and the permanent potentiation of the channels observed in the presence of ATPγS, favor the hypothesis of a phosphorylation mechanism; however, the intracellular pathway does not depend on G-protein activation or on the presence of Ca2+ and is not affected by broad spectrum kinase or phosphatase inhibitors. The phosphorylation may occur either directly on a channel motif accessible in the inactivated state or on an unknown intermediary protein, the binding of which will depend on the channel conformation. As a consequence, the channel open probability may be enhanced or a pool of channels inhibited previously may be recruited. Whatever the mechanism responsible for this effect, the T-current potentiation is tonically activated in our recording condition and can last for hours, provided that ATP is available.
Because most if not all T channels expressed in thalamocortical neurons are of the Cav3.1 isotype (Talley et al., 1999), our data represent the first example of regulation of the activity of native Cav3.1 channels. It is noteworthy that the lack of a biphasic recovery from inactivation of recombinant Cav3.1 channels studied so far (for review, see Perez-Reyes, 2003; Hering et al. 2004) suggests that the decrease in current amplitude after prolonged hyperpolarization is not an intrinsic property of the channel. In addition, because the present facilitation was observed only in sensory thalamocortical neurons, T-current properties cannot be considered homogenous across the different cortically projecting nuclei. Whether this heterogeneity is the consequence of distinct regulatory pathways or related to nucleus-specific expression of different Cav3.1 splice variants (Monteil et al., 2000) in the thalamus, or both, remains to be established.
Physiological implications
The potentiation described here is in contrast to the classical view that T-type Ca2+ currents of maximal amplitude are evoked after prolonged hyperpolarizations. Indeed, when neurons are hyperpolarized, T channels recover from inactivation, which tends to increase the amplitude of the evoked current, but the slower dephosphorylation process progressively suppresses the potentiation, thus reducing the current amplitude. The kinetics of these two mechanisms, therefore, precisely determine the optimal duration (0.7-1.5 sec) of the transient hyperpolarization required to generate a maximal T current.
The physiological roles of thalamic low-voltage-activated Ca2+ currents have been related mainly to the high-frequency bursting activity that characterizes sleep spindles and δ waves (Steriade et al., 1993). The slow (<1 Hz) sleep oscillation (Hughes et al., 2002) organizes these spindles or δ waves into coherent repeating periods separated by periods of prolonged (5-10 sec) depolarization when, according to the present results, T channels should be phosphorylated. Whether the resulting T-current potentiation contributes significantly to the generation of the low-threshold Ca2+ potentials during each cycle of spindles or δ waves and whether the current potentiation is maintained through the whole episode remain to be determined. Another important contribution of the present regulation of the T current may be in the generation of bursts in sensory thalamic neurons during wakefulness in response to novel stimuli (Ramcharan et al., 2000; Fanselow et al., 2001; Swadlow and Gusev, 2001; Weyand et al., 2001). The paradoxical potentiation of the T current that occurs after periods at depolarized potentials could allow hyperpolarizations of relatively small amplitude and duration to be sufficient to evoke rebound burst of action potentials even at the relatively depolarized membrane potential associated with this state of vigilance.
Footnotes
This work was supported by a grant from the Ministère de la Recherche: Action Concertée Incitative Neurosciences Intégratives et Computationnelles.
Correspondence should be addressed to Dr. Régis C. Lambert, Neurobiologie des Processus Adaptatifs, Unité Mixte de Recherche 7102 Centre National de la Recherche Scientifique, Universite Paris 6, 9, Quai St. Bernard, 75252 Paris Cedex 05, France. E-mail: regis.Lambert@snv.jussieu.fr.
Copyright © 2004 Society for Neuroscience 0270-6474/04/245592-11$15.00/0
References
- Alvarez JL, Rubio LS, Vassort G (1996) Facilitation of T-type calcium current in bullfrog atrial cells: voltage-dependent relief of a G protein inhibitory tone. J Physiol (Lond) 491: 321-334. [DOI] [PMC free article] [PubMed] [Google Scholar]
- Alvarez JL, Artiles A, Talavera K, Vassort G (2000) Modulation of voltage-dependent facilitation of the T-type calcium current by sodium ion in isolated frog atrial cells. Pflügers Arch 441: 39-48. [DOI] [PubMed] [Google Scholar]
- Arnoult C, Villaz M, Florman HM (1998) Pharmacological properties of the T-type Ca2+ current of mouse spermatogenic cells. Mol Pharmacol 53: 1104-1111. [PubMed] [Google Scholar]
- Artalejo CR, Rossie S, Perlman RL, Fox AP (1992) Voltage-dependent phosphorylation may recruit Ca2+ current facilitation in chromaffin cells. Nature 358: 63-66. [DOI] [PubMed] [Google Scholar]
- Bean BP (1989) Neurotransmitter inhibition of neuronal calcium currents by changes in channel voltage dependence. Nature 340: 153-156. [DOI] [PubMed] [Google Scholar]
- Chemin J, Monteil A, Perez-Reyes E, Nargeot J, Lory P (2001) Direct inhibition of T-type calcium channels by the endogenous cannabinoid anandamide. EMBO J 20: 7033-7040. [DOI] [PMC free article] [PubMed] [Google Scholar]
- Coulter DA, Huguenard JR, Prince DA (1989) Calcium currents in rat thalamocortical relay neurones: kinetic properties of the transient, low-threshold current. J Physiol (Lond) 414: 587-604. [DOI] [PMC free article] [PubMed] [Google Scholar]
- Cribbs LL, Lee JH, Yang J, Satin J, Zhang Y, Daud A, Barclay J, Williamson MP, Fox M, Rees M, Perez-Reyes E (1998) Cloning and characterization of alpha1H from human heart, a member of the T-type Ca2+ channel gene family. Circ Res 83: 103-109. [DOI] [PubMed] [Google Scholar]
- Crunelli V, Kelly JS, Leresche N, Pirchio M (1987) The ventral and dorsal lateral geniculate nucleus of the rat: intracellular recordings in vitro. J Physiol (Lond) 384: 587-601. [DOI] [PMC free article] [PubMed] [Google Scholar]
- Crunelli V, Lightowler S, Pollard CE (1989) A T-type Ca2+ current underlies low-threshold Ca2+ potentials in cells of the cat and rat lateral geniculate nucleus. J Physiol (Lond) 413: 543-561. [DOI] [PMC free article] [PubMed] [Google Scholar]
- Deschenes M, Paradis M, Roy JP, Steriade M (1984) Electrophysiology of neurons of lateral thalamic nuclei in cat: resting properties and burst discharges. J Neurophysiol 51: 1196-1219. [DOI] [PubMed] [Google Scholar]
- Destexhe A, Contreras D, Steriade M, Sejnowski TJ, Huguenard JR (1996) In vivo, in vitro, and computational analysis of dendritic calcium currents in thalamic reticular neurons. J Neurosci 16: 169-185. [DOI] [PMC free article] [PubMed] [Google Scholar]
- Dolphin AC (1996) Facilitation of Ca2+ current in excitable cells. Trends Neurosci 19: 35-43. [DOI] [PubMed] [Google Scholar]
- Fanselow EE, Sameshima K, Baccala LA, Nicolelis MA (2001) Thalamic bursting in rats during different awake behavioral states. Proc Natl Acad Sci USA 98: 15330-15335. [DOI] [PMC free article] [PubMed] [Google Scholar]
- Fearon IM, Randall AD, Perez-Reyes E, Peers C (2000) Modulation of recombinant T-type Ca2+ channels by hypoxia and glutathione. Pflügers Arch 441: 181-188. [DOI] [PubMed] [Google Scholar]
- Fenwick EM, Marty A, Neher E (1982) Sodium and calcium channels in bovine chromaffin cells. J Physiol (Lond) 331: 599-635. [DOI] [PMC free article] [PubMed] [Google Scholar]
- Ganitkevich V, Isenberg G (1991) Stimulation-induced potentiation of T-type Ca2+ channel currents in myocytes from guinea-pig coronary artery. J Physiol (Lond) 443: 703-725. [DOI] [PMC free article] [PubMed] [Google Scholar]
- Greene RW, Haas HL, McCarley RW (1986) A low threshold calcium spike mediates firing pattern alterations in pontine reticular neurons. Science 234: 738-740. [DOI] [PubMed] [Google Scholar]
- Hering J, Feltz A, Lambert RC (2004) Slow inactivation of the Ca(V)3.1 isotype of T-type calcium channels. J Physiol (Lond) 555: 331-344. [DOI] [PMC free article] [PubMed] [Google Scholar]
- Hille B (1994) Modulation of ion-channel function by G-protein-coupled receptors. Trends Neurosci 17: 531-536. [DOI] [PubMed] [Google Scholar]
- Hughes SW, Cope DW, Blethyn KL, Crunelli V (2002) Cellular mechanisms of the slow (1 Hz) oscillation in thalamocortical neurons in vitro. Neuron 33: 947-958. [DOI] [PubMed] [Google Scholar]
- Huguenard JR (1996) Low-threshold calcium currents in central nervous system neurons. Annu Rev Physiol 58: 329-348. [DOI] [PubMed] [Google Scholar]
- Huguenard JR, Prince DA (1992) A novel T-type current underlies prolonged Ca(2+)-dependent burst firing in GABAergic neurons of rat thalamic reticular nucleus. J Neurosci 12: 3804-3817. [DOI] [PMC free article] [PubMed] [Google Scholar]
- Jahnsen H, Llinas R (1984) Electrophysiological properties of guinea-pig thalamic neurones: an in vitro study. J Physiol (Lond) 349: 205-226. [DOI] [PMC free article] [PubMed] [Google Scholar]
- Kammermeier PJ, Jones SW (1998) Facilitation of L-type calcium current in thalamic neurons. J Neurophysiol 79: 410-417. [DOI] [PubMed] [Google Scholar]
- Lee JH, Daud AN, Cribbs LL, Lacerda AE, Pereverzev A, Klockner U, Schneider T, Perez-Reyes E (1999) Cloning and expression of a novel member of the low voltage-activated T-type calcium channel family. J Neurosci 19: 1912-1921. [DOI] [PMC free article] [PubMed] [Google Scholar]
- Llinas R, Muhlethaler M (1988) Electrophysiology of guinea-pig cerebellar nuclear cells in the in vitro brain stem-cerebellar preparation. J Physiol (Lond) 404: 241-258. [DOI] [PMC free article] [PubMed] [Google Scholar]
- Llinas R, Yarom Y (1981) Electrophysiology of mammalian inferior olivary neurones in vitro. Different types of voltage-dependent ionic conductances. J Physiol (Lond) 315: 549-567. [DOI] [PMC free article] [PubMed] [Google Scholar]
- Monteil A, Chemin J, Bourinet E, Mennessier G, Lory P, Nargeot J (2000) Molecular and functional properties of the human alpha(1G) subunit that forms T-type calcium channels. J Biol Chem 275: 6090-6100. [DOI] [PubMed] [Google Scholar]
- Paxinos G, Watson C (1986) The rat brain. New York: Academic.
- Perez-Reyes E (2003) Molecular physiology of low-voltage-activated T-type calcium channels. Physiol Rev 83: 117-161. [DOI] [PubMed] [Google Scholar]
- Perez-Reyes E, Cribbs LL, Daud A, Lacerda AE, Barclay J, Williamson MP, Fox M, Rees M, Lee JH (1998) Molecular characterization of a neuronal low-voltage-activated T-type calcium channel. Nature 391: 896-900. [DOI] [PubMed] [Google Scholar]
- Pietrobon D, Hess P (1990) Novel mechanism of voltage-dependent gating in L-type calcium channels. Nature 346: 651-655. [DOI] [PubMed] [Google Scholar]
- Publicover SJ, Preston MR, El Haj AJ (1995) Voltage-dependent potentiation of low-voltage-activated Ca2+ channel currents in cultured rat bone marrow cells. J Physiol (Lond) 489: 649-661. [DOI] [PMC free article] [PubMed] [Google Scholar]
- Ramcharan EJ, Gnadt JW, Sherman SM (2000) Burst and tonic firing in thalamic cells of unanesthetized, behaving monkeys. Vis Neurosci 17: 55-62. [DOI] [PubMed] [Google Scholar]
- Serrano JR, Dashti SR, Perez-Reyes E, Jones SW (2000) Mg(2+) block unmasks Ca(2+)/Ba(2+) selectivity of alpha1G T-type calcium channels. Biophys J 79: 3052-3062. [DOI] [PMC free article] [PubMed] [Google Scholar]
- Steriade M, McCormick DA, Sejnowski TJ (1993) Thalamocortical oscillations in the sleeping and aroused brain. Science 262: 679-685. [DOI] [PubMed] [Google Scholar]
- Steriade M, Jones EG, McCormick DA (1997) Thalamus. Oxford: Elsevier.
- Suzuki S, Rogawski MA (1989) T-type calcium channels mediate the transition between tonic and phasic firing in thalamic neurons. Proc Natl Acad Sci USA 86: 7228-7232. [DOI] [PMC free article] [PubMed] [Google Scholar]
- Swadlow HA, Gusev AG (2001) The impact of “bursting” thalamic impulses at a neocortical synapse. Nat Neurosci 4: 402-408. [DOI] [PubMed] [Google Scholar]
- Talley EM, Cribbs LL, Lee JH, Daud A, Perez-Reyes E, Bayliss DA (1999) Differential distribution of three members of a gene family encoding low voltage-activated (T-type) calcium channels. J Neurosci 19: 1895-1911. [DOI] [PMC free article] [PubMed] [Google Scholar]
- Todorovic SM, Jevtovic-Todorovic V, Meyenburg A, Mennerick S, Perez-Reyes E, Romano C, Olney JW, Zorumski CF (2001) Redox modulation of T-type calcium channels in rat peripheral nociceptors. Neuron 31: 75-85. [DOI] [PubMed] [Google Scholar]
- Tsakiridou E, Bertollini L, de Curtis M, Avanzini G, Pape HC (1995) Selective increase in T-type calcium conductance of reticular thalamic neurons in a rat model of absence epilepsy. J Neurosci 15: 3110-3117. [DOI] [PMC free article] [PubMed] [Google Scholar]
- Welsby PJ, Wang H, Wolfe JT, Colbran RJ, Johnson ML, Barrett PQ (2003) A mechanism for the direct regulation of T-type calcium channels by Ca2+/calmodulin-dependent kinase II. J Neurosci 23: 10116-10121. [DOI] [PMC free article] [PubMed] [Google Scholar]
- Weyand TG, Boudreaux M, Guido W (2001) Burst and tonic response modes in thalamic neurons during sleep and wakefulness. J Neurophysiol 85: 1107-1118. [DOI] [PubMed] [Google Scholar]
- Williams SR, Stuart GJ (2000) Action potential backpropagation and somatodendritic distribution of ion channels in thalamocortical neurons. J Neurosci 20: 1307-1317. [DOI] [PMC free article] [PubMed] [Google Scholar]
- Wolfe JT, Wang H, Perez-Reyes E, Barrett PQ (2002) Stimulation of recombinant Ca(v)3.2, T-type, Ca(2+) channel currents by CaMKIIgamma(C). J Physiol (Lond) 538: 343-355. [DOI] [PMC free article] [PubMed] [Google Scholar]
- Wolfe JT, Wang H, Howard J, Garrison JC, Barrett PQ (2003) T-type calcium channel regulation by specific G-protein betagamma subunits. Nature 424: 209-213. [DOI] [PubMed] [Google Scholar]
- Zamponi GW, Snutch TP (1998) Modulation of voltage-dependent calcium channels by G proteins. Curr Opin Neurobiol 8: 351-356. [DOI] [PubMed] [Google Scholar]
- Zhang Y, Cribbs LL, Satin J (2000) Arachidonic acid modulation of alpha1H, a cloned human T-type calcium channel. Am J Physiol Heart Circ Physiol 278: H184-193. [DOI] [PubMed] [Google Scholar]